Embed Size (px)
Citation preview
Identifying sub-optimal responses to ivermectinin the treatment of River BlindnessThomas S. Churchera,1, Sebastien D. S. Pionb, Mike Y. Osei-Atweneboanac,d, Roger K. Prichardc, Kwablah Awadzie,Michel Boussinesqb, Richard C. Collinsf, James A. Whitworthg, and María-Gloria Basaneza
aDepartment of Infectious Disease Epidemiology, Imperial College London, Norfolk Place, London W2 1PG, United Kingdom; bUnité Mixte de Recherche145, Institut de Recherche pour le Developpement and University of Montpellier 1, Montpellier, France; cInstitute of Parasitology, McGill University,Sainte-Anne-de-Bellevue, Quebec H9X 3V9, Canada; dCouncil for Scientific and Industrial Research, P.O. Box M32, Accra, Ghana; eOnchocerciasisChemotherapy Research Centre, Hohoe Hospital, P.O. Box 144, Hohoe, Ghana; fP.O. Box 715, Sonoita, AZ 85637; and gThe Wellcome Trust,183-193 Euston Road, London NW1 2BE, United Kingdom
Edited by David Cox, University of Oxford, Oxford, United Kingdom, and approved August 7, 2009 (received for review June 4, 2009)
Identification of drug resistance before it becomes a public healthconcern requires a clear distinction between what constitutes anormal and a suboptimal treatment response. A novel method ofanalyzing drug efficacy studies in human helminthiases is pro-posed and used to investigate recent claims of atypical responsesto ivermectin in the treatment of River Blindness. The variability inthe rate at which Onchocerca volvulus microfilariae repopulatehost’s skin following ivermectin treatment is quantified using anindividual-based onchocerciasis mathematical model. The modelestimates a single skin repopulation rate for every host sampled,allowing reports of suboptimal responses to be statistically com-pared with responses from populations with no prior exposure toivermectin. Statistically faster rates of skin repopulation wereobserved in 3 Ghanaian villages (treated 12–17 times), despite thewide variability in repopulation rates observed in ivermectin-naïvepopulations. Another village previously thought to have high ratesof skin repopulation was shown to be indistinguishable from thenormal treatment response. The model is used to generate testablehypotheses to identify whether atypical rates of skin repopulationby microfilariae could result from low treatment coverage alone orprovide evidence of decreased ivermectin efficacy. Further worklinking phenotypic poor responses to treatment with parasitemolecular genetics markers will be required to confirm drugresistance. Limitations of the skin-snipping method for estimatingparasite load indicates that changes in the distribution of micro-filarial repopulation rates, rather than their absolute values, maybea more sensitive indicator of emerging ivermectin resistance.
drug resistance � helminth parasites � Onchocerca volvulus � overdispersion
The recent dramatic increase in the use of mass drug admin-istration for the control of helminth infections in humans has
raised the possibility that anthelmintic drug resistance mayimpede the success of such control programs. Anthelminticresistance is already a major problem in veterinary parasiticnematodes (1), and suboptimal responses to treatment have beenreported in a number of human helminthiases (2–8).
Current methods of detecting such suboptimal responses totreatment are, however, relatively crude, particularly for thosehuman infections which cannot be passaged in the laboratory orlack animal models. Adult parasites are often inaccessible withinthe body so drug efficacy studies rely on sampling transmissionstages as a proxy for measuring parasite intensity, and as hostimmune responses may be involved in the drug’s mode of action,in vitro assays are seldom useful (9). The fecal egg countreduction test is the standard method for measuring drugefficacy in intestinal helminths, yet it is estimated that thistechnique may only detect a suboptimal response when greaterthan 25% of the parasite population carries the resistance-conferring gene (10).
In this paper, we propose a novel technique for analyzingphenotypic studies that seek to investigate the occurrence ofsuboptimal anthelmintic responses. We focus on the filarial
nematodes and in particular on the causal agent of RiverBlindness, Onchocerca volvulus, for which ivermectin is atpresent the only drug that can be feasibly used for masstreatment of human populations (11). The method proposed canbe adapted to the study of treatment responses at an individualhost level in other parasitic helminths of medical and veterinaryimportance.
Although at the standard dose ivermectin has a limitedadulticidal efficacy against O. volvulus, it is a highly effectivemicrofilaricide, killing the stages transmitted to the black flyvectors and temporarily preventing repopulation of the host’sskin by microfilariae through an effect on female worm fertility(12). This latter effect may (13) or may not (14) be cumulativewith each subsequent treatment. Recently, faster than expectedskin repopulation rates have been reported in villages treated forprolonged periods, particularly in Ghana (4, 5, 8), raisingcontroversy as to whether these observations are indicative ofemerging resistance to ivermectin’s effect on the release of micro-filariae by the adult female worm (embryostatic effect) or due toother causes (15–17).
Typically, studies investigating drug efficacy compare percentchanges in mean infection intensity at various time points aftertreatment in relation to the precontrol baseline in groupssampled from treatment-naïve and repeatedly treated popula-tions (12). This approach is subject to several pitfalls that obscureinterpretation, some of which have been illustrated using asimple mathematical model in supporting information (SI) Text,Expected Changes in Microfilarial Load over Multiple Rounds ofTreatment. First, the slow rate of skin repopulation by micro-filariae following treatment indicates that even a year afterivermectin the microfilarial population has not reached itsequilibrium with the fertile adult worm population (12);therefore, comparing the percent reduction in microfilarialload after 2 or more ivermectin treatments with that in hostsreceiving treatment for the first time (for whom pretreatmentmicrofilarial loads in the denominator would be higher), maygive rise to false cases of suboptimal response to treatment(type 1 error). Second, expressing changes in drug efficacy asa percent of the mean pretreatment load may produce con-siderable variability because at low loads small changes inabsolute values may have a disproportionate effect on thepercentage reduction. Third, the uncertainty surrounding theoperation of a cumulative effect of ivermectin on worm
Author contributions: T.S.C. and M.-G.B. designed research; T.S.C., R.K.P., K.A., R.C.C.,J.A.W., and M.-G.B. performed research; T.S.C., S.D.S.P., and M.-G.B. contributed newreagents/analytic tools; T.S.C., S.D.S.P., and M.-G.B. analyzed data; and T.S.C., S.D.S.P.,M.Y.O.-A., R.K.P., M.B., and M.-G.B. wrote the paper.
The authors declare no conflict of interest.
This article is a PNAS Direct Submission.
1To whom correspondence should be addressed. E-mail: [email protected].
This article contains supporting information online at www.pnas.org/cgi/content/full/0906176106/DCSupplemental.
16716–16721 � PNAS � September 29, 2009 � vol. 106 � no. 39 www.pnas.org�cgi�doi�10.1073�pnas.0906176106
Dow
nloa
ded
by g
uest
on
Apr
il 20
, 202
0
fertility over multiple treatment rounds means that there maynot be yearly reductions in microfilarial load unless there wasa continual fall in the force of infection (Fig. S1 and SI Text).Finally, aggregate data mask individual host’s variation inresponse to treatment, the analysis of which is crucial todistinguishing between typical and anomalous patterns.
Before a suboptimal response to treatment can be identified,it is important to quantify the range of parasitological re-sponses observed in a wide range of populations before thewidespread introduction of chemotherapy. In this paper, weanalyze individual host parasitological responses to ivermectinby fitting a mathematical model to microfilarial loads assessedat various time points after treatment. The model generates asingle estimate of the rate of skin repopulation for each host(whilst keeping remaining parameters constant), which allowstheir microfilarial load at any time point after treatment to bepredicted (we have chosen one year because ivermectin treat-ments are usually given annually in Africa). This technique isused to quantify the individual response seen in subjectstreated for the first time in clinical and early community trials(the control dataset described in SI Text, Description of theControl Dataset). We then compare statistically the estimatesobtained from the control group with the microfilarial loadsestimated from communities which have been repeatedlytreated and suggested to have faster than expected rates of skinrepopulation (the test dataset).
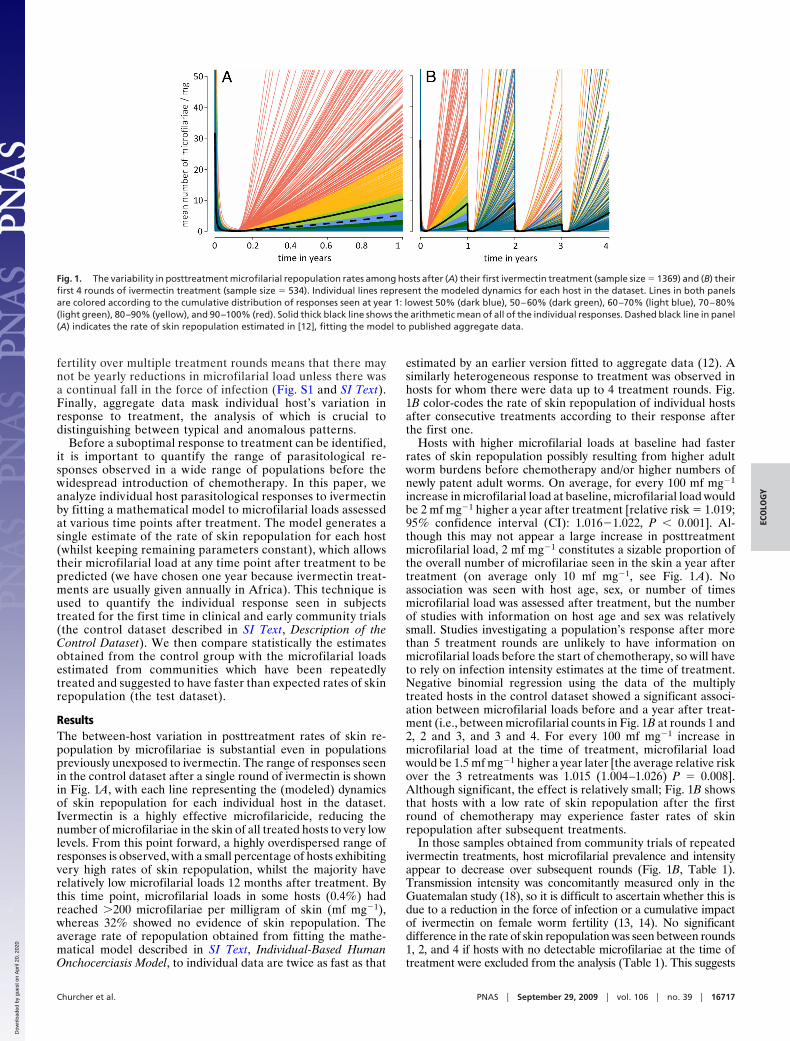
ResultsThe between-host variation in posttreatment rates of skin re-population by microfilariae is substantial even in populationspreviously unexposed to ivermectin. The range of responses seenin the control dataset after a single round of ivermectin is shownin Fig. 1A, with each line representing the (modeled) dynamicsof skin repopulation for each individual host in the dataset.Ivermectin is a highly effective microfilaricide, reducing thenumber of microfilariae in the skin of all treated hosts to very lowlevels. From this point forward, a highly overdispersed range ofresponses is observed, with a small percentage of hosts exhibitingvery high rates of skin repopulation, whilst the majority haverelatively low microfilarial loads 12 months after treatment. Bythis time point, microfilarial loads in some hosts (0.4%) hadreached �200 microfilariae per milligram of skin (mf mg�1),whereas 32% showed no evidence of skin repopulation. Theaverage rate of repopulation obtained from fitting the mathe-matical model described in SI Text, Individual-Based HumanOnchocerciasis Model, to individual data are twice as fast as that
estimated by an earlier version fitted to aggregate data (12). Asimilarly heterogeneous response to treatment was observed inhosts for whom there were data up to 4 treatment rounds. Fig.1B color-codes the rate of skin repopulation of individual hostsafter consecutive treatments according to their response afterthe first one.
Hosts with higher microfilarial loads at baseline had fasterrates of skin repopulation possibly resulting from higher adultworm burdens before chemotherapy and/or higher numbers ofnewly patent adult worms. On average, for every 100 mf mg�1
increase in microfilarial load at baseline, microfilarial load wouldbe 2 mf mg�1 higher a year after treatment [relative risk � 1.019;95% confidence interval (CI): 1.016�1.022, P � 0.001]. Al-though this may not appear a large increase in posttreatmentmicrofilarial load, 2 mf mg�1 constitutes a sizable proportion ofthe overall number of microfilariae seen in the skin a year aftertreatment (on average only 10 mf mg�1, see Fig. 1 A). Noassociation was seen with host age, sex, or number of timesmicrofilarial load was assessed after treatment, but the numberof studies with information on host age and sex was relativelysmall. Studies investigating a population’s response after morethan 5 treatment rounds are unlikely to have information onmicrofilarial loads before the start of chemotherapy, so will haveto rely on infection intensity estimates at the time of treatment.Negative binomial regression using the data of the multiplytreated hosts in the control dataset showed a significant associ-ation between microfilarial loads before and a year after treat-ment (i.e., between microfilarial counts in Fig. 1B at rounds 1 and2, 2 and 3, and 3 and 4. For every 100 mf mg�1 increase inmicrofilarial load at the time of treatment, microfilarial loadwould be 1.5 mf mg�1 higher a year later [the average relative riskover the 3 retreatments was 1.015 (1.004–1.026) P � 0.008].Although significant, the effect is relatively small; Fig. 1B showsthat hosts with a low rate of skin repopulation after the firstround of chemotherapy may experience faster rates of skinrepopulation after subsequent treatments.
In those samples obtained from community trials of repeatedivermectin treatments, host microfilarial prevalence and intensityappear to decrease over subsequent rounds (Fig. 1B, Table 1).Transmission intensity was concomitantly measured only in theGuatemalan study (18), so it is difficult to ascertain whether this isdue to a reduction in the force of infection or a cumulative impactof ivermectin on female worm fertility (13, 14). No significantdifference in the rate of skin repopulation was seen between rounds1, 2, and 4 if hosts with no detectable microfilariae at the time oftreatment were excluded from the analysis (Table 1). This suggests
Fig. 1. The variability in posttreatment microfilarial repopulation rates among hosts after (A) their first ivermectin treatment (sample size � 1369) and (B) theirfirst 4 rounds of ivermectin treatment (sample size � 534). Individual lines represent the modeled dynamics for each host in the dataset. Lines in both panelsare colored according to the cumulative distribution of responses seen at year 1: lowest 50% (dark blue), 50–60% (dark green), 60–70% (light blue), 70–80%(light green), 80–90% (yellow), and 90–100% (red). Solid thick black line shows the arithmetic mean of all of the individual responses. Dashed black line in panel(A) indicates the rate of skin repopulation estimated in [12], fitting the model to published aggregate data.
Churcher et al. PNAS � September 29, 2009 � vol. 106 � no. 39 � 16717
ECO
LOG
Y
Dow
nloa
ded
by g
uest
on
Apr
il 20
, 202
0
that microfilaria-positive hosts at treatment had the same rate ofskin repopulation irrespective of how many treatments they hadreceived, allowing us to directly compare the responses in thecontrol dataset with those in the test dataset. The possible causesof the lower microfilarial load after round 3 have been discussedelsewhere (hosts contributing data from 4 consecutive rounds ofchemotherapy largely come from a single study in Guatemala, seerefs. 14, 18, 19).
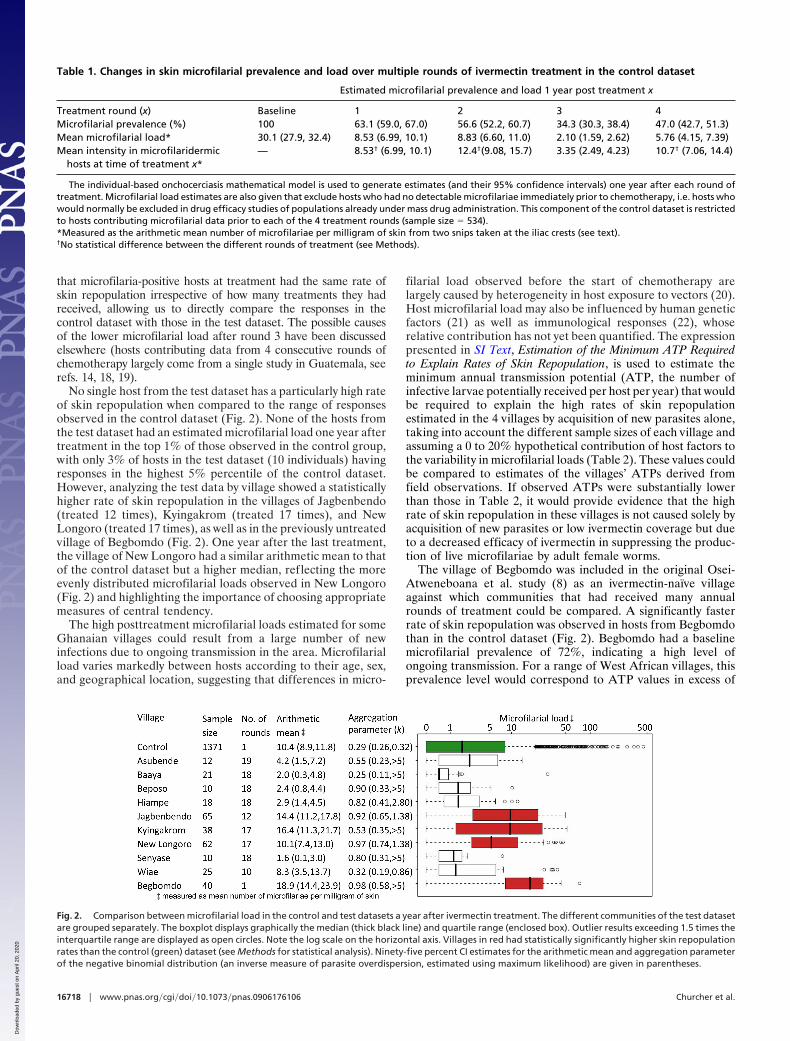
No single host from the test dataset has a particularly high rateof skin repopulation when compared to the range of responsesobserved in the control dataset (Fig. 2). None of the hosts fromthe test dataset had an estimated microfilarial load one year aftertreatment in the top 1% of those observed in the control group,with only 3% of hosts in the test dataset (10 individuals) havingresponses in the highest 5% percentile of the control dataset.However, analyzing the test data by village showed a statisticallyhigher rate of skin repopulation in the villages of Jagbenbendo(treated 12 times), Kyingakrom (treated 17 times), and NewLongoro (treated 17 times), as well as in the previously untreatedvillage of Begbomdo (Fig. 2). One year after the last treatment,the village of New Longoro had a similar arithmetic mean to thatof the control dataset but a higher median, reflecting the moreevenly distributed microfilarial loads observed in New Longoro(Fig. 2) and highlighting the importance of choosing appropriatemeasures of central tendency.
The high posttreatment microfilarial loads estimated for someGhanaian villages could result from a large number of newinfections due to ongoing transmission in the area. Microfilarialload varies markedly between hosts according to their age, sex,and geographical location, suggesting that differences in micro-
filarial load observed before the start of chemotherapy arelargely caused by heterogeneity in host exposure to vectors (20).Host microfilarial load may also be influenced by human geneticfactors (21) as well as immunological responses (22), whoserelative contribution has not yet been quantified. The expressionpresented in SI Text, Estimation of the Minimum ATP Requiredto Explain Rates of Skin Repopulation, is used to estimate theminimum annual transmission potential (ATP, the number ofinfective larvae potentially received per host per year) that wouldbe required to explain the high rates of skin repopulationestimated in the 4 villages by acquisition of new parasites alone,taking into account the different sample sizes of each village andassuming a 0 to 20% hypothetical contribution of host factors tothe variability in microfilarial loads (Table 2). These values couldbe compared to estimates of the villages’ ATPs derived fromfield observations. If observed ATPs were substantially lowerthan those in Table 2, it would provide evidence that the highrate of skin repopulation in these villages is not caused solely byacquisition of new parasites or low ivermectin coverage but dueto a decreased efficacy of ivermectin in suppressing the produc-tion of live microfilariae by adult female worms.
The village of Begbomdo was included in the original Osei-Atweneboana et al. study (8) as an ivermectin-naïve villageagainst which communities that had received many annualrounds of treatment could be compared. A significantly fasterrate of skin repopulation was observed in hosts from Begbomdothan in the control dataset (Fig. 2). Begbomdo had a baselinemicrofilarial prevalence of 72%, indicating a high level ofongoing transmission. For a range of West African villages, thisprevalence level would correspond to ATP values in excess of
Table 1. Changes in skin microfilarial prevalence and load over multiple rounds of ivermectin treatment in the control dataset
Estimated microfilarial prevalence and load 1 year post treatment x
Treatment round (x) Baseline 1 2 3 4Microfilarial prevalence (%) 100 63.1 (59.0, 67.0) 56.6 (52.2, 60.7) 34.3 (30.3, 38.4) 47.0 (42.7, 51.3)Mean microfilarial load* 30.1 (27.9, 32.4) 8.53 (6.99, 10.1) 8.83 (6.60, 11.0) 2.10 (1.59, 2.62) 5.76 (4.15, 7.39)Mean intensity in microfilaridermic
hosts at time of treatment x*— 8.53† (6.99, 10.1) 12.4†(9.08, 15.7) 3.35 (2.49, 4.23) 10.7† (7.06, 14.4)
The individual-based onchocerciasis mathematical model is used to generate estimates (and their 95% confidence intervals) one year after each round oftreatment. Microfilarial load estimates are also given that exclude hosts who had no detectable microfilariae immediately prior to chemotherapy, i.e. hosts whowould normally be excluded in drug efficacy studies of populations already under mass drug administration. This component of the control dataset is restrictedto hosts contributing microfilarial data prior to each of the 4 treatment rounds (sample size � 534).*Measured as the arithmetic mean number of microfilariae per milligram of skin from two snips taken at the iliac crests (see text).†No statistical difference between the different rounds of treatment (see Methods).
Fig. 2. Comparison between microfilarial load in the control and test datasets a year after ivermectin treatment. The different communities of the test datasetare grouped separately. The boxplot displays graphically the median (thick black line) and quartile range (enclosed box). Outlier results exceeding 1.5 times theinterquartile range are displayed as open circles. Note the log scale on the horizontal axis. Villages in red had statistically significantly higher skin repopulationrates than the control (green) dataset (see Methods for statistical analysis). Ninety-five percent CI estimates for the arithmetic mean and aggregation parameterof the negative binomial distribution (an inverse measure of parasite overdispersion, estimated using maximum likelihood) are given in parentheses.
16718 � www.pnas.org�cgi�doi�10.1073�pnas.0906176106 Churcher et al.
Dow
nloa
ded
by g
uest
on
Apr
il 20
, 202
0
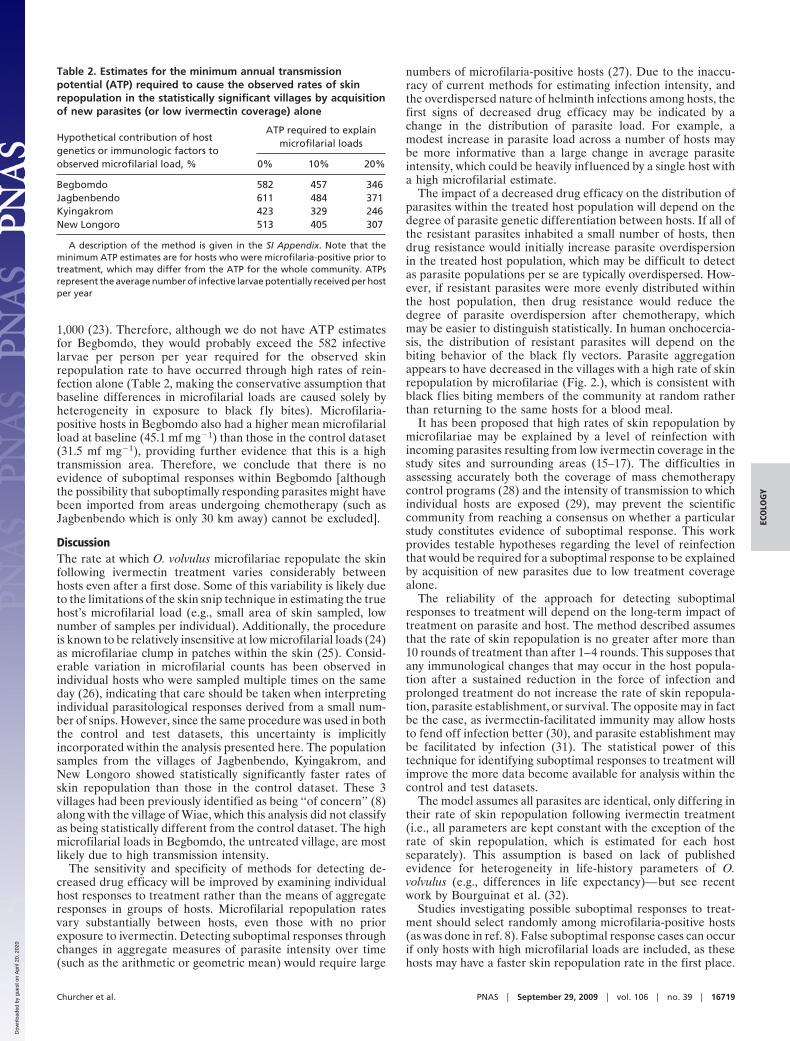
1,000 (23). Therefore, although we do not have ATP estimatesfor Begbomdo, they would probably exceed the 582 infectivelarvae per person per year required for the observed skinrepopulation rate to have occurred through high rates of rein-fection alone (Table 2, making the conservative assumption thatbaseline differences in microfilarial loads are caused solely byheterogeneity in exposure to black fly bites). Microfilaria-positive hosts in Begbomdo also had a higher mean microfilarialload at baseline (45.1 mf mg�1) than those in the control dataset(31.5 mf mg�1), providing further evidence that this is a hightransmission area. Therefore, we conclude that there is noevidence of suboptimal responses within Begbomdo [althoughthe possibility that suboptimally responding parasites might havebeen imported from areas undergoing chemotherapy (such asJagbenbendo which is only 30 km away) cannot be excluded].
DiscussionThe rate at which O. volvulus microfilariae repopulate the skinfollowing ivermectin treatment varies considerably betweenhosts even after a first dose. Some of this variability is likely dueto the limitations of the skin snip technique in estimating the truehost’s microfilarial load (e.g., small area of skin sampled, lownumber of samples per individual). Additionally, the procedureis known to be relatively insensitive at low microfilarial loads (24)as microfilariae clump in patches within the skin (25). Consid-erable variation in microfilarial counts has been observed inindividual hosts who were sampled multiple times on the sameday (26), indicating that care should be taken when interpretingindividual parasitological responses derived from a small num-ber of snips. However, since the same procedure was used in boththe control and test datasets, this uncertainty is implicitlyincorporated within the analysis presented here. The populationsamples from the villages of Jagbenbendo, Kyingakrom, andNew Longoro showed statistically significantly faster rates ofskin repopulation than those in the control dataset. These 3villages had been previously identified as being ‘‘of concern’’ (8)along with the village of Wiae, which this analysis did not classifyas being statistically different from the control dataset. The highmicrofilarial loads in Begbomdo, the untreated village, are mostlikely due to high transmission intensity.
The sensitivity and specificity of methods for detecting de-creased drug efficacy will be improved by examining individualhost responses to treatment rather than the means of aggregateresponses in groups of hosts. Microfilarial repopulation ratesvary substantially between hosts, even those with no priorexposure to ivermectin. Detecting suboptimal responses throughchanges in aggregate measures of parasite intensity over time(such as the arithmetic or geometric mean) would require large
numbers of microfilaria-positive hosts (27). Due to the inaccu-racy of current methods for estimating infection intensity, andthe overdispersed nature of helminth infections among hosts, thefirst signs of decreased drug efficacy may be indicated by achange in the distribution of parasite load. For example, amodest increase in parasite load across a number of hosts maybe more informative than a large change in average parasiteintensity, which could be heavily influenced by a single host witha high microfilarial estimate.
The impact of a decreased drug efficacy on the distribution ofparasites within the treated host population will depend on thedegree of parasite genetic differentiation between hosts. If all ofthe resistant parasites inhabited a small number of hosts, thendrug resistance would initially increase parasite overdispersionin the treated host population, which may be difficult to detectas parasite populations per se are typically overdispersed. How-ever, if resistant parasites were more evenly distributed withinthe host population, then drug resistance would reduce thedegree of parasite overdispersion after chemotherapy, whichmay be easier to distinguish statistically. In human onchocercia-sis, the distribution of resistant parasites will depend on thebiting behavior of the black fly vectors. Parasite aggregationappears to have decreased in the villages with a high rate of skinrepopulation by microfilariae (Fig. 2.), which is consistent withblack flies biting members of the community at random ratherthan returning to the same hosts for a blood meal.
It has been proposed that high rates of skin repopulation bymicrofilariae may be explained by a level of reinfection withincoming parasites resulting from low ivermectin coverage in thestudy sites and surrounding areas (15–17). The difficulties inassessing accurately both the coverage of mass chemotherapycontrol programs (28) and the intensity of transmission to whichindividual hosts are exposed (29), may prevent the scientificcommunity from reaching a consensus on whether a particularstudy constitutes evidence of suboptimal response. This workprovides testable hypotheses regarding the level of reinfectionthat would be required for a suboptimal response to be explainedby acquisition of new parasites due to low treatment coveragealone.
The reliability of the approach for detecting suboptimalresponses to treatment will depend on the long-term impact oftreatment on parasite and host. The method described assumesthat the rate of skin repopulation is no greater after more than10 rounds of treatment than after 1–4 rounds. This supposes thatany immunological changes that may occur in the host popula-tion after a sustained reduction in the force of infection andprolonged treatment do not increase the rate of skin repopula-tion, parasite establishment, or survival. The opposite may in factbe the case, as ivermectin-facilitated immunity may allow hoststo fend off infection better (30), and parasite establishment maybe facilitated by infection (31). The statistical power of thistechnique for identifying suboptimal responses to treatment willimprove the more data become available for analysis within thecontrol and test datasets.
The model assumes all parasites are identical, only differing intheir rate of skin repopulation following ivermectin treatment(i.e., all parameters are kept constant with the exception of therate of skin repopulation, which is estimated for each hostseparately). This assumption is based on lack of publishedevidence for heterogeneity in life-history parameters of O.volvulus (e.g., differences in life expectancy)—but see recentwork by Bourguinat et al. (32).
Studies investigating possible suboptimal responses to treat-ment should select randomly among microfilaria-positive hosts(as was done in ref. 8). False suboptimal response cases can occurif only hosts with high microfilarial loads are included, as thesehosts may have a faster skin repopulation rate in the first place.
Table 2. Estimates for the minimum annual transmissionpotential (ATP) required to cause the observed rates of skinrepopulation in the statistically significant villages by acquisitionof new parasites (or low ivermectin coverage) alone
Hypothetical contribution of hostgenetics or immunologic factors toobserved microfilarial load, %
ATP required to explainmicrofilarial loads
0% 10% 20%
Begbomdo 582 457 346Jagbenbendo 611 484 371Kyingakrom 423 329 246New Longoro 513 405 307
A description of the method is given in the SI Appendix. Note that theminimum ATP estimates are for hosts who were microfilaria-positive prior totreatment, which may differ from the ATP for the whole community. ATPsrepresent the average number of infective larvae potentially received per hostper year
Churcher et al. PNAS � September 29, 2009 � vol. 106 � no. 39 � 16719
ECO
LOG
Y
Dow
nloa
ded
by g
uest
on
Apr
il 20
, 202
0
One of the advantages of the technique developed in thispaper is that it does not require a priori information on thetreatment coverage of an area (which is difficult to estimateaccurately) to identify atypical rates of skin repopulation. Also,the model is fitted to data from individuals who were all treatedand followed-up longitudinally, rather than to cross-sectionaldata of populations subject to different coverage levels. Estima-tion of the host’s skin repopulation rate provides a method ofquantifying an individual host’s response to treatment which canbe correlated with the genotypic information of parasites ob-tained from that host (microfilariae and adult worms). A numberof possible molecular markers (including beta-tubulin and P-glycoprotein among others) have been identified which couldprovide useful tools in identifying anthelmintic resistance beforeit becomes widely spread (32, 33). Linking phenotypic responseswith molecular genetics markers will be required to prove thatsuboptimal responses are in fact due to drug-resistant parasitesand not to host-related factors (3).
Even in the villages with a faster rate of skin repopulation,ivermectin is still a highly effective microfilaricidal drug, con-trolling morbidity and possibly reducing transmission. Ivermec-tin kills microfilariae equally well in all hosts of the control andtest datasets. This is important as the lack of heterogeneityobserved in ivermectin’s microfilaricidal effect reduces thechance of this type of drug resistance developing as there is littlevariability within the parasite population for selection to actupon. This should, however, not create complacency and effortsshould be made to contain the spread of the suboptimal re-sponses identified in Ghana by, for instance, vector control andanti-Wolbachia therapy (34). Mathematical models can be usedto investigate how changing from annual to biannual massivermectin distribution could compensate for faster rates of skinrepopulation and help national programs achieve their objectivesof morbidity control, sustained reductions in transmission, orelimination of the parasite reservoir.
The methods outlined within this paper can be extended toother human helminthiases. The models and analysis can besuitably modified to investigate treatment responses in otherfilariasis (through the study of microfilariae in the blood),schistosomiasis, and soil-transmitted helminthiases (by exam-ining egg counts in feces and urine). Large datasets ofresponses in treatment-unexposed populations should ideallybe collated for each infection and chemotherapy regimen.Mathematical models can be used to capture the range ofresponses to be expected in treatment-naïve populations andthis range should be made publicly available (together withmodel assumptions) to allow possible suboptimal responsecases to be rigorously investigated phenotypically and geno-typically. Models can also be used to differentiate suboptimalresponses to treatment from high rates of parasite reinfection(35), providing testable hypotheses as to the causes of atypicalpatterns and tools for early-warning identification of responsesthat warrant in-depth investigation. Claims of drug resistancethat are not rigorously tested risk jeopardizing political andfinancial support to mass chemotherapy control campaigns,especially those that rely on drug donation programs. Math-ematical epidemiology can provide a useful insight into thequestion of what constitutes evidence of drug resistance,helping move the debate from conjecture to evidence-baseddecision making.
MethodsStudy Areas and Datasets. A recent systematic review and metaanalysiscollated all published (aggregate) data on the different effects against O.volvulus of a single dose of ivermectin in treatment-naïve populationsamples and represented the ensuing posttreatment dynamics by fitting amathematical model to the means for groups of studies at each time point(12). To ascertain the variability present within each study we contacted the
authors of the articles included in the review and obtained individual hostmicrofilarial counts before and at various times after treatment (togetherwith variables such as age and sex) for a total of 7 studies conducted inGhana, Guatemala, Liberia, and Sierra Leone. This constitutes the controldataset comprising 1369 individuals treated for the first time, as describedbelow and in SI Text, Description of the Control Dataset (Table S1) (19,36 – 41). The test dataset consists of 240 microfilaria-positive hosts from 9communities in Ghana treated 10 –19 times, plus 40 hosts from an un-treated community (see ref. 8 for a description of the villages). Rates of skinrepopulation were estimated for each host by fitting the individual-basedmodel to microfilarial load assessed at various time points after treatment(for the control dataset see Table S1, the test dataset day 90, 180, and 365).This allowed the microfilarial load one year posttreatment to be estimatedfor each host and to be compared statistically between the control and testdatasets to determine whether the Ghanaian study (8) truly providesevidence of suboptimal responses to treatment.
Mathematical Model. An individual-based, deterministic onchocerciasis dy-namics model was fitted to microfilarial data from each host (SI Text, Individ-ual-Based Human Onchocerciasis Model). The mathematical model comprises3 differential equations, describing the rate of change with respect to time ofthe number of nonfertile and fertile female worms per host, and microfilariaeper mg of skin. Parameter values applicable to a wide range of epidemiolog-ical settings, including the per capita rate of female worm fecundity weretaken from (23). Fertile adult worms and microfilariae were assumed to havea constant per capita death rate, with a mean life-expectancy of 10 years and15 months, respectively (23). Parameters regarding the effect of ivermectin onthe different parasite stages were taken from ref. 12. Studies which recordedchanges of microfilarial load during the first 60 days after chemotherapyindicate very little between-host variability in ivermectin’s microfilaricidalefficacy, allowing the model to concentrate specifically on the variability inthe rate of skin repopulation between hosts. This is captured using a singleparameter which is individually estimated for each host in the population foreach round of treatment. The parameter enters into the equation for micro-filariae by multiplying the fecundity rate of fertile worms times the ratio ofskin repopulation within that host relative to that in the mean-based modelof ref. 12. Keeping the remaining 12 parameters fixed, the model estimates(using least squares) a single rate of skin repopulation for each host for eachround of treatment using the 1–3 posttreatment time points available. Gen-erating a single rate of repopulation for each host after each round ofchemotherapy allows studies with samples taken at different times aftertreatment to be directly compared. This increases substantially the size of thecontrol dataset for comparison with the test dataset (Table S1) and alsopermits investigation of any systematic changes in skin repopulation. Esti-mates of the microfilarial load one year after treatment were generated foreach host and used within the statistical analysis (although the conclusions ofthe analysis would have remained the same had other time points been used,e.g., 6 months posttreatment).
Statistical Analyses. Negative binomial regression (to account for overdisper-sion in microfilarial loads) was first used to test whether host characteristics(baseline microfilarial load, age, sex, number of time points at which skin snipswere taken) influenced microfilarial load one year after treatment. Relativerisk estimates were generated for each of the variables which were statisticallysignificant at the 5% level.
Microfilarial estimates one year after treatment rounds 1– 4 were com-pared for the 534 hosts who had been followed longitudinally using thenonparametric Kruskal-Wallis test. The estimated microfilarial load oneyear after the first treatment is used as the control dataset due to its largersample size and to reduce type I error. If there were some form of cumu-lative impact of ivermectin on female worm fecundity, then the rate of skinrepopulation by microfilariae would be greatest after the first round. It isthought that O. volvulus is relatively unsusceptible to ivermectin during itslong prepatent period (42) which can be 6 –18 months (43). Consequently,the skin repopulation rate recorded after the first treatment round couldinclude microfilariae from newly patent parasites which were acquiredbefore any reduction in the force of infection may have occurred. Findingstatistically faster rates of microfilarial repopulation in a parasite popula-tion exposed to a lower force of infection which has received more than 10rounds of mass treatment than in an ivermectin-naïve population withongoing transmission should, therefore, provide robust evidence of asuboptimal response. Investigating whether this is due to heritablechanges in the parasite population, the ultimate proof of drug resistance,is the essential next step.
16720 � www.pnas.org�cgi�doi�10.1073�pnas.0906176106 Churcher et al.
Dow
nloa
ded
by g
uest
on
Apr
il 20
, 202
0
Estimated microfilarial loads one year after treatment were comparedbetween the control (treatment-naïve) dataset and each community of thetest dataset using the non-parametric Kruskal-Wallis test. To take intoconsideration the small size of the samples from some of the test villages,the control dataset was repeatedly resampled 100,000 times with replace-ment, with a sample size equal to that of the test village in question. Ratesof repopulation by microfilariae were deemed as significantly higher in agiven test village if �95% of the resamples from the control dataset werebelow the median of the test village. The results of this analysis confirmedthose of the Kruskal-Wallis test. The same conclusions were reached whenthe analysis was repeated using only a single posttreatment time point toestimate the rate of skin repopulation in the test dataset, indicating thatthe high number of time points in the test dataset was not responsible forthe observed results. Ninety-five percent CI for the arithmetic mean andaggregation parameter of the negative binomial distribution (an inversemeasure of parasite overdispersion) were estimated through bootstrap-ping (100,000 repeats).
Estimation of Rates of Acquisition of New Parasites. By making reasonableassumptions about the relative contribution of host-specific factors (ge-netic or immunologic) to infection, the mathematical model can be used to
estimate the minimum number of infective larvae a person should poten-tially receive during a year (ATP) to generate the estimated microfilarialloads. The expression describing the relationship between ATP and thebaseline microfilarial load is given in SI Text, Estimation of the MinimumATP Required to Explain Rates of Skin Repopulation. If one assumes thatO. volvulus is largely unsusceptible to ivermectin during its prepatentperiod (43), the number of parasites reaching patency before and up to ayear after chemotherapy will be the same. This enables the number ofmicrofilariae resulting from parasite reinfection to be estimated frombaseline microfilarial loads. The control dataset was sampled randomly togenerate 100,000 subgroups of hosts whose ATP were estimated. The rateof skin repopulation was compared between these subgroups and the testdataset to find the minimum ATP that could have generated the data in theGhanaian villages with statistically higher microfilarial loads one year afterthe last ivermectin treatment.
ACKNOWLEDGMENTS. We thank Beatriz Munoz and Hugh Taylor for provid-ing the data from Liberia and acknowledge financial support by the MedicalResearch Council and The Wellcome Trust, United Kingdom (to T.S.C. andM.G.B.). The Ghanaian study received support from the Ghana Governmentand McGill University, Montreal, Canada.
1. Kaplan RM (2004) Drug resistance in nematodes of veterinary importance: A statusreport. Trends Parasitol 20:477–481.
2. Albonico M, et al. (2003) Efficacy of mebendazole and levamisole alone or in combi-nation against intestinal nematode infections after repeated targeted mebendazoletreatment in Zanzibar. Bull WHO 81:343–352.
3. Ali MMM, et al. (2002) Immunocompetence may be important in the effectiveness ofMectizan (R) (ivermectin) in the treatment of human onchocerciasis. Acta Trop 84:49–53.
4. Awadzi K, et al. (2004) Thirty-month follow-up of sub-optimal responders to multipletreatments with ivermectin, in two onchocerciasis-endemic foci in Ghana. Ann TropMed Parasitol 98:359–370.
5. Awadzi K, et al. (2004) An investigation of persistent microfilaridermias despitemultiple treatments with ivermectin, in two onchocerciasis-endemic foci in Ghana.Ann Trop Med Parasitol 98:231–249.
6. De Clercq D, et al. (1997) Failure of mebendazole in treatment of human hookworminfections in the southern region of Mali. Am J Trop Med Hyg 57:25–30.
7. Eberhard ML, Lammie PJ, Dickinson CM, Roberts JM (1991) Evidence of nonsuscepti-bility to diethylcarbamazine in Wuchereria bancrofti. J Infect Dis 163:1157–1160.
8. Osei-Atweneboana MY, Eng JK, Boakye DA, Gyapong JO, Prichard RK (2007) Preva-lence and intensity of Onchocerca volvulus infection and efficacy of ivermectin inendemic communities in Ghana: A two-phase epidemiological study. Lancet 369:2021–2029.
9. Churcher TS, Basanez MG (2009) Sampling strategies to detect anthelmintic resistance:The perspective of human onchocerciasis. Trends Parasitol 25:11–17.
10. Martin PJ, Anderson N, Jarrett RG (1989) Detecting benzimidazole resistance withfaecal egg count reduction tests and in vitro assays. Aust Vet J 66:236–240.
11. Dadzie Y, Neira M, Hopkins D (2003) Final report of the conference on the eradicabilityof Onchocerciasis. Filaria J 2:2.
12. Basanez MG, et al. (2008) Effect of single-dose ivermectin on Onchocerca volvulus: Asystematic review and meta-analysis. Lancet Infect Dis 8:310–322.
13. Plaisier AP, et al. (1995) Irreversible effects of ivermectin on adult parasites in on-chocerciasis patients in the Onchocerciasis Control Programme in West Africa. J InfectDis 172:204–210.
14. Bottomley C, Isham V, Collins RC, Basanez MG (2008) Rates of microfilarial productionby Onchocerca volvulus are not cumulatively reduced by multiple ivermectin treat-ments. Parasitology 135:1571–1581.
15. Cupp E, Richards F, Lammie P, Eberhard M (2007) Efficacy of ivermectin againstOnchocerca volvulus in Ghana. Lancet 370:1123; author reply 1124–1125.
16. Mackenzie CD (2007) Efficacy of ivermectin against Onchocerca volvulus in Ghana.Lancet 370:1123; author reply 1124–1125.
17. Remme JH, Amazigo U, Engels D, Barryson A, Yameogo L (2007) Efficacy of ivermectinagainst Onchocerca volvulus in Ghana. Lancet 370:1123–1124; author reply 1124–1125.
18. Cupp EW, et al. (1992) The effects of repetitive community-wide ivermectin treatmenton transmission of Onchocerca volvulus in Guatemala. Am J Trop Med Hyg 47:170–180.
19. Collins RC, , et al. (1992) Ivermectin: Reduction in prevalence and infection intensity ofOnchocerca volvulus following biannual treatments in five Guatemalan communities.Am J Trop Med Hyg 47:156–169.
20. Filipe JAN, et al. (2005) Human infection patterns and heterogeneous exposure in riverblindness. Proc Natl Acad Sci USA 102:15265–15270.
21. Timmann C, et al. (2008) Human genetic resistance to Onchocerca volvulus: Evidencefor linkage to chromosome 2p from an autosome-wide scan. J Infect Dis 198:427–433.
22. Hoerauf A, Brattig N (2002) Resistance and susceptibility in human onchocerciasis–beyond Th1 vs. Th2. Trends Parasitol 18:25–31.
23. Basanez MG, Boussinesq M (1999) Population biology of human onchocerciasis. PhilosTrans R Soc London B 354:809–826.
24. Toe L, et al. (1998) Detection of Onchocerca volvulus infection by O-150 polymerasechain reaction analysis of skin scratches. J Infect Dis 178:282–285.
25. Kershaw WE, Duke BOL, Budden FH (1954) Distribution of microfilariae of Onchocercavolvulus in the skin; its relation to the skin changes and to eye lesions and blindness.Br Med J 2:724–729.
26. Picq JJ, Jardel JP (1974) A method of evaluating microfilaria densities of Onchocercavolvulus Leuckart, 1893, in onchoceriasis patients. Bull WHO 51:145–153.
27. Fulford AJ (1994) Dispersion and bias: Can we trust geometric means? Parasitol Today10:446–448.
28. Mathieu E, et al. (2003) Comparison of methods for estimating drug coverage forfilariasis elimination, Leogane Commune, Haiti. Trans R Soc Trop Med Hyg 97:501–505.
29. Renz A, Fuglsang H, Anderson J (1987) Studies on the dynamics of transmission ofonchocerciasis in a Sudan-savanna area of North Cameroon IV. The different exposureto Simulium bites and transmission of boys and girls and men and women, and theresulting manifestations of onchocerciasis. Ann Trop Med Parasitol 81:253–262.
30. Soboslay PT, et al. (1994) Ivermectin-facilitated immunity in onchocerciasis; activationof parasite-specific Th1-type responses with subclinical Onchocerca volvulus infection.Clin Exp Immunol 96:238–244.
31. Duerr HP, Dietz K, Schulz-Key H, Buttner DW, Eichner M (2003) Density-dependentparasite establishment suggests infection-associated immunosuppression as an impor-tant mechanism for parasite density regulation in onchocerciasis. Trans R Soc Trop MedHyg 97:242–250.
32. Bourguinat C, et al. (2007) Genetic selection of low fertile Onchocerca volvulus byivermectin treatment. PLoS Negl Trop Dis 1:e7.
33. Bourguinat C, et al. (2008) P-glycoprotein-like protein, a possible genetic marker forivermectin resistance selection in Onchocerca volvulus. Mol Biochem Parasitol158:101–111.
34. Taylor MJ, Hoerauf A (2001) A new approach to the treatment of filariasis. Curr OpinInfect Dis 14:727–731.
35. Danso-Appiah A, De Vlas SJ (2002) Interpreting low praziquantel cure rates of Schis-tosoma mansoni infections in Senegal. Trends Parasitol 18:125–129.
36. Awadzi K, et al. (1986) The chemotherapy of onchocerciasis. XI. A double-blindcomparative study of ivermectin, diethylcarbamazine and placebo in human onchocer-ciasis in northern Ghana. Ann Trop Med Parasitol 80:433–442.
37. Awadzi K, Dadzie KY, Klager S, Gilles HM (1989) The chemotherapy of onchocerciasis.XIII. Studies with ivermectin in onchocerciasis patients in northern Ghana, a regionwith long lasting vector control. Trop Med Parasitol 40:361–366.
38. Awadzi K, Opoku NO, Addy ET, Quartey BT (1995) The chemotherapy of onchocerciasis.XIX: The clinical and laboratory tolerance of high dose ivermectin. Trop Med Parasitol46:131–137.
39. Awadzi K, et al. (1997) The safety and efficacy of amocarzine in African onchocerciasisand the influence of ivermectin on the clinical and parasitological response to treat-ment. Ann Trop Med Parasitol 91:281–296.
40. Greene BM, et al. (1991) A comparison of 6-, 12-, and 24-monthly dosing with iver-mectin for treatment of onchocerciasis. J Infect Dis 163:376–380.
41. Whitworth JA, Morgan D, Maude GH, Downham MD, Taylor DW (1991) A communitytrial of ivermectin for onchocerciasis in Sierra Leone: Clinical and parasitologicalresponses to the initial dose. Trans R Soc Trop Med Hyg 85:92–96.
42. Boussinesq M, Chippaux JP (2001) A controlled prospective trial of the prophylacticeffect of a single dose of ivermectin against Onchocerca volvulus. Parasite 8:255–259.
43. Duke BOL (1993) The population dynamics of Onchocerca volvulus in the human host.Trop Med Parasitol 44:61–68.
Churcher et al. PNAS � September 29, 2009 � vol. 106 � no. 39 � 16721
ECO
LOG
Y
Dow
nloa
ded
by g
uest
on
Apr
il 20
, 202
0