Embed Size (px)
Citation preview

Ž .Spectrochimica Acta Part B 56 2001 795�806
Fast analysis of wood preservers using laser inducedbreakdown spectroscopy �
A. Uhl, K. Loebe1,�, L. Kreuchwig
LLA Umwelttechnische Analytik und Anlagen GmbH, Schwarzschildstr. 10, D-12489 Berlin, Germany
Received 12 October 2000; accepted 20 April 2001
Abstract
Ž .Laser-induced breakdown spectroscopy LIBS is used for the investigation of wood preservers in timber and infurniture. Both experiments in laboratory and practical applications in recycling facilities and on a building site provethe new possibilities for the fast detection of harmful agents in wood. A commercial system was developed for mobilelaser-plasma-analysis as well as for industrial use in sorting plants. The universal measuring principle in combinationwith an Echelle optics permits real simultaneous multi-element-analysis in the range of 200�780 nm with a resolutionof a few picometers. It enables the user to detect main and trace elements in wood within a few seconds, nearlyindependent of the matrix, knowing that different kinds of wood show an equal elemental composition. Sample
Žpreparation is not required. The quantitative analysis of inorganic wood preservers containing, e.g. Cu, Cr, B, As,.Pb, Hg has been performed exactly using carbon as reference element. It can be shown that the detection limits for
heavy metals in wood are in the ppm-range. Additional information is given concerning the quantitative analysis.Ž .Statistical data, e.g. the standard deviation S.D. , were determined and calibration curves were used for each
particular element. A comparison between ICP-AES and LIBS is given using depth profile correction factorsregarding the different penetration depths with respect to the different volumes in wood analyzed by both analyticalmethods. � 2001 Elsevier Science B.V. All rights reserved.
Keywords: Laser-induced breakdown spectroscopy; Wood; Preserver; Material; Analysis; Environment
� This paper was presented at the 1st International Congress on Laser Induced Plasma Spectroscopy and Applications, Pisa,Italy, October 2000, and is published in the Special Issue of Spectrochimica Acta Part B, dedicated to that conference.
� Corresponding author. Tel.: �49-30-6392-4760; fax: �49-30-6392-4766.Ž .E-mail address: [email protected] K. Loebe .
1http:��www.lla.de.
0584-8547�01�$ - see front matter � 2001 Elsevier Science B.V. All rights reserved.Ž .PII: S 0 5 8 4 - 8 5 4 7 0 1 0 0 2 3 1 - 2

( )A. Uhl et al. � Spectrochimica Acta Part B: Atomic Spectroscopy 56 2001 795�806796
1. Introduction
The further use of the recycling of contami-nated wood requires the analytical evaluation ofthe material with regard to contained toxic sub-stances. During the processing of wood, differentchemical substances showing insecticidal andfungicidal effects, as well as flame retardants, areused, and are characterized as wood preservers.Generally, these substances may be divided intotwo groups: water-soluble, mostly inorganic salts;and organic wood preservers diluted in organicsolvents.
At present, wood preservers are investigatedusing conventional analytical methods, which re-quire expensive sample preparation and are dif-ficult to use in practice. Inorganic substances aremostly detected by comprehensive spectroscopic
Ž . � �methods ICP-AES or AAS 1 ; organic com-pounds are mostly investigated using different
Ž � �.chromatographic methods e.g. GC-MS 2 .Due to the high amount of material required
for the sample preparation, these classical labora-tory methods are not very reasonable.
An alternative method for the fast on-site de-tection of inorganic agents in wood is X-ray fluor-escence. Currently, it is applied in the qualitycontrol of freshly impregnated wood in the US,
Žfor the monitoring of high concentrations in the.percentage range of heavy metals. However, X-
ray fluorescence is not applicable for low concen-trations of agents due to low detection limits.Light elements, e.g. B, C, Na, may not be de-tected, and long measuring times are required to
� �achieve acceptable detection limits 3,4 .An analytical method, permitting a fast, direct
on-line determination of harmful agents in woodŽ .is Laser-Induced Breakdown Spectroscopy LIBS .
LIBS is based on the spectral analysis of alaser-induced micro plasma. A laser beam, fo-cussed onto the surface of the sample, evaporatessmall amounts of the material and simultaneouslyexcites a plasma discharge. The analysis of theemitted element specific spectral lines permits thedirect determination of the atomic composition of
� �substances 5�8 . This measuring principle allowsthe determination of main and trace elements inwood within a few seconds. The principle of LIBS,
the explosive evaporation and the almost com-plete atomization and ionization of the materialprovides the detection of single elements nearlyindependent of the matrix. The influence of watercontent may be excluded.
The wood preservers used are detected indi-rectly by chemical elements.
Inorganic wood preservers are detectable bytheir heavy metals or by a combination of specificelements.
Conclusions of critical organic substances areonly possible by the detection of elements ofcharacteristic functional groups. This kind of clas-sification permits only an estimation of contami-nation grade. Organic wood preservers, e.g.
Ž .Furmecyclox C H NO , may not be detected14 21 3by LIBS.
2. Experimental
A commercial mobile laser-plasma-spectrome-ter for the in-situ evaluation of contaminatedwood was developed and manufactured by LLAUmwelttechnische Analytik und Anlagen GmbH.The objective was the construction of a systemwhich fulfils all the requirements for applicationin the wood-processing industry, and which sup-ports sorting on the basis of different categoriesof contaminants within seconds.
This system should be usable for the inspectionof raw materials as well as for automatic sortingin industrial plants. To achieve an easy adapta-tion to industrial plants as well as to mobilesystems, all basic components were developed asmodular units.
The system consists of the following units: lasersystem; measuring optics; unit for optical analysis;and electronic control unit, as shown in Fig. 1.
The single pulses, emitted by a compact Q-Ž .switched Nd:YAG-laser 1064 nm, 10 Hz, 5 ns ,
are focussed onto the surface of the samplethrough lenses and mirrors. Individual measuringheads allow measurements over different dis-tances. The emission from the plasma is collectedby telescope optics and transmitted via a fibercable to the entrance slit of a spectrometer.

( )A. Uhl et al. � Spectrochimica Acta Part B: Atomic Spectroscopy 56 2001 795�806 797
Fig. 1. Schematic diagram of the measuring system.
The Echelle spectrograph, especially designedfor plasma spectroscopy, is the heart of the opti-cal unit, as shown in Fig. 2. It is the main prereq-uisite for a simultaneous multi-element-analysiswith high measurement speeds. The Echelle spec-trograph was developed in close co-operation withthe Institut fur Spektrochemie und angewandte¨
� �Spektroskopie in Berlin 9,10 . An Echelle grat-ing, which is positioned under a flat angle ofincidence, produces up to 100 diffraction orders.An additional quartz prism in front of the gratingseparates the overlapping orders by splitting them
Fig. 2. Optical system of the Echelle spectrograph.
vertically to the direction of the spectrum. In thisway, the compact spectrograph covers a totalspectrum length of over 1 m on a 1-inch2 focalplane.
The simultaneous recording of the completerelevant spectral range from 200 to 780 nm with alinear dispersion of approximately 5�18 pm�pixelis possible. Due to the positioning of a large pixelsensor array into the focal plane of the spectro-graph, the simultaneous detection of nearly allanalytical lines of interest with a high spectralresolution is achieved. The additional coupling ofthe CCD-chip to an image intensifier allows, onone hand, the detection of extremely low signalsŽ 6 .light amplification approx. 10 lm�lm , and onthe other hand, the time-resolved detection of theplasma discharge to improve the signal-to-noiseratio.
The system’s control synchronizes the laser unitand sensor system to achieve a time-resolved de-tection of the plasma discharge. The measureddistribution of intensities is transmitted to a com-puter and processed further.
All electronic components of the measuringsystem, including the industrial PC, are integratedin a 19-inch standard rack. The frame grabberand the fast pulser boards of the camera arespecial developments by LLA.
For the reduction of both the large spectralŽ .data set 2 MB for the entire Echelle spectrum
Žand the CCD-read out time 2.25 s for a 1024�.1024-pixel matrix , it is possible to summarize and
Žto discard uninteresting spectral ranges hardware.and software binning . A bit pattern stored in a
RAM gives the orientation for summarizing se-Ž .lected lines on the CCD array line binning .
Additionally, selected areas of a line can be sum-Ž .marized column binning . These methods accel-
erate the spectra processing by one order of mag-nitude.
After the setting of an individual measuringŽprogram, selected pixel areas region of interest,
.ROI are read out, which represent the selectedelement lines chosen for analysis.
The complete measuring time is calculated byŽadding the number of laser shots 10 shots�1 s
. Žfor a 10-Hz system , the CCD read out time 1 s.for a selection of 30 lines and the time for

( )A. Uhl et al. � Spectrochimica Acta Part B: Atomic Spectroscopy 56 2001 795�806798
spectra calculation and visualization. The totaltime is approximately 2.2 s.
For field measurements, the sample is eitherput into a sample chamber or may be movedwithin the optical path of the laser during themeasurement.
The modified measuring system uses laser pulseenergies between 50 and 70 mJ, focussed to aspot of 300�500 �m diameter. The distancebetween the measuring head and the sample sur-face is 250 mm.
The standard measuring conditions for therecording of plasma spectra include a delay timeto the laser pulse of 3 �s and a gate time of 10�s. For quantitative measurements the followingconditions were applied: three clean pulses, then10�20 shots into the same spatial spot, on-chipadded. From an ablation depth of a few �m perlaser shot, an average crater depth of approxi-
mately 60�100 �m results. The depths vary withthe type of the wood.
The locally limited laser ablation permits asimple and fast evaluation of the distribution ofcontaminants along the surface as well as therecording of depth profiles.
3. Results and discussion
3.1. Qualitati�e analysis
Fig. 3 shows an Echelle spectrum of a woodsample, treated with a chromium�copper�boronmixture. The pure camera picture of the Echellespectrum is shown, as it appears in the imageplane of the spectrograph. The pattern of thediffraction orders is clearly seen. The point pat-tern of atomic lines characterizes the atomic com-
Ž .Fig. 3. Echelle spectrum of wood containing chromium�copper�boron, Uncorrected camera picture on-chip addition of 10 shots ,spectral range 245�700 nm.

( )A. Uhl et al. � Spectrochimica Acta Part B: Atomic Spectroscopy 56 2001 795�806 799
Ž .Fig. 4. Classical wavelength spectrum calculated from the Echelle picture Fig. 3 , enlarged detail of chromium line group at 285nm.
position of the wood sample like a fingerprint. AŽpart of the classical spectrum intensity vs. wave-
.length , calculated from this camera picture, isshown in Fig. 4. The group of chromium lines at285 nm is mapped. Due to the high spectralresolution influences by an overlay of emissionlines are mainly excluded.
The simultaneous measurement of all relevantspectral lines and, therefore, the parallel determi-nation of almost all elements, is possible due tothe high informational content of one picture,caused by the distribution of the spectra to thepicture.
An application-specific measuring program forautomatic analysis of wood was created by theselection of appropriate emission lines and by thecreation of a binning table. This program permitsa true real-time analysis by the read-out of the
Ž .desired spectral lines ROI-files .
Fig. 5 shows the print-out of the measuringprotocol, containing only the spectral areas used
Ž .for analysis width approx. 400 pm for each lineand the corresponding line intensities with re-spect to their ratios. Boron, chromium and cop-per line peaks are clearly recognizable.
A simple semi-quantitative analysis can be per-formed without a comprehensive calibration bystandard samples. The procedure is based on thefact that different types of wood have the same
� �elemental composition 11 . Besides, the mainŽ . Ž .components carbon 48�51% , oxygen 43�44%
Ž .and hydrogen 6�7% the proportions of otherelements are mainly determined by mineral com-pounds, occurring in wood at concentrations of0.2�0.6%.
Fig. 6 shows the relative change of concentra-tion of single elements for wood treated withwood preservers. Critical components are de-

( )A. Uhl et al. � Spectrochimica Acta Part B: Atomic Spectroscopy 56 2001 795�806800
ŽFig. 5. Sector of measuring program file - selected spectral lines for fast analysis of wood, ROI-wavelength interval approx. 400 pm. Ž .for each line , calculated from the Echelle picture Fig. 3 .
Ž .tected by unnatural elements As, Cr, Sn, B or byan unnaturally high concentration of trace ele-
Ž .ments Al, Cu, Mg, Si .Fig. 7 shows microscope pictures of a hole and
a section of the penetration channel. The diame-ter of the penetration channel is approximately500 �m. The penetration speed can be varied bychanging the laser energy. Synchronously to the
increasing penetration depth, the line intensitiesof selected elements were measured. By the useof line ratios instead of absolute intensities, in-fluences due to the decreasing ablation depth perlaser shot, or the narrowing of the plasma cloudwith the increasing depth of the crater, are cor-rected.
The results show that the chemical substances
Fig. 6. Relative change of concentration of elements in wood using different wood preservers, 10-shot averaging mode.
( )A. Uhl et al. � Spectrochimica Acta Part B: Atomic Spectroscopy 56 2001 795�806 801
Ž . Ž .Fig. 7. Microscope pictures of penetration hole left and section of the penetration channel right after 450 laser shots, pulseenergy 55 mJ.
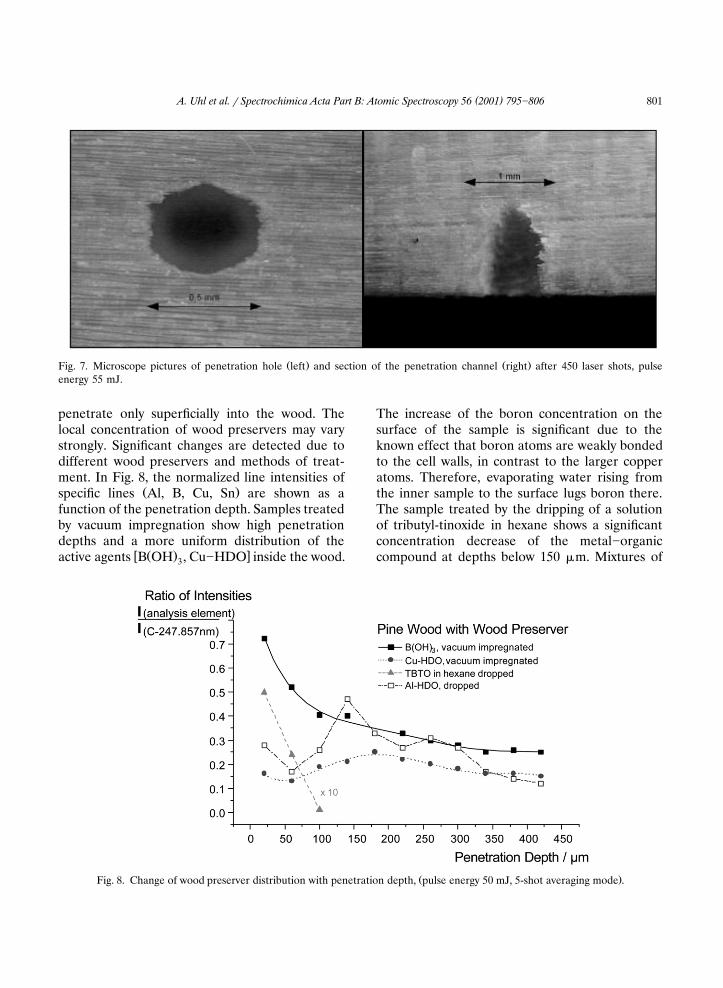
penetrate only superficially into the wood. Thelocal concentration of wood preservers may varystrongly. Significant changes are detected due todifferent wood preservers and methods of treat-ment. In Fig. 8, the normalized line intensities of
Ž .specific lines Al, B, Cu, Sn are shown as afunction of the penetration depth. Samples treatedby vacuum impregnation show high penetrationdepths and a more uniform distribution of the
� Ž . �active agents B OH , Cu�HDO inside the wood.3
The increase of the boron concentration on thesurface of the sample is significant due to theknown effect that boron atoms are weakly bondedto the cell walls, in contrast to the larger copperatoms. Therefore, evaporating water rising fromthe inner sample to the surface lugs boron there.The sample treated by the dripping of a solutionof tributyl-tinoxide in hexane shows a significantconcentration decrease of the metal�organiccompound at depths below 150 �m. Mixtures of
Ž .Fig. 8. Change of wood preserver distribution with penetration depth, pulse energy 50 mJ, 5-shot averaging mode .

( )A. Uhl et al. � Spectrochimica Acta Part B: Atomic Spectroscopy 56 2001 795�806802
agents, dissolved in aliphatic and aromatic hydro-carbons are distributed inhomogeneously. It isassumed that distribution depends on the struc-ture of the wood.
3.2. Quantitati�e analysis
Quantitative analysis requires a calibration ofthe system using wood with a known concentra-tion of active agents. The standards were pro-vided by Bundes forschungsanstalt fur Forst- und¨
Ž .Holzwirtschaft BFH . The measurement of thesestandards allows a correlation between the inten-sity of a spectral line and the concentration of thecorresponding element. A calibration for 13 ele-ments has been performed.
The example in Fig. 9 shows the calibrationcurve for the determination of the boron content.Best results for quantitative evaluation were ob-tained using the boron line at 249.773 nm, showinga linear dependence on the concentration. Theuse of ratio of intensity with the carbon line at247 nm as an internal standard increases theanalytical resolution. An additional sector of thespectrum shows the intensity of the selected lineat a concentration of 195 ppm boron in compar-ison with untreated wood.
The analysis of the calibration curves is usedfor the selection of analytical lines and for an
Ž .estimation 3�-criterion of the current detectionŽ .limit of the system see Table 1 . The sensitivity
depends on the number of laser shots; a volumeof 10�7 cm3 is analyzed per shot, and may beincreased by the accumulation of more than oneplasma emission on the CCD-array. Inorganicsalts and metal�organic compounds were de-tected within a measuring limit of a few ppm. Forall inorganic wood preservers except mercury, thelimits demanded by German legal regulations re-
Ž .spectively recommendations LAGA, RAL wereachieved. Organic preservers were only de-tectable indirectly, referring to their functionalgroups. Those containing phosphor were detectedin the range of hundreds of ppm.
Organic substances containing halogens weredetected in the percentage range. A better sensi-tivity was expected after the present experimentto extend the measuring range of the system tothe VUV-region to detect the stronger resonantchlorine lines below 200 nm and the use of pro-tected gas. Another possibility is the improvementof the sensitivity of the optical unit in the NIR-
Žregion red enhanced photo cathode or the pure.CCD-chip to use the Cl-lines near 835 nm.
ŽFig. 9. Calibration plot for Boron in wood, averaging of five measurements on different spatial spots each of the five: on-chip.addition of 10 shots in the same spatial spot .

( )A. Uhl et al. � Spectrochimica Acta Part B: Atomic Spectroscopy 56 2001 795�806 803
Table 1Element-specific detection limits in wood
Element Limit by legal regulation resp.Detection limit�ppmrecommendation�ppmSingle Multiple
measurement measurementŽ .20 shots
Al 18 3.3 �aAs 15 2.7 4aB 1.5 0.3 70bCd 1.6 0.5 3aCr �1 �1 40aCu 1.8 0.3 30
aHg 19 4.6 0.3K 3.5 0.7 �
Mg �1 �1 �
Na �1 �1 �bPb 8.4 0.6 30
Si 5.3 1.0 �
Sn 8.2 2.2 �
a LAGA recommendation 11�97.bRAL regulation 1998.
The precision and accuracy of the quantitativeanalysis depends on the laser spark pulse to pulsefluctuation and the degree of deviation of thesample from the focal spot. It can be improved byincreasing the signal integration time with respectto the number of accumulated laser shots. The
Ž .measuring head used see Section 2 permitsmeasurements within a larger depth of focus,because the exciting laser beam is guided withinthe optical axis of the detecting mirror system.For precise quantitative results, however, thefluctuation of the measuring distance must notexceed �4 mm.
The reproducibility and accuracy of the quanti-tative measuring values is mainly influenced bythe homogeneity of the samples. Big changes inlocal concentration of agents may occur due tothe inhomogeneity of the wood matrix, washing-out effects, type of wood preserver and type oftreatment. For that reason, quantitative single-shot data analysis is not useful for obtainingaccurate results.
A scan along the surface show typical S.D.between 25 and 50%, though even 20 laser shotswere added on-chip for a single measurement.The histogram in Fig. 10 shows the strong localvariation of the agent for a local resolution of
Ž .�0.5 mm diameter of laser beam focus . The
Fig. 10. Distribution of measuring values for completely im-pregnated wood, single measurement: 20-shot averaging modein same spatial spot.

( )A. Uhl et al. � Spectrochimica Acta Part B: Atomic Spectroscopy 56 2001 795�806804
sample was treated by vacuum impregnation,causing the expectation of a more homogeneousdistribution than for a sample treated on thesurface only.
Averaging over several measurements along thesurface does a fast and simple determination ofthe total contamination.
These multiple measurements give an appropri-ate result for the average contamination of thewood, even if the concentration changes locally.
The histogram shows a good agreementbetween the measured average value and thevalue, given by the weight of the substance. Theerror is between 5 and 10%.
In comparison to this method, the classicalanalytical methods require time-consuming inves-tigations on various drilling samples. Here, errorscan occur even at the sample collection.
3.3. Field measurements
Different field measurements were done to testthe development system in practice, in wood andhousehold recycling facilities, landfill sites andduring the controlled destruction of a building.The experiments were controlled by BFH, INTE-
CUS Dresden GmbH and Institut fur Abfall- und¨Abwasserwirtschaft Munster.¨
The detection of inorganic wood preservers wasperformed without problems. Besides, samplescontaining chromium�copper�boron mixtures indifferent concentrations, only a few samples withadditional As or Hg contamination, were found.The wood from the destructed building was char-acterized by a higher concentration of Pb. Typi-cally, the measurements were performed by on-
Ž .chip multi-shot averaging 10�20 shots in thesame spatial spot.
Very dirty samples, as well as surfaces withcolor residues, required a higher number of laserclean pulses to reduce errors in the determinationŽdetection of C-line as parameter for end of
.cleaning . Samples with strong washing-out ef-fects required an additional spatial averaging ofseveral measurements along the wood surface toobtain a reliable average value for the contamina-tion.
The data of approximately 500 samples fromhousehold waste and building rubble gave statisti-cal results. Control measurements by classicallaboratory analysis were performed by time-con-
Ž .suming extracting drilling samples of 3 mm in
Fig. 11. Error distribution function for boron concentration in comparison with ICP-AES, 20-shot averaging mode in same spatialspot.

( )A. Uhl et al. � Spectrochimica Acta Part B: Atomic Spectroscopy 56 2001 795�806 805
the same investigated areas. This kind of samplepreparation is due to German regulationsŽ .LAGA , describing a sample as contaminatedwhen it exceeds a certain concentration of con-taminants within a thickness of 3 mm.
In comparison to ICP-AES, the concentrationsdetermined by LIBS appear, generally, too high.This deviation is due to the decrease in concen-tration of active agents and the small penetratingdepth of a few tenths of a millimeter by LIBSŽ .Fig. 8 .
The error distribution of boron-detection isshown in Fig. 11. The dark bars show the errordistribution of the LIBS values in comparison tothe ‘true’ ICP-AES values. The calculated Gauss-
Ž .ian distribution dotted line features a shift ofmaximum to positive values.
The use of a correction factor reduced thesystematic error as well as the error scatteringŽ .bright columns . This factor describes the de-crease of concentration of the active agent to themiddle of the wood, resulting in an adaptation ofthe measuring procedure to officially demanded
Ž .procedures LAGA . In the same way, statisticallyproven correction factors are defined for otherelements.
Fig. 12 shows the frequency of the Pb-con-tamination in used timber determined by ICP-AES and LIBS. Using the depth profile correc-tion, a good agreement between these two meth-ods is obtained.
In parallel, application software was developedfor the automatic analysis of wood, offering auser-definable setting of the concentration limitsand showing samples exceeding the limits auto-matically.
4. Conclusion
Laser-Induced Breakdown Spectroscopy offersnew possibilities for the fast analysis of contami-nated wood. The results shown above prove theapplicability of LIBS for the detection of harmfulagents in the wood matrix. The simultaneous de-tection of almost all elements is performed withina few seconds. The detection limit for inorganicsalts is a few mg�kg. Organic contaminants can
Fig. 12. Frequency of Pb-contamination in used wood byLIBS and ICP-AES, 20-shot averaging mode in same spatialspot.
be detected by their specific functional groups;hence, only a rough classification is possible here.
An analytic evaluation is done without directsample contact and without sample preparation.A reliable evaluation of the degree of contamina-tion is obtained by multiple measurements alongthe surface of the sample.
The use of correction factors led to good agree-ment with ICP-AES results of 3-mm drilling sam-ples.
The applicability of this method in wood pro-cessing and recycling facilities was demonstrated,showing its use as mobile analytical unit as well asa unit for automatic sorting. The universal mea-suring principle realized in the developed system,including an Echelle optics system for real simul-taneous multi-element-analysis, is also open to alot of other applications, e.g. online analysis of
� �minerals in food 12 and the identification ofadditives in plastics.
Acknowledgements
The authors thank the Deutsche Bundess-tiftung Umwelt for financial support.

( )A. Uhl et al. � Spectrochimica Acta Part B: Atomic Spectroscopy 56 2001 795�806806
References
� �1 DIN 52161-07-A, Nachweis von HSM im Holz-Bestim-mung des Gehaltes von Kupfer- und ChromhaltigenHSM, NMP im DIN, NA-Holz im DIN, 1985
� �2 W. Butte, G. Walker, The determination of wood pre-serving agents on the surface of wood by gas chromatog-raphy-mass-spectrometry, Fresenius J. Anal. Chem. 343Ž .1992 , 144.
� �3 W.J. Homan, H. Militz, Evaluation of rapid methods fordetecting of wood preservatives in waste wood, on 25thAnnual Meeting of International Research Group on
Ž .Wood Preservation, IRG�WP 50024, 9 S 1994 .� �4 M. Vogt, P. Kehrbusch, Die Rontgen-Fluoreszenz-¨
Analytik zum Nachweis von Chlor und Schwermetallenin Holz-Erfahrungen in Labor und Feldtest in: R.
Ž .Marutzky, M. Bahadir Eds. , Bestimmung vonHolzschutzmitteln in Gebrauchtholz, WKI-Bericht Nr36, 2000.
� �5 H. Moenke, L. Moenke, Einfuhrung in die Laser-¨Mikro-Emissions-spektralanalyse, Akadem, Verlagsge-sellschaft Geest & Portig K.-G, Leipzig, 1968.
� �6 K. Laqua, Analytical spectroscopy using laser atomizersŽ .in: N. Omenetto, J.D. Winefordner Eds. , Chemical
Analysis Series, Vol. 50, Ch. 12, John Wiley & Sons,New York, 1979, p. 47.
� �7 E.H. Piepmeier, Analytical applications of lasers in: J.D.Ž .Winefordner Ed. , Chemical Analysis, Chapter 87, John
Wiley & Sons, New York, 1986, p. 627.� �8 L. Moenke-Blankenburg, Laser microanalysis in: J.D.
Ž .Winefordner Ed. , Chemical Analysis, Chapter 105,John Wiley & Sons, New York, 1989, p. 36.
� �9 S. Florek, H. Becker-Ross, J. Mohr, H.-J. Dobschal,Optisches System fur Echelle-Spektrometer, Patent DD-¨AP 226 962.
� �10 S. Florek, H. Becker-Ross, T. Florek, Adaptation of anEchelle spectrograph to a large CCD detector, Frese-
Ž .nius J. Anal. Chem. 355 1996 269�271.� �11 A. Unger, Holzkonservierung, Fachbuchverlag, Leipzig,
1988.� �12 K. Lobe, H. Lucht, B. Handreck, J. Dorfer, On-line¨ ¨
Mineralstoffanalyse von Weizenkornern und -mehlen¨mittels laserinduzierter Plasmaspektroskopie, Getreide
Ž .Mehl und Brot 51 1997 131�136.