Embed Size (px)
Citation preview

Fifth International Symposium on Space Terahertz Technology Page 91
FANATIC: AN SIS RADIOMETER FOR RADIO ASTRONOMY IN THE
660-690 GHz BAND
A.I. Harris', K.—F. Schuster", K.—H. Gundlach 2 , and B. Plathner2
' Max Planck Institute for extraterrestrial Physics,
Postfach 1603, D-85740 Garching, Germany
harris©fcrao1.phast.umass.edu
2IRAM, 300 rue de la Piscine, Domaine Universitaire de Grenoble,
F-38406 St. Martin d'Heres Cedex, France
schusterairam.grenet.fr
ABSTRACT
FANATIC is a compact radiometer optimized for radio astronomy from about 660 to
690 GHz (AA 455 435 ym). We observed a large number of molecular and atomic spectral
lines from galactic and extragalactic sources during FANATIC 's first run on the James
Clerk Maxwell Telescope in early March 1994. Double sideband receiver temperatures
during observations were about 800 K (25 hvik). The heart of the receiver is a two-
junction Nb/A10 x /Nb SIS array fed by a sandwiched V-Antenna. The junction array and
antenna are fabricated together at 'RAM's Grenoble SIS laboratory. Each junction has a
normal resistance of Rri 10 12, an area of 2 pm 2 , an individual radial stub circuit to
resonate the capacitance, and a A/4 transformer to match to the antenna. The solid-state
local oscillator is a mm-wave Gunn oscillator followed by a doubler and tripler. The LO
diplexer is a Martin—Puplett interferometer, which insures that there is always abundant
LO power for operation and speedy tuning. The receiver and telescope coupling optics, LO,
dewar, and calibration system fit on an 0.6 x 0.8 m optical breadboard.
1 INTRODUCTION
Radio astronomy, with its constraints of limited observing time and very weak signals, has
benefitted greatly from the decreases in noise temperatures provided by SIS mixers. SIS

Page 92 Fifth International Symposium on Space Terahertz Technology
(Superconductor-Insulator-Superconductor) tunnel junction mixers have replaced Schottky
diode mixers for most radio astronomical applications at millimeter wavelengths, and they
are now spreading rapidly on to telescopes at the high end of the submillimeter band [1-5].
We have constructed an SIS mixer receiver, named FANATIC, that has now replaced
our Schottky diode mixer facility receiver at the James Clerk Maxwell Telescope in Hawaii
[6]. FANATIC is a compact radiometer optimized for radio astronomy from about 660 to
690 GHz (AA 455 — 435 ym). This frequency range lies within the second highest atmos-
pheric window at submillimeter wavelengths. This window includes many astrophysically
important transitions, including lines from isotoporners of the CO molecule (C 18 0, 13CO3
and CO J = 6-5) as well as the more density-sensitive CS J = 14-13 and H 13CN J = 8-7
lines.
2 RADIOMETER LAYOUT
2.1 Mixer and Cryostat
Design considerations for the mixer, its tuning structure, and the fabrication have been
recently been described [1,7] so we give only a synopsis here. The mixer is a two junction
SIS tunnel junction array fed by a sandwiched V-Antenna. The junction array and antenna
are fabricated together at IR.AM's Grenoble SIS laboratory on a 0.4 mm thick piece of fused
quartz that is sandwiched between 3 mm thick sub- and superstrates. Eckart et al. [8] found
that air gaps within the sandwich bigger than A/300 (1.4 pm at 690 GHz) generate surface
waves that degrade the antenna performance, so all of the quartz pieces are optically flat
and are clamped together without films of glues or oils. Beam profiles show no trace of fine
structure that would indicate surface waves. While not the optimum antenna for a current
new development, the V-antenna is in fact fairly reasonable (comparable to a smooth wall
conical horn), and it is certainly suitable for a developmental system.
Each of the Nb/A10,/Nb junctions in the array has a normal resistance of R, 10 Q,
areas of 2 p,m 2 , a short length of transmission line terminated in a radial stub to resonate
the capacitance, and a A/4 transformer to match to the antenna (Fig. 1). The transforma-
tion is made for the optimum power match, as is appropriate at these frequencies [1,7,9].
Fifth International Symposium on Space Terahertz Technology Page 93
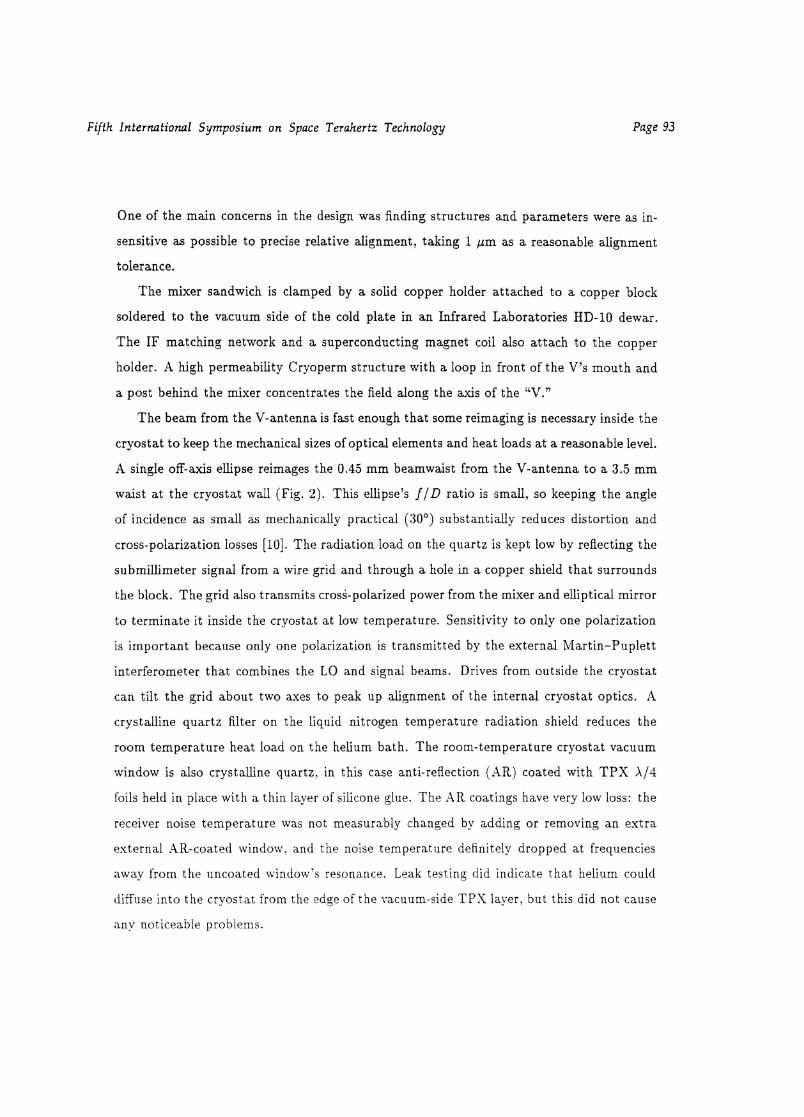
One of the main concerns in the design was finding structures and parameters were as in-
sensitive as possible to precise relative alignment, taking 1 pm as a reasonable alignment
tolerance.
The mixer sandwich is clamped by a solid copper holder attached to a copper block
soldered to the vacuum side of the cold plate in an Infrared Laboratories HD-10 dewar.
The IF matching network and a superconducting magnet coil also attach to the copper
holder. A high permeability Cryoperm structure with a loop in front of the V's mouth and
a post behind the mixer concentrates the field along the axis of the "V."
The beam from the V-antenna is fast enough that some reimaging is necessary inside the
cryostat to keep the mechanical sizes of optical elements and heat loads at a reasonable level.
A single off-axis ellipse reimages the 0.45 mm beamwaist from the V-antenna to a 3.5 mm
waist at the cryostat wall (Fig. 2). This ellipse's f D ratio is small, so keeping the angle
of incidence as small as mechanically practical (30 0 ) substantially reduces distortion and
cross-polarization losses [10]. The radiation load on the quartz is kept low by reflecting the
submillimeter signal from a wire grid and through a hole in a copper shield that surrounds
the block. The grid also transmits cros g-polarized power from the mixer and elliptical mirror
to terminate it inside the cryostat at low temperature. Sensitivity to only one polarization
is important because only one polarization is transmitted by the external Martin—Puplett
interferometer that combines the LO and signal beams. Drives from outside the cryostat
can tilt the grid about two axes to peak up alignment of the internal cryostat optics. A
crystalline quartz filter on the liquid nitrogen temperature radiation shield reduces the
room temperature heat load on the helium bath. The room-temperature cryostat vacuum
window is also crystalline quartz, in this case anti-reflection (AR) coated with TPX A/4
foils held in place with a thin layer of silicone glue. The AR coatings have very low loss: the
receiver noise temperature was not measurably changed by adding or removing an extra
external AR-coated window, and the noise temperature definitely dropped at frequencies
away from the uncoated window's resonance. Leak testing did indicate that helium could
diffuse into the cryostat from the edge of the vacuum-side TPX layer, but this did not cause
any noticeable problems.
Page 94 Fifth International Symposium on Space Terahertz Technology
Radio-frequency interference pickup is a potential hazard with an open structure mixer,
which has poorly shielded input terminals at the front of the entire IF system. The optical
entrance into the dewar accordingly includes of a long aluminium tube that is fixed to the
outer wall. This tube is sized to yield more than 100 dB attenuation at the high end of the
IF band. All electrical leads pass through standard bulkhead RF filters that are soldered
to brass houses below each of the hermetic seals on the dewar top plate. The mixer DC
bias preamplifier is in a small aluminium box permanently mounted on the dewar, and the
control signals to and from the rest of the bias electronics are at volt levels. The dewar case
is a very good electrostatic shield, and magnetic pickup is minimized by using a twisted pair
of twisted pair wires for the conventional four point bias circuit. These precautions solve
all pickup problems except occasional flux trapping in one or the other of the junctions
when motors switch on near the receiver. Warming the junctions for about 15 seconds with
a small heater inside the mixer block solves this problem, however.
The cryogen hold time is adequate for our needs: 16 hours with the first IF amplifier
switched on and 36 hours with it switched off.
2.2 Optical and Mechanical
The optical train matches the 3.5 mm bearnwaist at the cryostat wall to the 11.8 mm waist
necessary to illuminate the telescope properly, provides the diplexer for the LO and signal,
and matches the LO horn's 0.77 mm waist to cryostat's beamwaist. Insensitivity to exact
beamwaist sizes — a fundamental Gaussian beam analysis is certainly only approximate
for the V-antenna — and the small LO beamwaist are the main drivers for magnification in
stages. The beam from the dewar is refocussed by a second off axis elliptical mirror to make
a 6 mm beamwaist near the mean center of the diplexer. A third off-axis mirror reimages
this intermediate bearnwaist to make the 11.8 mm beamwaist required to produce a 13 dB
telescope edge taper. The second and third mirrors are separated by approximately the
sum of their focal lengths (nearly a Gaussian telescope) as this reduces the sensitivity of
the output against small changes in beamwaist sizes, locations, and mirror positions. The
6 mm beamwaist in the diplexer is just big enough to keep the diplexer loss low, but is
still reasonable in terms of matching the LO beam. Lowest possible loss in the LO arm
Fifth International Symposium on Space Terahertz Technology Page 95
was not a design driver, and a moderate amount of mismatch due to frequency dependence
or errors in the large magnification ratio between the horn and intermediate beamwaist is
acceptable. The third mirror is pinned in place for accurate relocation. It can be removed
easily to let the beam go straight from the diplexer through an ambient chopper wheel and
into a liquid nitrogen load for tuning. When the third mirror is in place the beam from
the diplexer reflects vertically to the fourth and final mirror, a flat at the height of the
telescope's elevation bearing. This flat bends the beam horizontally through a hole in the
bearing and has fine adjustments for tilt and height to precisely coalign the receiver's beam
with the telescope's optical axis.
The Martin—Puplett interferometer diplexer that combines the LO and sky signals con-
siderably simplifies receiver operation. Tuning is fast because the LO chain need not be
tuned to optimum points with several interacting LO adjustments, but just close enough
to produce sufficient power. With the high efficiency optics, tuning is limited by the Gunn
diode's tuning limits. The main penalty is somewhat decreased optical transmission away
from band center, with a power coupling efficiency of
1 , Ay )177 -2- [ 1. + cos ( —ir (1)
vIF
when the diplexer is set to the minimum distance that couples both sidebands and the LO
(A/4 one-way path difference). For our viF = 1.5 GHz IF center frequency, the maximum
loss, at Av = ±500 MHz from band center, is a factor of 1.33 (1.25 dB). In a practical
sense we compensate for much of this loss by being able to work more efficiently when the
weather is good at the telescope.
Although the V-antenna produces a mostly Gaussian beam, it is only approximately so,
and some fraction of the power is in modes that might not couple properly to the calibration
loads or telescope. We need to constrain and characterize the beam distributions at the
calibration loads, telescope focus, and on the sky to insure that we properly calibrate our
astronomical data. One of useful effects of the optics in this respect is that it serves as a kind
of spatial filter to clean up the beam from the receiver, diffracting out higher modes that
would not couple to the telescope before they reach the calibration system. Counting this
spatial filtering effect, we measured the optical train's transmission efficiency by placing a
50% transmission beamsplitter directly in front of the dewar and measuring the total power

[ 2AzL, Ito
where
V21n2eb
tv =
Page 96 Fifth International Symposium on Space Terahertz Technology
with a large cold load; and then by moving the same beamsplitter in front of the calibration
load, readjusting the LO attenuator to give the same operating point, and measuring the
new power level from the cold load. This method gave a coupling efficiency of 0.8, which
includes mode mismatch, power lost to scattering from wide-angle sid.elobes, and all other
losses.
By the time the beam leaves the receiver, the power is consequently in a well defined
Gaussian beam with some power still in a larger scale beam. We decomposed the beam
power distribution into a few Gaussian components by measuring the peak power change
from a family of liquid-nitrogen temperature disks with known diameters. The power coup-
ling efficiency 77 of a Gaussian beam of power FWIiM 91, centered on a uniform temperature
disk source of diameter D is
77 I - e_2 /02 . (2)
At the telescope it is unusual that a range of planets is available, so it is useful instead
to vary the coupling by changing the center-to-center distance between the beam and a
planet. When the beam and disk are not concentric the coupling efficiency is reduced by a
weighting factor w(s), normalized so 7/.7(0) = 1:
2ae- CeS2 fR e- ar2 I0 (2asr) rdrw(s) = 0
e--ceR2
where a = 41n 2/0?, R is the disk radius, and lo is a zero-order modified Bessel function of
the first kind.
In the general case of a beam with i components of FWHM G i and peak power amplitude
a i (the integrated power in a given beam is a9/ a i 8?) the equation for coupling is:
= Ei at9? E i a, 0,
Fitting the measured data with Eq. 4 produces good estimates for the beam FWIIMs 0b,
and those can in turn be used to derive the beamwaists from
(3)
(4)

Fifth International Symposium on Space Terahertz Technology Page 97
As a final step, we estimate the edge taper Te (in dB) for a telescope with f-ratio f D from
the approximate expression
Te = (4.63 wo—D -1 ) 2 . (7)f A
We centered disks with diameters up to 150 mm in the beam at distance z = 3400 mm in
the laboratory to find that 70% of the power has the distribution that produces a 10.3 dB
taper, with the remaining 30% in a very wide angle beam. Figure 3 is a plot of the data
and theoretical curves. It is worth noting that it would be hard to find the large scale
beam with a small load because '77 is small in this case; large loads are needed to find the
large-scale beams. This is of course a scalar measurement, but the agreement with the
design beamwaist size after passage through the optical train is a good sign that the phase
fronts are well behaved.
The cryostat, optical, and LO subassemblies are attached to a 0.6 by 0.8 meter com-
mercial optical breadboard table mounted at the right Naysmith focus port of the JCMT.
A computer-controlled calibration system with a hot load and ambient chopper for cali-
brating receiver gain and atmospheric transmission is mounted in the beam just above the
receiver. A half-height rack nearby contains bias and control electronics and an IF receiver
for tuning.
2.3 Local Oscillator, Intermediate Frequency, and Backend Systems
The local oscillator itself is from Radiometer Physics in Meckenheim, and consists of a
115 GHz Gunn diode oscillator that drives a doubler and then tripler. The oscillator tunes
from 659 to 695 Gliz with tens of microwatts of power. The phase lock is a STS-800 module
connected with a Pacific Millimeter Products model WM 115 GHz harmonic mixer and a
HP-8671B frequency synthesizer that provides both the microwave signal for the harmonic
mixer and a 100 MHz reference signal for the phase lock loop. A rotatable grid between
the LO and diplexer is a variable attenuator for the mixer power level. Typical attenuation
levels are around 10 dB. A more elegant solution would have been to vary the bias voltage
on the tripler to change the LO chain's output power level electrically.
The IF signal is brought off the mixer contact pads with an unbalanced circuit: one
side of the -V" is connected to the mixer block and the other is connected to a A/4 IF
Page 98 Fifth International Symposium on Space Terahertz Technology
transformer. This is a historical holdover, and a balanced IF connection would certainly
be better here [n]. Although the dimension of the antenna is small compared with an IF
wavelength, the unbalanced connection makes the impedance match somewhat indetermi-
nate by allowing currents to flow to the outside of the mixer block. This is analogous to
attempting to make a short circuit by connecting the center conductor of a coax cable to
the shield with a wire. No matter how short the wire, the open end of the cable allows
currents to be excited on the electrically long outside of the shield. This allows changes
far from the end to influence the current distribution, preventing the circuit from being an
unambiguous good short.
A short length of coaxial cable brings the signal to a Berkshire Technology 40 dB HEMT
amplifier on the helium cold plate. Berkshire provided an integral bias tee for the mixer in
the amplifier. We do not use an isolator because it would limit the bandwidth, so the IF
matching network in the mixer is the only component that sets the source impedance for
the HEMT amplifier. The next amplifier is a low noise Miteq room temperature module
with 37 dB gain on the outside of the dewar. A subsequent mix to 4.6 GHz permits us to
use a 4-8 GHz IF receiver for tuning, minimizes RFI from other signals at the observatory,
and separates the overall system gain in frequency. The signal is sent down a 50-foot
long coaxial cable to another IF converter, which converts the band center to 2.2 Gliz
for the ba..ckend spectrometer. MI IF components are on thick aluminium plates that are
weakly thermally coupled to the external environment for temperature sta,bilization. The
spectrometer is a University of Cologne 1.2 GHz-wide acousto-optical spectrometer with
1.6 MHz noise bandwidth per channel. We enclosed it in a case whose temperature is
stabilized by circulated heated water for operation in the observatory dome.
3 PERFORMANCE AT THE TELESCOPE
3.1 Internal Measurements
The lower pair of curves on Figure 4 are plots of the mixer junction DC current vs. DC
bias voltage with and without the optimum level of local oscillator power. The Josephson
currents have been suppressed with a magnetic field, and the lack of structure shows clearly
Fifth International Symposium on Space Terahertz Technology Page 99
that the photon energies are slightly larger than the gap energy. The upper pair of curves
are the IF power vs. DC bias voltage for ambient and liquid nitrogen temperature black
body loads. These curves are smooth and free of fine scale peaks that might indicate
magnetic field effects.
The m-shaped curve at the top of Fig. 4 is the IF signal-to-noise ratio: the AC-detected
signal divided by the averaged DC signal by an analog ratioing circuit in an Ithaco 391A
lock-in amplifier. This curve is reasonably flat away from the Shapiro steps, showing that
the exact DC bias voltage point is not very critical. The analog ratioing, the insensitivity
to exact bias, and an abundance of LO power allows us to rapidly tune the receiver to
optimum.
The noise temperature across the tuning band is shown in Figure 5. The curve is smooth
and reproducible; these particular data are typical results from careful but not exceptional
tunings made on the last night at the telescope. The noise temperature is about 800 K
( DSB) at band center (25 hv/k), rolling smoothly up to both higher and lower frequencies
but remaining below 1000 K over almost the entire 660-690 GHz band.
We made all of these measurements with a liquid nitrogen cold load of diameter 70 mm
located 500 mm beyond the diplexer's nominally 6 mm beamwaist. We measured the
ambient temperature (5° C) and corrected the liquid nitrogen temperature to 73 K because
of the high altitude (the pressure at the telescope is about 0.6 that at sea level). The
noise temperature is averaged over the central 500 MHz of the passband, band-limited and
measured with a carefully linearized detector system in the 4-8 GHz tuning receiver.
Figure 6 shows the variation of noise temperature across the 1 GHz wide IF band, in
this case measured with the acousto-optical spectrometer and the 80° C hot load in the
computer-controlled calibration system used during observations. The noise increase at the
ends of the superposed astronomical spectrum's baseline (light lines) shows that the effect
of the noise rollup near the band edges is acceptable.
Following custom, these receiver temperatures are Rayleigh-Jeans limit temperatures
and do not include higher terms. A second order expansion of the Planck equation gives a
modified version of the standard Y-factor equation,
TH — Tc htiTr ec
1 + 2k (8)

Page 100 Fifth International Symposium on Space Terahertz Technology
where TH, Tic, and Y have their usual meanings of the physical temperatures of the hot
and cold loads and the power detector's voltage ratio Y = V(TH)/V(Tc) for the two loads.
At 690 GHz, hv/2k = 16.6 K, which is not a large correction.
Although it is difficult to be quantitative at present, the main limit on noise temperature
for the present design seems to be some kind of instability noise. The receiver is certainly
stable at the gross level, judging from total power strip chart records and the system Allen
variance time of about 30 sec, but this is shorter than the Schottky system's 100 sec and
there are occasional steps in total power for no obvious reason. Some low-level instability
may come from some interaction between the two not mixers in the array
or a lack of simultaneous cancellation of Josephson effects in the two junctions. The IF
noise power does depend on the magnetic field strength, but there is a large range of field
that has a relatively weak effect on the IF SiN ratio measured with the ratioing circuit. It
is also possible that the source impedance presented by the mixer and matching circuit is
unfavorable for the first IF amplifier's stability.
Physical temperature effects on noise temperature are weak. Although the gap voltage
increased slightly, the sub-gap current decreased, and the corner sharpened somewhat,
the 690 GHz noise temperature changed by only 10-15% when the liquid helium bath
temperature was reduced from 4.2 K to 1.6 K. The improvement was somewhat larger for
the poorer junctions in the sample, but never brought them to the performance of the best
junctions.
3.2 Characterizations with Astronomical Measurements
Spectral line observations of astronomical sources are the cleanest test of the overall system.
We observed sources we had previously observed with the Schottky system to cross-check
the intensity scales, and found agreement within 10%. This agreement in relative calibra-
tion shows that the system is either very well behaved or so fiendishly pathological that it
i mitated normal behavior on our test sources. For one, the agreement showed that "bolo-
metric" effects are completely absent, as one would expect from the smooth IF power vs.
DC bias curve. For another, the receiver must be double balanced at at least the 691.5 GHz
line frequency. This was theoretically expected from the mixer tuning structure design and

Fifth International Symposium on Space Terahertz Technology Page 101
is also suggested experimentally from the smooth tuning curve. Figure 7 shows a more
direct measurement, the CO J=6-5 line from Orion observed with the LO both and below
the line. The excellent agreement in intensities (no baseline corrections have been made)
with a calibration scheme that assumes equal sideband gains is a nearly positive indication
that the receiver is very closely double sicleband.
The beam distribution is somewhat better than the Schottky system's, and is still
heavily influenced by telescope surface errors. We derived the beam distribution on the
sky by observing Jupiter (which is a uniform temperature disk to good approximation) at
a number of angular offset to vary its coupling to the beam, and then fitting the data to
Eq. 4. Figure 8 is a plot of the measured data with the theoretical curve derived from
Eqs. 3 and 4. This shows that 40% of the power in the 8" FWHM "diffraction" beam and
the remaining 60% is in a 25" beam produced by mid-scale antenna surface errors.
4 CONCLUSION
There is no better conclusion for a paper about a radio astronomical radiometer than to
present astronomical data, and Fig. 9 is just that: a map of the Orion outflow made during
part of a night of moderate weather. The dramatically increased sensitivity with FANATIC
made the March 1994 observing run one of the most astronomically fruitful runs we have
had. There are obviously several avenues of improvement possible for FANATIC. Chief
among these are improving the optical coupling. The V-antenna was certainly a good
choice historically, but fabrication techniques at these frequencies are also maturing fast,
and retrieving the efficiency and background factors of 0.8 in the optics and 0.7 in the beam
distribution would drop the present receiver temperature from 800 K to 350 K. Further
improvements in AR coating the cold transmission optics and IF matching would drop the
receiver temperature well below 10 hv/k. Now that the noise temperatures are dropping
rapidly, and given the possibility of arraying mixers that need only little LO power, high
frequency ground-based submillimeter line astronomy will certainly develop rapidly in the
next few years.

Page 102 Fifth International Symposium on Space Terahertz Technology
5 ACKNOWLEDGEMENTS
We thank M. Carter and J. Lamb for their help with the AR coating on the dewar vacuum
window, and are very grateful to U. Graf and the University of Cologne mechanical shop
for fabricating the large off-axis mirrors. L.J. Tacconi and L. Avery worked very hard in
preparations and at the telescope to make the March run a success. The assistance from
P. Friberg and the JCMT day crews and staff was, as always, outstanding. This project
would not have been possible without the support and encouragement of R. Genzel.
6 REFERENCES
[1] K.-F. Schuster, A.I. Harris, and K.-H. G-undlach 1993, "An SIS Receiver at 690 GHz,
Internat. J. IR and mm Waves 15, 1867
[2] J. Zmuidzinas, H.G. LeDuc, J.A. Stern, and S.R. Cypher 1994, "Two junction Tuning
Circuits for Submillimeter SIS Mixers," IEEE Trans. Microwave Theory Tech. 42, no 4
[3] J.W. Kooi, C.K. Walker, H.G. LeDuc, P.L. Schaffer, T.R. Hunter, D.J. Benford, and
T.J. Phillips 1994 "A Low Noise 665 GHz SIS Quasi Particle Waveguide Receiver,"
Internat. J. IR and mm Waves 15, 477
[41 M. Salez, P. Febvre, W.R. McGrath, B. Bumble, and H.G. LeDuc 1994, "An SIS Wave
guide Heterodyne Receiver for 660-635 Calz, Internat. J. IR and mm Waves 15, 349
[5]J. Mees, S. Crewell, H. Nett, G. de Lange, H. van de Sta,dt, J.J. Kuipers, R.A. Panhuyzen,
"An Airborne SIS Receiver for Atmospheric Measurements at 630 to 720 GIlz," these
Proceedings
[6]A.I. Harris, D.T. Jaffe, J. Stutzki, and R. Genzel 1987, "The UCB/MPE Submillimeter
Heterodyne Spectrometer," Internat. J. IR and mm Waves 8, 857
[7] K.-F. Schuster 1993, "Submillimeterspektroskopie in der Umgebung junger Sterne und
Entwicklung eines 690 GHz SIS-Empfangers," Ph.D. Thesis, Ludwig-Maximilians-Uni-
versitat Miinchen

Fifth International Symposium on Space Terahertz Technology Page 103
[8] A. Eckart, A.I. Harris, and R. Wohlleben 1988, "Scaled Model Measurements of the
Sandwiched V-Antenna," Internat. J. IR and mm Waves 9, 505
[9]A.R. Kerr and S.-K. Pan 1990, "Some Recent Developments in the Design of SIS Mixers,"
Internat. J. IR and mm Waves 11, 1169
[10]J.A. Murphy 1987, "Distortion of a Simple Gaussian Beam on Reflection from Off-Axis
Ellipsoidal Mirrors," Internat. J. IR and mm Waves 8, 1165
[11]A.I. Harris, K.-F. Schuster, and L.J. Tacconi 1993, "Broadband IF Matching for Qua-
sioptical Mixers," Internat. J. IR and mm Waves 14, 715

Page 104 Fifth International Symposium on Space Terahertz Technology
Figure 1: Footpoint of the V-Antenna showing the junctions (small squares), resonators,
and transformers. From [1].
Figure 2: Cryostat internal layout, from [1'. a: Mixer: 5: Off-axis Ellipso: r: \Vire grid:
d: Quartz IR filter at 77 K; e: AR-coated vacuum window: f: RH suppression t uho, g: Copper
thermal radiation shield housing; h: 77 K shield.

.6
.4
.2
.11.1111
Fifth International Symposium on Space Terahertz Technology Page 105
.8 a
o 50 100 150Disk diameter
Figure 3: Coupling efficiency of receiver beam to disks of various sizes at z = 3400 mm
(crosses), with best-fit theoretical coupling curve (solid lines: Eq. 4). The dotted lines are
the individual components, showing the importance of measuring large-scale beams with
large loads. 70% of the power is in the smaller beam that couples well to the telescope.
Figure 4: Conversion curves at 690 GHz. The m-shaped curve at the top is the IF signal-
to-noise ratio vs. DC bias voltage.

Page 106 Fifth International Symposium on Space Terahertz Technology
1600
1000
rdg
00
500
660 670 680 690Freq. (Gfizj
Figure 5: DSB receiver noise temperature vs. tuning frequency, averaged over a 500 MHz
IF bandwidth.
1000
0
1.1
cav) 600
01000 1200 1400 1600 1800 2000
IF Frequency EMHzi
Figure 6: DSB receiver noise temperature vs. IF frequency (heavy lines). The light line
spectrum of IRC+10216 shows the effect of increasing noise temperature on the spectral
baselines. The baseline is DC shifted to fit in this plot hut no tilt, or , tructiire ,, have been
removed.

Fifth International Symposium on Space Terahertz Technology Page 107
150 ••••■■■
I I I I I I JI1 1 1 1 1 1 1
691.4 691.5 691.6 691.7Freq. [GHz]
Figure 7: Spectra of the CO J=6-5 line from Orion in both sidebands. The heavy line is
USB (and shows a strong line from the other sideband on its wing); the light line is LSB.
No baseline corrections have been made, and there is a slight frequency shift due to Orion's
9 km/s LSR velocity. The agreement in peak intensity is within 10% and shows that the
receiver is closely double-sideband.
I 1 1 i 1 1 1 I 1 1 1 1 1
-
1-,.8 • • •.8 ISS
.4
.2
0I I 1 I I I 1 1 I 1 I 1 1 1 I
0 5 10 15 20 25 30 35Offset Carcseci
Figure 8: Coupling efficiency of telescope beam to ,Jupiter for different angular offsets. with
best-fit theoretical coupling curve (dashed lines; Eq. 4). Crosses are individual measure-
ments, boxes are the averages. 40% of the power in the 8" FWHN1 "diffraction" beam and
the remaining 60% is in a 25" beam produced by mid-scale antenna surface errors.
891.3

Page 108 Fifth International Symposium on Space Terahertz Technology
Figure 9: Map of the 691.5 GHz CO J=6-5 map in the Orion outflow. Integration time
was 2 min. per point, and no baseline corrections have been made.