Embed Size (px)
Citation preview

Family Firms Bachelor thesis about the performance of Dutch family firms in times of the financial crisis
Author: P.B. Ruesen
ANR: 986724
Institution: Tilburg University
Department: Finance
Supervisor: F. Urzua Infante
Date: May, 2011

1
Abstract Ten family firms listed on Amsterdam Euronext were compared to fifty-five listed non-family firms.
Dutch family firms displayed higher profitability when it came to the performance measures; return on
assets, return on equity and Tobin’s Q. Furthermore, the impact of the financial crisis has been observed.
Family firms seem to have been more vulnerable to the financial crisis than their non-family
counterparts. The negative impact that the financial crisis has had on their performance was relatively
larger than the impact it had on the performance of non-family firms.

2
List of contents
Abstract 1
List of contents 2
Chapter 1 Introduction
§ 1.1 Background 4
§ 1.2 Problem formulation 4
§ 1.3 Definition of a family firm 5
§ 1.4 Data description and structure of this paper 5
Chapter 2 Theoretical background
§ 2.1 Defining a family firm 6
§ 2.2 Strategic advantages of family firms 6
§ 2.2.1 Long-term view 7
§ 2.2.2 Principal – agent theory 7
§ 2.3 Strategic disadvantages of family firms 8
§2.3.1 Opportunistic behavior 8
§ 2.3.2 Family Altruism 9
§ 2.4 Evidence on the performance of family firms versus non-family firms 9
Chapter 3 Methodology
§ 3.1 Sample and data resources 11
§ 3.2 Family firm variable 13
§ 3.3 Crisis-years variable 13
§ 3.4 Performance variables 13
§3.4.1 ROA 13
§ 3.4.2 ROE 14
§ 3.4.3 Tobin’s Q 14
§ 3.5 Control variables 14
§ 3.6 Descriptive statistics 15

3
Chapter 4 Empirical findings
§ 4.1 Regression analysis 18
§ 4.2 Endogeneity 21
Chapter 5 Conclusions and limitations
§ 5.1 Discussion and conclusions 22
§ 5.2 Limitations 23
References 24
Appendices 28

4
Introduction CHAPTER 1
§ 1.1 Background
Every year the Dutch business-magazine Management Team1 publishes a list of the fifty “best” family
firms in the Netherlands. It states that family firms form an extraordinary category in the Dutch
economic landscape because of their unique long-term vision. Levie and Lerner (2009) find evidence in
favor of this statement in their research on family firms in the United Kingdom. According to their
observations many family firms capitalize on reciprocal altruism to work successfully together, to build
strong relationships with their stakeholders and to preserve or build the long-term reputation of the
business. But there is not just good news about family firms. Poza, Handlon and Kishida (2004) find that
nepotism, opportunistic behavior and utility maximization by management are also common in family
firms. When there is active family-control, conflicts of interest can arise between minority shareholders
and the controlling family. Families might have concerns and interests of their own that may not align
with the interests of other investors of the firm.
Whether family firms are more or less valuable than non-family firms remains an open question.
Among large U.S. corporations, Holderness and Sheehan (1988) find that family firms have a lower
Tobin’s Q than non-family firms. Anderson and Reeb (2003) on the other hand find in their research on
family owned firms listed on the S&P 500 index that family firms are not only substantially represented
on the market, but they also outperform non-family controlled firms.
The current financial crisis started around February 2007 and has had large impact on corporations
all around the world. It is widely held that one of the contributing factors to the current financial crisis
was the short-term view of corporate managers and investors. Since literature suggests that family firms
have a long-term vision, the financial crisis ought to have a smaller impact on these firms.
§ 1.2 Problem formulation
This research will compare the impact of the financial crisis on the performance of listed family firms to
the impact it has had on the performance of listed non-family firms. Based on these results a statement
can be made about the vulnerability of family firms. This research will only concentrate on the family
1 Management Team is a Dutch business- magazine that provides readers with information and opinions about business, strategy, management
and leadership. The article this research refers to was included in last year’s 17th edition of Management Team.

5
firms that are part of the indices of Amsterdam Euronext and are included in the list of Management
Team. The main problem in this paper will be formulated as follows:
Do family firms listed on Euronext Amsterdam perform better in times of the current financial crisis in
comparison to listed non-family firms?
The performance will be measured using Tobin’s Q, market data and accounting data. Firstly, the way
firms performed before the start of the financial crisis will be observed. These performance results will
be compared to the performance of the firms during the financial crisis. Subsequently, the change in
performance will be compared between listed family firms and listed non-family firms.
§ 1.3 Definition of a family firm
In the literature several definitions are used for a family firm. Defining a family firm will be discussed in
Chapter 2. In this research the definition that Management Team used in their article will be applied: a
family firm is a firm where two or more of the following criteria apply;
o at least twenty percent of the outstanding stocks are owned by the family,
o at least one family member occupies a key position in management, or in the board of the
company,
o the majority of the voting rights at a general members meeting of shareholders lies in hands of
the owning family,
o there are family connections (these include connections by marriage, succession and second-
and third-line family connections).
§ 1.4 Data description and structure of this paper
This paper contains a literature review and an empirical research. For the empirical research Reach will
be used. Reach is a Dutch national database composed by Bureau van Dijk. The database contains
financial and economic information about firms in the Netherlands. More than ten years of historical
data are available (2000-2010). Information on annual stock returns of the listed (non-) family firms will
be extracted from the Datastream database.
After this introduction the underlying theoretical framework of the research will be discussed. In
Chapter 3, the set of data used for this research will be described. Also the motivation and explanation
of the choice of research method will be given in this chapter. In Chapter 4 the results are discussed and
explained. Subsequently, the results are interpreted within the research questions and will be compared
to the existing literature. Chapter 5 discusses the conclusions and limitations of this research.

6
Theoretical background CHAPTER 2
§ 2.1 Defining a family firm
Most of the firms in the world are controlled by their founders or by the founder’s families or heirs. In
Western Europe family-controlled firms are the vast majority of publicly traded firms (La Porta, et al.
(1999)). In the literature there is not an universal definition for a family firm. Authors use different
definitions for various reasons, depending on the author’s relationship with and opinion towards the
subject. A broad definition is given by Heck and Scannell Trent (1999) that says a family firm is “a firm
that is owned and/or managed by one or more family members”.
When defining a family firm, one must keep three elements in mind; management, control, and
ownership. After the founder of a firm decides he no longer wants to manage his firm, he has the
possibility to leave control up to a non-family professional or to an heir. It may be essential for family
business’ growth and continuity to have non-family managers (Blumentritt, Keyt & Astrachan, (2007)).
When control is turned over to a professional, ownership and management become separated. After the
founder retires he can decide to sell his firm, or he (or his relatives) can keep ownership of the firm. In
Western Europe, significant ownership typically stays with the family after the founder retires (Burkart
(2002)).
Chakrabarty (2009) says a family-owned or family-controlled firm is a firm where the family is the
controlling shareholder; the family can garner enough shares to assure at least twenty percent of the
voting rights and the highest percentage of voting rights in comparison to other shareholders. Family-
control can be active or passive. When a family member serves as the firm’s CEO or fills another top
management position family-control is said to be active, if not, there is passive family-control (Anderson
and Reeb (2003)).
Although there are as many definitions as there are authors, one must keep in mind the key-criteria
in defining a family firm; ownership, control and management. It might be impossible to define family
firms conclusively, but still it is important to see the interplay of two entities; the family and the
business.
§ 2.2 Strategic advantages of family firms
“Family firms compensate for their relative weak human and financial capital by their unique type of
social family capital.” (Hoffman, Hoelscher & Sorenson (2006)).

7
§ 2.2.1 Long-term view
Founding families often maintain a long-term presence in their firms. One of the most important aspects
of the social family capital is the long-term view that family firms seem to have, as opposed to their non-
family counterparts. Many family firms focus on reciprocal altruism to work successfully together and
this way build strong relationships with their stakeholders. They put great effort in preserving or
building the long-term reputation of the firm (Levie and Lerner (2009)). Fukuyama (1995) and Lane and
Bachman (2000) find evidence that family firms benefit more particularly from the unique trust based
connections where they invested in. Also, family firms tend to have patient capital that often leads to
long-term commitment, generating unusual strong corporate cultures and business relationships (James
(1999); Landes (2008); Sjogren (2006)).
Since families have longer horizons than other shareholders they are willing to invest in long-term
projects relative to shorter managerial horizons. This way they are less likely to forgo good investments
to boost current earnings (Stein (1989)). Evidence for this statement is found by James (1999), who
demonstrates that family ownership provides incentives to invest according to the market rule. He
suggests that family firms invest more efficiently than non-family firms because the family intends to
pass the firm onto succeeding generations. Because of the long-term presence of the family, family firms
enjoy a lower cost of debt financing versus non-family firms (Anderson, et al. (2002)).
§ 2.2.2 Principal – agent theory
The principal-agent theory was developed by Jensen and Meckling (1976). It is a well known and widely
used theory that explains the costs that arise when ownership and management of a firm become
separated. The reason for these costs is the conflict of interests between the principal and agent, in
other words, the self-interest of the owner (principal) of the firm and the self-interest of the manager
(agent). Agency costs include all actions by managers that contravene the interest of the owner plus all
activities, incentives, policies and structures used by the firm to align the interest and actions of the
agent with the interest of the owners.
Fama and Jensen (1983) state that the principal-agent problem can be reduced by family control.
Concentrated investors have substantial economic incentives to diminish agency conflicts and maximize
firm value. The family’s wealth is so closely linked to the firm’s welfare that families may have strong
incentives to monitor managers and minimize the free rider problem inherent with small atomistic
shareholders (Demsetz & Lehn (1985)).
8
The difference in objectives between family firms and their non-family counterparts is an important
strategic advantage when it comes to agency costs. Westhead and Howarth (2006) found that the
managers and owners of family firms were significantly more likely to have nonfinancial objectives, such
as providing employment to family members, keeping ownership to family members and passing the
business on to the next generation. Altruism and the tendency for entrenchment are fundamental
forces distinguishing family and non-family firms in terms of agency costs (Chrismans, et al. (2003)).
Although family firms perform better when it comes to agency costs, owner management does not
eliminate the costs. Owner management may reduce the effectiveness of external control mechanisms
and expose the firm to a self control problem in which owners could take actions that have unintended
and possibly detrimental consequences for themselves and others (Schulze, Lubatkin & Buchholtz
(2001)). Family firms tend to be highly leveraged and prefer private to public equity financing. This way
family firms try to avoid agency cost control mechanisms that could prevent them from pursuing
complex choices that could trade off the firm’s priorities against family priorities.
§ 2.3 Strategic disadvantages of family firms
“If all else were equal between family and non-family businesses, many family businesses, given their
preference for sourcing management talent and core funding from the family gene pool, should be
competed out of existence as honestly incompetent or free-riding, shirking or entranced family
owner/managers mismanage or undermanage the business “ (Levie and Lerner (2009)).
§2.3.1 Opportunistic behavior
When there is active family-control, conflicts of interest can arise between minority shareholders and
the controlling family. Families might have concerns and interest of their own that may not align with
the interests of other investors of the firm. Poza, Handlon and Kishida (2004) find that nepotism,
opportunistic behavior and utility maximization by management are more common in family firms.
These opportunistic actions of the family can create a negative working environment and consequently,
they can have an adverse effect on employee effort and productivity (Burkart, Gromb & Panunzi (1997)).
This behavior is enabled by the lack of external monitoring of the management’s performance by other
minority shareholders and can be considered as an agency cost (Schulze et al. (2001)).
Furthermore, combining ownership and control allows concentrated shareholders to exchange profits
for private rents (Fama and Jensen (1983)). Tunneling is “the term used to describe the event where
assets and profits are transferred out of firms for the benefit of those who control them” (Johnson, La

9
Porta, Lopez-de-Silanes & Shleifer (2000)). There are two possible ways of tunneling. A controlling
shareholder can transfer resources from the firm for his own benefit through self-dealing transactions or
he can increase his share of the firm, without directly changing the firm’s productive assets (Atanasov,
Black and Ciccotello (2007)).Tunneling is a threat to other (minority) shareholders of the firm, since
owners can choose to consume scarce resources and draw them away from profitable objects (Demsetz
(1983)). Fama and Jensen (1985) show that large undiversified shareholders could employ different
investment decision rules relative to atomistic shareholders. The large premiums associated with
superior voting shares or control rights provide evidence that controlling, undiversified shareholders
such as founding families may forgo maximum profits because they are unable to separate their
financial preferences with those of outside owners (Shleifer & Vishny (1997)).
§ 2.3.2 Family Altruism
Since the family of the firm likes to stay in control, the top positions in the family firm’s management are
typically filled by members of the family; this phenomenon is called family altruism. A competitive
disadvantage arises since the family has a smaller pool of competent managers to choose from than
non-family firms. Subsequently, non-family firms are more likely to amass a superior set of human
capital because their talent pool extends beyond the family gene pool (Lubatkin, Ling & Schulze (2007);
Schulze et al. (2003)). This statement is supported by research done by Smith (2006). He finds that
family businesses have significantly lower percentages of decision makers holding either a business
related degree or any degree, across many growth paths.
Evidence for this strategic disadvantage is found by Pérez-González (2006) in his research on the
impact of inherited control on a firm’s performance. He concludes that firms underperform in terms of
operating profitability and market-to-book ratios, when the incoming CEO is related to the founder of
the firm as opposed to firms that promote unrelated CEOs. He also shows that the stock market reacts
negatively to the appointment of family heirs as managers (Pérez-González (2001)).
§ 2.4 Evidence on the performance of family firms versus non-family firms
Whether family firms are more or less valuable that non-family firms remains an open question.
Through the years a lot of research has been conducted on the performance of family firms versus non-
family firms and contradicting findings have come up.
For instance, Brockhous (1994) and McConaughy (1994) find that family firms outperformed non-
family firms on a variety of financial measures. Morck et al. (2000) state that founding-family ownership

10
is an organizational form that leads to poor firm performance. Surowiekcki (2000) noted that controlled
public companies that were family controlled have higher profit margins and faster growth rates than
non-family firms. A Spanish study concurred that family firms have more difficulty in reaching the same
size as non-family firms within a similar time span (Gallo (1995)). Research done by Maury (2006) finds
that family control is associated with a 7% higher Tobin’s Q. On the contrary, Holderness and Sheenan
(1988) found that family firms have a lower Tobin’s Q than non-family firms.
Carr and Bateman (2010) base on a worldwide analysis that family firms perform at least as well as
non-family firms on profitability and sales growth measures. Storey’s (1998) study of 427 family and
non-family firms found no evidence that either group performed better.
Perhaps one of the most prominent papers on performance of family firms is the paper of Anderson
and Reeb (2003). They concluded their research on the relationship between founding family ownership
and firm performance with the notion that family-ownership is not only prevalent and substantial; it
brings a higher performance than other non-family firms.
Performance results may vary because of the lack of a universal definition. Different definitions can
affect the results of a research (Miller et al. (2007)). The results may vary according to different levels of
family control (Daily & Thompson (1994)). Villalonga and Amit (2006) find that whether a family firm is
more or less valuable depends on how ownership, control and management enter the definition of a
family firm. According to their research, family ownership only creates value when the founder serves as
the CEO of the firm or when a CEO is hired, as the chairman of the firm. Firm value is destroyed when
descendants serve as CEO.

11
Methodology CHAPTER 3
§ 3.1 Sample and data resources
The list that Management Team has composed consists of fifty family firms. Eleven of these family firms
are listed on the Dutch stock-market. A list of these family firms can be found in appendix I. The sample
used for this research consists out of all the firms that are part of one of the three indices of Amsterdam
Euronext; the AEX, the AMX and the AScX. This requirement leads to a sample of 75 firms, of which ten
firms are family firms that are on the list of Management Team. Hunter Douglas N.V. is a family firm on
the list, but is not part of an index, thus will not be included in the sample.
The database on Reach contains financial and economic information about Dutch firms and is used to
find information about the firms in the sample. Reach is composed by Bureau van Dijk and includes
historical data of the last eleven years. Datastream is another source that helps collecting data.
Datastream includes the Worldscope database that provides detailed information on over 40,000 public
companies. This database was also used by Maury (2006) when doing his research on family firms. The
data comes from different institutions, like the International Monetary Fund (IMF), OECD, EUROSTAT
and several national statistical offices. The data of a few firms of the initially sample could not be found
in both the Thomson Reuters database as the Reach database or were because of incompleteness not
suitable to use in further analysis. Consequently, the initial sample is adjusted to a sample of 65 firms, of
which ten firms are family firms.
Table I provides an overview of the number of (family/non-family) firms per industry. The industries
are classified by a two-digit SIC-code. The Standard Industry Classification (SIC) code indicates the
company’s type of business. The table shows that the firms are broadly distributed over twenty-four
different industries. The maximum number of firms in an industry is eight, of which two are family firms
(SIC 73: Business services).
The (non-)family firms are observed over a decade, starting in the year 2000. The performance of
each firm in the sample is measured on an annual basis. The years 2000 until 2007 are noted as non-
crisis years. The years 2007, 2008, 2009 and 2010 are noted as crisis years2. It is expected that the
performance of each firm is affected by the crisis. By comparing the impact of the crisis between the
family and (non-) family firms conclusions can be made about the change in performance of family firms.
2 This division of crisis and non- crisis years is based on the timeline constructed by the Federal Bank of St. Louis. This bank gives a timeline of
events and political actions during the financial crisis and estimates the start of the financial crisis in the year 2007.
(http://timeline.stlouisfed.org/index.cfm?p=timeline)

12
Table I
Number of family and non family firms per industry and the total number of (family/non-family) firms in the sample.
The industries are classified by a two-digit Standard Industry Classification (SIC) code.
SIC
Industry description
Family Firms
Frequency
Non-family Firms
Frequency
Total Firms
Frequency
Percent
(Total Firms per
industry)
13 Oil and gas extraction 0 1 1 1,5
15 Building construction-general contractors and operative builders 0 2 2 3,1
16 Heavy construction (other than building construction-contractors) 0 3 3 4,6
20 Food and kindred products 1 3 4 6,2
27 Printing, publishing and allied industries 1 3 4 6,2
28 Chemicals and allied products 1 4 5 7,7
30 Rubber and miscellaneous plastic products 0 2 2 3,1
33 Primary metal industries 1 1 2 3,1
34 Fabricated metal products (except machinery and transportation equipment)
1 0 1 1,5
35 Industrial and commercial machinery and computer equipment 1 2 3 4,6
36 Electronic and other electrical equipment and components (except computers)
0 3 3 4,6
37 Transportation equipment 0 2 2 3,1
38 Measuring, analyzing and controlling instruments; photograpic, medical and optical goods: watches and clocks
1 0 1 1,5
45 Transportation by air 0 2 2 3,1
48 Communications 0 1 1 1,5
51 Wholesale trade: nondurable goods 1 2 3 4,6
54 Food stores 0 1 1 1,5
57 Home furniture, furnishings and equipment stores 0 2 2 3,1
62 Security and commodity brokers, dealers, exchanges and services 0 2 2 3,1
63 Insurance carriers 0 4 4 6,2
65 Real estate 0 1 1 1,5
67 Holding and other investment offices 0 5 5 7,7
73 Business services 2 6 8 12,3
87 Engineering, accounting, research, management, and related services 0 3 3 4,6
Total 10 55 65 100

13
§ 3.2 Family Firm variable
When analyzing the sample a dummy variable is used to identify family firms. A firm is marked as a
family firm when two or more of the following criteria apply; (a) at least twenty percent of the
outstanding stocks are owned by the family, (b) at least one family member occupies a key position in
management, or in the board of the company, (c) the majority of the voting rights at a general members
meeting of shareholders lies in hands of the owning family, (d) there are family connections (these
include connections by marriage, succession and second- and third-line family connections).
The dummy variable is set to zero if the observed firm is a non-family firm and set equal to one if the
observed firm is a family firm.
§ 3.3 Crisis-years variable
To identify crisis years and non-crisis years another dummy variable is used. Since interest is in the
difference in impact of the financial crisis between family and non-family firms, it should be clear which
observed years are noted as non-crisis years and which are noted as crisis years. The years 2007, 2008,
2009 and 2010 are noted as crisis years and for these years the dummy variable is set equal to one. The
years 2000 until 2007 are non-crisis years and here the dummy is set to zero.
§ 3.4 Performance variables
Several performance measures are used in this research; the ratio’s ROA (return on assets), ROE (return
on equity) and Tobin’s Q are analyzed for each firm. All performance variables are measured at the end
of each year.
§ 3.4.1 ROA
The return on assets- ratio indicates the profitability of a firm relative to the firm’s total assets (Wotuck
& McKinney, 1991). The ratio provides the user an idea as to how efficient management is using its
assets to generate earnings. The ratio can be used to decide whether an investment should be initiated
and gives an indication of the capital intensity of the firm. Capital intensity depends on the industry the
firm is in and thus the ratio varies widely across different industries (Crosson, et al., 2008).
Return on assets is calculated by dividing a firm’s annual earnings by its total assets and is displayed
as a percentage. ROA can be computed as:

14
§ 3.4.2 ROE
Bowman and Haire (1975) developed a ratio that measures the rate of return on equity of the common
stockholders. Return on equity measures the efficiency of a firm at generating profits from every unit of
shareholders’ equity. The ratio shows how well a firm uses investments funds to generate earnings
growth. As with ROA, ROE is best practically applicable when comparing firms in the same industry.
Return on equity is calculated by dividing a firm’s annual earnings by its shareholders equity and is
displayed as a percentage. ROE can be computed as:
§ 3.4.3 Tobin’s Q
Tobin’s Q is the ratio of the market value of a firm’s assets to the replacement cost of the firm’s assets
(Tobin, 1969). Excess profits are being earned when a firm is worth more than its book value.
Problems that arise when using rates of return as ROA and ROE such as industry specific implications
are avoided by Tobin’s Q. However, it is necessary to carefully estimate the book value of the firm.
Typically, researchers who construct Tobin's Q ignore the replacement costs of the intangible assets of
the firm in their calculations. For that reason, q typically exceeds 1. Accordingly, it can be misleading to
use q as a measure of market power without further adjustment (Lindenberg & Ross, 1981). Tobin’s Q
can be computed as:
§ 3.5 Control variables
The variables; firm age, firm size and leverage are used to control for firm-specific characteristics. Firm
age is the number of years of existence of the firm. Firm size is measured as the average book value of
the total assets of a firm. Leverage is measured by total debt divided by total capital and is also an
average of the observed available years (2000-2010). Since the performance measures are best
practically applicable when comparing firms in the same industry, dummy variables for one-digit SIC-
codes have been used to control for industry effects.
§ 3.6 Descriptive statistics
The summary statistics for the variables that are used in the analysis are presented in table II. The table
provides means, standard deviations, and minimum and maximum values for the key variables in the
sample. Table III shows a correlation matrix for the same variables. The results of difference of means
tests between family and non-family firms during crisis and non-crisis years are presented in table IV.

15
Table II
The table presents summary statistics for 65 sampled firms. It provides the mean, standard deviation and the minimum and
maximum values for each key variable in the analysis. Each column with statistics contains three sub-columns. The first sub-
column gives the summary statistics for all sampled firms, the second specifies for family firms in the sample and the third
column contains the summary statistics for non-family firms. Data for the univariate statistics is based on time-series averages
for each firm, and then averaging across firms.
Table III
The correlation matrix of the key variables in the sample.
Variable Mean Standard Deviation Minimum Maximum
Family Non-family Family Non-family Family Non-family Family Non-family
Family/non-family (family = 1) 0,15 0,36 0,00 1,00
Firm Age (in years) 64,66 55,22 67,09 53,95 44,11 56,51 1,00 1,00 11,00 241,00 133,00 241,00
Firm Size (in billion of dollars) 14,32 13,80 14,41 2,15 1,03 2,29 10,38 12,83 10,38 20,70 16,30 20,70
Debt over Assets (%) 26,04 24,78 26,27 14,60 11,56 15,16 0,17 3,62 0,17 62,06 45,65 62,06
Return on Assets (%) 5,47 8,66 4,89 9,10 5,56 9,53 -43,61 2,68 -43,61 22,52 22,52 20,41
Return on Equity (%) 9,20 17,29 2,25 45,13 13,13 59,58 -388,64 3,03 -388,64 45,12 38,72 45,12
Tobin's Q 1,12 1,37 1,07 0,81 0,49 0,85 0,10 0,87 0,10 5,51 2,50 5,51
Family/non-family Firm Age Firm Size Debt over Assets Return on Assets Return on Equity Tobin's Q
Family/non-family 1
Firm Age -,090 1
Firm Size -,103 ,142 1
Debt over Assets -,037 -,117 ,079 1
Return on Assets ,151 -,301* ,169 -,296* 1
Return on Equity ,099 -,296 ,285* -,116 ,613** 1
Tobin's Q ,135 -,308* -,353** -,186 ,180 -,055 1
*. Correlation is significant at the 0.05 level (2-tailed).
**. Correlation is significant at the 0.01 level (2-tailed).

16
Table IV
Difference of means tests for variables between family and non-family firms.
The upper table contains information about the difference of means before the financial crisis started.
The lower table contains information about the difference of means during the financial crisis.
Family firms
(non-crisis years)
Non-family firms
(non-crisis years)
Difference of means t-statistic
Number of firms 10 55
Firm Age 52,22 64,09 -11,86* -,68
Firm Size 13,43 14,24 -0,81 -1,63
Debt over Assets 23,99 26,72 -2,73 -,54
Return on Assets 11,50 5,06 6,44 1,56
Return on Equity 25,87 ,26 25,61 1,76
Tobin's Q 1,72 1,16 0,56 1,40
Family firms
(crisis years)
Non-family firms
(crisis years)
Difference of means t-statistic
Number of firms 10 55
Firm Age 57,89 70,09 -12,20* -,69
Firm Size 14,37 14,70 -,33 -,74
Debt over Assets 25,60 27,78 -2,18 -,60
Return on Assets 5,42 4,89 ,53 ,30
Return on Equity 9,61 6,14 3,47 ,63
Tobin's Q 1,07 ,97 ,10 ,65
* One of the firms in the sample is three years old, which means it entered the sample during the crisis years.
This explains why there is a variation in the difference of means for the variable Firm Age before the crisis and during the financial crisis.
Table II shows that 15% of the firms in the sample are family firms. The firms in the sample are on
average 64,66 years old and their total assets are worth 14,32 billion dollars. The standard firm’s assets
are financed with 26,04% debt and the firm generates a return on its assets of 5,47%. The average
return on equity is 9,20%. The scores on Tobin’s Q of the firms in the sample lie between 0,10 and 5,51
and the average score is 1,12.

17
The correlation matrix in table III gives positive correlation coefficients for family firms and the
different performance measures. However, since the results are not significant, there cannot be
concluded that there is a positive association between family firms and the performance measures.
Table IV presents the difference of means tests for the variables between family and non-family firms.
The upper table provides information about the non-crisis years. In times of the non-crisis years family
firms tend to be younger (on average 11,86 years younger than non-family firms), smaller (the worth of
their total assets is on average 0,81 billion less than the worth of the total assets of non-family firms)
and less financed with debt than non-family firms (2,73 percent point less). When it comes to
performance measures family firms perform better than non-family firms. Family firms have a 6,44
percent point higher ROA, a 25,61 percent point higher ROE and the average Tobin’s Q is 0,56 point
higher than the average Tobin’s Q of non-family firms.
The lower table provides information about the crisis years. In times of crisis, family firms are on
average 12,20 years younger than non-family firms. The worth of their total assets is 0,33 billion dollars
less than the worth of the total assets of the average non-family firm and 2,18 percent point less
financed with debt. Family firms still have a higher mean when it comes to performance measures. The
ROA is 0,53 percent point higher than the ROA of non-family firms, the ROE is 3,47 percent point higher
and they score 0,10 point higher when it comes to Tobin’s Q. However, the differences between the
means have become smaller during the crisis.

18
Empirical findings CHAPTER 4
§ 4.1 Regression analysis
Interest is in the relationship between firm performance and family firms. Moreover, interest is in the
relationship between crisis/non-crisis years and firm performance of family firms/non-family firms.
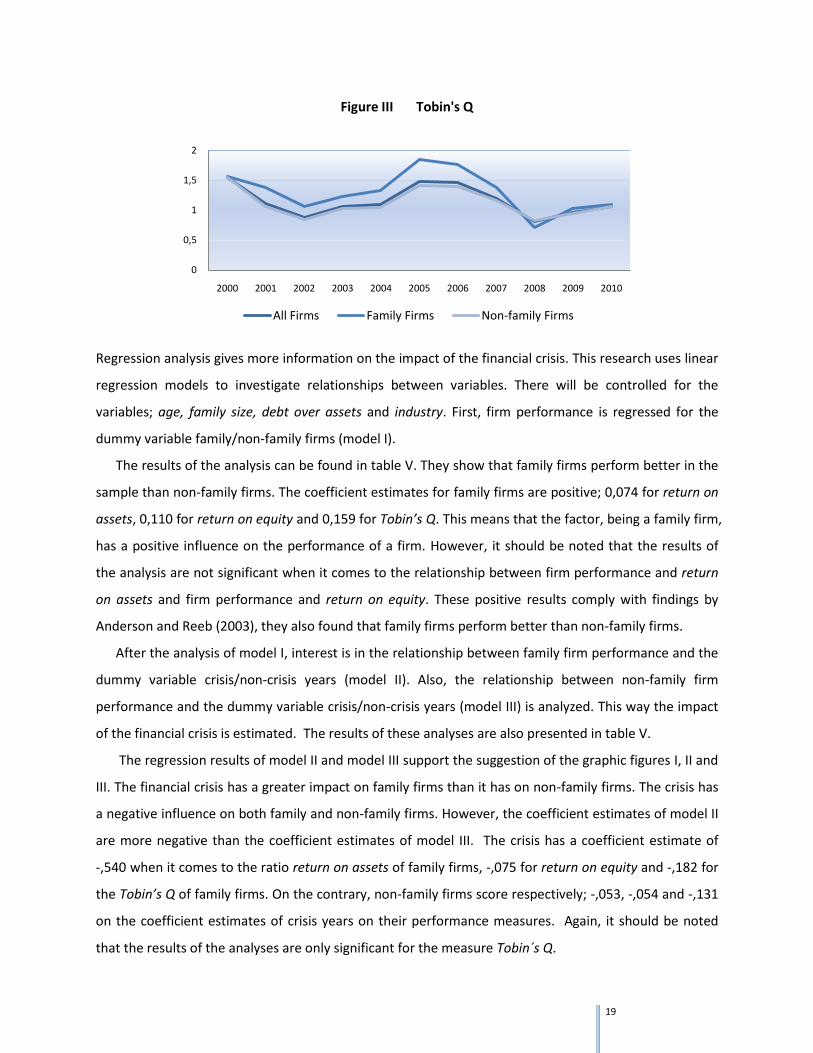
Below figures I, II and III are graphs of performance results on different measures through the years. As
expected, the graphs show a negative slope for performance at the start of the crisis in the year 2007.
Family firms seem to react more severe on the crisis than non-family firms.
-4%
-2%
0%
2%
4%
6%
8%
10%
12%
14%
16%
2000 2001 2002 2003 2004 2005 2006 2007 2008 2009 2010
Figure I Return on Assets
All Firms Family Firms Non-family Firms
-100%
-80%
-60%
-40%
-20%
0%
20%
40%
60%
2000 2001 2002 2003 2004 2005 2006 2007 2008 2009 2010
Figure II Return on Equity
All Firms Family Firms Non-family Firms
19
Regression analysis gives more information on the impact of the financial crisis. This research uses linear
regression models to investigate relationships between variables. There will be controlled for the
variables; age, family size, debt over assets and industry. First, firm performance is regressed for the
dummy variable family/non-family firms (model I).
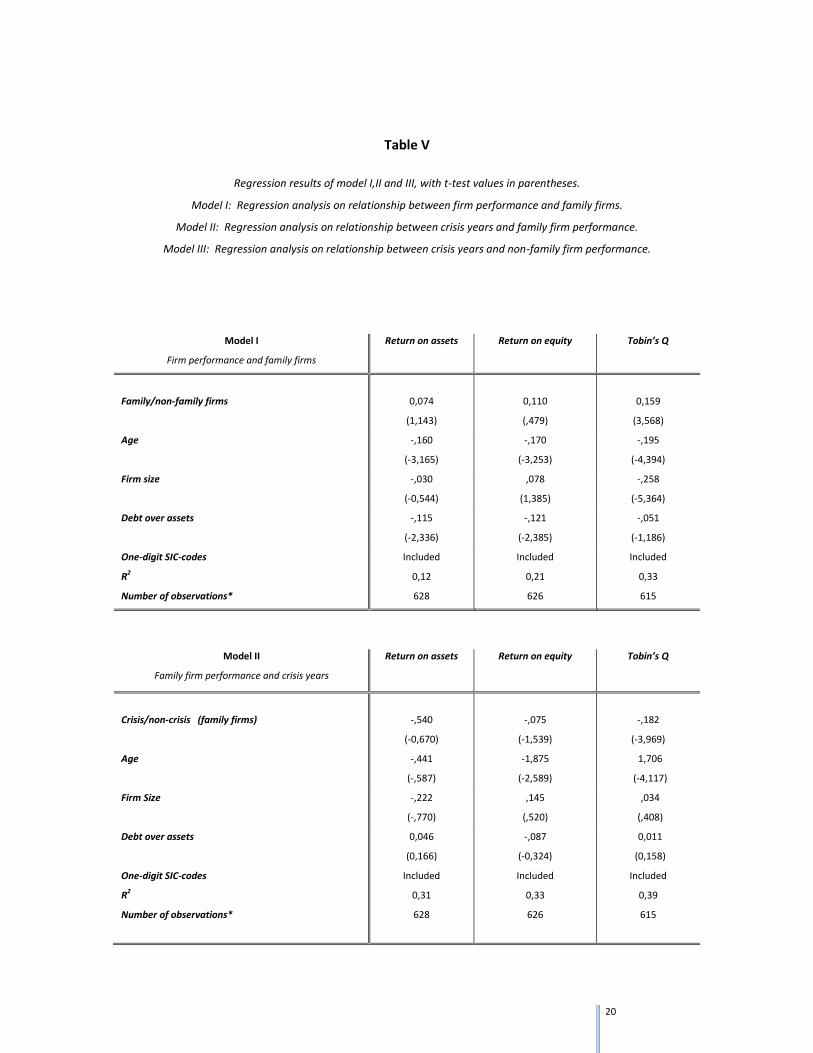
The results of the analysis can be found in table V. They show that family firms perform better in the
sample than non-family firms. The coefficient estimates for family firms are positive; 0,074 for return on
assets, 0,110 for return on equity and 0,159 for Tobin’s Q. This means that the factor, being a family firm,
has a positive influence on the performance of a firm. However, it should be noted that the results of
the analysis are not significant when it comes to the relationship between firm performance and return
on assets and firm performance and return on equity. These positive results comply with findings by
Anderson and Reeb (2003), they also found that family firms perform better than non-family firms.
After the analysis of model I, interest is in the relationship between family firm performance and the
dummy variable crisis/non-crisis years (model II). Also, the relationship between non-family firm
performance and the dummy variable crisis/non-crisis years (model III) is analyzed. This way the impact
of the financial crisis is estimated. The results of these analyses are also presented in table V.
The regression results of model II and model III support the suggestion of the graphic figures I, II and
III. The financial crisis has a greater impact on family firms than it has on non-family firms. The crisis has
a negative influence on both family and non-family firms. However, the coefficient estimates of model II
are more negative than the coefficient estimates of model III. The crisis has a coefficient estimate of
-,540 when it comes to the ratio return on assets of family firms, -,075 for return on equity and -,182 for
the Tobin’s Q of family firms. On the contrary, non-family firms score respectively; -,053, -,054 and -,131
on the coefficient estimates of crisis years on their performance measures. Again, it should be noted
that the results of the analyses are only significant for the measure Tobin´s Q.
0
0,5
1
1,5
2
2000 2001 2002 2003 2004 2005 2006 2007 2008 2009 2010
Figure III Tobin's Q
All Firms Family Firms Non-family Firms
20
Table V
Regression results of model I,II and III, with t-test values in parentheses.
Model I: Regression analysis on relationship between firm performance and family firms.
Model II: Regression analysis on relationship between crisis years and family firm performance.
Model III: Regression analysis on relationship between crisis years and non-family firm performance.
Model I
Firm performance and family firms
Return on assets Return on equity Tobin’s Q
Family/non-family firms
0,074
(1,143)
0,110
(,479)
0,159
(3,568)
Age -,160
(-3,165)
-,170
(-3,253)
-,195
(-4,394)
Firm size -,030
(-0,544)
,078
(1,385)
-,258
(-5,364)
Debt over assets -,115
(-2,336)
-,121
(-2,385)
-,051
(-1,186)
One-digit SIC-codes
R2
Number of observations*
Included
0,12
628
Included
0,21
626
Included
0,33
615
Model II
Family firm performance and crisis years
Return on assets Return on equity Tobin’s Q
Crisis/non-crisis (family firms)
-,540
(-0,670)
-,075
(-1,539)
-,182
(-3,969)
Age -,441
(-,587)
-1,875
(-2,589)
1,706
(-4,117)
Firm Size -,222
(-,770)
,145
(,520)
,034
(,408)
Debt over assets 0,046
(0,166)
-,087
(-0,324)
0,011
(0,158)
One-digit SIC-codes
R2
Number of observations*
Included
0,31
628
Included
0,33
626
Included
0,39
615

21
Model III
Non-family firm performance and crisis years
Return on assets Return on equity Tobin’s Q
Crisis/non-crisis (non-family firms)
-,053
(-1,073)
-,054
(-1,025)
-,131
(-1,895)
Age -,171
(-3,168)
-,178
(-3,200)
-,185
(-3,836)
Firm Size 0,019
(,320)
0,091
(1,527)
-,234
(-4,566)
Debt over assets -,171
(-2,196)
-,128
(-2,333)
0,075
(1,577)
One-digit SIC-codes
R2
Number of observations*
Included
0,11
628
Included
0,09
626
Included
0,30
615
* The sample consists of 65 firms observed over eleven years, which makes the initial number of observations 715.
Some observations are missing in Datastream or are not included in the analysis since firms are younger than eleven years old.
§ 4.2 Endogeneity
This research probably suffers from an endogeneity problem. There is reason to believe that family
ownership is affected by family performance. In other words, family firms might only be in hands of
families because they perform well. This should partly explain the positive estimate for the coefficient of
the family/non-family firm dummy on firm performance. Information advantages of family shareholders
can exist because of the large stake they have in the firm and the control they have over the
management of the firm. The controlling family could more readily ascertain the future prospects
suggesting that they retain ties only to the firms with favorable prospects (Anderson and Reeb (2003)).
However, there are assumptions made in this case of superior information. Families should not only
have special insights in the business, they must have excellent skills to foresee the future of the
business.
Despite the potential endogeneity of family control, compensations plans, insider trading
possibilities and corporate takeovers suggest that firm performance may affect the ownership structure
of firms (Demsetz and Villalonga (2001)). Also, Demsetz and Lehn (1985) and Demsetz and Villalonga
(2001) argue that the market succeeds in bringing forth ownership structures that are close to optimal.
Differences in circumstances facing firms such as economies of scale, regulation and the stability of the
environment in which they function, specify a firm’s ownership structure.

22
Conclusions and limitations CHAPTER 5
§ 5.1 Discussion and conclusions
This research has been conducted with the objective to give some insights on the performance of family
firms in the Netherlands. Following Anderson and Reeb (2003) in their research on family firm
performance, this research examined whether the Dutch family firms outperform there non-family firm
counterparts. A matter of special interest was the happening of the current financial crisis. The financial
crisis has had an impact on all firms on the stock market, but there is not any literature on the impact it
has had on family firms. In this research an attempt has been made to compare the impact of the
financial crisis on the performance of family firms to the impact it has had on the performance of non-
family firms.
The results of the research show that listed family firms outperform listed non-family firms in the
Netherlands. In non-crisis years family firms have a 6,44 percent point higher return on assets, a 25,61
percent point higher return on equity and the average Tobin’s Q is 0,56 point higher than the average
Tobin’s Q of non-family firms. In times of crisis family firms score 0,53 percent point higher when it
comes to return on assets, 3,47 percent point higher when it comes to return on equity and they score
0,10 point higher when it comes to Tobin’s Q.
On the other hand, the financial crisis has had a greater impact on family firms than it has had on
non-family firms. The crisis has had a negative influence on both family and non-family firms, but the
regression analysis suggest that the relationship between the financial crisis and the performance of a
firm is stronger when it comes to family firms than non-family firms.
The results of the research are not significant when it comes to the performance measures return on
assets and return on equity. This means that no hard conclusions can be offered when it comes to these
measures. The results of the analysis on Tobin´s Q are significant and do suggest that the financial crisis
had a greater impact on family firms than it had on non/family firms.
There are also a lot of limitations when it comes to the sample and the empirical research. However,
the results of this research can be an inspiration for other researchers to do a more thorough research
on this topic and on the performance of Dutch family firms.

23
§ 5.2 Limitations
The data on which the analysis is based contains some limitations. Firstly, the sample is relatively small
and perhaps too small to do a significant research. The information on family firms comes only from one
source and that is the Management Team magazine. Since the research is done following the article,
only the family firms listed in that article are part of the sample, or marked as a family firm.
Consequently, the family firm sample consists out of only ten listed family firms.
Second, in the analysis there has not been made a distinction between non-financial firms and
financial firms. Maury (2006) suggests that the valuation ratios and accounting profits of non-financial
firms are not comparable for financial firms and therefore there should have been a distinction. A
dummy for financial firms should have been used.
Also, the definition of a family firm used in this research is quite broad. It does not make a distinction
between family owned firms and firms that are both owned and controlled by the family as the
literature suggest there should be. The research might have been more interesting if it had only
concentrated on family-controlled firms.
Finally, there were no robustness tests conducted, nor has there been research on possible
nonlinearity relations between firm performance and family firms. As mentioned in chapter 4, there is a
possibility that there is an endogeneity problem. Robustness test could have given more insight in that
problem.

24
References
Anderson, R.C., & Reeb, D.M., 2003. Founding- family ownership and firm performance: evidence from
the S&P 500. The Journal of Finance, vol. 58, no. 3, pp. 1301-1328.
Anderson, R.C., Mansi, S., Reeb, D.M., 2003. Founding family ownership and the agency cost of debt.
Journal of Financial Economics 68, forthcoming.
Atanasov, V., Black, B., & Ciccotello C. S., 2008. Unbundling and measuring tunneling.
European Corporate Governance Institute, Finance Working Paper, 2008
Blumentritt, Timothy P., Andrew D., Keyt &. Astrachan T., 2007. Creating an Environment for
Successful Non-Family CEOs: An Exploratory Study of Good Principals. Family Business Review vol.20 no.
4, pp. 321-335.
Brockhaus R., 1994. Entrepreneurship and Family Business Research; Comparisons, Critique, and
Lessons. Entrepreneurship Theory and Practice vol. 19, no.1, pp. 25–38.
Burkart, M., Gromb, D., Panunzi, F., 1997. Large shareholders, monitoring, and the value of the firm.
Quarterly Journal of Economics vol. 112, pp. 693-728.
Burkart, M., Panunzi F., Shleifer, A., 2002. Family firms. Working paper, Harvard University.
Carney, M., 2005. Corporate governance and competitive advantages in family controlled firms.
Entrepreneurship: Theory & Practice, pp. 249 – 265.
Carr, C. & Bateman, S., 2010. Does culture count? Comparative performance of top family and non-
family firms. International Journal of Cross Cultural Management, vol. 10, no. 2, pp. 241 – 262.
Crosson, B.E., Needles, Jr.,Belverd, E., Powers, M., 2008. Principles of accounting. pp. 209.
Daily, C., Thompson, S., 1994. Ownership Structure, Strategic Posture, and Firm Growth: An Empirical
Examination. Family Business Review, vol. 7, no.3, pp. 237–49.

25
Demsetz, H., 1983. The structure of ownership and the theory of the firm. Journal of Law and Economics
vol. 25, pp. 375-390.
Demsetz, H., Lehn, K., 1985. The structure of corporate ownership: Causes and consequences,. Journal
of Political Economy vol. 93, pp. 1155-1177.
Demsetz, H., Villalonga, B., 2001. Ownership structure and corporate performance. Journal of Corporate
Finance, vol. 7, pp. 209–233.
Fama, E., Jensen, M., 1983. Separation of ownership and control. Journal of Law and Economics vol. 26,
pp. 301-325.
Fama, E., Jensen, M., 1985, Organizational forms and investment decisions. Journal of Financial
Economics vol. 14, pp. 101-119.
Gallo, M., 1995. The Role of the Family Business and its Distinctive Characteristics Behavior in Industrial
Activity. Family Business Review vol. 8, no. 2, pp. 149–60.
Greenwood, R., 2003. Commentary on: “Toward a theory of agency and altruism in family firms.”
Journal of Business Venturing, vol. 18, pp. 491-494.
Habbershon, T.G. & Williams, M.L., 1999. A resource- based framework for assessing the strategic
advantages of family firms. Family Business Review, vol. 12, no. 1, pp. 1 – 28.
Heck, R.K.Z. & Scannell Trent, E., 1999. The prevalence of family business from a household sample.
Family Business Review, vol. 12, no. 3, pp. 209–224.
Hoffman, J., Hoelscher, M., & Sorenson, R., 2006. Achieving sustained competitive advantage: A family
capital theory. Family Business Review, vol. 19, pp. 135-145.
Huntington, S.P., 1998. The Clash of Civilizations and the Remaking of World Order. London: Touchstone
Books.

26
James, H., 1999. Owners as Managers, Extended Horizons and the Family Firm. International Journal of
Economic Business, vol. 6, no. 1, pp. 41–55.
Jensen, M. C., & Meckling, W. H., 1976. Theory of the firm: Managerial behavior, agency costs and
ownership structure. Journal of Financial Economics, vol. 3,pp. 305-360.
Johnson, S., La Porta, R., Lopez-de-Silanes, F., & Shleifer, A., 2000. Tunneling. American Economic
Review vol. 90, pp. 20-27.
La Porta, R., Lopez-de-Silanes, F., Shleifer, A., 1999. Corporate ownership around the world. Journal of
Finance, vol. 54, pp. 471-517.
Levie, J. & Lerner, M., 2009. Resource mobilization and performance in family and non- family
businesses in the United Kingdom. Family Business Review, vol. 22, no. 1, pp.25 – 38.
Lubatkin, M. H., Ling, Y., & Schulze, W. S. , 2007. An organizational justice-based view of self-control
and agency costs in family firms. Journal of Management Studies, vol. 44, pp. 955-971.
Maury, B., 2006. Family ownership and firm performance: empirical evidence from Western European
corporations. Journal of Corporate Finance, vol. 12, pp. 321 – 341.
McConaughy, D., 1994. Founding-Family-Controlled Corporations: An Agency-Theoretic Analysis of
Corporate Ownership and its Impact upon Performance, Operating Efficiency and Capital Structure.
Unpublished doctoral dissertation, University of Cincinnati.
Miller, D., Le Breton-Miller, I., Lester, R.H., Cannella, A.A., 2007. Are Family Businesses Really
Superior? Journal of Corporate Finance, vol. 13, pp. 829–58.
Morck, R., Strangeland, D., & Yeung, B., 2000. Inherited wealth, corporate control, and economic growth, in Randall Morck, eds.; Concentrated Corporate Ownership (University of Chicago Press, Chicago).
Pérez-González, F., 2001. Does inherited control hurt firm performance? Unpublished working paper. Columbia University.

27
Pérez-González, F., 2006. Inherited control and firm performance. The American Economic Review, vol.
96, no. 5, pp. 1559-1588.
Poza, E. J., Hanlon, S., & Kishida, R., 2004. Does the family business interaction factor represent a
resource or a cost? Family Business Review, vol. 17, pp. 99-118.
Shleifer, A., Vishny, R., 1997. A survey of corporate governance. Journal of Finance vol. 52, pp. 737-783.
Sjogren, H., 2006. Family Capitalism within Big Business. Scandinavian Economic History Review vol. 54,
no.2, pp. 161–86.
Smith, M., 2006. An empirical comparison of the managerial development of family and non-family
SMEs from Australia’s manufacturing sector. Journal of Enterprising Culture, vol. 14, pp. 125-141.
Stein, J., 1989. Efficient capital markets, inefficient firms: A model of myopic corporate behavior.
Quarterly Journal of Economics, vol. 103, pp. 655-669.
Schulze, W. S., Lubatkin, M. H., Dino, R. N., & Buchholtz, A. K., 2001. Agency relationships in family
firms: Theory and evidence. Organization Science, vol. 12, pp. 99-116.
Schulze, W. S., Lubatkin, M. H., & Dino, R. N., 2003. Toward a theory of agency and altruism in family
firms. Journal of Business Venturing, vol. 18, pp. 473-491.
Villalonga, B., Amit, R., 2006. How do Family Ownership, Control and Management Affect Firm Value?
Journal of Financial Economics, vol. 80, pp. 385–417.
Westhead, P., Howorth, C., 2006. Ownership and Management Issues Associated with Family
Performance and Company Objectives. Family Business Review, vol. 19, no. 4, pp. 301–16.
Zweers, A., 2010. De vijftig allerbeste familiebedrijven. Management Team magazine, vol. 17, pp. 16 –
18.

28
Appendices
Appendix I The list of Dutch family firms included in the sample
Name of corporation Founding year Main activities3 Listed on
Aalberts Industries N.V. 1980 Fabrication of products of metal (no machines or electronic devices) AMX
ASM International N.V. 1964 Fabrication of machines and electronic devices AMX
Heineken N.V. 1864 Beer brewery AEX
Hunter Douglas N.V. 1947 Fabrication of products of metal (no machines or electronic devices) Local market
Koninklijke Ten Cate N.V. 1765 Fabrication of textile AMX
Randstad Holding N.V. 1960 Legal law services, accountancy and tax consulting and administration AEX
Sligro Food Group N.V. 1968 Wholesale trade (not cars or motercycle’s) AScX
Telegraaf Media Groep N.V. 1935 Publishing house AScX
TKH Group N.V. 1980 Fabrication of electronic devices AScX
TomTom N.V. 2005 Consultancy on information technology AEX
USG People N.V. 1879 Legal law services, accountancy and tax consulting and administration AMX
3 According to Reach, by Bureau van Dijk