Embed Size (px)
DESCRIPTION
Are family firms really superior performers?
Citation preview

Available online at www.sciencedirect.com
ier.com/locate/jcorpfin
Journal of Corporate Finance 13 (2007) 829–858www.elsev
Are family firms really superior performers?☆
Danny Miller a,⁎, Isabelle Le Breton-Miller b,Richard H. Lester c, Albert A. Cannella Jr. d
a HEC Montreal and University of Alberta, 4642 Melrose Ave. Montreal, Canada H4A 2S9b University of Alberta, 4642 Melrose Ave. Montreal, Canada H4A 2S9
c Mays School of Business, Texas A&M University, College Station, Texas 77843-4221, United Statesd W.P. Carey School of Business Department of Management Arizona State University Tempe, AZ 85287-4006, United States
Received 6 April 2006; received in revised form 12 March 2007; accepted 13 March 2007Available online 18 May 2007
Abstract
Although international evidence suggests that families may be unhelpful to firm performance, recentanalyses of U.S. public companies indicate that family firms outperform. This study probes these contrastingfindings by investigating more fine-grained measures of family business in the U.S. Specifically, it makes afundamental but neglected distinction between lone founder businesses in which no relatives of a founder areinvolved, and true family businesses that do include multiple family members as major owners or managers.The research also seeks to overcome issues of endogeneity and selection bias by examining both Fortune1000 firms and a random sample of 100 much smaller public companies. The results show that findings areindeed highly sensitive both to the way in which family businesses are defined and to the nature of the sample.Fortune 1000 firms that include relatives as owners or managers never outperform in market valuation, evenduring the first generation. Only businesses with a lone founder outperform. Moreover neither lone foundernor family firms exhibited superior valuations within a randomly drawn sample of companies. Our resultsconfirm the difficulty of attributing superior performance to a particular governance variable.© 2007 Elsevier B.V. All rights reserved.
JEL classification: G30; G32Keywords: Family firms; Endogeneity; Founder firms; Firm performance
☆
The authors would like to thank Ron Anderson, Benoit Dostie, William H. Greene, David Jobson, Scott Lee, P.T.Leger, Randall Morck, Harold Mulherin, Jackson Nickerson, Barry Scholnick, Bill Starbuck, Desiree Vencatechellum andan anonymous reviewer for their most helpful advice and comments. They would also like to thank Soranna Pramualmitra,Carla Jones, Luc Farinas, Tim Holcomb and Sadia Chowdhury for their help with the data gathering, and the SocialSciences and Humanities Research Council of Canada for research funding.⁎ Corresponding author. Tel.: +1 514 484 7768.E-mail addresses: [email protected] (D. Miller), [email protected] (I. Le Breton-Miller),[email protected] (R.H. Lester), [email protected] (A.A. Cannella).
0929-1199/$ - see front matter © 2007 Elsevier B.V. All rights reserved.doi:10.1016/j.jcorpfin.2007.03.004

830 D. Miller et al. / Journal of Corporate Finance 13 (2007) 829–858
1. Introduction
A central issue in research on corporate finance is the effect of governance on the performanceof a business. Much of the early research focused on the effects of ownership concentration(Demsetz and Lehn, 1985; Morck et al., 1988), while more recent work has considered othergovernance variables such as the size and composition of the board of directors as well as thedistribution of voting rights within the firm (Claessens et al., 2002; Villalonga and Amit, 2006a,b;Dalton et al., 1998).
The research on corporate governance contains two distinct strands. One directioninitiated by Berle and Means (1932) is to seek a causal effect on corporate performancefrom governance variables such as management ownership. By contrast, research by Demsetz(1983), Demsetz and Lehn (1985) and Demsetz and Villalonga (2001) has sought to ex-plain how ownership and other governance variables endogenously respond to firm andindustry characteristics without necessarily inducing a causal effect of governance onperformance.
Within this research on corporate governance, a growing body of analysis has focused on theimpact of family firms on corporate performance (Anderson and Reeb, 2003; Ang et al., 2000;Bennedsen et al., in press; McConaughy et al., 1998; Cronqvist and Nilsson, 2003; Maury, 2006;Villalonga and Amit, 2006b). Family firms often have concentrated ownership and/or votingrights that, in the vein of Berle and Means (1932) and Jensen and Meckling (1976), mightenhance performance. Yet the typical portrayal of a family firm suggests that these organizationssuffer from capital restrictions, inter-generational squabbles, executive entrenchment, andnepotism, all of which may detract from performance (Allen and Panian, 1982; Chandler, 1990;Gomez-Mejia et al., 2003; Perez-Gonzalez, 2006; Schulze et al., 2001, 2003). Hence, it is anempirical question as to the effects of family ownership on performance. Moreover this empiricalquestion must be approached carefully due to the endogeneity in ownership modeled by Demsetzand Lehn (1985).
Recent research in the U.S. has produced evidence that family firms offer superiorperformance vis-à-vis other major corporations. In studies of the S&P 500, Business Week1000, and Fortune 500 samples, respectively, Anderson and Reeb (2003, 2004), McConaughyet al. (1998) and Villalonga and Amit (2006b) report that the Tobin's q of family firms is greaterthan that of other corporations. However, Villalonga and Amit (2006a) find that superiorperformance within family firms is less prevalent within firms that have disproportionate votingrights.
The positive results for family firms in the U.S. are somewhat surprising. For one, they appear tocontrast with the performance evidence fromEurope and Asia (Claessens et al., 2002; Cronqvist andNilsson, 2003;Maury, 2006; Bennedsen et al., in press), alsowith scholars examiningmore inclusivesamples of smaller firms (Holderness and Sheehan, 1988), and with authors who find familyinvolvement to be associated with lower productivity (Barth et al., 2005), family utilitymaximization as opposed to firm value maximization (Bertrand and Schoar, 2006), and executiveentrenchment (Allen and Panian, 1982; Gomez-Mejia et al., 2001). More generally, the apparentsuperiority of family firms in the U.S. raises the question as to why they are not a more predominantorganizational form. If family ownership is indeed a superior organizational form, why does it notvastly outnumber other types of public corporations (Alchian, 1950; Demsetz, 1983; Demsetz andLehn, 1985)?
In this paper, we address the apparently puzzling evidence on the performance of family firmsin the U.S. Much of our contribution is methodological. We consider in depth the definition of a

831D. Miller et al. / Journal of Corporate Finance 13 (2007) 829–858
family firm and assess the sensitivity of performance results to the nature of different firmclassifications and control samples. We also consider how the results in the prior studies are tied tosample selection by analyzing a broad universe of corporations in addition to the Fortune 500firms that have been the emphasis of prior research.
Our results indicate that the superiority of family firm performance is indeed sensitive to thedefinition of a family firm and the source of the data. The results are especially sensitive to thedistinction between “lone founder” businesses like Microsoft with no family of the founder inthe business — which do outperform, and businesses like Comcast that have founders presentwith other family members serving as owners or managers — which do not outperform. Thisdistinction has been blurred in prior research that places lone founders and family founders inthe same category. Moreover, we find no superior performance of family firms within a randomsample from a broader universe of firms than have been considered in prior research. Ourresults confirm the difficulty in attributing superior performance to a particular governancevariable.
2. What is a family firm?
2.1. Family firms in the literature
The literature on family business is wide-ranging and it is difficult to find consensus onthe exact definition of a family firm. However, the typical family business has beencharacterized as an organization controlled and usually managed by multiple family members(Shanker and Astrachan, 1996; Lansberg, 1999), often from multiple generations (Andersonand Reeb, 2003; Gomez-Mejia et al., in press). Table 1 shows the definitions of family firmsthat have been used in various studies around the world. It suggests that there are indeed awide variety of types that face a corresponding variety of conditions, and therefore there maybe great variations in how such businesses perform. For example, McConaughy et al. (1998)count as a family firm any company run by a founder or member of the founding family.Similarly, Anderson and Reeb (2003), Cronqvist and Nilsson (2003), Faccio and Lang(2002), La Porta et al. (1999), Smith and Amoako-Adu (1999), Barth et al. (2005) and otherscount as family businesses any firm in which a founding family or founding individual own afraction of the company or serve on the board (the hurdles for these ownership fractionsvary). Villalonga and Amit (2006b) examine a wide variety of definitions, encompassingdifferent levels and generations of individual- or family-ownership and/ or management.Other studies ensure involvement by multiple members of the same family, at least over time,by counting as family businesses only those in which there are several family membersinvolved in owning or managing the business. Bennedsen et al. (in press) and Perez-Gonzalez (2006), for example, focus on later generation businesses in which a blood relationof the founder or a major owner serves as the chief executive of the company. Gomez-Mejiaet al. (in press) insist on multiple family members being involved in owning and operatingthe business (although their focus was not firm performance). It should be noted that theabove studies examine different countries, governance regimes, types of companies, conductand outcomes.
One of the more curious aspects of Table 1 is that virtually all studies of performance countas family businesses companies in which there is only involvement of a lone founder, but noinvolvement by any other family members as owners or managers. The studies blend lonefounder and family founder categories, making it impossible to separate the performance

Table 1Family firms as defined in the literature
# Author(s) Study timeline
Data source Data location Family firm definition(s) employed
1 Allen andPanian (1982)
1971–1980 250 largest firms interms of sales for1974 or 1975
U.S. Family firm whenever the members of a descendent group and their affinesowned or controlled at least 5 percent of the voting stock in a corporation andwere represented on board of directors. Other definitions employed: Directfamily control when the CEO is a member of the controlling family.
2 Anderson andReeb (2003)
1992–1999 1992 S&P 500 U.S. Family firm if there exists fractional equity ownership of the founding familyand / or the presence of family members serving on the board of directors. Otherdefinitions employed: Ratio of board seats held by family members to boardseats held by independent directors / CEO founder indicates a founding familyfirm when the CEO is the founder of the firm / CEO descendent indicates afounding family firm when the CEO is a descendent of the founder during thepast decade.
3 Anderson andReeb (2004)
1992–1999 1992 S&P 500 U.S. Family firm if there exists fractional equity ownership of the founding familyand/or the presence of family members serving on the board of directors. Otherdefinitions employed: Ratio of board seats held by family members to boardseats held by independent directors/If family board control exceeds independentdirector control.
4 Anderson,Mansi, andReeb (2003)
1993–1998 Firms in both theLehman BrothersBond Databaseand the S&P 500
U.S. Family firm if there exists fractional equity ownership of the founder and his/her immediate family. Other definitions employed: Fractional equity ownershipof the founder and his/her immediate family & board of directors membership/Fractional equity ownership of the founder and his/her immediate family andsize of the family's ownership stake relative to other block holders/Fractionalequity ownership of the founder and his/her immediate family and family equityholdings as a fraction of outstanding shares.
5 Ang, Cole, andLin (2000)
1992 Federal ReserveBoard's NationalSurvey of SmallBusiness Finances
U.S. Family firm when a single family controls more than 50% of the firm's shares.
6 Barontini andCaprio (2005)
1999 Large publicly tradedfirms greater than 300million euros in assets.675 firms.
ContinentalEurope(11 countries)
Family firm if the largest shareholder owns at least 10% of ownership rights andeither family or largest shareholder controls more than 51% of direct votingrights or controls more than the double of the direct voting rights of the secondlargest shareholder. Other definitions employed: Firm run by family COO/Firmrun by non family COO but one family member is on board/Family firm whenfounder or descendent of founder runs firm.
832D.Miller
etal.
/Journal
ofCorporate
Finance
13(2007)
829–858

7 Barth et al.(2005)
1996 Survey of firmsassociated withthe Confederation ofNorwegian Businessand Industry
Norway Family firm if at least 33% of the shares of the firm are owned by one person orone family.
8 Bennedsen et al.(in press)
1994–2002 Limited liability publicand privatefirms which underwenta CEO succession
Denmark Family firm whenever an incoming CEO is related by blood or marriage to theoutgoing CEO.
9 Claessens et al.(2000)
1996 WorldScope 9 East AsianCountries
Family groups are those that control more than 5% of the company's votes.Family group is identified through published family trees in each country andmay consist of one family or a group of families.
10 Claessens et al.(2002)
1996 WorldScope 8 East AsianCountries
Family firm when there is the presence of a group of people related by blood ormarriage with large ownership stakes.
11 Cronqvist andNilsson (2003)
1991–1997 Stockholm StockExchange
Sweden Founder families may include only a single individual or a closely knit groupof individuals who do not belong to the same family. Other definitionsemployed: Founder family ownership is ownership by the founder ordescendents of the founder and families/individuals affiliated with the founder.
12 Denis and Denis(1994)
1985 Value Line InvestmentSurvey
U.S. Family firm if 2 or more family members are present as officers/directors or iffounders are officers.
13 Faccio and Lang(2002)
1996–1999 WorldScope plusvarious countryspecific reference databases
13 WesternEuropeancountries
Family firm if a family or an individual or unlisted firm on any stock exchangeis considered as the ultimate owner (greater than 20% of either cash flow orcontrol rights).
14 Fahlenbrach (2006) 1992–2002 2327 publicly tradedfirms listed in IRCC forall years, firms drawnfrom S&P 500, Fortune,Forbes, BusinessWeek
US Family firm if the CEO is the founder or co-founder.
15 Gomez-Mejia et al.(in press)
1944–1998 Spanish governmentregistry
Spain Family firm if the company is owned and operated by the founding family.Other definitions employed: Owned and operated by non-founding extendedfamily/Owned and operated by non-founding extended family members butmanaged by hired professionals.
16 Gomez-Mejia et al.(2003)
1995–1998 Random sample culledfrom Compustat
U.S. Family controlled firm under two conditions: two or more directors had a familyrelationship, and family members owned or controlled at least 5% of the votingstock. Family relationship included father, mother, sister, brother, son, daughter,
(continued on next page)
833D.Miller
etal.
/Journal
ofCorporate
Finance
13(2007)
829–858

Table 1 (continued )
# Author(s) Study timeline
Data source Data location Family firm definition(s) employed
spouse, in-laws, aunt, uncle, niece, nephew, cousin. Other definitions employed:Family controlled and CEO is family member/Percentage of family equityownership/Family controlled and family member(s) are on the compensationcommittee.
17 Gomez-Mejiaet al. (2001)
1966–1993 Registry of Newspapers,Media Guide of Spain,Oficina de Justificacionde la Difusion—All dailynewspapers
Spain Family firm if in this newspaper sample there were family ties between thenewspaper's CEO and editor.
18 Holderness andSheehan (1988)
1980–1984 114 randomly chosenpublicly traded firms —data source Spectrum 5
US Family firm if an individual majority shareholder or entity owns at least 50.1%of the stock: may include trusts and foundations.
19 La Porta et al.(1999)
1995–1997 World scope-27 countriesrepresented
Worldwide Family firm if a person is the controlling shareholder (ultimate owner) whosedirect and indirect voting rights exceed 20%.
20 Luo and Chung(2005)
1973–1996 Directory business groupsin Taiwan
Taiwan Firm created by entrepreneurs. Other definitions employed: Firm's key leaderhas inner circle members who are immediate family members/Firm's key leaderhas inner circle members with prior social relationships — distant relatives,in-laws, friends, classmates, colleagues, business partners.
21 Maury (2006) 1996–2003 Faccio and Lang, 2002data plus WorldScope2003
13 WesternEuropeancountries
Family firm if the largest controlling shareholder who holds at least 10% of thevoting rights is a family, an individual, or an unlisted firm (unlisted firms areoften closely held and therefore considered under family control). Otherdefinitions employed: The controlling shareholder is from an unlisted firm/Thelargest controlling shareholder is an identified family or individual/Thecontrolling shareholder is a family or an individual holding the title of CEO,Honorary Chairman, Chairman, or Vice Chairman.
22 McConaughy et al.(1998)
1987 Business Week CEO 1000 U.S. Family founder controlled firm — A public corporation whose CEO is either thefounder or a member of the founder's family.
834D.Miller
etal.
/Journal
ofCorporate
Finance
13(2007)
829–858

23 Morck et al. (1988) 1980 Fortune 500 U.S. Family firm if a member of the founding family is among the top two officers.24 Perez-Gonzalez
(2006)1980–2001 Compustat 1994 U.S. Sample firms met the following requirements: (1) founded prior to 1971; (2)
exhibited at least one of the following (a) two or more individuals related byblood were directors, officers, or shareholders (b) an individual had at least 5%ownership (c) a founder was an executive or director, and (3) a CEO changeoccurred during the time window. Further a family succession was coded withinthis sample of firms when the new CEO was related by blood or marriage to :(1) the departing CEO, (2) the founder, or (3) a large shareholder.
25 Schulze et al.(2001)
1995 Survey of American familybusinesses conducted bythe Arthur Anderson Centerfor Family Business.
U.S. Family firm if privately held, greater than $5 m annual sales, and listed by ArthurAnderson as a family business.
26 Schulze et al.(2003)
1995 Survey of American familybusinesses conducted by theArthur AndersonCenter for Family Business.
U.S. Family firm if privately held, greater than $5 m annual sales and listed by ArthurAnderson as a family business.
27 Smith and Amoako-Adu (1999)
1962–1996 Toronto Stock Exchangecompanies
Canada Family firm if a person or a group related by family ties holds the largest votingblock and at least 10% of the total votes.
28 Villalonga and Amit(2006b)
1994–2000 Fortune 500 U.S. Family firm if the founder or a member of the family is officer, director or ownsN5% of the firm's equity. Other definitions employed: 1 or more family membersare officers directors or block holders/At least 1 family officer and 1 familydirector/Family is largest vote holder/Family is largest shareholder/1 or morefamily members from 2nd generation or later are officers, directors, or blockholders / Family is largest vote holder and has at least one family officer and 1family director/Family is largest shareholder and has at least 20% of the votes/1 ormore family members are directors or block holders but there are no familyofficers/Family is largest vote holder, has at least 20% of votes, one family officerand 1 family director and is in 2nd or later generation.
This table represents studies identified by searching top tier finance and management journals between 1996 to 2006 (e.g. Academy of Management Journal – Administrative ScienceQuarterly – Journal of Corporate Finance – Journal of Financial Economics –Quarterly Journal of Economics – Review of Financial Economics – The Journal of Finance) for titlesor abstracts that used the term “family firm”. Using the ancestral approach we were also able to identify other sources. The list above is intended to be representative of the majorcontributions to the field of empirical family business research published in the last decade.
835D.Miller
etal.
/Journal
ofCorporate
Finance
13(2007)
829–858

836 D. Miller et al. / Journal of Corporate Finance 13 (2007) 829–858
effects of the two. Given their freedom from family succession issues and kinship squabbles,these lone founder businesses may be the types of organizations least apt to have performancedisadvantages1.
2.2. Revised definition and proposed analyses
We define a family firm as one in which multiple members of the same family areinvolved as major owners or managers, either contemporaneously or over time. This allowsfor a number of variations: in the level of ownership and voting control, in the managerialroles played by family members, and in the family generation of key family members.Unlike previous studies, we distinguish “lone founder” businesses in which there are one ormore founders, who have no relatives in the business, with “family” businesses in whichthere are multiple major owners or executives over time or contemporaneously from thesame family. More specifically, we stipulate the defining conditions of lone founderbusinesses and family businesses as follows: (1) A dummy variable for the presence of alone founder-owner or family-owner. (2) The percentage of shares owned by the lonefounder or the family. (3) A dummy variable assessing whether the lone founder or family isthe biggest shareholder. (4) A dummy variable assessing whether the lone founder or familyis the biggest shareholder and serves as CEO. Dummy variables assessing whether a lonefounder or family member serves as (5) CEO, (6) Chairman, or (7) CEO and Chairman (seeTable 2).
We used these revised definitions to explore the sensitivity of the prior research. As we willsee, we are able to replicate the major results of the Anderson and Reeb (2003) and Villalonga andAmit (2006b) studies. However, we find that when we distinguish such lone founder businesses inthe sample, no other definitions of family business show superior market valuations. Moreover, inorder to counter problems of selection bias and establish the generality of the results, this studygoes beyond the examination of Fortune 1000 companies to also gather a sample from arandomly-selected set of firms.
The balance of the paper is structured as follows. Section 3 describes our sample, data andproposed analyses. Section 4 then presents our findings: Section 4.1 provides a replication of theprevious work, and Section 4.2 shows how the earlier results are sensitive to the definition of afamily firm — specifically, superior family business market valuations disappear for alldefinitions; only lone founder businesses outperform. Section 4.3 then presents a matched firmanalysis to determine just where family business superiority seems to manifest: such superiorityappears only rarely in our matched sample. Section 4.4 establishes the robustness of the resultsby presenting Heckman treatment regressions and panel data models. Finally, Section 4.5addresses the selection bias issue that arises from a focus on large Fortune 1000 firms by
1 Studies showing family businesses to outperform are those of businesses that are younger (first generation inVillalonga and Amit, 2006b; Anderson and Reeb, 2003), where a founder is present and continues to manage the firm(Anderson and Reeb, 2003; Fahlenbrach, 2005; Villalonga and Amit, 2006b), and where the legal infrastructure orcorporate tax system discourages pyramidal holding structures (the U.S. is unique in doing so, see Morck, 2003). BecauseAnderson and Reeb (2003), Villalonga and Amit (2006b) and Fahlenbrach (2005) place lone founders and firstgeneration family firms within the same category, it is not clear whether any family members besides a founder areassociated with superior performance. Indeed it may be that superior performance disappears the moment a relative of alone founder or major owner takes on a significant ownership or management role.

Table 2Variable definitions
Variable Definition
1 Family firm Family firm is a binary variable, 1 indicates presence of family. Firms in thiscategory have multiple family members as insiders (officers or directors) or largeowners (5% or more of the firm's equity) at the same time or over the life of thecompany as family descendants. Source: Firm proxy.
2 Family firm 1st Gen A binary variable, 1 indicates a family firm with family members present from thefirst generation only. Family firms in this category have multiple family memberspresent with none beyond the first generation. Source: Firm Proxy, biographies,Hoovers, firm webs.
3 Family firm 2nd Gen A binary variable, 1 indicates a family firm with family members present frommultiple generations. Family firms in this category have multiple family memberspresent with at least one beyond the first generation. Source: Firm Proxy,biographies, Hoovers, firm webs.
4 Lone founder firm A binary variable, 1 indicates a lone founder's involvement. Lone founder firmsare defined as those in which an individual is one of the company's founders withno other family members involved, and is also an insider (officer or director) or alarge owner (5% or more of the firm's equity). Firms where the founder is presentalongside other family members are categorized as family firms. Thus a lonefounder firm, by our definition, cannot be a family firm, nor vice versa.
5 Combined firms A binary variable, 1 indicates the firm is either a family or lone founder firm.6 Largest owner A binary variable, 1 indicates that the family or the lone founder is the largest
shareholder in the firm. Source: Compact Disclosure; Firm Proxy.7 Largest owner and CEO A binary variable, 1 indicates that the family or the lone founder is the largest
shareholder in the firm and also that either a family member or the lone founderserves as the firm's CEO. Source: Compact Disclosure; Firm Proxy.
8 Shares owned % The total share holdings expressed as a percentage of total outstanding sharesaccumulated across all share categories. Source: Compustat: CompactDisclosure; Firm Proxy.
9 Shares owned % 2 Represents the squared term from the variable Shares Owned %.10 CEO A binary variable, 1 indicates that any family member or the lone founder holds
the title of chief executive officer (CEO). Source: Compact Disclosure; Firm Proxy.11 CH A binary variable, 1 indicates that any family member or the lone founder
holds the title of chairman of the board (CH). Source: Compact Disclosure; FirmProxy.
12 CEOCH A binary variable, 1 indicates that any family member or the lone founder holds thetitles of chief executive officer (CEO) and chairman of the board (CH). Source:Compact Disclosure; Firm Proxy.
13 Tobin's q Tobin's q is the ratio of the firm's market value to book value and is calculatedas follows: ((common shares outstanding⁎calendar year closing price)+ (currentliabilities − current assets)+ (long term debt)+ (the liquidating value of preferredstock)) divided by (total assets). Source: Compustat.
14 Industry Tobin's q Industry Tobin's q is calculated for all firms listed in Compustat at a two digitSIC. Source: Compustat.
15 Industry Adjusted Tobin's q Calculated as firm Tobin's q minus median industry Tobin's q, at a 2 digit SIC.Source: Compustat
16 Research & Development Research and development ratio is calculated as research and developmentexpense divided by total sales. Firms with missing data were coded=0. Source:Compustat.
17 Advertising Advertising expense ratio is calculated as advertising expense divided by totalsales. Firms with missing data were coded=0. Source: Compustat.
18 Investment Investment ratio is calculated as capital expenditures divided by plant propertyand equipment. Firms with missing data were coded=0. Source: Compustat.
(continued on next page)
837D. Miller et al. / Journal of Corporate Finance 13 (2007) 829–858

Table 2 (continued )
Variable Definition
19 Beta (Market Risk) Beta is the average value-weighted return whereby the firm's daily returns areregressed against the returns of the overall market. Source: CRSP.
20 Debt to Equity Ratio Debt to equity ratio is calculated as the values of long term plus short term debtdivided by the market value of common equity. Source: Compustat.
21 5% Owner The ownership percentage of all non-family or non-lone founder blockholderswho hold a 5% or greater ownership stake. Created by summing the non-familyor non-lone founder 5% or greater ownership stakes and dividing this by the firm'stotal shares outstanding. Source: Compact Disclosure; Compustat; Firm Proxy.
22 Supershares A dummy variable set to equal 1 when a firm has a vehicle in place whichcreates a differential source of power. Example: differential voting overvarious classes of stock. Source: Compact Disclosure; Firm Proxy.
23 Sales Measured as total net sales. Source: Compustat.24 Sales Growth Represents the percentage change in sales for the 5 year period 1996–2000 and
is calculated as (net sales year 2000- net sales year 1996) / net sales year 1996.Source: Compustat.
25 Firm Age Calculated in years as the difference between the year 2000 and the firm'sfounding year. Source: Firm Proxy; Firm website; Lexus-Nexis; Hoovers.
26 Firm Size The natural log of annual net sales. Source: Compustat.
838 D. Miller et al. / Journal of Corporate Finance 13 (2007) 829–858
studying a random sample of 100 smaller public companies. Section 5 presents our discussionand conclusions.
3. Method and data
3.1. Sample
Our sample consists of the Fortune 1000 (500 industrials and 500 service firms). We analyzeddata on 896 companies as we restrict the sample to firms with publicly accessible data for theyears 1996 to 2000. For some of our analyses we used five year averages and include only firmswhose governance status did not change during that five year period. We also examined a randomsample of 100 smaller public U.S. companies to investigate the potential for selection bias.
3.2. Variables and sources of data
Variables were measured at two levels and in two phases. We first compiled data on individualofficers and directors, 5% blockholders, and large institutional investors. Information on shareownership, vote control, lone founder or family positions as officers and board members, use ofsupershares, etc. were obtained from at least three sources for each company: CompactDisclosure, individual proxies (which were the primary and definitive source of data given themany inaccuracies within Compact Disclosure (Dlugosz et al., 2006), Hoover's, and companyweb-sites. Where the proxies contained insufficient information on the familial relationshipsbetween board members and managers, or officers' relationships with a founder, we approachedcompanies directly. Because some families controlled their firms via their ownership of banks orother organizations, and because of the personal name changes brought about by marriage, one totwo weeks of training at coding were required for all research assistants.
Consistent with Villalonga and Amit (2006b), we took as the focal family the one with themost votes. In totaling family shareholdings we included shares of co-trustees of family trusts

839D. Miller et al. / Journal of Corporate Finance 13 (2007) 829–858
who were directly employed by the family. Whereas Villalonga and Amit (2006b) consider firmssuch as Microsoft as first generation family businesses, we do not consider them so since there isno family involvement. Rather we count them as lone founder businesses. Firms such as Comcastand Qualcomm are considered family businesses as there are multiple members of the Robertsand Jacobs families, respectively, serving as major owners or officers.
Lone founder firms are those in which an individual is one of the company's founderswith no other family members involved, and is also an insider (officer or director) or a largeowner (5% or more of the firm's equity). Owners taking control though leveraged buyoutswere not counted as founders. Non-institutional shareholders also were not consideredfounders if they accumulated their shares through compensation. Neither were large mutualfund companies such as Fidelity or Vanguard or venture capital funds that controlled largeblocks of shares.
Data on individuals were aggregated to the firm level, at which we could also collectinformation on strategy, governance and market performance. Accounting data are drawn fromCOMPUSTAT, and market performance data were obtained from the Center for Research onSecurity Prices (CRSP). Our variables are listed and defined in Table 2, along with their sources;Table 3 provides an industry breakdown of our sample of family, lone founder and other (non-family, non-lone-founder) firms; while descriptive statistics are presented in Table 4. The simplebivariate means comparisons of Table 4 indicate that lone founder and family firms differ in someaspects of their demographics, conduct and performance. The former are younger, enjoy superiormarket valuations and more rapid rates of revenue growth, and they tend to spend more onR&D and capital investment. Lone founders also own fewer shares than the typical family. Suchpotential differences in the nature of these businesses make it imperative that findings bescrutinized for endogeneity.
3.3. Analyses
We employed Tobin's q (market value to assets as computed by Chung and Pruitt, 1994)as the measure of market based performance. As predictors we used the seven previouslydefined indicators of lone founder and family ownership and management (see Section 2.2).Each model controls for industry at the two-digit SIC level using industry averages of thedependent variable as a control for each firm. To assess robustness we also used the Fama-French 49 industry portfolio dummies (Fama and French, 1997); there was no materialchange in results. Our selection of other control variables follows Anderson and Reeb(2003), Bertrand and Schoar (2003), and Villalonga and Amit (2006b). Our modelsincorporate the advertising to sales ratio, R&D to sales (missing values for both variableswere coded as 0, as firms are required by law to report significant expenditures), and newinvestment in plant and equipment. We also incorporate debt/equity ratios, the volatility ofcompany returns (beta), total ownership of outside N5% blockholders, special voting shares(a dummy), firm age, and the natural log of firm sales. Annual data are used for all panelanalyses, and 3 and 5 year averages, respectively, are used for the OLS and two-steptreatment regressions.
Following Greene (2003: pp. 787–790, and personal communication) and Villalonga andAmit (2006b) we corrected for endogeneity using treatment effect regressions for all ourindicators of lone founder- and family-ownership and management (see also Maddala, 1983). Weused the treatreg (Heckman two-step option) subroutine of the Stata package (version 8.2 SE).The first stage of the procedure is a probit analysis that regresses the firm governance indicator

Table 3Number and percent of firms classified as family, lone founder, or all others by two digit SIC Code
SICCode
Industry Description Firms Non-Family /Non-Lonefounder
FamilyFirms
LoneFounderFirms
% FamilyFirms inIndustry
% Lone FounderFirms in Industry
1 Agricultural Production 2 1 1 50% 0%7 Agricultural Services 1 1 100% 0%10 Metal Mining 1 1 0% 0%13 Oil and Gas Extraction 18 12 5 1 28% 11%14 Mining and Quarrying of
Nonmetallic Minerals, ExceptFuels
2 2 0% 0%
15 General Building Contractors 11 3 3 5 27% 45%16 Heavy Construction, Except
Buildings5 2 3 60% 0%
17 Special Trade Contractors 3 3 0% 33%20 Food And Kindred Products 34 14 19 1 56% 3%21 Tobacco Products 2 2 0% 0%22 Textile Mill Products 5 2 2 1 40% 20%23 Apparel And Other Finished
Products Made From Fabrics10 5 3 2 30% 40%
24 Lumber And Wood Products,Except Furniture
10 6 3 1 30% 30%
25 Furniture And Fixtures 9 4 5 56% 0%26 Paper And Allied Products 17 9 8 47% 0%27 Printing, Publishing, And Allied
Industries19 4 13 2 68% 11%
28 Chemicals And Allied Products 49 35 10 4 20% 10%29 Petroleum Refining And Related
Industries12 8 4 33% 0%
30 Rubber And MiscellaneousPlastics Products
8 5 2 1 25% 13%
31 Leather And Leather Products 1 1 0% 0%32 Stone, Clay, Glass, And Concrete
Products4 2 1 1 25% 25%
33 Primary Metal Industries 16 12 3 1 19% 13%34 Fabricated Metal Products,
Except Machinery And Trans.Equipment
10 6 3 1 33% 11%
35 Industrial And CommercialMachinery And ComputerEquipment
52 32 11 9 21% 17%
36 Electronic (non computer) AndOther Electrical Equip
45 17 14 14 31% 33%
37 Transportation Equipment 33 20 10 3 30% 12%38 Measuring, Analyzing, And
Controlling Instruments;Photographic
19 12 5 2 26% 11%
39 Miscellaneous ManufacturingIndustries
2 1 1 50% 0%
40 Railroad Transportation 4 4 0% 25%42 Motor Freight Transportation
And Warehousing10 4 5 1 50% 10%
45 Transportation By Air 12 9 3 0% 33%46 Pipelines, Except Natural Gas 1 1 0% 100%
840 D. Miller et al. / Journal of Corporate Finance 13 (2007) 829–858

Table 3 (continued )
SICCode
Industry Description Firms Non-Family /Non-Lonefounder
FamilyFirms
LoneFounderFirms
% FamilyFirms inIndustry
% Lone FounderFirms in Industry
47 Transportation Services 6 4 2 33% 17%48 Communications 24 6 14 4 58% 17%49 Electric, Gas, And Sanitary Services 68 60 4 4 6% 6%50 Wholesale Trade—durable Goods 26 10 8 8 31% 38%51 Wholesale Trade—non-durable Goods 20 11 5 4 25% 25%52 Building Materials, Hardware,
Garden Supply, And Mobile Home5 3 1 1 20% 20%
53 General Merchandise Stores 20 11 8 1 40% 5%54 Food Stores 14 6 7 1 50% 7%55 Automotive Dealers And Gasoline
Service Stations8 2 4 2 50% 25%
56 Apparel And Accessory Stores 13 6 6 1 46% 8%57 Home Furniture, Furnishings,
And Equipment Stores8 3 2 3 25% 38%
58 Eating And Drinking Places 10 5 2 3 22% 44%59 Miscellaneous Retail 26 8 10 8 38% 35%60 Depository Institutions 48 35 12 1 24% 2%61 Non-depository Credit Institutions 9 6 1 2 11% 22%62 Security And Commodity Brokers,
Dealers, Exchanges, And Services13 6 4 3 31% 31%
63 Insurance Carriers 47 25 15 7 31% 14%64 Insurance Agents, Brokers, And Service 4 2 2 50% 0%65 Real Estate 1 1 0% 100%67 Holding And Other Investment Offices 4 1 1 2 25% 75%70 Hotels, Rooming Houses, Camps, And
Other Lodging Places5 2 3 40% 60%
72 Personal Services 3 1 2 67% 0%73 Business Services 47 21 9 17 20% 41%75 Automotive Repair, Services, And
Parking4 3 1 25% 25%
78 Motion Pictures 2 2 0% 100%79 Amusement And Recreation Services 4 1 3 0% 75%80 Health Services 19 9 4 6 21% 32%87 Engineering and Management Services 6 5 1 0% 33%99 Non Classifiable Establishments 5 3 2 40% 0%
n 896 492 263 141 29% 18%
Number and percent of firms are classified by their two digit SIC code. Family firms are defined as those in which multiplefamily members are insiders (officers or directors) or large owners (5% or more of the firm's equity) at the same time orover the life of the company as family descendants. Lone founder firms are defined as those in which an individual is oneof the company's founders with no other family members involved, and is also an insider (officer or director) or is a largeowner (5% or more of the firm's equity). The sample of firms originated using the Fortune 1000 listing of 2001. Lonefounder and family categories are mutually exclusive. % family/lone founder firms in industry are calculated as the numberof family/lone founder firms divided by all firms.
841D. Miller et al. / Journal of Corporate Finance 13 (2007) 829–858
dummies (for family or lone founder ownership or management) against the same controls usedfor the OLS and panel analyses, plus five other variables shown to distinguish among lonefounder, family, and other businesses. These variables are unsystematic risk (Anderson andReeb, 2003), cash holdings (Miller and Le Breton-Miller, 2005) the average age of directors

Table 4Descriptive data and test of means for family, lone founder, and all other firms
[a] [b] [c] [d] [e] [f]
Variable All Others Combined [c]+ [f] Family Family 1st Gen Family 2nd Gen Lone Founder t-stat.
Mean Std. Dev. Mean Std. Dev. Mean Std. Dev. Mean Std. Dev. Mean Std. Dev. Mean Std. Dev. [c] – [a] [f] – [a] [c] – [f]
Tobin's q 1.759 1.122 2.166 1.686 1.869 1.154 2.010 1.475 1.806 .976 2.720 2.284 1.31 6.70⁎⁎⁎ −4.98⁎⁎⁎Industry Tobin's q 1.132 .730 1.226 .679 1.192 .654 1.210 .652 1.184 .657 1.306 .722 1.11 2.51⁎ −1.62Ind Adjusted Tobin's q .085 .769 .363 1.226 .181 .857 .307 1.246 .144 .658 .638 1.629 1.72 6.08⁎⁎⁎ −3.91⁎⁎⁎R&D/Sales .016 .035 .017 .047 .011 .029 .011 .037 .010 .025 .030 .067 −1.75 3.63⁎⁎⁎ −4.16⁎⁎⁎Advertising/Sales .008 .022 .011 .033 .012 .033 .007 .015 .014 .039 .010 .027 2.14⁎ 1.13 .57CAPX/PPE (Investment) .189 .143 .266 .209 .228 .137 .283 .163 .204 .116 .321 .239 3.96⁎⁎⁎ 8.21⁎⁎⁎ −3.94⁎⁎⁎Beta (Market Risk) .717 .796 .933 .716 .826 .479 .996 .596 .751 .395 1.130 .989 2.02⁎ 5.09⁎⁎⁎ −4.11⁎⁎⁎Debt/Mkt Value Equity 1.030 2.771 .809 2.586 .707 2.142 .725 1.537 .530 .928 1.000 3.259 −1.66 − .11 −1.08Outside Blockholders .242 .252 .185 .171 .175 .161 .191 .154 .169 .163 .203 .184 −4.12⁎⁎⁎ −1.83 −1.61Supershares .031 .176 .198 .399 .213 .410 .222 .418 .209 .408 .170 .377 8.51⁎⁎⁎ 6.17⁎⁎⁎ 1.02Sales ($mm) 9.596 18.225 6.485 14.505 7.215 17.194 5.704 70.468 7.878 20.076 5.115 6.963 −1.73 −2.83⁎⁎ 1.37Sales Growth .265 .358 .370 .411 .301 .347 .492 .475 .217 .228 .499 .486 1.26 6.20⁎⁎⁎ −4.71⁎⁎⁎Firm Age 72.375 46.504 52.353 38.398 66.973 38.831 35.432 22.233 81.011 36.343 25.085 16.490 −1.61 −11.86⁎⁎⁎ 12.22⁎⁎⁎
Largest Owner .514 .500 .574 .495 .617 .489 .555 .498 .404 .492 5.71⁎⁎⁎
Largest Owner & CEO .297 .457 .342 .475 .506 .503 .269 .445 .212 .411 4.76⁎⁎⁎
Shares Owned % .165 .191 .188 .195 .204 .196 .181 .195 .121 .176 4.95⁎⁎⁎
Shares Owned2 .048 .108 .074 .128 .080 .133 .071 .126 .045 .115 2.67⁎⁎
CEO .509 .500 .506 .501 .494 .503 .418 .495 .517 .501 2.96⁎⁎
CH .509 .500 .662 .474 .728 .448 .588 .494 .716 .452 2.91⁎⁎
CEO–CH .485 .500 .483 .501 .457 .501 .396 .490 .489 .501 2.82⁎⁎
# firms 492 404 263 81 182 141
This table reports means, standard deviations, and tests between means for the categories represented by (a) all firms not categorized as family or lone founder; (c) family firms are defined as those in whichmultiple family members are insiders (officers or directors) or large owners (5% or more of the firm's equity) at the same time or over the life of the company as family descendants; (d) family 1st Gen indicatesfamily firms with only first generation involvement; (e) family 2nd Gen indicates family firms with second or later generation involvement; (f) lone founder firms are defined as those in which an individual isone of the company's founders with no other family members involved, and is also an insider (officer or director) or is a large owner (5% or more of the firm's equity). The sample of firms originated using theFortune 1000 listing of 2001. Complete data were available for 896 of these firms for the years 1996–2000. Except for the panel data analyses, we retained only those 863 firms in which the family or the lonefounder were present in the firm from 1996–2000 inclusive. All figures used are five year averages for the years 1996 to 2000 (we also ran 3 year averages 1998–2000& 1996–1998, with no significant changein results). RoA is measured as income before extraordinary items divided by total assets; Tobin's q is measured as the ratio of the firm's market value to total assets; industry performance for both ROA andTobin's q is aggregated at a two digit SIC code. Other measures include R&D/sales; advertising/sales; CAPX/PPE (investment); beta (market risk); debt/market value of equity; outside blockholders(ownership percentage of all major (N5%) non-family or non-lone founder owners); supershares, a dummy variable indicating the presence of control enhancing mechanisms. Sales are the firms annual netsales; sales growth represents the percentage growth using firm annual net sales from 1996 to 2000; firm age is 2000 minus the firm year founded; largest owner is a dummy indicating that the family or lonefounder is the largest shareholder in the firm; largest owner & CEO indicates the family or lone founder is the largest shareholder and holds the title of CEO; shares owned % is the percentage of shares ownedby the family or lone founder expressed against the total outstanding shares; shares owned2 is the squared term of shares owned %; CEO is a dummy indicating that a family member or lone founder holds thetile of CEO; CH is a dummy indicating that a family member or the lone founder holds the title of Board Chair; CEO-CH is a dummy indicating that a family member or the lone founder holds the titles of CEOand Board Chair. t-statistics are calculated with n−1 degrees of freedom and tests for u=uo. Asterisks represent statistical significance at 0.1% (⁎⁎⁎),b1% (⁎⁎), b5% (⁎) respectively.
842D.Miller
etal.
/Journal
ofCorporate
Finance
13(2007)
829–858

Table 5Regressions of market based measures of performance on family and lone founder firms
Variable Tobin's q
Model 1 Model 2 Model 3 Model 4
Combined .173⁎
(2.04)Family .026
(.29)Lone founder .478⁎⁎⁎ .491⁎⁎⁎
(3.94) (3.96)Family 1st Gen .088
(.56)Family 2nd Gen .004
(.04)Industry Tobin's q .348⁎⁎⁎ .346⁎⁎⁎ .348⁎⁎⁎ .349⁎⁎⁎
(5.77) (5.74) (5.83) (5.83)R&D/sales 14.133⁎⁎⁎ 14.242⁎⁎⁎ 13.865⁎⁎⁎ 13.881⁎⁎⁎
(13.74) (13.84) (13.50) (13.51)Advertising/sales 7.599⁎⁎⁎ 7.500⁎⁎⁎ 7.459⁎⁎⁎ 7.494⁎⁎⁎
(5.30) (5.23) (5.24) (5.26)CAPX/PPE (investment) 1.499⁎⁎⁎ 1.445⁎⁎⁎ 1.398⁎⁎⁎ 1.385⁎⁎⁎
(6.36) (6.09) (5.92) (5.83)Beta (market risk) .106⁎ .092 .080 .079
(2.02) (1.74) (1.52) (1.49)Debt/market value of equity − .055⁎⁎ − .052⁎⁎ − .055⁎⁎ − .054⁎⁎
(−3.35) (−3.15) (−3.30) (−3.30)Outside blockholders − .676⁎⁎⁎ − .612⁎⁎ − .617⁎⁎ − .617⁎⁎
(−3.74) (−3.34) (−3.39) (−3.38)Supershares − .125 − .190 − .170 − .171
(− .99) (−1.45) (−1.31) (−1.32)Firm size .101 .109⁎⁎ .108⁎⁎ .108⁎⁎
(2.57) (2.78) (2.76) (2.76)Firm age − .083 − .075 − .031 − .026
(−1.96) (−1.77) (− .71) (− .59)Constant .302 .151 .118 .029
(.86) (.42) (.33) (.08)R2 .428 .431 .438 .439F 63.83⁎⁎⁎ 58.62⁎⁎⁎ 55.45⁎⁎⁎ 51.16⁎⁎⁎
N 863 863 863 863
Results reported are from OLS regressions of firm performance on categorical variables denoting family firm, family firm in firstgeneration, family firm in second or later generation or lone founder firm. The sample of firms originated using the Fortune 1000 listing of2001. We retained only those firms in which the family or the lone founder were present in the firm from 1996–2000. Firms in which statuschanged during our observation window were deleted from these analyses (N=863). Family-firms are defined as those in which multiplefamily members are insiders (officers or directors) or large owners (5% or more of the firm's equity) at the same time or over the life of thecompany as family descendants. Lone founder firms are defined as those in which an individual is one of the company's founders with noother family members involved, and is also an insider (officer or director) or a large owner (5% or more of the firm's equity). Family 1st Genindicates family firms with only first generation involvement. Family 2nd Gen indicates family firms with second or later generationinvolvement. All figures used are five year averages for the years 1996 to 2000 (we also ran 3 year averages 1998–2000 & 1996–1998, withno significant change in results).Tobin's q is the firm market value divided by total assets. Control variables are as follows: industryperformance (Tobin's q) is aggregated at a two digit SIC code (using instead the 49 Fama-French industry portfolio produced no materialchange in results); R&D/sales; advertising/sales; CAPX/PPE (investment); beta (market risk); debt/market value of equity; outsideblockholders (ownership percentage of all major (N5%) non-family or non-lone founder owners); supershares, a dummy variable indicatingthe presence of control enhancing mechanisms; firm size as the natural log of annual net sales, and firm age as the natural log of firm yearssince founding. Model 1 lists only controls. Model 2 compares all family and lone founder firms combined vs. all others; Model 3 comparesfamily firms and lone founder firms vs. all others; and Model 4 compares family first generation, family second generation, and lonefounder firms vs. all others. t-statistics are displayed in parentheses and asterisks represent statistical significance at less than b0.1% (⁎⁎⁎),b1% (⁎⁎), b5% (⁎), respectively.
843D. Miller et al. / Journal of Corporate Finance 13 (2007) 829–858

Table 6Summary OLS results for market based measures of performance for various classifications of family / lone founder status
Tobin's q
Combined Family Lone Founder Family 1st Gen Family 2nd Gen
Dummy .173⁎ .031 .478⁎⁎⁎ .084 − .009(2.04) (.33) (3.94) (.59) (.09)
Shares owned % 1.866⁎⁎ .270 6.718⁎⁎⁎ − .636 .786(2.62) (.34) (5.28) (.52) (.82)
Shares owned % 2 −3.198⁎⁎ − .627 −10.732⁎⁎⁎ .678 −1.376(2.72) (.47) (4.97) (.31) (.83)
Largest owner .320⁎⁎ .110 .871⁎⁎⁎ .114 .108(3.17) (.98) (5.21) (.63) (.84)
Largest owner and CEO .083 − .161 .421⁎⁎ − .161 − .165(.67) (1.19) (2.71) (.82) (.94)
CEO − .015 − .177 .311⁎ − .022 .239(.16) (1.57) (2.05) (.11) (1.83)
CH .008 − .006 .574⁎⁎⁎ .073 − .045(.08) (.06) (4.34) (.45) (.37)
CEO and CH .053 − .175 .377⁎⁎ .007 − .226(.54) (1.55) (2.74) (.04) (1.71)
N 863 863 863 863 863
Reported above are summary results of OLS regressions of Tobin's q on various classifications of family and lone founderstatus (35 separate regressions, 7 per column). The sample of firms originated using the Fortune 1000 listing of 2001. Weretained only those firms in which the family or the lone founder were present in the firm from 1996–2000. Firms in whichstatus changed during our observation window were deleted from these analyses (N=863). Tobin's q is the ratio of thefirm's market value to its total asset value. The dummy variables represent our different firm definitions. The combinedcolumn dummy represents both family and lone founder firms in total. Family firms are defined as those in which multiplefamily members are insiders (officers or directors) or large owners (5% or more of the firm's equity) at the same time orover the life of the company as family descendants. Lone founder firms are defined as those in which an individual is oneof the company's founders with no other family members involved, and is also an insider (officer or director) or a largeowner (5% or more of the firm's equity). Family 1st Gen indicates family firms with only first generation involvement.Family 2nd Gen indicates family firms with second or later generation involvement. Other firm status indicators follow:shares owned % is the percentage of shares owned by the family or lone founder expressed against the total outstandingshares; shares owned 2 is the squared term of shares owned %; largest owner is a dummy indicating that the family or lonefounder is the largest shareholder in the firm; largest owner & CEO indicates the family or lone founder is the largestshareholder and holds the title of CEO; CEO is a dummy indicating that a family member or lone founder holds the tile ofCEO; CH is a dummy indicating that a family member or lone founder holds the title of Board Chair; CEO-CH is a dummyindicating that a family member or lone founder holds the tile of CEO and Board Chair. Not shown but included in eachregression are the control variables of Table 4. All figures used are five year averages for the years 1996 to 2000 (we alsoran 3 year averages 1998–2000 & 1996–1998, with no significant change in results). Industry performance for Tobin's q isaggregated at a two digit SIC code (using instead the 49 Fama-French industry portfolio produced no material change inresults). Other controls include R&D/sales; advertising/sales; CAPX/PPE (investment); beta (market risk); debt/marketvalue of equity; outside blockholders (ownership percentage of all major (N5%) non-family or non-lone founder owners);supershares, a dummy variable indicating the presence of control enhancing mechanisms; firm size as the natural log ofannual net sales; and firm age as the natural log of firm years since founding. All models are significant at b .000. AverageR2 for the models is approximately .45. t-statistics are displayed in parentheses and asterisks represent statisticalsignificance at less than 0.1% (⁎⁎⁎), b1% (⁎⁎), b5% (⁎), respectively.
844 D. Miller et al. / Journal of Corporate Finance 13 (2007) 829–858
(Ward, 2004), sales growth (Villalonga and Amit, 2006b), and firm age (Anderson and Reeb,2003).
The advantage of two-stage treatment regression over full information structural approachessuch as GMM, full information maximum likelihood, or three-stage least squares, is its lesser

845D. Miller et al. / Journal of Corporate Finance 13 (2007) 829–858
susceptibility to the proliferation of specification error and distortion (Greene, 2003: 411–415 andpersonal communication).
3.4. Robustness and tests of selection bias
A number of measures were employed to establish the robustness of our results. Three timeperiods (one 5 year, and two distinct 3 year periods, as well as annual panel data analyses) andseven indicators for lone founder and family ownership and management were used. We alsoreplaced % of family/ lone-founder votes by % of family/ lone founder ownership with nomaterial change in results. Moreover, we systematically varied our sets of control variables:specifically, firm size, advertising expenses, investment, beta and director vote control, wereindividually added and deleted. Both Fama-French and 2-digit SIC code dummies were used asalternatives for industry controls. Finally, we controlled for industry in our regressions bysubtracting industry (2-digit SIC median) q from the dependent variable (Table 8, models 5 to 8).
In addition to the traditional panel data approaches used by other studies, we used the moreconservative, smaller sample, cross sectional analyses based on two 3-year averages (1996 to1998 and 1998 to 2000) and one 5-year average (1996 to 2000) of firms that did not changegovernance status. Also, treatment regressions were run to control for selection bias. Wereplicated all of the analysis of Tables 4–7 on the Fortune 500 part of our Fortune 1000 data(these analyses are available from the authors).
Our findings were highly consistent across time intervals (panel vs. 3- vs. 5-year averages),across virtually all definitions of lone-founder businesses and family businesses, across the threetypes of industry controls, across the different sets control variables, across different types ofanalyses (OLS, panel, and treatment regressions), and across both the Fortune 500 and Fortune1000 data. Any material differences are presented in our results and discussed. Additional tests,reported below, were conducted to determine and eliminate selection bias.
4. Findings
4.1. Replication of prior work
Table 3 shows the Fortune 1000 industry breakdowns by 2-digit SIC codes. The columnspresent the numbers of family, lone-founder and other firms in the Fortune 1000. When thefamily and lone-founder columns are summed, the results for industry representation by firm typeare comparable to those presented by Anderson and Reeb (2003) and Villalonga and Amit(2006b) in their studies of the S&P 500 and Fortune 500, respectively.
Table 4 provides descriptive statistics, broken down by firm classifications, where family 1stGen represents first generation family firms and family 2nd Gen represents second and latergeneration family firms. Tobin's q is clearly much higher in lone-founder businesses than infamily businesses. Again our results for the combined lone-founder plus family sample arecomparable to those of Anderson and Reeb (2003) and Villalonga and Amit (2006b).
Tables 5 and 6 present OLS regressions based on 5-year averages of those companies that did notchange their ownership status over the 5-year interval. The row labeled “combined” in Table 5 andthe “combined” column of Table 6 replicate the findings of Anderson and Reeb (2003) andVillalonga and Amit (2006b). These results indicate that when we combine family and lone-founderclassifications, as did these previous authors, that aggregate group does indeed appear to manifestsuperior market valuations.

Table 7Matched sample comparing ownership status - summary statistics
Tobin's q Annual Sales $(000) Examples of Matched Firms
SIC code Industry description # in eachcategory
Fmly LoneFndr
Other Fmly LoneFndr
Other Family Lone Founder Other
13 Oil and gas extraction 1 1.58 1.37 1.20 2784.10 29445.00 13574.00 Devon Energy Corp Dynegy Inc Occidental Petroleum15 General building contractors 3 1.29 1.19 1.01 1811.11 1796.37 2331.65 Toll Brothers Inc M D C Holdings Inc Ryland Group Inc A20 Food and kindred products 1 2.34 4.43 1.15 2123.50 2169.22 2524.91 McCormick & Co Starbucks Corp International Multifoods22 Textile mill products 1 1.10 1.10 1.72 1217.58 1283.95 1280.41 Russell Corp Interface Inc Unifi Inc23 Apparel 2 3.19 2.49 1.72 3954.29 3184.24 2677.04 V F Corp Jones Apparel Gp Liz Claiborne Inc24 Lumber and wood products 1 1.76 1.08 1.04 1293.35 2448.00 2194.83 Clayton Homes Inc Maxxam Inc Nortek Holdings Inc27 Printing, publishing, and
allied industries2 1.26 1.49 1.72 2053.81 2058.08 1565.24 American Greetings Mail Well Inc Wallace Computer Services
28 Chemicals and allied products 3 1.48 2.69 1.62 1517.00 1566.25 1562.43 Cabot Corp Allergan Inc Grace (W R) & Co30 Rubber and miscellaneous
plastics1 1.96 2.69 1.32 6934.75 9488.80 14417.10 Newell Rubbermaid Nike Inc Goodyear Tire & Rubber Co
32 Stone, clay, glass, andconcrete
1 1.07 1.64 1.45 1278.60 3781.00 4940.00 Texas Industries U S G Corp Owens Corning
33 Primary metal industries 2 2.37 1.36 1.28 4493.90 2760.17 3080.25 Corning Inc Nucor Corp A K Steel Holding Corp34 Fabricated metal products 1 1.89 1.37 1.21 1491.19 1877.50 2531.95 Crane Co Silgan Holdings Inc Tower Automotive Inc35 Industrial and commercial
machinery10 2.11 4.13 1.45 9411.23 9343.31 9904.94 Nacco Industries 3Com Corp Pentair Inc
36 Electronic (non computer)other electronic
15 2.88 3.55 1.62 5062.74 5215.16 3810.73 Jabil Circuit Inc Advanced MicroDevices
Cooper Industries Ltd
37 Transportation equipment 3 1.20 1.83 0.99 1729.22 1824.32 2064.06 Fleetwood Enterprises Dura Automotive Sys Borgwarner Inc38 Measuring, analyzing, and
controlling2 3.45 8.11 2.04 3220.89 4050.25 4588.26 Boston Scientific Guidant Corp Thermo Electron Corp
42 Motor freight transportation 1 2.02 1.72 0.98 1258.67 1418.49 2352.37 Swift Transportation Landstar System Inc Consolidated Freightways48 Communications 4 1.74 1.42 2.56 6172.96 10477.06 9869.05 Adelphia Comm. Charter Comm Cincinnati Bell Inc49 Electric, gas, and sanitary
services4 1.25 1.37 1.06 4714.07 4481.29 4442.44 Williams Cos A E S Corp Oneok Inc
50 Wholesale trade-durablegoods
7 1.29 1.40 1.25 4576.09 3434.26 2973.01 Tech Data Corp Arrow Electronics Inc Avnet Inc
846D.Miller
etal.
/Journal
ofCorporate
Finance
13(2007)
829–858

51 Wholesale trade—non-durable goods
4 0.97 1.27 0.91 4015.54 1736.98 1489.96 Nash Finch Central Garden & Pet Dimon Inc
52 Building materials,hardware, garden
1 2.70 6.18 1.78 18778.56 45738.00 5211.62 Lowes Companies Home Depot Inc Sherwin Williams Co
53 General merchandise stores 1 1.01 5.85 1.60 1550.00 1688.11 3277.09 Service Merchandise Dollar Tree Stores Inc Big Lots Inc54 Food stores 1 1.01 2.69 0.98 1932.09 1838.63 2525.31 Ingles Markets Whole Foods
Market IncPenn Traffic Co
55 Automotive dealers, gasolineservice
2 1.89 1.23 1.16 2967.40 3261.23 2799.53 C S K Auto Corp Caseys General St Pantry Inc
56 Apparel and accessory stores 1 1.16 2.48 1.98 2400.29 2709.04 2948.40 Burlington Coat Ross Stores Inc Payless Shoesource Inc57 Home furniture, furnishings 3 2.74 3.45 2.35 4705.67 6379.27 2600.18 Williams Sonoma Bed Bath & Beyond
IncLinens N Things Inc
58 Eating and drinking places 3 1.69 2.16 1.73 2767.72 2100.93 1633.31 C K E Restaurants Brinker InternationalInc
Jack In The Box Inc
59 Miscellaneous retail 6 1.31 3.89 1.69 4689.31 4224.45 4222.65 Michaels Stores Amazon Com Inc Borders Group Inc60 Depository institutions 1 1.07 1.09 1.12 3957.36 3867.47 3761.72 Golden West Fin. Southtrust Corp Amsouth Bancorporation61 Non-depository credit
institutions2 1.69 1.06 1.28 1438.57 3198.06 3202.69 Metris Cos Countrywide Fin Capital One Financial Cor
62 Security, commodity brokers,dealers
3 2.30 2.51 5.07 2180.10 1594.53 1212.33 Franklin Resources E Trade Fin T Rowe Price Group Inc
63 Insurance carriers 7 1.28 1.39 1.04 10201.66 5330.07 5002.97 Progressive Corp Chubb Corp Safeco Corp67 Holding and other investment
offices2 1.23 1.48 1.52 1473.00 3489.75 242.32 Host Marriott Cendant Corp Vencor Inc
73 Business services 18 1.87 4.50 2.96 2775.55 4401.87 4215.44 Comdisco Administaff Inc Spherion Corp80 Health services 6 1.74 1.59 1.44 2280.48 4809.70 4006.19 Laboratory Corp Am. Community Health Triad Hospitals Inc
Total and means 126 1.85 2.81 1.76 4406.53 5006.13 4226.68Grand mean 2.14 4546.45S.D. 1.61 6476.11
The table compares a matched sample of firms originatingwith the 2001 Fortune 1000.Matches were identified based on the lone founder category as it was the smallest n (n=141).We sorted our firms by SIC using atwo digit categorization and eliminated any SIC in which each firm ownership category (family, lone founder, other) was not represented by at least one member. This left a matched sample of 126 lone founder firmsrepresenting 36 SIC two digit categories from which the closest family and other firm in terms of sales was identified. The column labeled “# in each category” represents the number of each category matched. Forexample for SIC code 15 the 3 indicates that there are 3 family firms, 3 lone founder firms, and 3 other firms, each matched with its closest two digit SIC in annual sales. The Tobin's q reported is the five year firmaverage; one year and three year averages produced very consistent results.
847D.Miller
etal.
/Journal
ofCorporate
Finance
13(2007)
829–858

848 D. Miller et al. / Journal of Corporate Finance 13 (2007) 829–858
Because Anderson and Reeb (2003) and Villalonga and Amit (2006b) studied the S&P 500and Fortune 500, respectively, we also ran the combined lone-founder plus family group on theFortune 500 subsample of our Fortune 1000 data (all Fortune 500 results are available from theauthors). Our results became even more similar to those of the prior studies. Specifically,compared to our Fortune 1000 results, those for our Fortune 500 sample show higher levels ofsignificance for the combined lone-founder business plus family business group for the dummiesof Tables 5 and 6, and for the dummy, large owner, large owner plus CEO, CEO/Chairman, andChairman categories. Combined results for the Fortune 500 remained non-significant only inpanel analyses for firms with family or lone-founder CEOs or Chairmen. But even these findingsbecame significant when we adjusted for endogeneity (in the manner of Table 10). Thus theresults of those previous studies are replicated robustly when we combine family and lone-founder into a single category.
4.2. Extension of prior work
Tables 5 and 6 show that when we differentiate between lone founder businesses and familybusinesses, the superior performance holds only for the former group, and does not emerge evenfor family firms in the first generation. This contrasts with the findings of Anderson and Reeb(2003) and Villalonga and Amit (2006b) who employed broader definitions of first generationfamily businesses that blend family founder firms with lone founders. The findings of Table 5indicate that lone-founders do significantly better than other firms in Tobin's q, whereas familybusinesses never do so. When analyses were run for 3 year averages, these findings did notchange, except that in the first three-year period family firms in general displayed a very marginaladvantage in Tobin's q ( pb0.10), while second generation family firms showed a marginaldisadvantage ( pb0.10).
Table 6 documents the range of the findings by examining more refined divisions of thefamily and lone-founder categories (% shares owned, lone-founder or family serving as largestowner, CEO, chairman, etc.). The results are most consistent with Table 5. Family businesses,however defined, never outperform in Tobin's q. These results do not improve when only firstgeneration family businesses are analyzed, again contrasting with the findings of Anderson andReeb (2003) and Villalonga and Amit (2006b). On the other hand, firms in all lone-founderownership and management classifications significantly out-perform (the inflection point forlone-founder ownership being 31%, as calculated by partial derivative). In short, marketperformance is highly sensitive to the definition of a family firm, even within a specificgeneration.
4.3. Matched firms analysis
As another way of controlling for industry and establishing the range of our results, weconducted a matched pair analysis of our firms (Table 7). Thirty-six distinct two-digit SIC groupswere identified that included at least one firm from each firm type (lone-founder firm, family firm,and other firm), yielding a total sample of 378 firms. Within each SIC category, we matched eachlone-founder firm with a family and other firm that was closest in sales volume, and thencompared the types for Tobin's q.
Table 7 indicates that the family column of firms shows superiority in Tobin's q in 10industries (constituting a total of 21 family firms vs. 42 non-family firms), whereas the lone-founder firms show superiority in 20 industries (constituting 92 lone-founder firms vs. 184 non-

849D. Miller et al. / Journal of Corporate Finance 13 (2007) 829–858
lone-founder firms). The regressions performed on this matched sample are presented in Table 8,models 1 to 4. Again the combined sample of lone-founder and family business shows superiorvaluations, as does the lone-founder sample; the family sample does not, either in the first or thesecond generation. Thus our earlier findings on the sensitivity of performance to family businessdefinitions are upheld in this matched sample comparison.
Table 8OLS regressions using matched firms and industry adjusted market measures of performance
Firm match by SIC and annual sales Industry adjusted measure ofperformance
Tobin's q Industry adjusted Tobins' q
Variable Model 1 Model 2 Model 3 Model 4 Model 5 Model 6 Model 7 Model 8
Combined .264⁎ .163⁎
(2.14) (2.50)Family .043 .073
(.36) (1.11)Lone Founder .552⁎⁎ .517⁎⁎ .355⁎⁎ .354⁎⁎
(3.22) (2.99) (3.08) (3.07)Family 1st Gen − .225 − .061
(−1.43) (.52)Family 2nd Gen .227 .078
(1.64) (1.18)Industry Tobin's q .251⁎⁎ .264⁎⁎ .289⁎⁎⁎ .396⁎⁎⁎
(3.10) (3.20) (3.55) (3.62)R&D/sales 13.081⁎⁎⁎ 13.063⁎⁎⁎ 12.606⁎⁎⁎ 12.622⁎⁎⁎ 4.862⁎⁎ 4.968⁎⁎ 4.755⁎⁎ 4.751⁎⁎
(5.86) (5.86) (5.73) (5.70) (3.14) (3.23) (3.11) (3.10)Advertising/sales 10.145⁎⁎ 10.121⁎⁎ 9.309⁎ 9.456⁎ 2.043 1.957 1.934 1.926
(2.86) (2.78) (2.43) (2.49) (1.37) (1.30) (1.27) (1.26)CAPX/PPE (investment) 1.843⁎ 1.846⁎⁎⁎ 1.770⁎ 1.755⁎⁎⁎ 1.019⁎⁎ .955⁎⁎ .922⁎⁎ .925⁎⁎
(2.50) (2.47) (2.31) (2.31) (3.68) (3.49) (3.40) (3.40)Beta (market risk) .149 .116 .093 .123 .092⁎ .081⁎ .072 .073
(1.30) (1.00) (.84) (1.11) (2.33) (2.09) (1.91) (1.91)Debt/market value of equity − .032 − .029 − .030 − .029 − .037⁎⁎ − .034⁎⁎ − .035⁎⁎ − .035⁎⁎
(−1.75) (−1.49) (−1.51) (−1.53) (−3.39) (−3.24) (−3.33) (−3.34)Outside blockholders − .509⁎ − .380 − .400 − .371 − .330⁎ − .270⁎ − .276 − .276⁎
(−2.06) (−1.50) (−1.62) (−1.50) (−2.44) (−1.97) (−2.04) (−2.04)Supershares − .413⁎⁎ − .493⁎⁎ − .483⁎⁎ − .484⁎⁎ − .110 − .176 − .163 − .163
(−3.00) (−3.40) (−3.39) (−3.34) (−1.17) (−1.77) (−1.64) (−1.63)Firm size 0.248⁎ .248⁎ .227⁎ .217⁎ .094⁎⁎ .104⁎⁎ .102⁎⁎ .102⁎⁎
(2.45) (2.46) (2.36) (2.23) (2.76) (2.94) (2.96) (2.95)Firm age − .087 − .067 − .003 − .042 − .078⁎ − .070⁎ − .042 − .043
(−1.32) (−1.03) (− .04) (− .58) (−2.49) (−2.34) (−1.41) (−1.43)Constant − .695 − .950 − .992 − .808 − .498 − .666⁎ − .750⁎ − .747⁎
(− .85) (−1.11) (−1.19) (− .96) (−1.80) (−2.27) (−2.54) (−2.51)R2 .442 .446 .461 .466 .175 .182 .190 .190F 12.45⁎⁎⁎ 11.33⁎⁎⁎ 10.48⁎⁎⁎ 10.14⁎⁎⁎ 7.10⁎⁎⁎ 6.76⁎⁎⁎ 6.30⁎⁎⁎ 5.91⁎⁎⁎
n 369 369 369 369 863 863 863 863
Results reported in Models 1–4 use a matched sample obtained from the original Fortune 1000 in 2001 (N=896 aftermissing data). The sample was drawn by pairing each lone founder firm in its industry with its closest match in annual salesfor family firms and others. We were able to match 126 lone founder firms with corresponding family and other firms for adata set consisting of 378 firms. To replicate Table 5, Models 5–7 utilize the full Fortune 1000 data set except that thedependent variable is adjusted by subtracting the median Tobin's q of the relevant two digit SIC. t-statistics are displayed inparentheses and asterisks represent statistical significance at b0.1% (⁎⁎⁎), b1% (⁎⁎), b5% (⁎), respectively.
850 D. Miller et al. / Journal of Corporate Finance 13 (2007) 829–858
4.4. Robustness: panel and treatment effects analyses
We assessed the robustness of our findings by examining five years of panel data and also byperforming Heckman treatment regressions. Table 9 presents the results from variance component(random effects) analyses employing five years of annual panel data, now including firms whoseownership status varies from 1996 to 2000. Separate models are presented showing the impact onTobin's q of a base model, of lone founder businesses and family businesses combined, of eachindividually, and of first and second generation family businesses, individually. A significantHausman test suggested correlation between the unobserved random effects and some of thecovariates. As a result we used Hausman–Taylor (1981) estimation, specifying different subsetsof covariates that were to be treated as endogenous (firm age, unsystematic risk, investment,advertising, R&D, debt and supershares). We ran models incorporating random combinations of4, 5 and 6 of these covariates, and virtually all models replicated the random effects findings.Again, family businesses did not outperform while lone founder businesses did.
We also ran random effects models using as predictors family and lone-founder as chairmanand CEO. These analyses again disclosed non-significant associations with Tobin's q for thefamily predictors, and significant and positive associations with Tobin's q for the lone-founderpredictors (these analyses are available from the authors).
It has been argued that not only may governance influence performance, performance mayinfluence governance (Demsetz, 1983; Demsetz and Lehn, 1985). It is important, therefore, tocheck our analyses for endogeneity, and adjust for it where it is significant. We did this byemploying the Heckman two-step procedure which first regresses the ownership category of afirm against a set of independent variables to generate an instrument; the instrument is thenincluded in a regression with performance as the dependent variable. The instrumental variablecorrects for omitted variables bias in the second regression (see Greene, 2003).
Table 10 presents treatment effects models using the Heckman two-step method (Greene, 2003:787–790; Maddala, 1983), along with lambda coefficients that assess selection bias in the originalmodels. The rows of the table show coefficients and Z-statistics (in brackets) for lambda selectionparameters and treatment effects, respectively, for our six different governance conditions. The lastfive columns of Table 10 show the different firm-type sub-samples being compared to a residualgroup. Although significant lambdas do indicate the presence of endogeneity in the originalanalyses, our adjusted results did not change materially from the originals. Specifically, the findingsfor the treatment effects coefficients of Table 10 correspond closely to the parallel results reported onTable 6. Once again our earlier findings are confirmed: neither first nor subsequent generation familybusinesses outperform other businesses, while lone-founder businesses do outperform undervirtually all ownership and management status definitions. Moreover, the “combined” columnreproduced the results of Anderson and Reeb (2003) and Villalonga and Amit (2006b).
The evidence in Table 10 further confirms the importance of distinguishing between lone-founder and family businesses in predicting the market-based premium. Specifically, familybusinesses have a non-significant difference in Tobin's q vis-à-vis other public corporationswhereas lone-founder businesses enjoy a 21.5% premium. Where the lone-founder is also theCEO, lone-founder businesses have a 94.4% premium vis-à-vis other public corporations whereasfamily businesses with a family member as CEO have an 11.5% market valuation disadvantagevis-à-vis other public corporations. Moreover, contrary to previous studies, the differences inperformance between the types are not attributable to differences in generation. As before, thesensitivity of our results to the definition of family business is upheld, now in panel analyses andin those incorporating endogeneity.

Table 9Panel data regressions of market based measures of performance on family and lone founder firm status
Variable Tobin's q
Model 1 Model 2 Model 3 Model4
Combined .127(1.85)
Family .049(.60)
Lone founder .245⁎⁎ .247⁎⁎
(2.60) (2.62)Family 1st Gen .055
(.43)Family 2nd Gen .054
(.61)Industry Tobin's q .991⁎⁎⁎ .991⁎⁎⁎ .987⁎⁎⁎ .987⁎⁎⁎
(49.15) (49.11) (48.81) (48.85)R&D/sales − .793 − .746 − .842 − .834
(.93) (.88) (.99) (.98)Advertising/sales 1.275 1.210 1.222 1.220
(.98) (.93) (.94) (.94)CAPX/PPE (investment) .752⁎⁎⁎ .724⁎⁎⁎ .717⁎⁎⁎ .714⁎⁎⁎
(4.89) (4.68) (4.63) (4.61)Beta (market risk) .032⁎ .031⁎ .030⁎ .030⁎
(2.18) (2.11) (2.06) (2.06)Debt/market value of equity − .026⁎ − .025⁎ − .026⁎ − .025⁎
(2.18) (−2.10) (2.12) (2.12)Outside blockholders − .354⁎ − .310 − .320⁎ − .319⁎
(2.22) (1.93) (2.00) (1.99)Supershares − .120 − .172 − .160 − .161
(1.10) (1.53) (1.42) (−1.44)Firm size .013 .019 .019 .019
(.48) (.69) (.69) (.70)Firm age − .042 − .035 − .018 − .018
(1.33) (1.09) (.54) (.55)Constant − .006 − .138 − .188 − .189
(.02) (.55) (.74) (.74)R2 .537 .538 .540 .540F 3105.52⁎⁎⁎ 3113.04⁎⁎⁎ 3115.08⁎⁎⁎ 3119.69⁎⁎⁎
N (firm year observations) 4152 4152 4141 4148# Firms 892 892 892 892
Results reported are from autoregressive random effects models on panel data. Tobin's q was regressed on firm status for the years 1996–2000 inclusive. The sample of firms originated using the Fortune 1000 listing of 2001 and represents 892 firms after accounting formissing data. Family firms are defined as those in which multiple family members are insiders (officers or directors) or large owners (5% ormore of the firm's equity) at the same time or over the life of the company as family descendants; family 1st Gen indicates family firms withonly first generation involvement; family 2nd Gen indicates family firms with second or later generation involvement; and lone founderfirms are defined as those in which an individual is one of the company's founders with no other family members involved, and is also aninsider (officer or director) or is a large owner (5% or more of the firm's equity). Tobin's q is firm market value divided by total assets.Industry measures are aggregated at a two digit SIC code. Other controls are as follows: R&D/sales; advertising/sales; CAPX/PPE(investment); beta (market risk); debt/market value of equity; outside blockholders (ownership percentage of all major (N5%) non-family ornon-lone founder owners); supershares, a dummy variable indicating the presence of control enhancing mechanisms; firm size is the naturallog of annual net sales; firm age is the natural log of firm years since founding. Analyses were random effects linear models with AR(1)disturbance. Model 1 lists only controls, Model 2 compares all family and lone founder firms combined vs. all others; Model 3 comparesfamily firms and lone founder firms vs. all others; and Model 4 compares family first generation, family second generation, and lonefounder firms vs. all others. Additional analyses were run using dummies for SIC two digit code as well as the 49 categories of the Fama-French industry portfolio with no significant change in results. t-statistics are displayed in parentheses and asterisks represent statisticalsignificance at b0.1% (⁎⁎⁎), b1% (⁎⁎), b5% (⁎), respectively.
851D. Miller et al. / Journal of Corporate Finance 13 (2007) 829–858

Table 10Treatment effects regressions of performance on family or lone founder status
Tobin's q
Variable Combined Lone founder Family Family 1 Family 2
Selection parameter (λ) fromtreatment effects model
Dummy − .377⁎ − .274 .041 − .191 .071(2.76) (1.68) (.33) (.88) (.46)
Treatment effects 0.818⁎⁎ .929⁎⁎ − .029 .415 − .106(3.12) (3.30) (.35) (1.07) (.42)
Selection parameter (λ) fromtreatment effects model
Large owner − .244 − .275 .109 − .130 .186(.93) (1.06) (.67) (.47) (.88)
Treatment effects .889⁎ 1.408⁎⁎ − .076 .363 − .230(1.98) (2.77) (.27) (.67) (.60)
Selection parameter (λ) fromtreatment effects model
Large Owner & CEO − .535 − .820⁎ − .060 − .240 .058(1.78) (2.69) (.27) (.83) (.15)
Treatment effects 1.089 2.150⁎⁎⁎ − .066 .299 − .301(1.93) (3.56) (.16) (.52) (.38)
Selection parameter (λ) fromtreatman effect model
CEO − .500⁎ − .774⁎⁎ − .092 − .373 − .077(2.07) (3.35) (.55) (1.39) (.34)
Treatment effects .675 1.690⁎⁎⁎ .030 .659 − .114(1.67) (3.62) (.11) (1.29) (.28)
Selection Parameter (λ) fromtreatment Effects Model
CH − .398⁎ − .543⁎⁎ .011 − .236 .083(2.38) (2.65) (.08) (1.02) (.42)
Treatment Effects .772⁎⁎ 1.500⁎⁎⁎ − .021 .481 − .187(1.91) (4.11) (.09) (1.15) (.54)
Selection parameter (λ) fromtreatment effects model
CEO/CH − .566⁎⁎ − .830⁎⁎ − .099 − .366 − .673(2.82) (3.35) (.58) (1.34) (.29)
Treatment effects .854⁎ 1.92⁎⁎⁎ .000 .671 − .116(2.54) (4.10) (.00) (1.27) (.27)
N 863 863 863 863 863
Results reported are the dummy variable and lambda coefficients from 30 treatment effects regressions of Tobin's q. Theyincorporate bases of comparisons denoted by the column heads. A complement category is compared to lone founder andfamily firms combined, lone founder firms, family firms, family firms 1st generation, and family firms 2nd and latergenerations. The sample of firms originated using the Fortune 1000 listing of 2001. We retained only those firms in whichthe family or the lone founder were present in the firm from 1996–2000. Firms in which status changed during ourobservation window were deleted from these analyses (N=863). The analyses encompass different family or lone founderstatuses: as a dummy variable, as ownership (family or lone founder as the biggest owner), as manager and owner (familyor lone founder as the biggest owner and CEO), and for different management positions (CEO, chairman, CEO andchairman). Tobin's q is measured as the ratio of the firm's market value to its total asset value. Family firms are defined asthose in which multiple family members are insiders (officers or directors) or large owners (5% or more of the firm'sequity) at the same time or over the life of the company as family descendants. Lone founder firms are defined as those inwhich an individual is one of the company's founders with no other family members involved, and is also an insider(officer or director) or is a large owner (5% or more of the firm's equity). All variables are averaged for the years 1996 to2000 (we also ran 3 year averages 1998–2000 and 1996–1998, with no significant change in results) and the treatmenteffects regressions are estimated, using Heckman's two-step consistent estimator. The first stage model includes variableswhich instrument for family or lone founder status: cash holdings; sales growth; director tenure; and unsystematic risk, plusall control variables of the second stage. The second stage regression controls for the following: R&D/sales; advertising/sales; CAPX/PPE (investment); debt/market value of equity; beta (market risk); outside blockholders (ownershippercentage of all major (N5%) non-family or non-lone founder owners); ratio of inside directors to outside directors;supershares, a dummy variable indicating the presence of control enhancing mechanisms; firm size as the natural log ofannual net sales; and firm age as the natural log of firm years since founding. Regressions also include industry controls at a2 digit SIC code. Dummies using a two digit SIC code or the 49 Fama-French industry portfolio were run with no materialchange in results. t-statistics appear in parentheses. All models are significant at beyond the 0.001 level. Asterisks denotestatistical significance at b0.1% (⁎⁎⁎), b1% (⁎⁎), b5% (⁎), respectively.
852 D. Miller et al. / Journal of Corporate Finance 13 (2007) 829–858

853D. Miller et al. / Journal of Corporate Finance 13 (2007) 829–858
4.5. Selection bias and a more inclusive random sample
Prior research on family firms in the U.S. has focused on firms in major indices such as theFortune 500 or a broader index such as the Fortune 1000, which has been the focus of ouranalysis. One concern is that the family or lone founder firms that become part of such indices maynot be representative of all such types of firms, possibly imparting a selection bias in the generalmode of analysis of family firms. We therefore perform a number of tests to address such potentialbiases.
Selection biases: Several methods were used to assess selection bias, the first two pertaining tothe Fortune 1000, the last to a sample of much smaller firms that we have gathered and analyzed.First, we compared a firm's Tobin's q before and after it made the Fortune 1000 list to determinethe effect on q of firms in each ownership category being included on the list. We compared qvalues for all firms in the years before and after they made the list for the period 1980 to 2004. Wefound that in 53% of the cases (N=552) the Tobin's q increased; but because the value of thedeclines exceeded that of the gains, the average q fell by 0.46. Moreover, for the years for whichwe had collected ownership data, we examined the annual change in q upon making the list foreach ownership category. The findings were as follows: for family businesses q increased 51% ofthe time upon making the list (N=46), for lone-founder businesses q increased only 39% of thetime (N=36), and for other firms q increased 47% of the time (N=83); all ownership categoriesshowing average declines in Tobin's q of 0.32, 0.54, and 0.26, respectively. Thus we concludedthat Tobin's q was not inflated simply by a firm's inclusion in the Fortune 1000 sample.
In order to establish whether it was merely the youthfulness of Fortune 1000 lone-founderbusinesses that accounted for their superior valuations, we stratified our sample based upon timesince founding into 10-year tiers: 0 to 10 years, 11 to 20 years, 21 to 30 years, 31 to 40 years, 41 to50 years, and more than 50 years. The lone-founder firms continued to have significantly higherTobin's q than either family or other firms in all but one age category: firms of 41 to 50 years ofage. This last result was likely due to the small sample size (N=10) for lone-founder firms in the41 to 50 age category. We also found that all categories of firms had spent a significant period as aFortune 1000 company. Of the firms reporting non-zero sales in Compustat from 1981(Compustat's start) to 2001, our family firms appeared on the Fortune 1000 list 52% of the time,while lone-founder and public corporations appeared 32% and 62% of the time.
A “Random 100” sample: It was important to determine whether superior valuations amonglone-founder firms would generalize beyond the Fortune 1000. Therefore we drew a randomsample of firms from the Compustat database that reported positive revenues in the year 2000and that traded on NASDAQ, AMEX or NYSE. The latter provided a universe of 4850 firms, towhich we assigned a random number and then chose the first 100 from a ranked sorting. Table 11provides summary statistics and means tests comparing this “Random 100” sample to theFortune 1000. According to simple means comparisons, lone-founders do not differ in Tobin's qbetween the Fortune and Random samples, and thus lone-founder businesses on the Fortune1000 do not appear to have inflated q's (indeed, industry adjusted q's are actually higher forlone-founders in the Random 100 sample than those in the Fortune 1000). The Fortune 1000and Random 100 samples are quite different however in that the latter is comprised of faryounger and smaller firms, with higher levels of capital investment, less market risk, feweroutside blockholders, and more concentrated ownership. Family and other firms also showhigher q's for the Random sample.
Table 12 presents regressions of Tobin's q on ownership structure and our control variables.These show that in the Random 100 sample, lone-founder firms continue to significantly
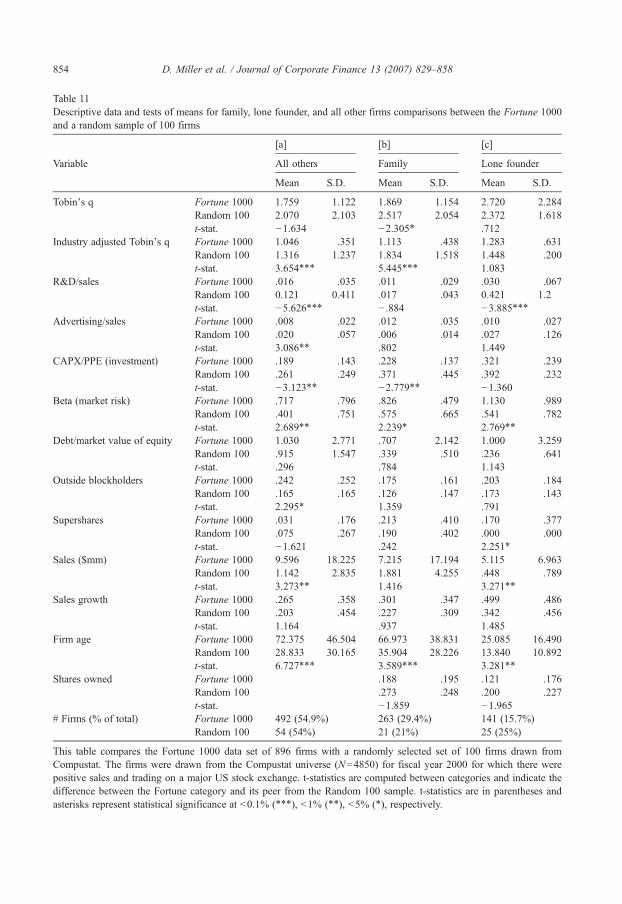
Table 11Descriptive data and tests of means for family, lone founder, and all other firms comparisons between the Fortune 1000and a random sample of 100 firms
[a] [b] [c]
Variable All others Family Lone founder
Mean S.D. Mean S.D. Mean S.D.
Tobin's q Fortune 1000 1.759 1.122 1.869 1.154 2.720 2.284Random 100 2.070 2.103 2.517 2.054 2.372 1.618t-stat. −1.634 −2.305⁎ .712
Industry adjusted Tobin's q Fortune 1000 1.046 .351 1.113 .438 1.283 .631Random 100 1.316 1.237 1.834 1.518 1.448 .200t-stat. 3.654⁎⁎⁎ 5.445⁎⁎⁎ 1.083
R&D/sales Fortune 1000 .016 .035 .011 .029 .030 .067Random 100 0.121 0.411 .017 .043 0.421 1.2t-stat. −5.626⁎⁎⁎ − .884 −3.885⁎⁎⁎
Advertising/sales Fortune 1000 .008 .022 .012 .035 .010 .027Random 100 .020 .057 .006 .014 .027 .126t-stat. 3.086⁎⁎ .802 1.449
CAPX/PPE (investment) Fortune 1000 .189 .143 .228 .137 .321 .239Random 100 .261 .249 .371 .445 .392 .232t-stat. −3.123⁎⁎ −2.779⁎⁎ −1.360
Beta (market risk) Fortune 1000 .717 .796 .826 .479 1.130 .989Random 100 .401 .751 .575 .665 .541 .782t-stat. 2.689⁎⁎ 2.239⁎ 2.769⁎⁎
Debt/market value of equity Fortune 1000 1.030 2.771 .707 2.142 1.000 3.259Random 100 .915 1.547 .339 .510 .236 .641t-stat. .296 .784 1.143
Outside blockholders Fortune 1000 .242 .252 .175 .161 .203 .184Random 100 .165 .165 .126 .147 .173 .143t-stat. 2.295⁎ 1.359 .791
Supershares Fortune 1000 .031 .176 .213 .410 .170 .377Random 100 .075 .267 .190 .402 .000 .000t-stat. −1.621 .242 2.251⁎
Sales ($mm) Fortune 1000 9.596 18.225 7.215 17.194 5.115 6.963Random 100 1.142 2.835 1.881 4.255 .448 .789t-stat. 3.273⁎⁎ 1.416 3.271⁎⁎
Sales growth Fortune 1000 .265 .358 .301 .347 .499 .486Random 100 .203 .454 .227 .309 .342 .456t-stat. 1.164 .937 1.485
Firm age Fortune 1000 72.375 46.504 66.973 38.831 25.085 16.490Random 100 28.833 30.165 35.904 28.226 13.840 10.892t-stat. 6.727⁎⁎⁎ 3.589⁎⁎⁎ 3.281⁎⁎
Shares owned Fortune 1000 .188 .195 .121 .176Random 100 .273 .248 .200 .227t-stat. −1.859 −1.965
# Firms (% of total) Fortune 1000 492 (54.9%) 263 (29.4%) 141 (15.7%)Random 100 54 (54%) 21 (21%) 25 (25%)
This table compares the Fortune 1000 data set of 896 firms with a randomly selected set of 100 firms drawn fromCompustat. The firms were drawn from the Compustat universe (N=4850) for fiscal year 2000 for which there werepositive sales and trading on a major US stock exchange. t-statistics are computed between categories and indicate thedifference between the Fortune category and its peer from the Random 100 sample. t-statistics are in parentheses andasterisks represent statistical significance at b0.1% (⁎⁎⁎), b1% (⁎⁎), b5% (⁎), respectively.
854 D. Miller et al. / Journal of Corporate Finance 13 (2007) 829–858
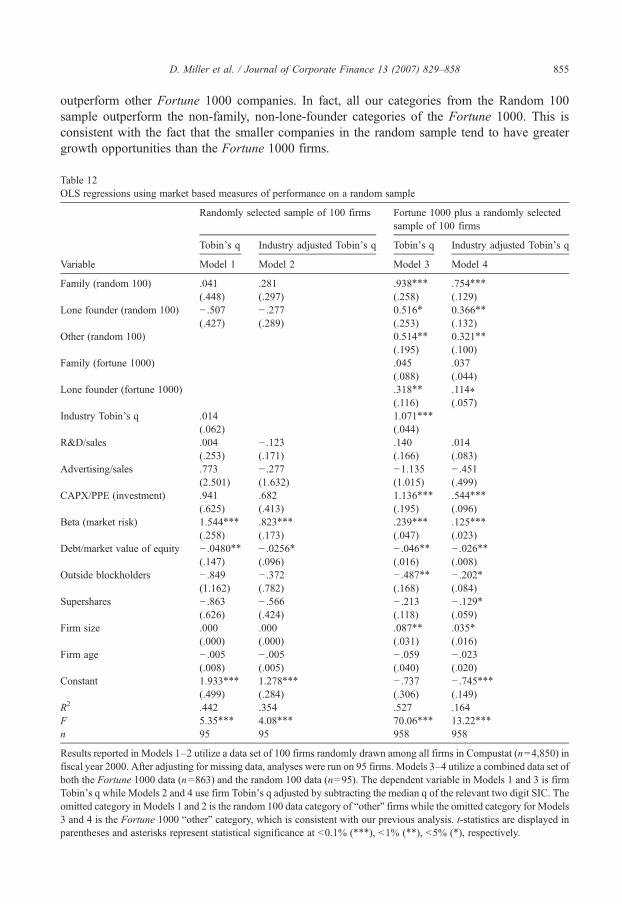
855D. Miller et al. / Journal of Corporate Finance 13 (2007) 829–858
outperform other Fortune 1000 companies. In fact, all our categories from the Random 100sample outperform the non-family, non-lone-founder categories of the Fortune 1000. This isconsistent with the fact that the smaller companies in the random sample tend to have greatergrowth opportunities than the Fortune 1000 firms.
Table 12OLS regressions using market based measures of performance on a random sample
Randomly selected sample of 100 firms Fortune 1000 plus a randomly selectedsample of 100 firms
Tobin's q Industry adjusted Tobin's q Tobin's q Industry adjusted Tobin's q
Variable Model 1 Model 2 Model 3 Model 4
Family (random 100) .041 .281 .938⁎⁎⁎ .754⁎⁎⁎
(.448) (.297) (.258) (.129)Lone founder (random 100) − .507 − .277 0.516⁎ 0.366⁎⁎
(.427) (.289) (.253) (.132)Other (random 100) 0.514⁎⁎ 0.321⁎⁎
(.195) (.100)Family (fortune 1000) .045 .037
(.088) (.044)Lone founder (fortune 1000) .318⁎⁎ .114⁎
(.116) (.057)Industry Tobin's q .014 1.071⁎⁎⁎
(.062) (.044)R&D/sales .004 − .123 .140 .014
(.253) (.171) (.166) (.083)Advertising/sales .773 − .277 −1.135 − .451
(2.501) (1.632) (1.015) (.499)CAPX/PPE (investment) .941 .682 1.136⁎⁎⁎ .544⁎⁎⁎
(.625) (.413) (.195) (.096)Beta (market risk) 1.544⁎⁎⁎ .823⁎⁎⁎ .239⁎⁎⁎ .125⁎⁎⁎
(.258) (.173) (.047) (.023)Debt/market value of equity − .0480⁎⁎ − .0256⁎ − .046⁎⁎ − .026⁎⁎
(.147) (.096) (.016) (.008)Outside blockholders − .849 − .372 − .487⁎⁎ − .202⁎
(1.162) (.782) (.168) (.084)Supershares − .863 − .566 − .213 − .129⁎
(.626) (.424) (.118) (.059)Firm size .000 .000 .087⁎⁎ .035⁎
(.000) (.000) (.031) (.016)Firm age − .005 − .005 − .059 − .023
(.008) (.005) (.040) (.020)Constant 1.933⁎⁎⁎ 1.278⁎⁎⁎ − .737 − .745⁎⁎⁎
(.499) (.284) (.306) (.149)R2 .442 .354 .527 .164F 5.35⁎⁎⁎ 4.08⁎⁎⁎ 70.06⁎⁎⁎ 13.22⁎⁎⁎
n 95 95 958 958
Results reported in Models 1–2 utilize a data set of 100 firms randomly drawn among all firms in Compustat (n=4,850) infiscal year 2000. After adjusting for missing data, analyses were run on 95 firms. Models 3–4 utilize a combined data set ofboth the Fortune 1000 data (n=863) and the random 100 data (n=95). The dependent variable in Models 1 and 3 is firmTobin's q while Models 2 and 4 use firm Tobin's q adjusted by subtracting the median q of the relevant two digit SIC. Theomitted category in Models 1 and 2 is the random 100 data category of “other” firms while the omitted category for Models3 and 4 is the Fortune 1000 “other” category, which is consistent with our previous analysis. t-statistics are displayed inparentheses and asterisks represent statistical significance at b0.1% (⁎⁎⁎), b1% (⁎⁎), b5% (⁎), respectively.
856 D. Miller et al. / Journal of Corporate Finance 13 (2007) 829–858
Moreover, when we analyzed the Random 100 sample alone, neither family nor lone-founderfirms outperformed the “other” category. These results are consistent with research by Holdernessand Sheehan (1988). Thus prior results using S&P 500, Fortune 500, Fortune 1000 and othercollections of large firms may not hold for smaller companies. It is important therefore not toovergeneralize findings based on the analyses of very large firms.
Limitations of the Research:We must raise several cautionary notes. First, notwithstanding thecare we have taken to rule out problems of endogeneity and selection bias, it is hazardous to drawcausal connections between firm performance and ownership structure. Ownership may beconsidered an endogenous outcome reflecting the preferences and behavior of shareholders andstock traders (Demsetz, 1983; Demsetz and Lehn, 1985). Moreover, there can be mutual influencebetween the market valuation of a firm and ownership: the market price of a business mayinfluence whether it is sold, and the probability of sale may in turn be influenced by the nature ofthe owner.
Second, Tobin's q is an imperfect measure of performance linked to investor perceptions andexpectations which may be off the mark. The measure does not directly assess the actual returns ofa stock, nor its risk. Moreover, q can both influence and be influenced by ownership structure.Thus it is critical to specify models as fully as possible and assess endogeneity.
Finally, our period of analysis was largely a bull market. Therefore further research should bedone to establish whether these findings will apply to less favorable market environments. It maybe too that outside the U.S., powerful family businesses with longstanding political and socialconnections to governments can outperform by virtue of their protection from competition(Bertrand and Schoar, 2006; Claessens et al., 2002; Morck and Yeung, 2003).
5. Discussion and conclusion
Prior international research has questioned the ability of family businesses to perform well, andhas identified reasons as well as evidence for mediocre performance (Bertrand and Schoar, 2006;Bennedsen et al., in press; Claessens et al., 2002; Cronqvist and Nilsson, 2003; Maury, 2006).Recent studies of large, publicly traded U.S. family businesses, however, have contradicted thisresearch, claiming that family businesses enjoy higher market valuations, especially in the firstgeneration (Anderson and Reeb, 2003; McConaughy et al., 1998; Villalonga and Amit, 2006b).To address this puzzle, we used more exacting definitions of family business. We also tookunusual care to address issues of endogeneity and selection bias.
We found that the out-performance of family business was a result of how these businesseswere defined— specifically, as including companies with large personal owners who do not haverelatives associated with their firms. This is an important distinction, both conceptually andempirically. Conceptually, because family businesses with multiple family members serving asowners or managers may, regardless of generation, confront more encumbered governanceconditions than lone-founders without kinship ties in the business (Bertrand and Schoar, 2006;Schulze et al., 2001, 2003). Empirically, because when we remove lone-founder businesses fromthe family business category, there is no longer any evidence of superior market valuations.Indeed, the mere classification of lone-founder firms as family firms, so common among previousstudies, is puzzling given the absence of any family involvement.
As a group, large U.S. family businesses did not outperform in their market valuations— not inany of the OLS, panel or treatment effects models for any of our numerous measures of familyinvolvement, nor for different family generations. By contrast, lone founder businesses outperformedin their market valuations in all of these analyses, and across definitions including those of dummy

857D. Miller et al. / Journal of Corporate Finance 13 (2007) 829–858
variable, share ownership, large share ownership combined with lone-founder management, andlone-founder serving as CEO, Chairman, or both. Our Fortune 1000 analyses were shown not to besensitive to the age cohorts of the firm nor to firms' elevation to the Fortune list.
More importantly, our analyses of a random sample of much smaller publicly traded U.S.companies disclosed that family businesses also did not outperform other firms within thatrandom sample, although lone-founder, family and other businesses in the random sampleoutperformed other Fortune 1000 businesses. Clearly, it may be hazardous to generalize resultsfrom very large publicly traded companies to smaller public firms.
This research illustrates the importance of determining the range and robustness of results. Itdemonstrates that firm performance varies greatly depending on the definition of family business,as well as the nature of the sample being examined. Assiduous specification and empiricalmodeling is critical in examining the performance of family business. It has also been shown to besimilarly critical in treating broad topics such as ownership and performance (Demsetz and Lehn,1985), diversification (Martin and Sayrak, 2003), and corporate governance (Gillan, 2006).
References
Alchian, A., 1950. Uncertainty, evolution and economic theory. Journal of Political Economy 58, 211–221.Allen, M.P., Panian, S.K., 1982. Power, performance and succession in the large corporation. Administrative Science
Quarterly 27, 538–547.Anderson, R.C., Reeb, D.M., 2003. Founding-family ownership and firm performance: evidence from the S&P 500.
Journal of Finance 58, 1301–1328.Anderson, R.C., Mansi, S.A., Reeb, D.M., 2003. Founding family ownership and the agency cost of debt. Journal of
Financial Economics 68 (2), 263–285.Anderson, R.C., Reeb, D.M., 2004. Board composition: balancing family influence in S&P 500 firms. Administrative
Science Quarterly 49, 209–237.Ang, J.S., Cole, R.A., Lin, J.W., 2000. Agency costs and ownership structure. Journal of Finance 55, 81–106.Barontini, R., Caprio, L., 2005. The effect of family control on firm value and performance — evidence from continental
Europe. ECGI Working Paper Series in Finance, pp. 1–58.Barth, E., Gulbrandsen, T., Schone, P., 2005. Family ownership and productivity: the role of owner-management. Journal
of Corporate Finance 11 (1/2), 107–127.Bennedsen, M., Nielson, K.M., Perez-Gonzalez, F., Wolfenzon, D., in press. Inside the family firm: The role of families in
succession decisions and performance." Quarterly Journal of Economics.Berle, A., Means, G., 1932. The modern corporation and private property. Macmillan, New York.Bertrand, M., Schoar, A., 2003. Managing with style: the effect of managers on firm policies. Quarterly Journal of
Economics 118, 1169–1208.Bertrand, M., Schoar, A., 2006. The role of family in family firms. Journal of Economic Perspectives 20, 73–96.Chandler Jr., A.D., 1990. The enduring logic of industrial success. Harvard Business Review 68, 130–140.Chung, K.H., Pruitt, S.W., 1994. A simple approximation of Tobin's q. Financial Management 23, 70–74.Claessens, S., Djankov, S., Lang, L.H.P., 2000. The separation of ownership and control in East Asian corporations.
Journal of Financial Economics 58, 81–112.Claessens, S., Djankov, S., Fan, J.P.H., Lang, L.H.P., 2002. Disentangling the incentive and entrenchment effects of large
shareholdings. Journal of Finance 57, 2741–2771.Cronqvist, H., Nilsson, M., 2003. Agency costs of controlling minority shareholders. Journal of Financial and Quantitative
Analysis 38, 695–719.Dalton, D.R., Daily, C.M., Ellstrand, A.E., Johnson, J.L., 1998. Meta-analytic reviews of board composition, leadership
structure, and financial performance. Strategic Management Journal 19 (3), 269–290.Demsetz, H., 1983. The structure of ownership and the theory of the firm. Journal of Law and Economics 26, 375–390.Demsetz, H., Lehn, K., 1985. The structure of corporate ownership: causes and consequences. Journal of Political
Economy 93, 1155–1177.Demsetz, H., Villalonga, B., 2001. Ownership structure and corporate performance. Journal of Corporate Finance 7, 209–233.Denis, D.J., Denis, D.K., 1994.Majority owner-managers and organizational efficiency. Journal of Corporate Finance 1 (1),
91–118.

858 D. Miller et al. / Journal of Corporate Finance 13 (2007) 829–858
Dlugosz, J., Fahlenbrach, R., Gompers, P., Metrick, A., 2006. Large blocks of stock: prevalence, size and measurement.Journal of Corporate Finance 12 (3), 594–618.
Faccio, M., Lang, L.H.P., 2002. The ultimate ownership of Western European corporations. Journal of FinancialEconomics 65 (3), 365–395.
Fahlenbrach, R., 2005. Founder-CEOs and stock market performance. Working paper. Ohio State University.Fahlenbrach, R., 2006. Founder-CEOs, investment decisions, and stock market performance. Working PaperWP 2004-01-
001. Ohio State University.Fama, E.F., French, K.R., 1997. Industry costs of equity. Journal of Financial Economics 43, 153–193.Gillan, S.L., 2006. Recent developments in corporate governance: an overview. Journal of Corporate Finance 12 (3), 381–402.Gomez-Mejia, L.R., Larraza-Kintana, M., Makri, M., 2003. The determinants of executive compensation in family-
controlled public corporations. Academy of Management Journal 46, 226–237.Gomez-Mejia, L.R., Haynes, K., Nunez-Nickel, M., Jacobson, K., Moyano-Fuentes, J., in press. Family owned firms: Risk
loving or risk Averse? Administrative Science Quarterly.Gomez-Mejia, L.R., Nunez-Nickel, M., Gutierrez, I., 2001. The role of family ties in agency contracts. Academy of
Management Journal 44 (1), 81–95.Greene, W.H., 2003. Econometric analysis. Prentice Hall, Upper Saddle River, N.J.Hausman, J.A., Taylor, W.E., 1981. Panel data and unobservable individual effects. Econometrica 49, 1377–1398.Holderness, C.G., Sheehan, D.P., 1988. The role of majority shareholders in publicly held corporations: an exploratory
analysis. Journal of Financial Economics 20, 317–346.Jensen, M.C., Meckling, W.H., 1976. Theory of the firm: managerial behavior, agency costs, and ownership structure.
Journal of Financial Economics 3, 305–360.La Porta, R., Lopez-de-Silanes, F., Shleifer, A., 1999. Corporate ownership around the world. Journal of Finance 54, 471–517.Lansberg, I., 1999. Succeeding generations. Harvard Business School Press, Boston, MA.Luo, X., Chung, C-N., 2005. Keeping it all in the family: the role of particularistic relationships in business group
performance during institutional transition. Administrative Science Quarterly 50 (3), 404–439.Maddala, G.S., 1983. Limited-dependent and qualitative variables in econometrics. Cambridge University Press,
Cambridge, MA.Martin, J.D., Sayrak, A., 2003. Diversification and shareholder value: a survey of recent literature. Journal of Corporate
Finance 9 (1), 37–57.Maury, B., 2006. Family ownership and firm performance: empirical evidence from Western European corporations.
Journal of Corporate Finance 12, 321–341.McConaughy, D.L., Walker, M.C., Henderson Jr., G.V., Mishra, C.S., 1998. Founding family controlled firms: efficiency
and value. Review of Financial Economics 7, 1–19.Miller, D., Le Breton-Miller, I., 2005. Managing for the long run: Lessons in competitive advantage from great family
businesses. Harvard Business School Press, Boston, MA.Morck, R.K., 2003. Why some double taxation may make sense: the special case of inter-corporate dividends. NBER
Working Paper, vol. 9651.Morck, R.K., Yeung, B., 2003. Agency problems in large family business groups. Entrepreneurship Theory and Practice
27, 367–382.Morck, R.K., Shleifer, A., Vishny, R.W., 1988. Management ownership and market valuation: an empirical analysis.
Journal of Financial Economics 20, 293–315.Perez-Gonzalez, F., 2006. Inherited control and firm performance. American Economic Review 96, 1559–1588.Schulze, W.S., Lubatkin, M., Dino, R.N., Buchholtz, A.K., 2001. Agency relationships in family firms: theory and
evidence. Organization Science 12, 99–116.Schulze, W.S., Lubatkin, M., Dino, R.N., 2003. Exploring the agency consequences of ownership dispersion among the
directors of private family firms. Academy of Management Journal 46, 179–194.Shanker, M.C., Astrachan, J.H., 1996. Myths and realities: family businesses’ contribution to US economy — A
framework for assessing family business statistics. Family Business Review 9 (2), 107–123.Smith, B.F., Amoako-Adu, B., 1999. Management succession and financial performance of family controlled firms.
Journal of Corporate Finance 5, 341–368.Villalonga, B., Amit, R., 2006a. Benefits and costs of control-enhancing mechanisms in U.S. family firms. Working Paper.
Harvard Business School. May.Villalonga, B., Amit, R., 2006b. How do family ownership, management and control affect firm value? Journal of
Financial Economics 80, 385–417.Ward, John L., 2004. Perpetuating the Family Business: 50 Lessons Learned from Long Lasting, Successful Families in
Business. Family Enterprise Publishers, Marietta, GA.