Embed Size (px)
Citation preview

FAME
Fisheries and Aquaculture Monitoring and Evaluation Support Unit
FAME Support Unit Definitions of
Common Indicators
Working Paper October 2015
FAME SU, TASK 3 Definitions of Common Indicators, Working Paper, 20.10.2015
– i –
Copyright notice:
© European Union, 2015
Reproduction is authorised provided the source is acknowledged.
Recommended citation: (WORKING VERSION NOT YET TO BE QUOTED)
EUROPEAN COMMISSION – Directorate-General for Maritime Affairs and Fisheries
Disclaimer:
The information and views set out in this report are those of the author(s) and do not necessarily reflect the official opinion
of the Commission. The Commission does not guarantee the accuracy of the data included in this report. Neither the
Commission nor any person acting on the Commission’s behalf may be held responsible for the use which may be made of
the information contained therein.
Contact: [email protected]
FAME SU, TASK 3 Definitions of Common Indicators, Working Paper, 20.10.2015
– ii –
Table of Contents
Background and Objectives .................................................................................................... 1
Background ................................................................................................................................ 1
Objectives 1
Context Indicators ................................................................................................................... 3
UP1 Promoting environmentally sustainable, resource efficient, innovative, competitive and knowledge based fisheries ............................................................ 3
UP2 Fostering environmentally sustainable, resource efficient, innovative, competitive and knowledge based aquaculture ....................................................... 8
UP 3 Fostering the implementation of the CFP ....................................................................... 11
UP4 Increasing employment and territorial cohesion .............................................................. 12
UP5 Fostering marketing and processing ................................................................................ 13
UP6 Fostering the implementation of the Integrated Maritime Policy .................................... 15
Result Indicators .................................................................................................................... 16
UP1 Promoting environmentally sustainable, resource efficient, innovative, competitive and knowledge based fisheries .......................................................... 16
UP2 Fostering environmentally sustainable, resource efficient, innovative, competitive and knowledge based aquaculture ..................................................... 19
UP3 Fostering the implementation of the CFP ........................................................................ 21
UP4 Increasing employment and territorial cohesion .............................................................. 21
UP5 Fostering marketing and processing ................................................................................ 22
UP6 Fostering the implementation of the Integrated Maritime Policy .................................... 23
Output Indicators................................................................................................................... 23

FAME SU, TASK 3: Definitions of Common Indicators, Working Paper, 26.10.2015 1
Background and Objectives
Background
Like all ESI Funds, the EMFF adopted a reinforced result-orientation trend. This also
implies that the “point of departure” of the interventions, the results of the fund and its
interventions are documented and can be demonstrated to all stakeholders and the interested
public.
To achieve this, a Common Monitoring and Evaluation System (CMES) for the EMFF has
been introduced, comprising context, result and output indicators as well as target values
for the result and output indicators.
There are three types of common indicators addressing different levels at the hierarchy of
objectives and thus serving different purposes:
Output indicators measure activities directly realised through the OPs; in most cases
they refer to the number of operations co-financed by the EMFF OP.
Result indicators measure the direct gross effects of the intervention. They provide
information on changes in the capacity, capability or performance of the direct
beneficiary and are measured in absolute or relative terms.
Context indicators are linked to the wider objectives of the EMFF. They reflect the
situation at the beginning of the programming period, the trend over time and finally
the background, the achievements of the OPs will be projected upon.
The final list of Common Indicators was established taking into account the following
principles:
Relevance of indicators to programming, including the Europe 2020 Strategy;
Reduction of the administrative burden (minimal number of indicators);
Consistency and comparability (using equivalent indicators at different stages);
Linkages between different levels of indicators (context, output and results);
Simplification (use of existing data sources such as DCF or Eurostat);
Flexibility in the selection of those indicators relevant to the respective EMFF OP;
Utilisation of the data transmitted by the beneficiaries
The legal basis for the above indicators is provided with the Commission Delegated
Regulation (EU) No 1014/2014 resp. Corrigendum, OJ L 347, 3.12.2014, p. 46 (1014/2014).
Objectives
With the present paper the FAME SU aims at:
Providing to all actors involved in that process a set of operational definition for
each common indicator in order to ensure a common understanding to be used as a
basis for discussion for the upcoming EMFF expert group meetings and
Preparing the way for a detailed working paper on methodological considerations
and provisions required in order to successfully respond to the monitoring and
evaluation tasks during the OP implementation as defined by the Common Provision
Regulation and in particular ensuring consistent calculation and comparability.
FAME SU, TASK 3: Definitions of Common Indicators, Working Paper, 26.10.2015 2
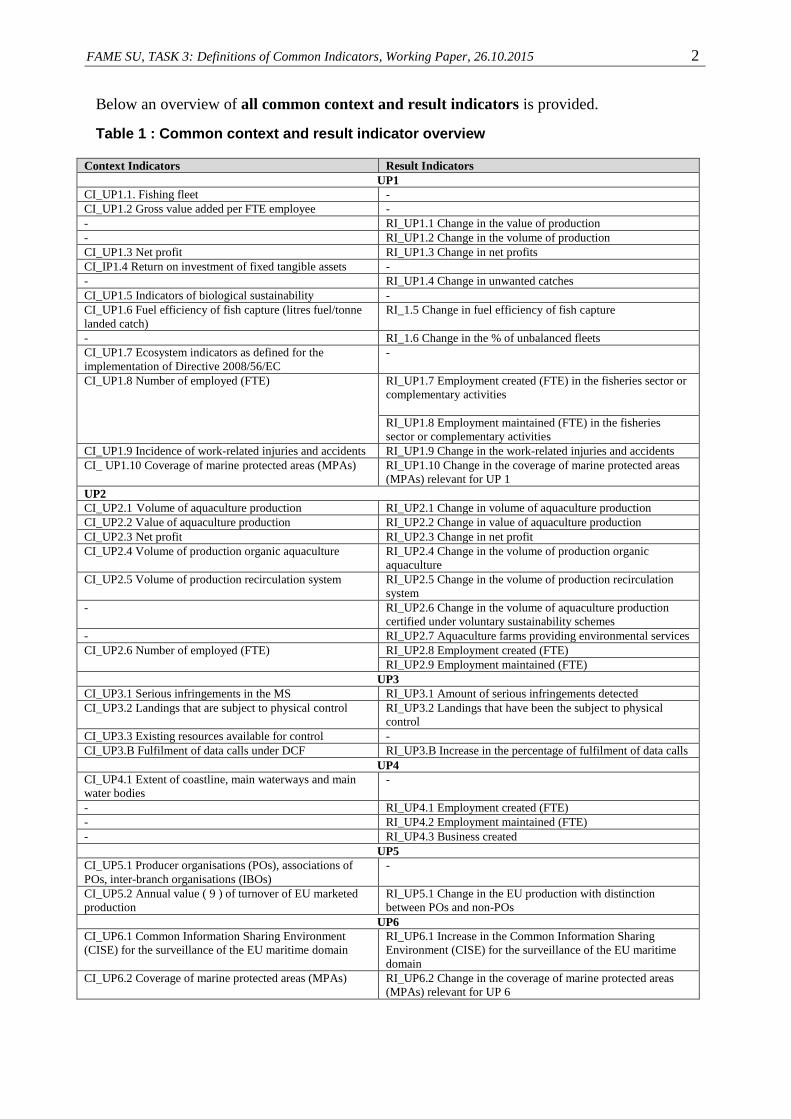
Below an overview of all common context and result indicators is provided.
Table 1 : Common context and result indicator overview
Context Indicators Result Indicators
UP1
CI_UP1.1. Fishing fleet -
CI_UP1.2 Gross value added per FTE employee -
- RI_UP1.1 Change in the value of production
- RI_UP1.2 Change in the volume of production
CI_UP1.3 Net profit RI_UP1.3 Change in net profits
CI_IP1.4 Return on investment of fixed tangible assets -
- RI_UP1.4 Change in unwanted catches
CI_UP1.5 Indicators of biological sustainability -
CI_UP1.6 Fuel efficiency of fish capture (litres fuel/tonne
landed catch)
RI_1.5 Change in fuel efficiency of fish capture
- RI_1.6 Change in the % of unbalanced fleets
CI_UP1.7 Ecosystem indicators as defined for the
implementation of Directive 2008/56/EC
-
CI_UP1.8 Number of employed (FTE) RI_UP1.7 Employment created (FTE) in the fisheries sector or
complementary activities
RI_UP1.8 Employment maintained (FTE) in the fisheries
sector or complementary activities
CI_UP1.9 Incidence of work-related injuries and accidents RI_UP1.9 Change in the work-related injuries and accidents
CI_ UP1.10 Coverage of marine protected areas (MPAs) RI_UP1.10 Change in the coverage of marine protected areas
(MPAs) relevant for UP 1
UP2
CI_UP2.1 Volume of aquaculture production RI_UP2.1 Change in volume of aquaculture production
CI_UP2.2 Value of aquaculture production RI_UP2.2 Change in value of aquaculture production
CI_UP2.3 Net profit RI_UP2.3 Change in net profit
CI_UP2.4 Volume of production organic aquaculture RI_UP2.4 Change in the volume of production organic
aquaculture
CI_UP2.5 Volume of production recirculation system RI_UP2.5 Change in the volume of production recirculation
system
- RI_UP2.6 Change in the volume of aquaculture production
certified under voluntary sustainability schemes
- RI_UP2.7 Aquaculture farms providing environmental services
CI_UP2.6 Number of employed (FTE) RI_UP2.8 Employment created (FTE)
RI_UP2.9 Employment maintained (FTE)
UP3
CI_UP3.1 Serious infringements in the MS RI_UP3.1 Amount of serious infringements detected
CI_UP3.2 Landings that are subject to physical control RI_UP3.2 Landings that have been the subject to physical
control
CI_UP3.3 Existing resources available for control -
CI_UP3.B Fulfilment of data calls under DCF RI_UP3.B Increase in the percentage of fulfilment of data calls
UP4
CI_UP4.1 Extent of coastline, main waterways and main
water bodies
-
- RI_UP4.1 Employment created (FTE)
- RI_UP4.2 Employment maintained (FTE)
- RI_UP4.3 Business created
UP5
CI_UP5.1 Producer organisations (POs), associations of
POs, inter-branch organisations (IBOs)
-
CI_UP5.2 Annual value ( 9 ) of turnover of EU marketed
production
RI_UP5.1 Change in the EU production with distinction
between POs and non-POs
UP6
CI_UP6.1 Common Information Sharing Environment
(CISE) for the surveillance of the EU maritime domain
RI_UP6.1 Increase in the Common Information Sharing
Environment (CISE) for the surveillance of the EU maritime
domain
CI_UP6.2 Coverage of marine protected areas (MPAs) RI_UP6.2 Change in the coverage of marine protected areas
(MPAs) relevant for UP 6
FAME SU, TASK 3: Definitions of Common Indicators, Working Paper, 26.10.2015 3
Context Indicators
UP1 Promoting environmentally sustainable, resource efficient, innovative,
competitive and knowledge based fisheries
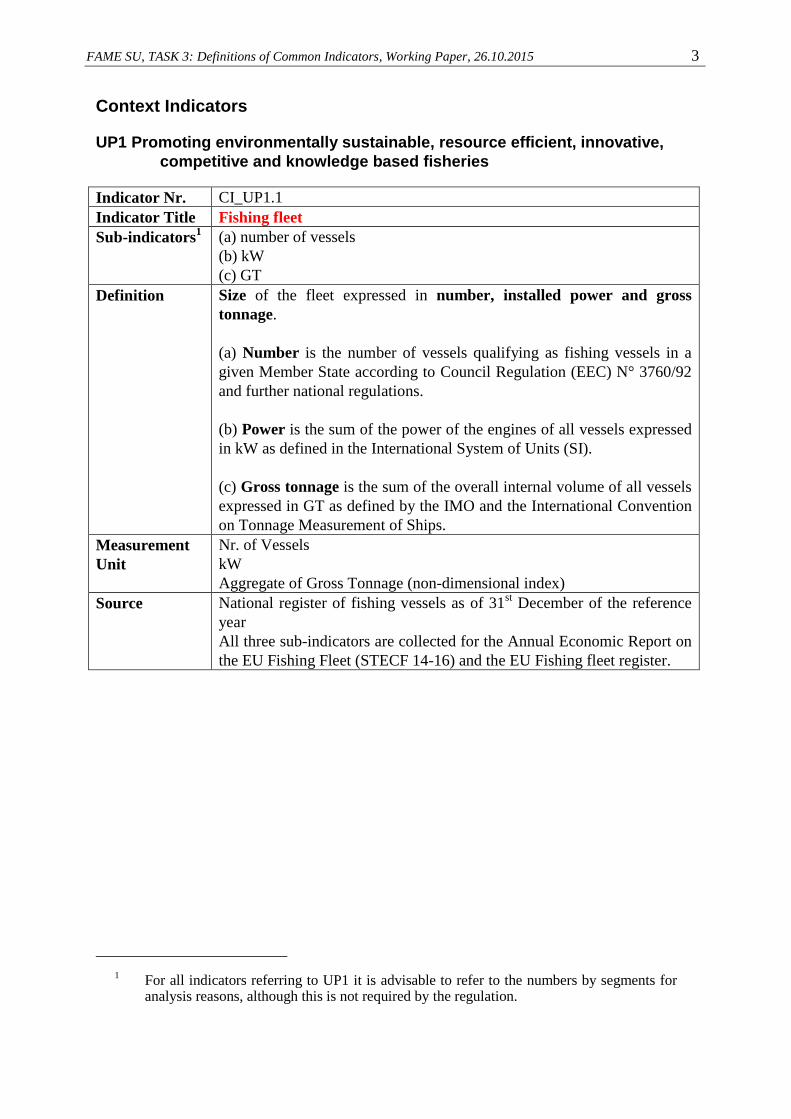
Indicator Nr. CI_UP1.1
Indicator Title Fishing fleet
Sub-indicators1 (a) number of vessels
(b) kW
(c) GT
Definition Size of the fleet expressed in number, installed power and gross
tonnage.
(a) Number is the number of vessels qualifying as fishing vessels in a
given Member State according to Council Regulation (EEC) N° 3760/92
and further national regulations.
(b) Power is the sum of the power of the engines of all vessels expressed
in kW as defined in the International System of Units (SI).
(c) Gross tonnage is the sum of the overall internal volume of all vessels
expressed in GT as defined by the IMO and the International Convention
on Tonnage Measurement of Ships.
Measurement
Unit
Nr. of Vessels
kW
Aggregate of Gross Tonnage (non-dimensional index)
Source National register of fishing vessels as of 31st December of the reference
year
All three sub-indicators are collected for the Annual Economic Report on
the EU Fishing Fleet (STECF 14-16) and the EU Fishing fleet register.
1 For all indicators referring to UP1 it is advisable to refer to the numbers by segments for
analysis reasons, although this is not required by the regulation.
FAME SU, TASK 3: Definitions of Common Indicators, Working Paper, 26.10.2015 4
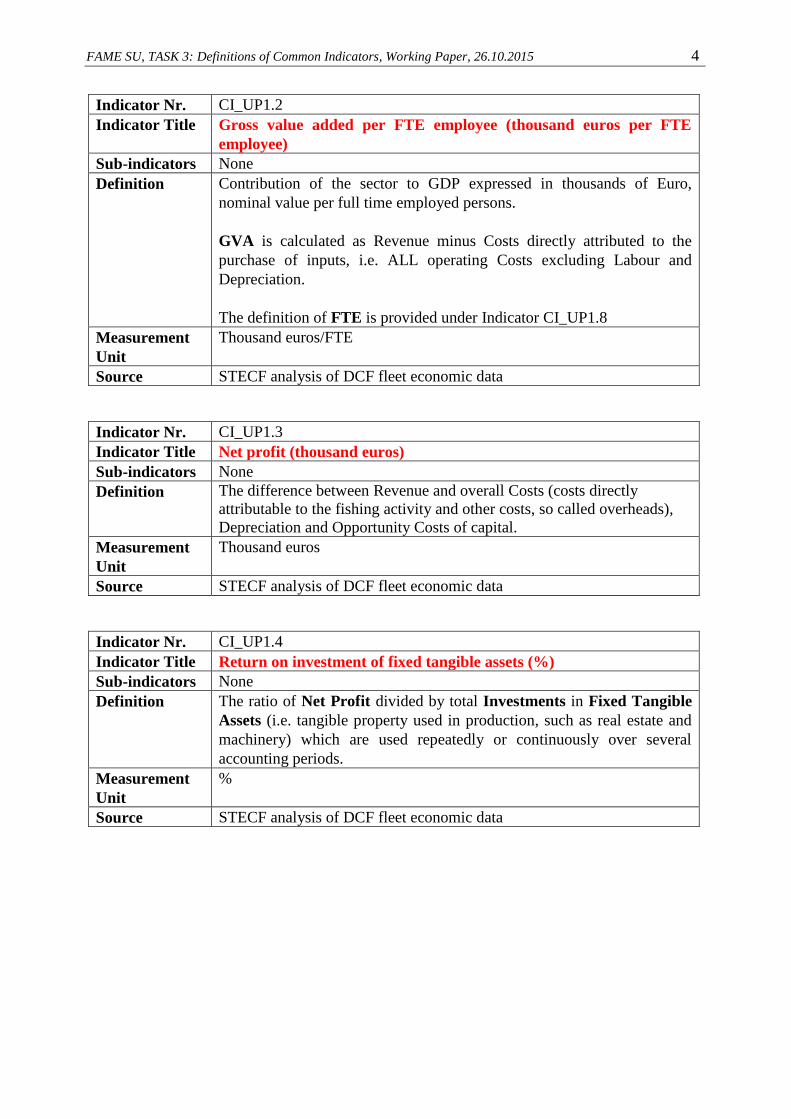
Indicator Nr. CI_UP1.2
Indicator Title Gross value added per FTE employee (thousand euros per FTE
employee)
Sub-indicators None
Definition Contribution of the sector to GDP expressed in thousands of Euro,
nominal value per full time employed persons.
GVA is calculated as Revenue minus Costs directly attributed to the
purchase of inputs, i.e. ALL operating Costs excluding Labour and
Depreciation.
The definition of FTE is provided under Indicator CI_UP1.8
Measurement
Unit
Thousand euros/FTE
Source STECF analysis of DCF fleet economic data
Indicator Nr. CI_UP1.3
Indicator Title Net profit (thousand euros)
Sub-indicators None
Definition The difference between Revenue and overall Costs (costs directly
attributable to the fishing activity and other costs, so called overheads),
Depreciation and Opportunity Costs of capital.
Measurement
Unit
Thousand euros
Source STECF analysis of DCF fleet economic data
Indicator Nr. CI_UP1.4
Indicator Title Return on investment of fixed tangible assets (%)
Sub-indicators None
Definition The ratio of Net Profit divided by total Investments in Fixed Tangible
Assets (i.e. tangible property used in production, such as real estate and
machinery) which are used repeatedly or continuously over several
accounting periods.
Measurement
Unit
%
Source STECF analysis of DCF fleet economic data
FAME SU, TASK 3: Definitions of Common Indicators, Working Paper, 26.10.2015 5
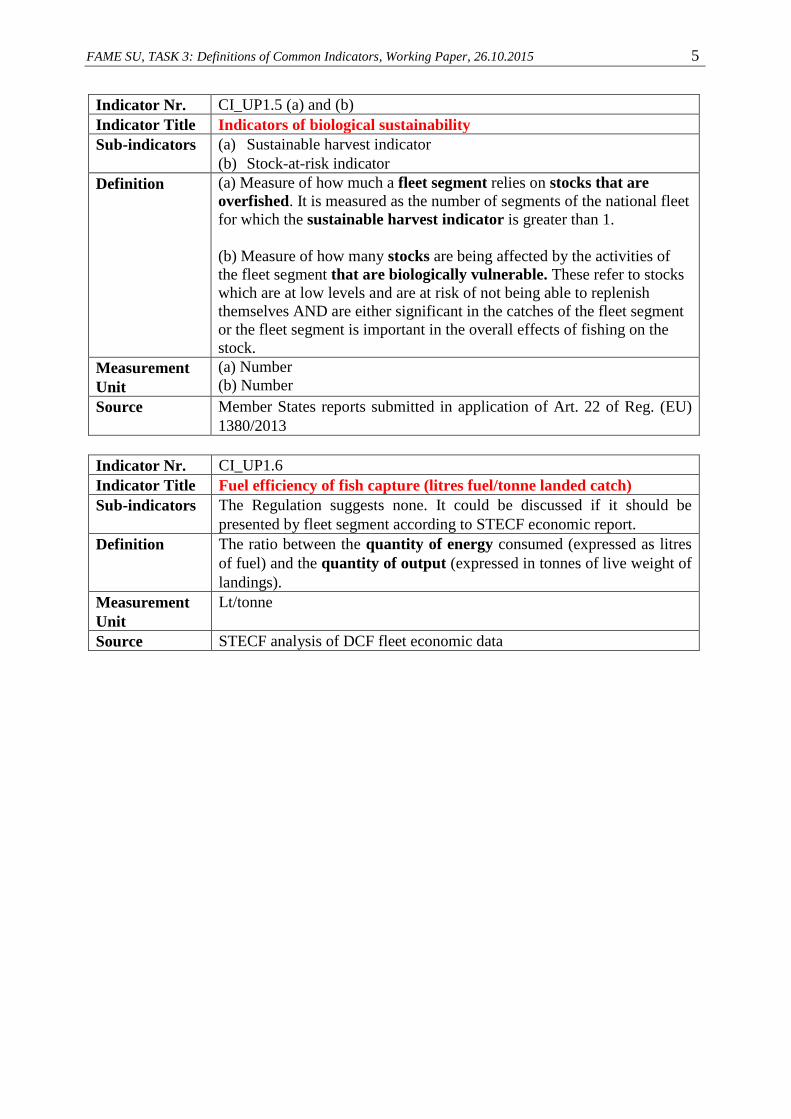
Indicator Nr. CI_UP1.5 (a) and (b)
Indicator Title Indicators of biological sustainability
Sub-indicators (a) Sustainable harvest indicator
(b) Stock-at-risk indicator
Definition (a) Measure of how much a fleet segment relies on stocks that are
overfished. It is measured as the number of segments of the national fleet
for which the sustainable harvest indicator is greater than 1.
(b) Measure of how many stocks are being affected by the activities of
the fleet segment that are biologically vulnerable. These refer to stocks
which are at low levels and are at risk of not being able to replenish
themselves AND are either significant in the catches of the fleet segment
or the fleet segment is important in the overall effects of fishing on the
stock.
Measurement
Unit
(a) Number
(b) Number
Source Member States reports submitted in application of Art. 22 of Reg. (EU)
1380/2013
Indicator Nr. CI_UP1.6
Indicator Title Fuel efficiency of fish capture (litres fuel/tonne landed catch)
Sub-indicators The Regulation suggests none. It could be discussed if it should be
presented by fleet segment according to STECF economic report.
Definition The ratio between the quantity of energy consumed (expressed as litres
of fuel) and the quantity of output (expressed in tonnes of live weight of
landings).
Measurement
Unit
Lt/tonne
Source STECF analysis of DCF fleet economic data
FAME SU, TASK 3: Definitions of Common Indicators, Working Paper, 26.10.2015 6
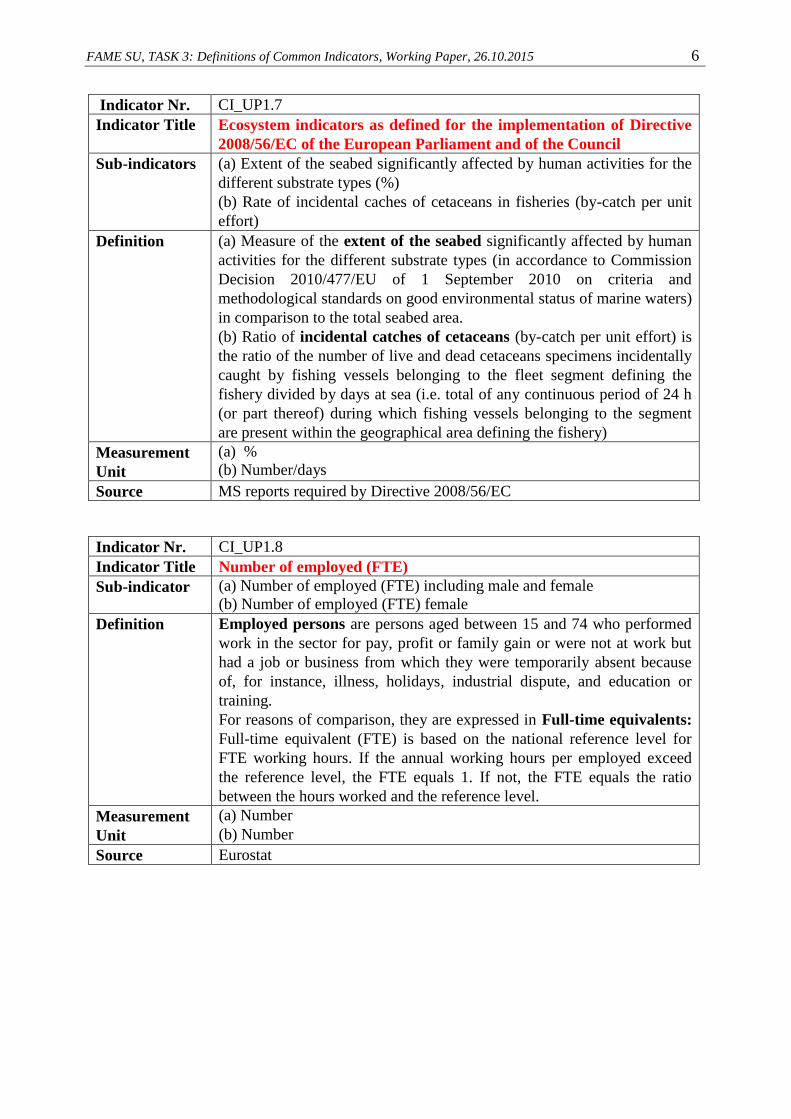
Indicator Nr. CI_UP1.7
Indicator Title Ecosystem indicators as defined for the implementation of Directive
2008/56/EC of the European Parliament and of the Council
Sub-indicators (a) Extent of the seabed significantly affected by human activities for the
different substrate types (%)
(b) Rate of incidental caches of cetaceans in fisheries (by-catch per unit
effort)
Definition (a) Measure of the extent of the seabed significantly affected by human
activities for the different substrate types (in accordance to Commission
Decision 2010/477/EU of 1 September 2010 on criteria and
methodological standards on good environmental status of marine waters)
in comparison to the total seabed area.
(b) Ratio of incidental catches of cetaceans (by-catch per unit effort) is
the ratio of the number of live and dead cetaceans specimens incidentally
caught by fishing vessels belonging to the fleet segment defining the
fishery divided by days at sea (i.e. total of any continuous period of 24 h
(or part thereof) during which fishing vessels belonging to the segment
are present within the geographical area defining the fishery)
Measurement
Unit
(a) %
(b) Number/days
Source MS reports required by Directive 2008/56/EC
Indicator Nr. CI_UP1.8
Indicator Title Number of employed (FTE)
Sub-indicator (a) Number of employed (FTE) including male and female
(b) Number of employed (FTE) female
Definition Employed persons are persons aged between 15 and 74 who performed
work in the sector for pay, profit or family gain or were not at work but
had a job or business from which they were temporarily absent because
of, for instance, illness, holidays, industrial dispute, and education or
training.
For reasons of comparison, they are expressed in Full-time equivalents:
Full-time equivalent (FTE) is based on the national reference level for
FTE working hours. If the annual working hours per employed exceed
the reference level, the FTE equals 1. If not, the FTE equals the ratio
between the hours worked and the reference level.
Measurement
Unit
(a) Number
(b) Number
Source Eurostat
FAME SU, TASK 3: Definitions of Common Indicators, Working Paper, 26.10.2015 7
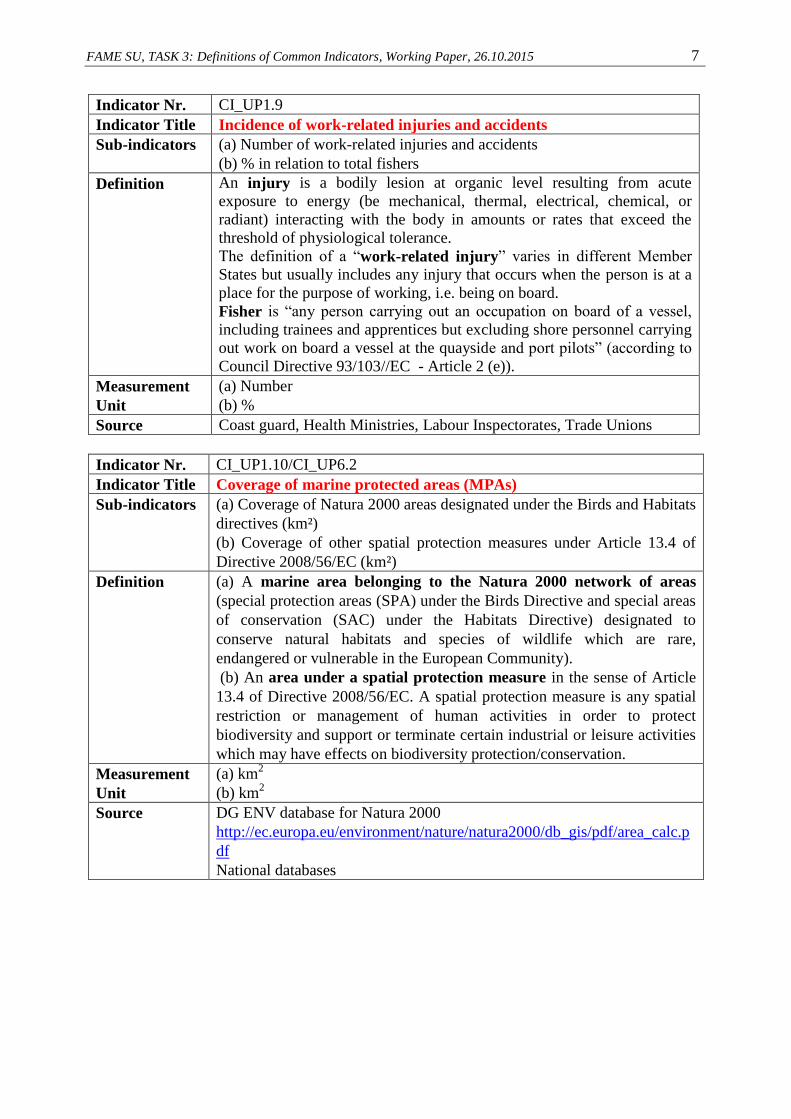
Indicator Nr. CI_UP1.9
Indicator Title Incidence of work-related injuries and accidents
Sub-indicators (a) Number of work-related injuries and accidents
(b) % in relation to total fishers
Definition An injury is a bodily lesion at organic level resulting from acute
exposure to energy (be mechanical, thermal, electrical, chemical, or
radiant) interacting with the body in amounts or rates that exceed the
threshold of physiological tolerance.
The definition of a “work-related injury” varies in different Member
States but usually includes any injury that occurs when the person is at a
place for the purpose of working, i.e. being on board.
Fisher is “any person carrying out an occupation on board of a vessel,
including trainees and apprentices but excluding shore personnel carrying
out work on board a vessel at the quayside and port pilots” (according to
Council Directive 93/103//EC - Article 2 (e)).
Measurement
Unit
(a) Number
(b) %
Source Coast guard, Health Ministries, Labour Inspectorates, Trade Unions
Indicator Nr. CI_UP1.10/CI_UP6.2
Indicator Title Coverage of marine protected areas (MPAs)
Sub-indicators (a) Coverage of Natura 2000 areas designated under the Birds and Habitats
directives (km²)
(b) Coverage of other spatial protection measures under Article 13.4 of
Directive 2008/56/EC (km²)
Definition (a) A marine area belonging to the Natura 2000 network of areas
(special protection areas (SPA) under the Birds Directive and special areas
of conservation (SAC) under the Habitats Directive) designated to
conserve natural habitats and species of wildlife which are rare,
endangered or vulnerable in the European Community).
(b) An area under a spatial protection measure in the sense of Article
13.4 of Directive 2008/56/EC. A spatial protection measure is any spatial
restriction or management of human activities in order to protect
biodiversity and support or terminate certain industrial or leisure activities
which may have effects on biodiversity protection/conservation.
Measurement
Unit
(a) km2
(b) km2
Source DG ENV database for Natura 2000
http://ec.europa.eu/environment/nature/natura2000/db_gis/pdf/area_calc.p
df
National databases
FAME SU, TASK 3: Definitions of Common Indicators, Working Paper, 26.10.2015 8
UP2 Fostering environmentally sustainable, resource efficient, innovative,
competitive and knowledge based aquaculture
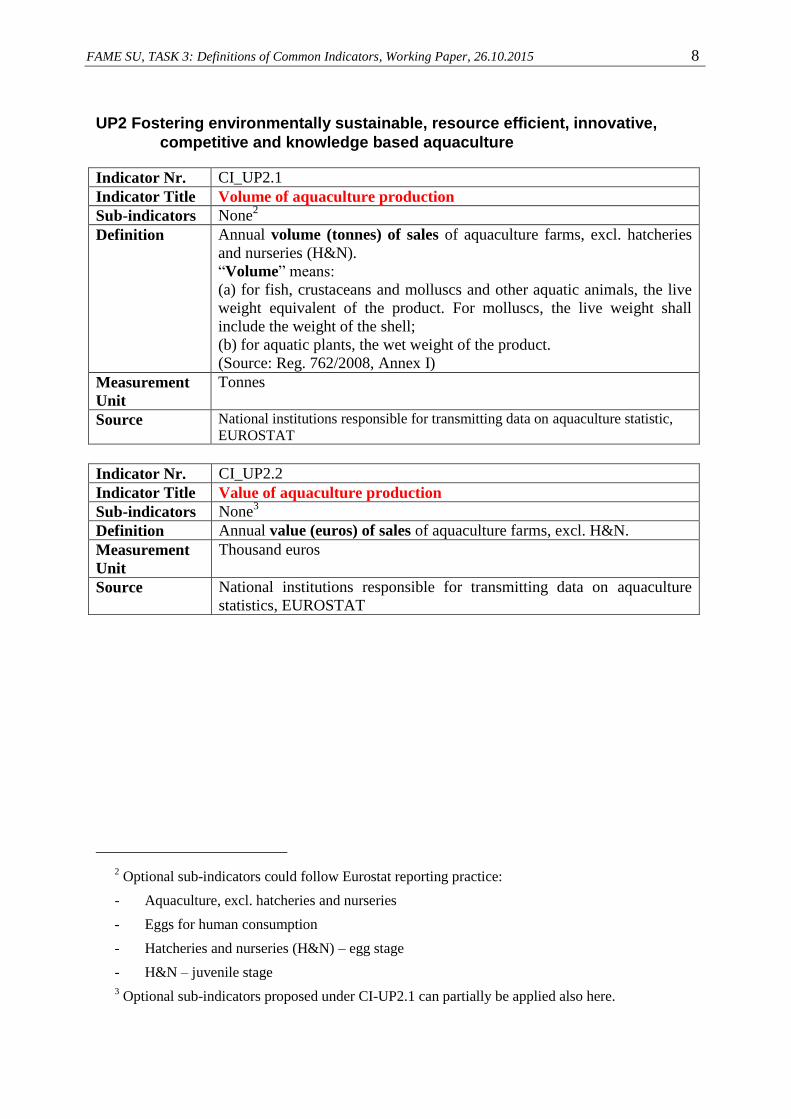
Indicator Nr. CI_UP2.1
Indicator Title Volume of aquaculture production
Sub-indicators None2
Definition Annual volume (tonnes) of sales of aquaculture farms, excl. hatcheries
and nurseries (H&N).
“Volume” means:
(a) for fish, crustaceans and molluscs and other aquatic animals, the live
weight equivalent of the product. For molluscs, the live weight shall
include the weight of the shell;
(b) for aquatic plants, the wet weight of the product.
(Source: Reg. 762/2008, Annex I)
Measurement
Unit
Tonnes
Source National institutions responsible for transmitting data on aquaculture statistic,
EUROSTAT
Indicator Nr. CI_UP2.2
Indicator Title Value of aquaculture production
Sub-indicators None3
Definition Annual value (euros) of sales of aquaculture farms, excl. H&N.
Measurement
Unit
Thousand euros
Source National institutions responsible for transmitting data on aquaculture
statistics, EUROSTAT
2 Optional sub-indicators could follow Eurostat reporting practice:
- Aquaculture, excl. hatcheries and nurseries
- Eggs for human consumption
- Hatcheries and nurseries (H&N) – egg stage
- H&N – juvenile stage
3 Optional sub-indicators proposed under CI-UP2.1 can partially be applied also here.
FAME SU, TASK 3: Definitions of Common Indicators, Working Paper, 26.10.2015 9
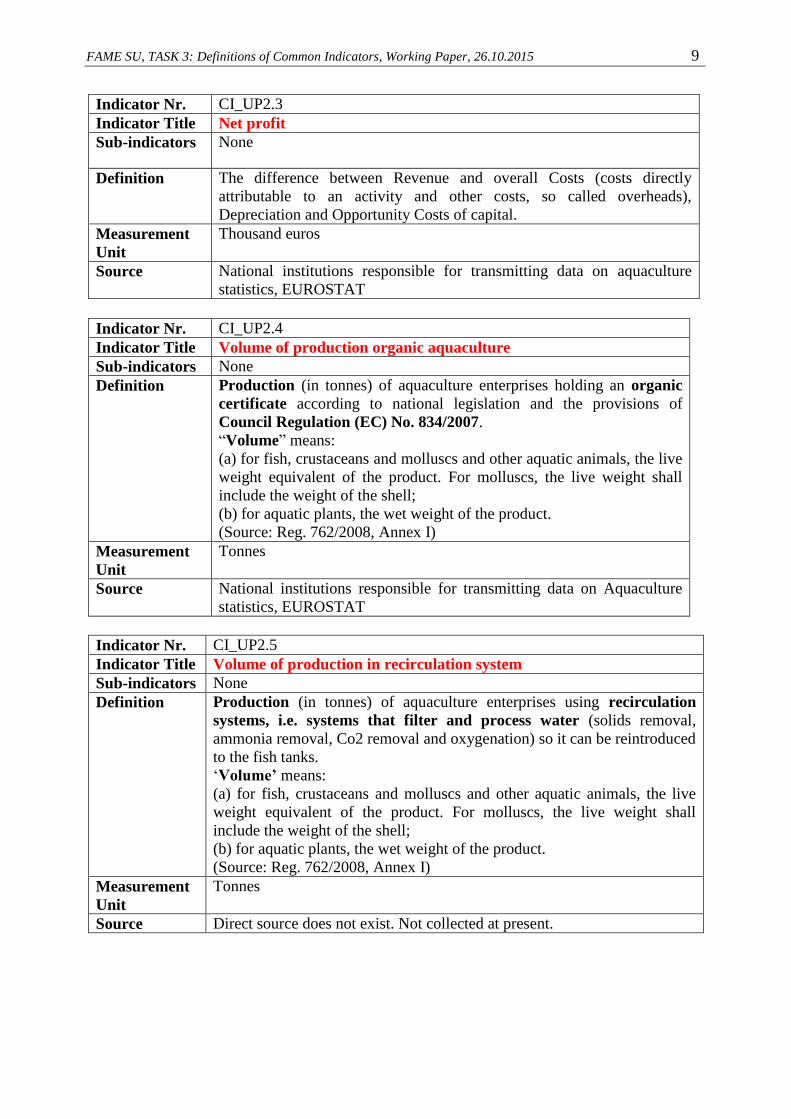
Indicator Nr. CI_UP2.3
Indicator Title Net profit
Sub-indicators None
Definition The difference between Revenue and overall Costs (costs directly
attributable to an activity and other costs, so called overheads),
Depreciation and Opportunity Costs of capital.
Measurement
Unit
Thousand euros
Source National institutions responsible for transmitting data on aquaculture
statistics, EUROSTAT
Indicator Nr. CI_UP2.4
Indicator Title Volume of production organic aquaculture
Sub-indicators None
Definition Production (in tonnes) of aquaculture enterprises holding an organic
certificate according to national legislation and the provisions of
Council Regulation (EC) No. 834/2007.
“Volume” means:
(a) for fish, crustaceans and molluscs and other aquatic animals, the live
weight equivalent of the product. For molluscs, the live weight shall
include the weight of the shell;
(b) for aquatic plants, the wet weight of the product.
(Source: Reg. 762/2008, Annex I)
Measurement
Unit
Tonnes
Source National institutions responsible for transmitting data on Aquaculture
statistics, EUROSTAT
Indicator Nr. CI_UP2.5
Indicator Title Volume of production in recirculation system
Sub-indicators None
Definition Production (in tonnes) of aquaculture enterprises using recirculation
systems, i.e. systems that filter and process water (solids removal,
ammonia removal, Co2 removal and oxygenation) so it can be reintroduced
to the fish tanks.
‘Volume’ means:
(a) for fish, crustaceans and molluscs and other aquatic animals, the live
weight equivalent of the product. For molluscs, the live weight shall
include the weight of the shell;
(b) for aquatic plants, the wet weight of the product.
(Source: Reg. 762/2008, Annex I)
Measurement
Unit
Tonnes
Source Direct source does not exist. Not collected at present.
FAME SU, TASK 3: Definitions of Common Indicators, Working Paper, 26.10.2015 10
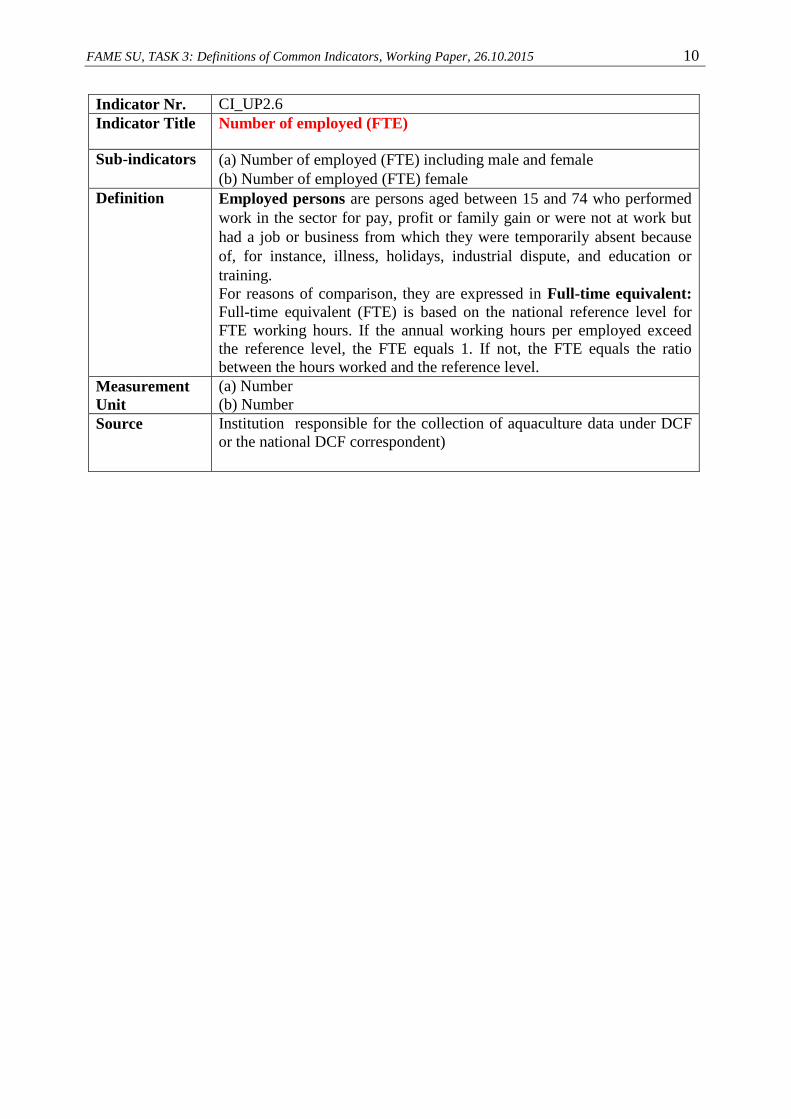
Indicator Nr. CI_UP2.6
Indicator Title Number of employed (FTE)
Sub-indicators (a) Number of employed (FTE) including male and female
(b) Number of employed (FTE) female
Definition Employed persons are persons aged between 15 and 74 who performed
work in the sector for pay, profit or family gain or were not at work but
had a job or business from which they were temporarily absent because
of, for instance, illness, holidays, industrial dispute, and education or
training.
For reasons of comparison, they are expressed in Full-time equivalent:
Full-time equivalent (FTE) is based on the national reference level for
FTE working hours. If the annual working hours per employed exceed
the reference level, the FTE equals 1. If not, the FTE equals the ratio
between the hours worked and the reference level.
Measurement
Unit
(a) Number
(b) Number
Source Institution responsible for the collection of aquaculture data under DCF
or the national DCF correspondent)
FAME SU, TASK 3: Definitions of Common Indicators, Working Paper, 26.10.2015 11
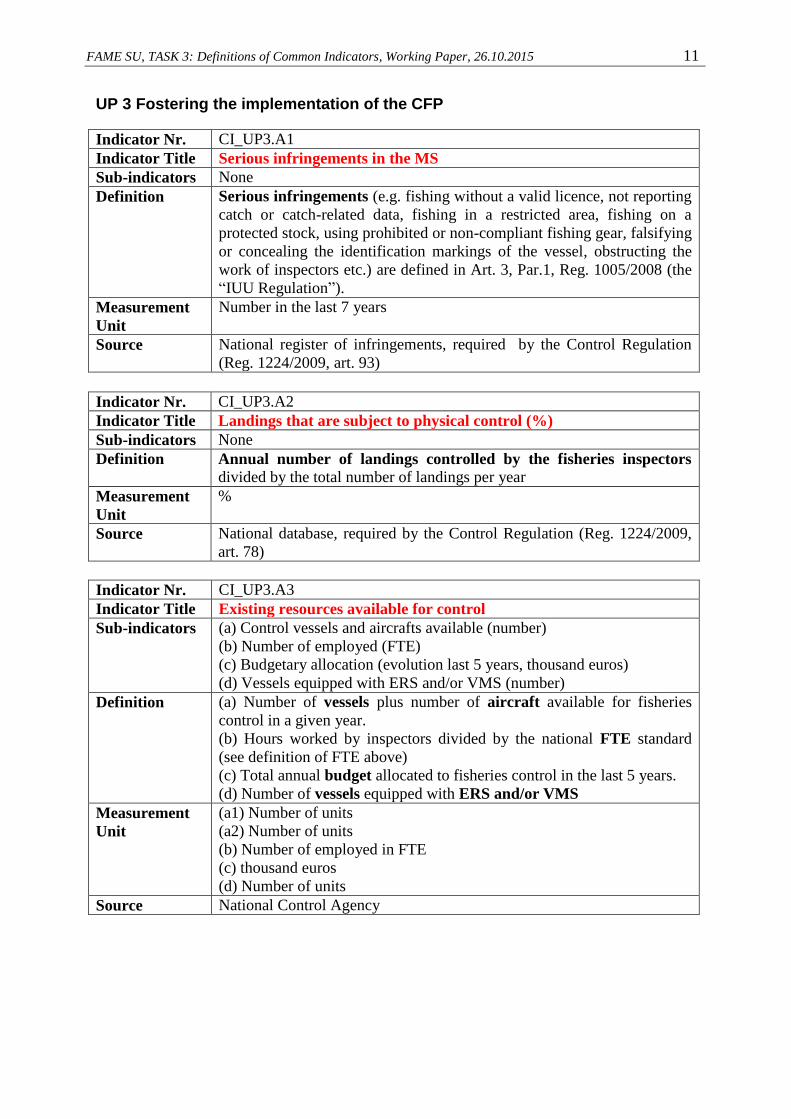
UP 3 Fostering the implementation of the CFP
Indicator Nr. CI_UP3.A1
Indicator Title Serious infringements in the MS
Sub-indicators None
Definition Serious infringements (e.g. fishing without a valid licence, not reporting
catch or catch-related data, fishing in a restricted area, fishing on a
protected stock, using prohibited or non-compliant fishing gear, falsifying
or concealing the identification markings of the vessel, obstructing the
work of inspectors etc.) are defined in Art. 3, Par.1, Reg. 1005/2008 (the
“IUU Regulation”).
Measurement
Unit
Number in the last 7 years
Source National register of infringements, required by the Control Regulation
(Reg. 1224/2009, art. 93)
Indicator Nr. CI_UP3.A2
Indicator Title Landings that are subject to physical control (%)
Sub-indicators None
Definition Annual number of landings controlled by the fisheries inspectors divided by the total number of landings per year
Measurement
Unit
%
Source National database, required by the Control Regulation (Reg. 1224/2009,
art. 78)
Indicator Nr. CI_UP3.A3
Indicator Title Existing resources available for control
Sub-indicators (a) Control vessels and aircrafts available (number)
(b) Number of employed (FTE)
(c) Budgetary allocation (evolution last 5 years, thousand euros)
(d) Vessels equipped with ERS and/or VMS (number)
Definition (a) Number of vessels plus number of aircraft available for fisheries
control in a given year.
(b) Hours worked by inspectors divided by the national FTE standard
(see definition of FTE above)
(c) Total annual budget allocated to fisheries control in the last 5 years.
(d) Number of vessels equipped with ERS and/or VMS
Measurement
Unit
(a1) Number of units
(a2) Number of units
(b) Number of employed in FTE
(c) thousand euros
(d) Number of units
Source National Control Agency
FAME SU, TASK 3: Definitions of Common Indicators, Working Paper, 26.10.2015 12
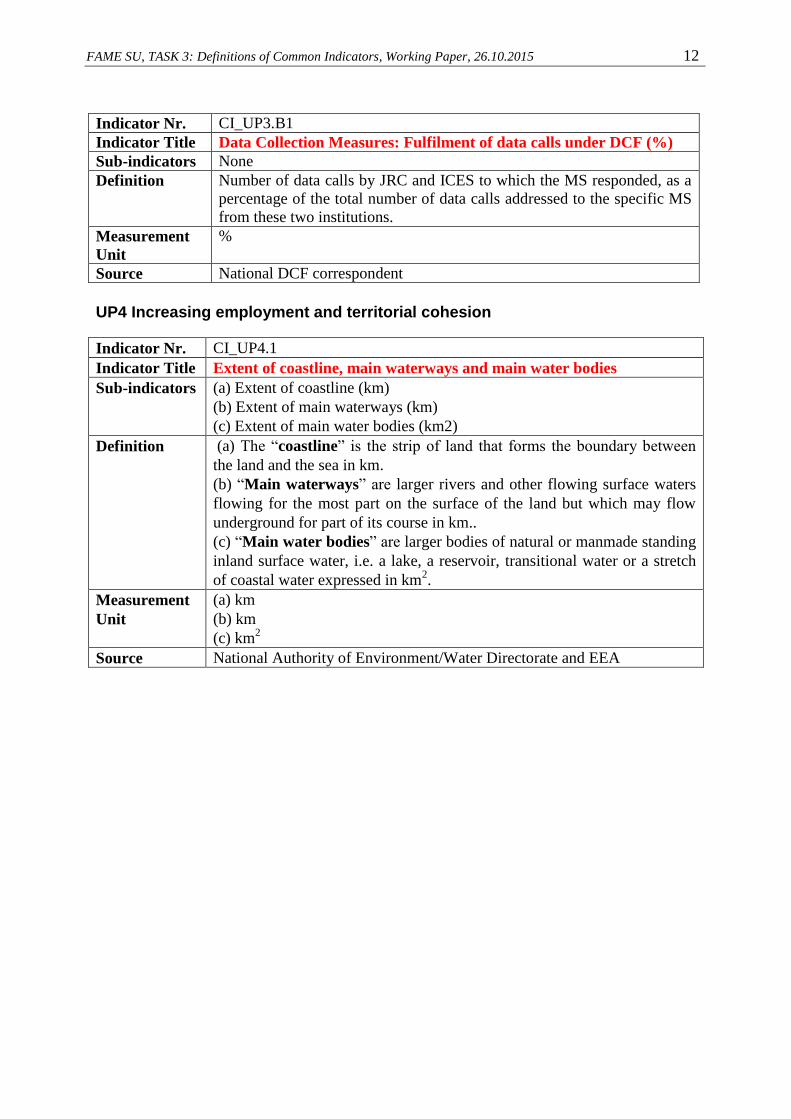
Indicator Nr. CI_UP3.B1
Indicator Title Data Collection Measures: Fulfilment of data calls under DCF (%)
Sub-indicators None
Definition Number of data calls by JRC and ICES to which the MS responded, as a
percentage of the total number of data calls addressed to the specific MS
from these two institutions.
Measurement
Unit
%
Source National DCF correspondent
UP4 Increasing employment and territorial cohesion
Indicator Nr. CI_UP4.1
Indicator Title Extent of coastline, main waterways and main water bodies
Sub-indicators (a) Extent of coastline (km)
(b) Extent of main waterways (km)
(c) Extent of main water bodies (km2)
Definition (a) The “coastline” is the strip of land that forms the boundary between
the land and the sea in km.
(b) “Main waterways” are larger rivers and other flowing surface waters
flowing for the most part on the surface of the land but which may flow
underground for part of its course in km..
(c) “Main water bodies” are larger bodies of natural or manmade standing
inland surface water, i.e. a lake, a reservoir, transitional water or a stretch
of coastal water expressed in km2.
Measurement
Unit
(a) km
(b) km
(c) km2
Source National Authority of Environment/Water Directorate and EEA
FAME SU, TASK 3: Definitions of Common Indicators, Working Paper, 26.10.2015 13
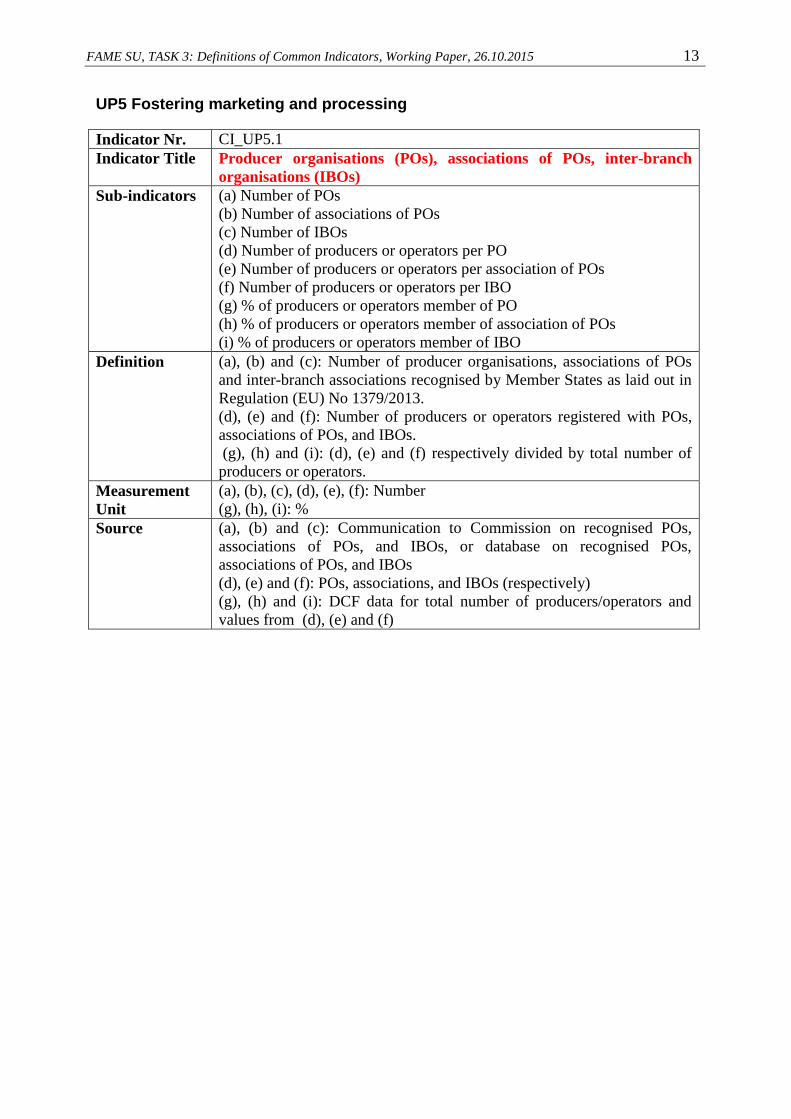
UP5 Fostering marketing and processing
Indicator Nr. CI_UP5.1
Indicator Title Producer organisations (POs), associations of POs, inter-branch
organisations (IBOs)
Sub-indicators (a) Number of POs
(b) Number of associations of POs
(c) Number of IBOs
(d) Number of producers or operators per PO
(e) Number of producers or operators per association of POs
(f) Number of producers or operators per IBO
(g) % of producers or operators member of PO
(h) % of producers or operators member of association of POs
(i) % of producers or operators member of IBO
Definition (a), (b) and (c): Number of producer organisations, associations of POs
and inter-branch associations recognised by Member States as laid out in
Regulation (EU) No 1379/2013.
(d), (e) and (f): Number of producers or operators registered with POs,
associations of POs, and IBOs.
(g), (h) and (i): (d), (e) and (f) respectively divided by total number of
producers or operators.
Measurement
Unit
(a), (b), (c), (d), (e), (f): Number
(g), (h), (i): %
Source (a), (b) and (c): Communication to Commission on recognised POs,
associations of POs, and IBOs, or database on recognised POs,
associations of POs, and IBOs
(d), (e) and (f): POs, associations, and IBOs (respectively)
(g), (h) and (i): DCF data for total number of producers/operators and
values from (d), (e) and (f)
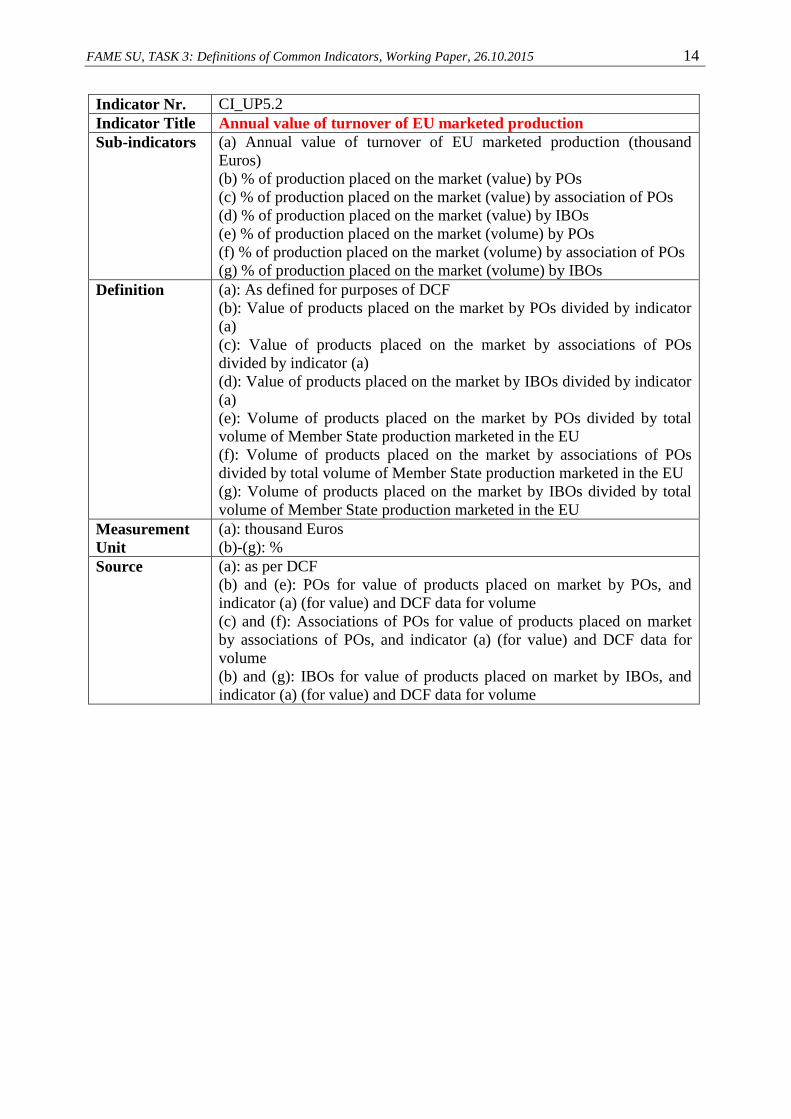
FAME SU, TASK 3: Definitions of Common Indicators, Working Paper, 26.10.2015 14
Indicator Nr. CI_UP5.2
Indicator Title Annual value of turnover of EU marketed production
Sub-indicators (a) Annual value of turnover of EU marketed production (thousand
Euros)
(b) % of production placed on the market (value) by POs
(c) % of production placed on the market (value) by association of POs
(d) % of production placed on the market (value) by IBOs
(e) % of production placed on the market (volume) by POs
(f) % of production placed on the market (volume) by association of POs
(g) % of production placed on the market (volume) by IBOs
Definition (a): As defined for purposes of DCF
(b): Value of products placed on the market by POs divided by indicator
(a)
(c): Value of products placed on the market by associations of POs
divided by indicator (a)
(d): Value of products placed on the market by IBOs divided by indicator
(a)
(e): Volume of products placed on the market by POs divided by total
volume of Member State production marketed in the EU
(f): Volume of products placed on the market by associations of POs
divided by total volume of Member State production marketed in the EU
(g): Volume of products placed on the market by IBOs divided by total
volume of Member State production marketed in the EU
Measurement
Unit
(a): thousand Euros
(b)-(g): %
Source (a): as per DCF
(b) and (e): POs for value of products placed on market by POs, and
indicator (a) (for value) and DCF data for volume
(c) and (f): Associations of POs for value of products placed on market
by associations of POs, and indicator (a) (for value) and DCF data for
volume
(b) and (g): IBOs for value of products placed on market by IBOs, and
indicator (a) (for value) and DCF data for volume
FAME SU, TASK 3: Definitions of Common Indicators, Working Paper, 26.10.2015 15
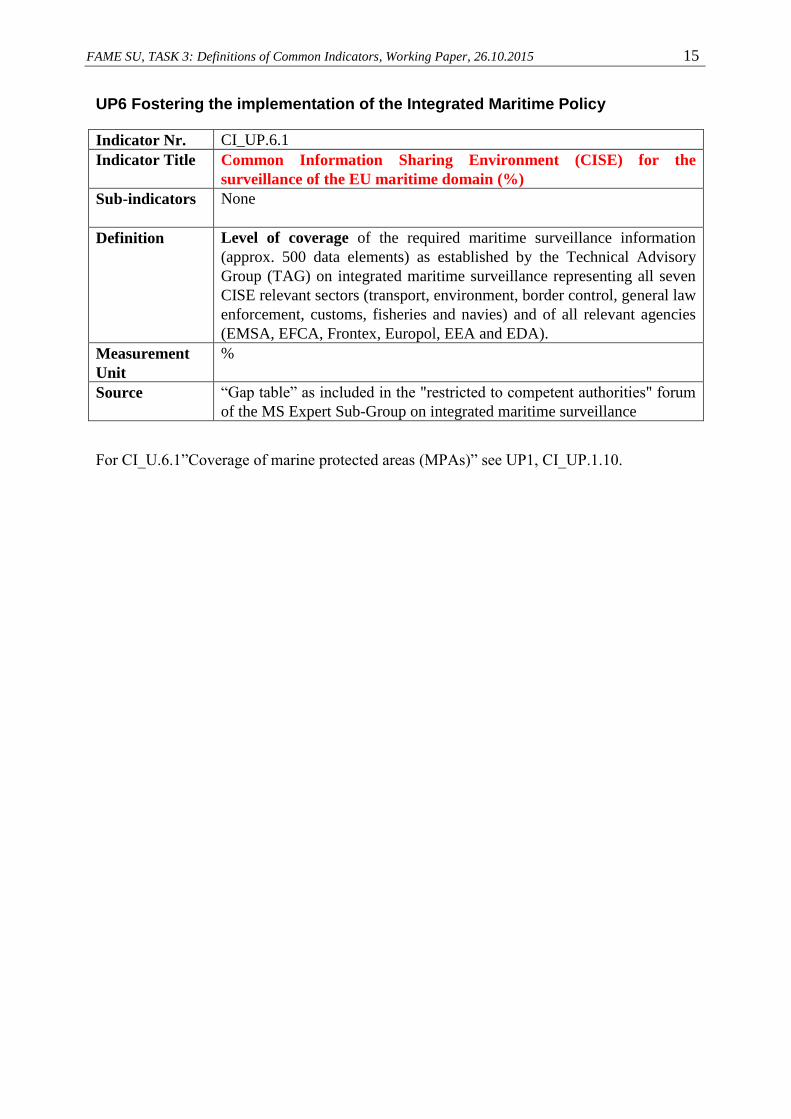
UP6 Fostering the implementation of the Integrated Maritime Policy
Indicator Nr. CI_UP.6.1
Indicator Title Common Information Sharing Environment (CISE) for the
surveillance of the EU maritime domain (%)
Sub-indicators None
Definition Level of coverage of the required maritime surveillance information
(approx. 500 data elements) as established by the Technical Advisory
Group (TAG) on integrated maritime surveillance representing all seven
CISE relevant sectors (transport, environment, border control, general law
enforcement, customs, fisheries and navies) and of all relevant agencies
(EMSA, EFCA, Frontex, Europol, EEA and EDA).
Measurement
Unit
%
Source “Gap table” as included in the "restricted to competent authorities" forum
of the MS Expert Sub-Group on integrated maritime surveillance
For CI_U.6.1”Coverage of marine protected areas (MPAs)” see UP1, CI_UP.1.10.
FAME SU, TASK 3: Definitions of Common Indicators, Working Paper, 26.10.2015 16
Result Indicators
UP1 Promoting environmentally sustainable, resource efficient, innovative,
competitive and knowledge based fisheries
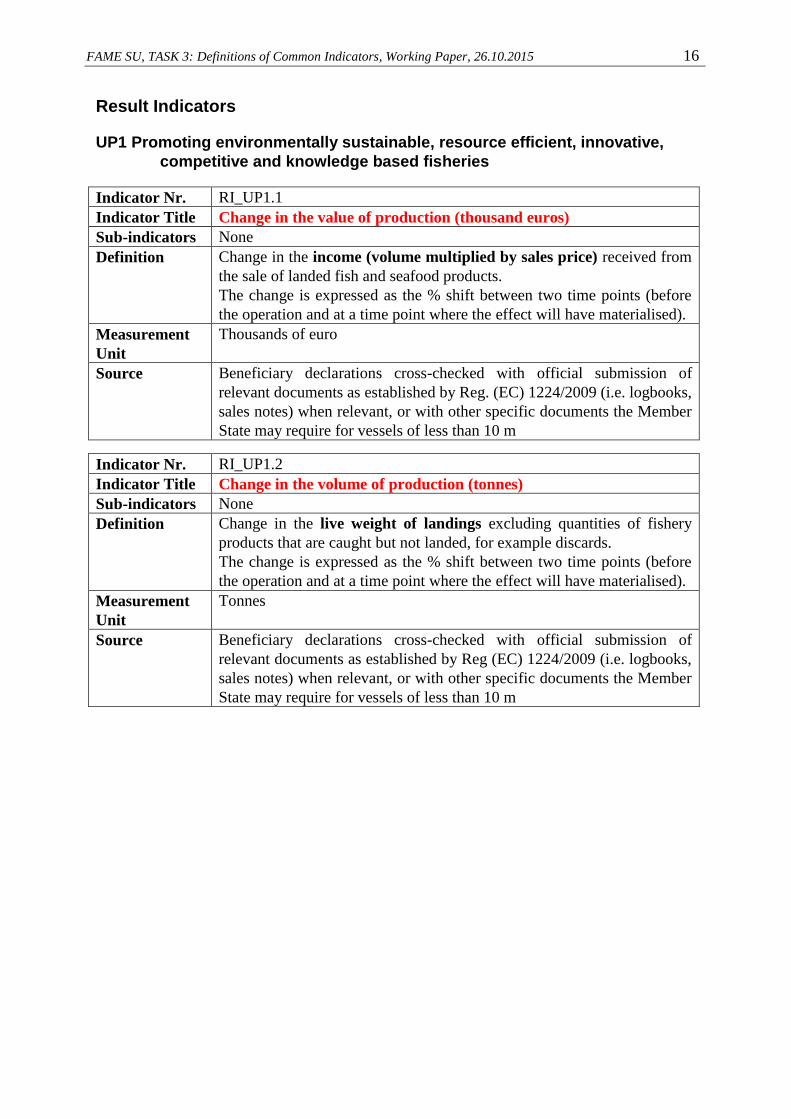
Indicator Nr. RI_UP1.1
Indicator Title Change in the value of production (thousand euros)
Sub-indicators None
Definition Change in the income (volume multiplied by sales price) received from
the sale of landed fish and seafood products.
The change is expressed as the % shift between two time points (before
the operation and at a time point where the effect will have materialised).
Measurement
Unit
Thousands of euro
Source Beneficiary declarations cross-checked with official submission of
relevant documents as established by Reg. (EC) 1224/2009 (i.e. logbooks,
sales notes) when relevant, or with other specific documents the Member
State may require for vessels of less than 10 m
Indicator Nr. RI_UP1.2
Indicator Title Change in the volume of production (tonnes)
Sub-indicators None
Definition Change in the live weight of landings excluding quantities of fishery
products that are caught but not landed, for example discards.
The change is expressed as the % shift between two time points (before
the operation and at a time point where the effect will have materialised).
Measurement
Unit
Tonnes
Source Beneficiary declarations cross-checked with official submission of
relevant documents as established by Reg (EC) 1224/2009 (i.e. logbooks,
sales notes) when relevant, or with other specific documents the Member
State may require for vessels of less than 10 m
FAME SU, TASK 3: Definitions of Common Indicators, Working Paper, 26.10.2015 17
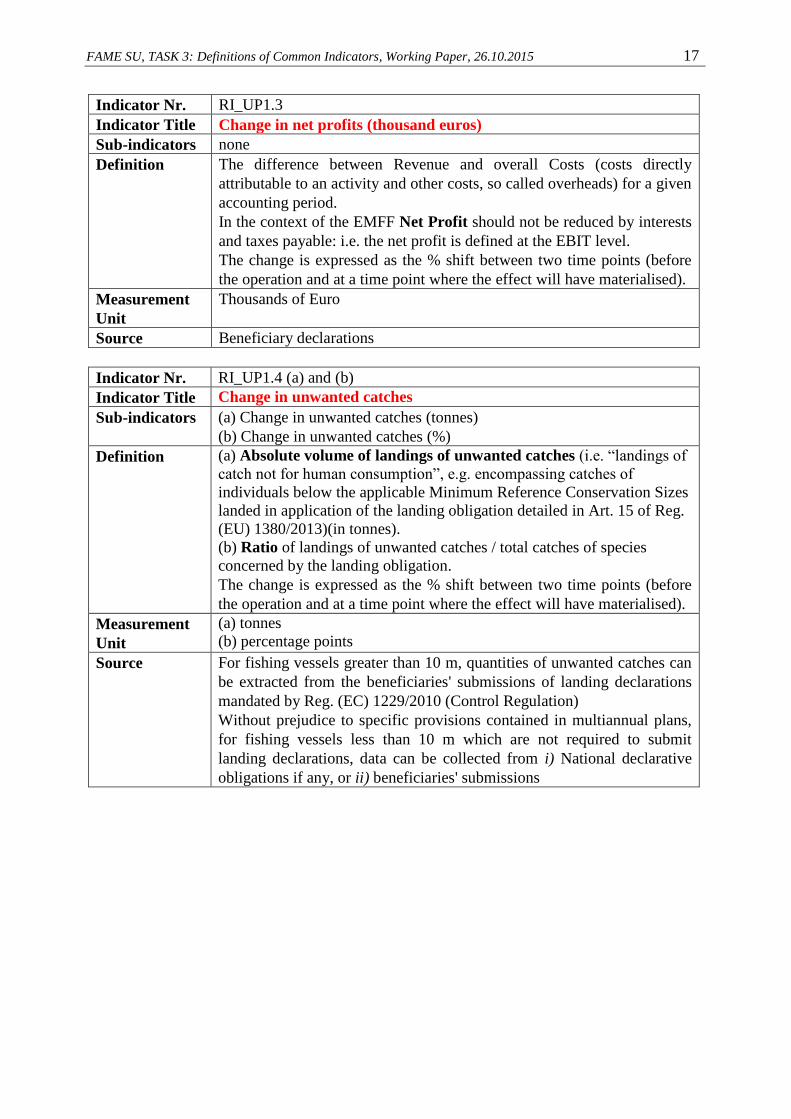
Indicator Nr. RI_UP1.3
Indicator Title Change in net profits (thousand euros)
Sub-indicators none
Definition The difference between Revenue and overall Costs (costs directly
attributable to an activity and other costs, so called overheads) for a given
accounting period.
In the context of the EMFF Net Profit should not be reduced by interests
and taxes payable: i.e. the net profit is defined at the EBIT level.
The change is expressed as the % shift between two time points (before
the operation and at a time point where the effect will have materialised).
Measurement
Unit
Thousands of Euro
Source Beneficiary declarations
Indicator Nr. RI_UP1.4 (a) and (b)
Indicator Title Change in unwanted catches
Sub-indicators (a) Change in unwanted catches (tonnes)
(b) Change in unwanted catches (%)
Definition (a) Absolute volume of landings of unwanted catches (i.e. “landings of
catch not for human consumption”, e.g. encompassing catches of
individuals below the applicable Minimum Reference Conservation Sizes
landed in application of the landing obligation detailed in Art. 15 of Reg.
(EU) 1380/2013)(in tonnes).
(b) Ratio of landings of unwanted catches / total catches of species
concerned by the landing obligation.
The change is expressed as the % shift between two time points (before
the operation and at a time point where the effect will have materialised).
Measurement
Unit
(a) tonnes
(b) percentage points
Source For fishing vessels greater than 10 m, quantities of unwanted catches can
be extracted from the beneficiaries' submissions of landing declarations
mandated by Reg. (EC) 1229/2010 (Control Regulation)
Without prejudice to specific provisions contained in multiannual plans,
for fishing vessels less than 10 m which are not required to submit
landing declarations, data can be collected from i) National declarative
obligations if any, or ii) beneficiaries' submissions
FAME SU, TASK 3: Definitions of Common Indicators, Working Paper, 26.10.2015 18
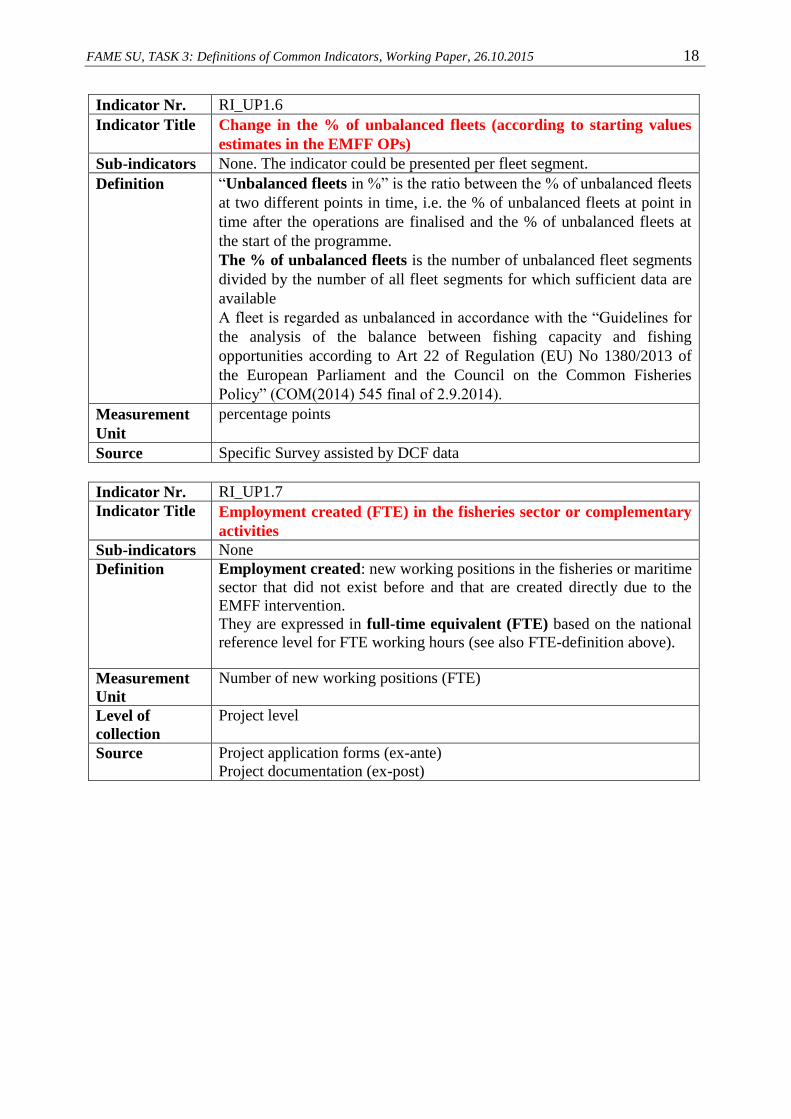
Indicator Nr. RI_UP1.6
Indicator Title Change in the % of unbalanced fleets (according to starting values
estimates in the EMFF OPs)
Sub-indicators None. The indicator could be presented per fleet segment.
Definition “Unbalanced fleets in %” is the ratio between the % of unbalanced fleets
at two different points in time, i.e. the % of unbalanced fleets at point in
time after the operations are finalised and the % of unbalanced fleets at
the start of the programme.
The % of unbalanced fleets is the number of unbalanced fleet segments
divided by the number of all fleet segments for which sufficient data are
available
A fleet is regarded as unbalanced in accordance with the “Guidelines for
the analysis of the balance between fishing capacity and fishing
opportunities according to Art 22 of Regulation (EU) No 1380/2013 of
the European Parliament and the Council on the Common Fisheries
Policy” (COM(2014) 545 final of 2.9.2014).
Measurement
Unit
percentage points
Source Specific Survey assisted by DCF data
Indicator Nr. RI_UP1.7
Indicator Title Employment created (FTE) in the fisheries sector or complementary
activities
Sub-indicators None
Definition Employment created: new working positions in the fisheries or maritime
sector that did not exist before and that are created directly due to the
EMFF intervention.
They are expressed in full-time equivalent (FTE) based on the national
reference level for FTE working hours (see also FTE-definition above).
Measurement
Unit
Number of new working positions (FTE)
Level of
collection
Project level
Source Project application forms (ex-ante)
Project documentation (ex-post)
FAME SU, TASK 3: Definitions of Common Indicators, Working Paper, 26.10.2015 19
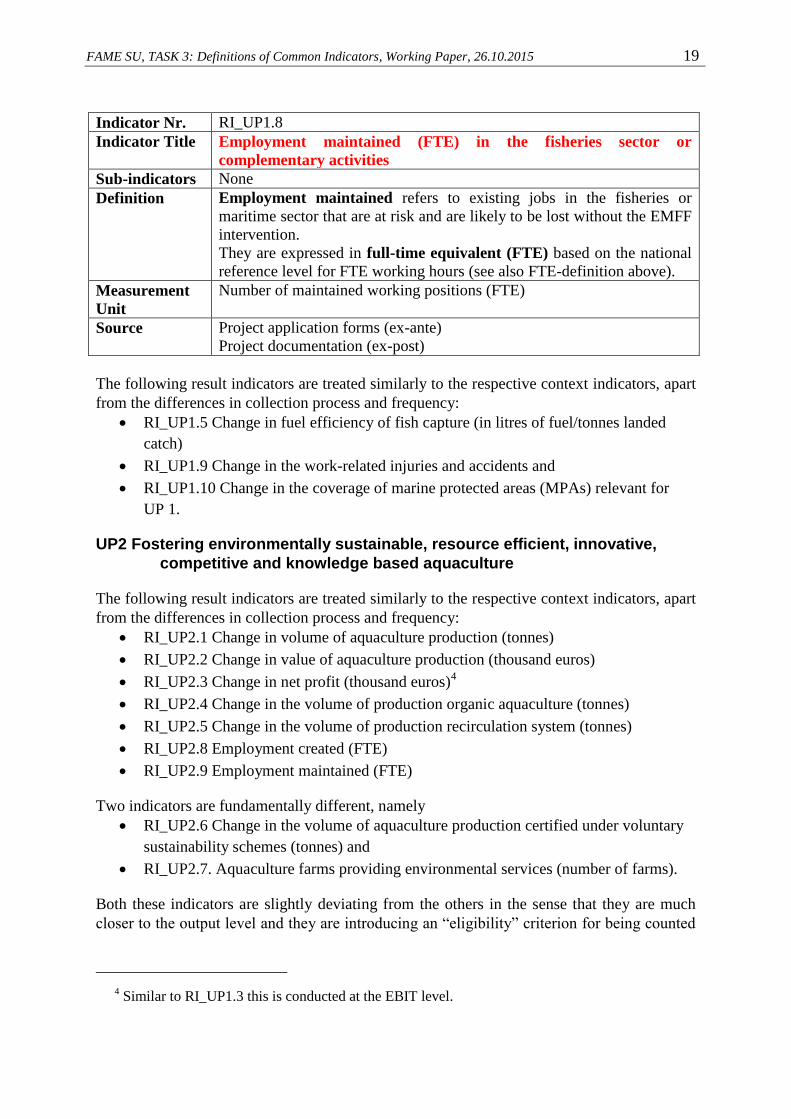
Indicator Nr. RI_UP1.8
Indicator Title Employment maintained (FTE) in the fisheries sector or
complementary activities
Sub-indicators None
Definition Employment maintained refers to existing jobs in the fisheries or
maritime sector that are at risk and are likely to be lost without the EMFF
intervention.
They are expressed in full-time equivalent (FTE) based on the national
reference level for FTE working hours (see also FTE-definition above).
Measurement
Unit
Number of maintained working positions (FTE)
Source Project application forms (ex-ante)
Project documentation (ex-post)
The following result indicators are treated similarly to the respective context indicators, apart
from the differences in collection process and frequency:
RI_UP1.5 Change in fuel efficiency of fish capture (in litres of fuel/tonnes landed
catch)
RI_UP1.9 Change in the work-related injuries and accidents and
RI_UP1.10 Change in the coverage of marine protected areas (MPAs) relevant for
UP 1.
UP2 Fostering environmentally sustainable, resource efficient, innovative,
competitive and knowledge based aquaculture
The following result indicators are treated similarly to the respective context indicators, apart
from the differences in collection process and frequency:
RI_UP2.1 Change in volume of aquaculture production (tonnes)
RI_UP2.2 Change in value of aquaculture production (thousand euros)
RI_UP2.3 Change in net profit (thousand euros)4
RI_UP2.4 Change in the volume of production organic aquaculture (tonnes)
RI_UP2.5 Change in the volume of production recirculation system (tonnes)
RI_UP2.8 Employment created (FTE)
RI_UP2.9 Employment maintained (FTE)
Two indicators are fundamentally different, namely
RI_UP2.6 Change in the volume of aquaculture production certified under voluntary
sustainability schemes (tonnes) and
RI_UP2.7. Aquaculture farms providing environmental services (number of farms).
Both these indicators are slightly deviating from the others in the sense that they are much
closer to the output level and they are introducing an “eligibility” criterion for being counted
4 Similar to RI_UP1.3 this is conducted at the EBIT level.
FAME SU, TASK 3: Definitions of Common Indicators, Working Paper, 26.10.2015 20
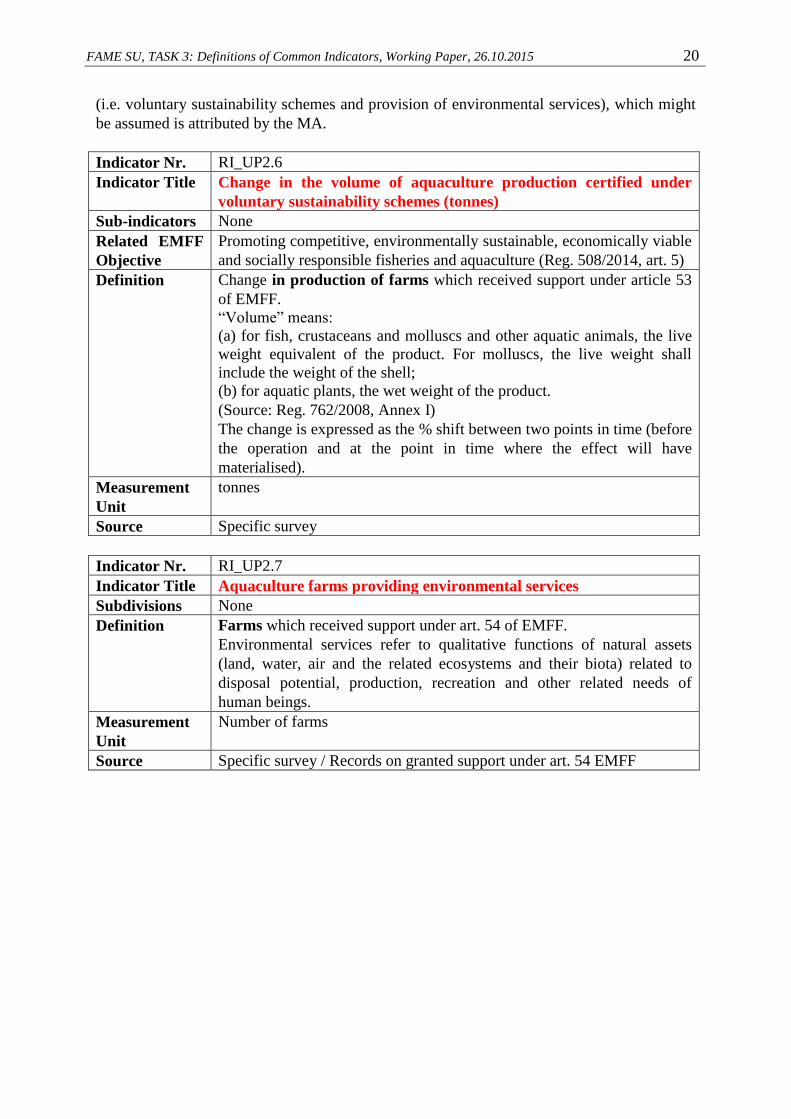
(i.e. voluntary sustainability schemes and provision of environmental services), which might
be assumed is attributed by the MA.
Indicator Nr. RI_UP2.6
Indicator Title Change in the volume of aquaculture production certified under
voluntary sustainability schemes (tonnes)
Sub-indicators None
Related EMFF
Objective
Promoting competitive, environmentally sustainable, economically viable
and socially responsible fisheries and aquaculture (Reg. 508/2014, art. 5)
Definition Change in production of farms which received support under article 53
of EMFF.
“Volume” means:
(a) for fish, crustaceans and molluscs and other aquatic animals, the live
weight equivalent of the product. For molluscs, the live weight shall
include the weight of the shell;
(b) for aquatic plants, the wet weight of the product.
(Source: Reg. 762/2008, Annex I)
The change is expressed as the % shift between two points in time (before
the operation and at the point in time where the effect will have
materialised).
Measurement
Unit
tonnes
Source Specific survey
Indicator Nr. RI_UP2.7
Indicator Title Aquaculture farms providing environmental services
Subdivisions None
Definition Farms which received support under art. 54 of EMFF.
Environmental services refer to qualitative functions of natural assets
(land, water, air and the related ecosystems and their biota) related to
disposal potential, production, recreation and other related needs of
human beings.
Measurement
Unit
Number of farms
Source Specific survey / Records on granted support under art. 54 EMFF
FAME SU, TASK 3: Definitions of Common Indicators, Working Paper, 26.10.2015 21
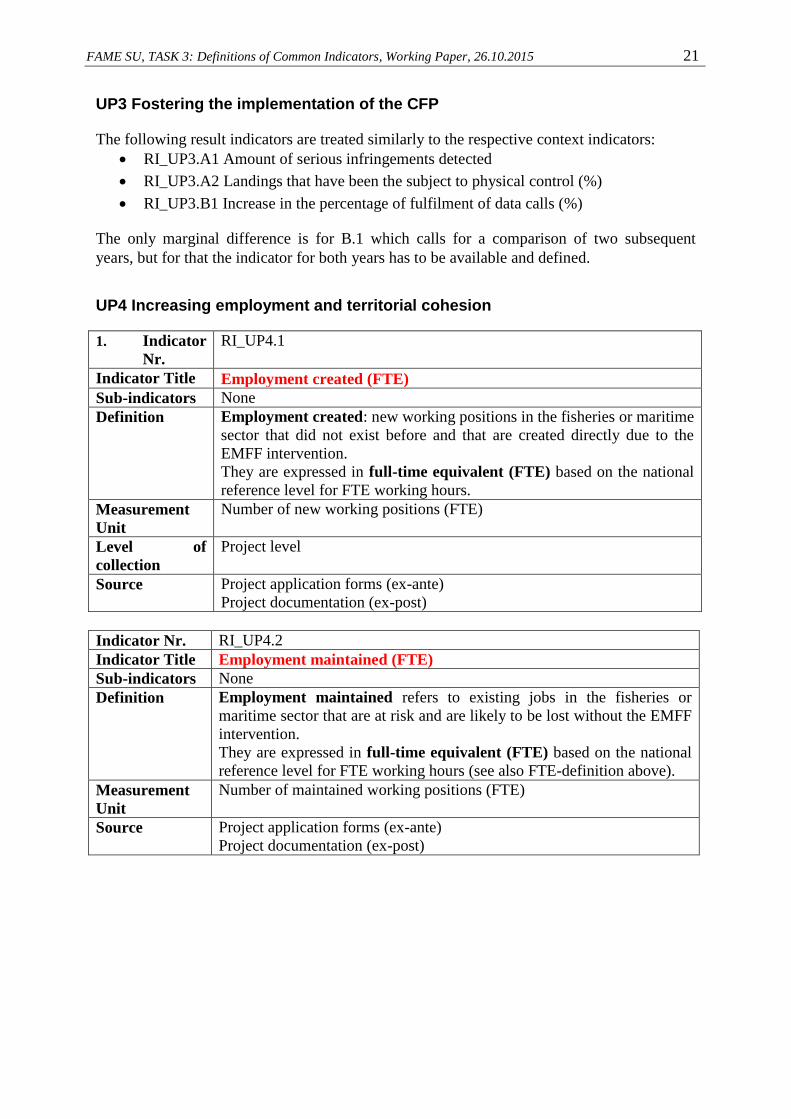
UP3 Fostering the implementation of the CFP
The following result indicators are treated similarly to the respective context indicators:
RI_UP3.A1 Amount of serious infringements detected
RI_UP3.A2 Landings that have been the subject to physical control (%)
RI_UP3.B1 Increase in the percentage of fulfilment of data calls (%)
The only marginal difference is for B.1 which calls for a comparison of two subsequent
years, but for that the indicator for both years has to be available and defined.
UP4 Increasing employment and territorial cohesion
1. Indicator
Nr.
RI_UP4.1
Indicator Title Employment created (FTE)
Sub-indicators None
Definition Employment created: new working positions in the fisheries or maritime
sector that did not exist before and that are created directly due to the
EMFF intervention.
They are expressed in full-time equivalent (FTE) based on the national
reference level for FTE working hours.
Measurement
Unit
Number of new working positions (FTE)
Level of
collection
Project level
Source Project application forms (ex-ante)
Project documentation (ex-post)
Indicator Nr. RI_UP4.2
Indicator Title Employment maintained (FTE)
Sub-indicators None
Definition Employment maintained refers to existing jobs in the fisheries or
maritime sector that are at risk and are likely to be lost without the EMFF
intervention.
They are expressed in full-time equivalent (FTE) based on the national
reference level for FTE working hours (see also FTE-definition above).
Measurement
Unit
Number of maintained working positions (FTE)
Source Project application forms (ex-ante)
Project documentation (ex-post)
FAME SU, TASK 3: Definitions of Common Indicators, Working Paper, 26.10.2015 22
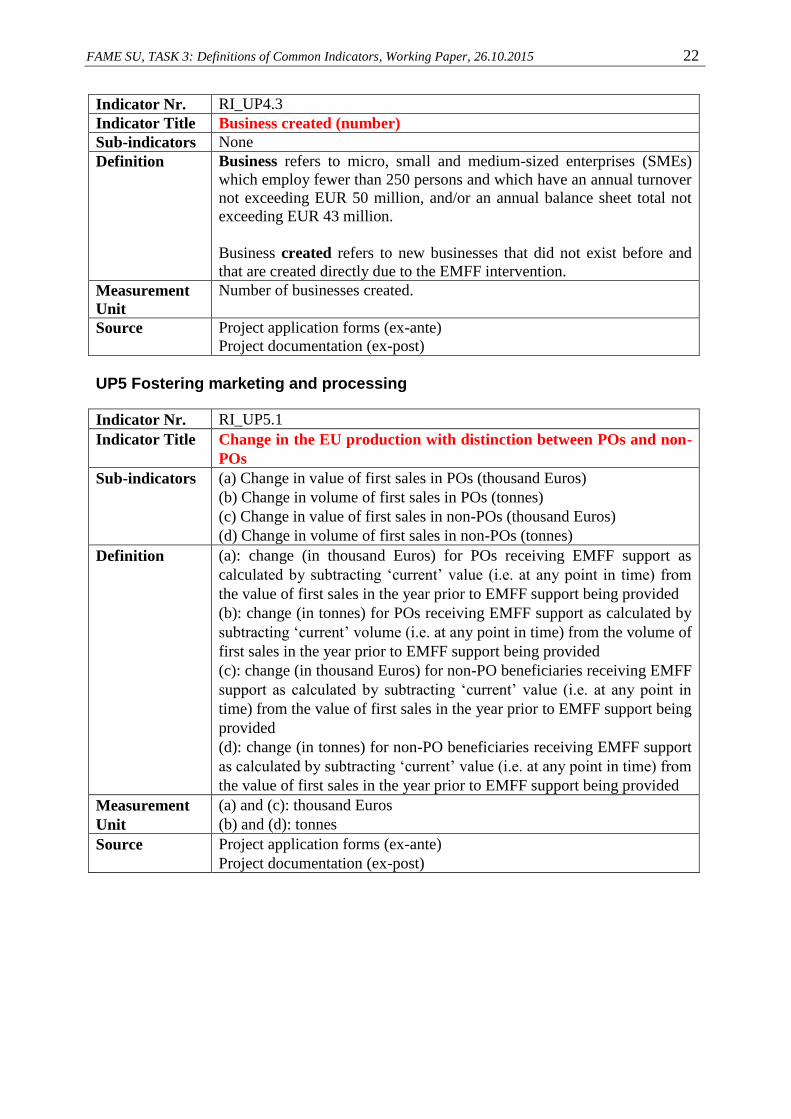
Indicator Nr. RI_UP4.3
Indicator Title Business created (number)
Sub-indicators None
Definition Business refers to micro, small and medium-sized enterprises (SMEs)
which employ fewer than 250 persons and which have an annual turnover
not exceeding EUR 50 million, and/or an annual balance sheet total not
exceeding EUR 43 million.
Business created refers to new businesses that did not exist before and
that are created directly due to the EMFF intervention.
Measurement
Unit
Number of businesses created.
Source Project application forms (ex-ante)
Project documentation (ex-post)
UP5 Fostering marketing and processing
Indicator Nr. RI_UP5.1
Indicator Title Change in the EU production with distinction between POs and non-
POs
Sub-indicators (a) Change in value of first sales in POs (thousand Euros)
(b) Change in volume of first sales in POs (tonnes)
(c) Change in value of first sales in non-POs (thousand Euros)
(d) Change in volume of first sales in non-POs (tonnes)
Definition (a): change (in thousand Euros) for POs receiving EMFF support as
calculated by subtracting ‘current’ value (i.e. at any point in time) from
the value of first sales in the year prior to EMFF support being provided
(b): change (in tonnes) for POs receiving EMFF support as calculated by
subtracting ‘current’ volume (i.e. at any point in time) from the volume of
first sales in the year prior to EMFF support being provided
(c): change (in thousand Euros) for non-PO beneficiaries receiving EMFF
support as calculated by subtracting ‘current’ value (i.e. at any point in
time) from the value of first sales in the year prior to EMFF support being
provided
(d): change (in tonnes) for non-PO beneficiaries receiving EMFF support
as calculated by subtracting ‘current’ value (i.e. at any point in time) from
the value of first sales in the year prior to EMFF support being provided
Measurement
Unit
(a) and (c): thousand Euros
(b) and (d): tonnes
Source Project application forms (ex-ante)
Project documentation (ex-post)
FAME SU, TASK 3: Definitions of Common Indicators, Working Paper, 26.10.2015 23
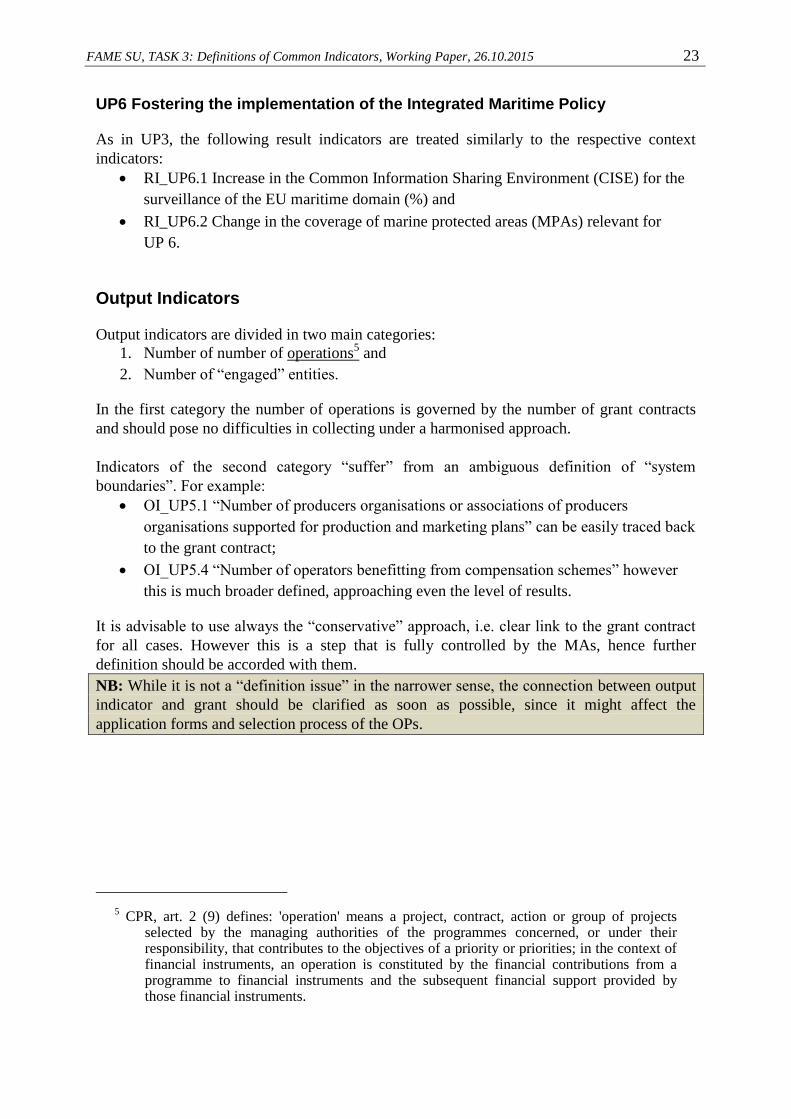
UP6 Fostering the implementation of the Integrated Maritime Policy
As in UP3, the following result indicators are treated similarly to the respective context
indicators:
RI_UP6.1 Increase in the Common Information Sharing Environment (CISE) for the
surveillance of the EU maritime domain (%) and
RI_UP6.2 Change in the coverage of marine protected areas (MPAs) relevant for
UP 6.
Output Indicators
Output indicators are divided in two main categories:
1. Number of number of operations5 and
2. Number of “engaged” entities.
In the first category the number of operations is governed by the number of grant contracts
and should pose no difficulties in collecting under a harmonised approach.
Indicators of the second category “suffer” from an ambiguous definition of “system
boundaries”. For example:
OI_UP5.1 “Number of producers organisations or associations of producers
organisations supported for production and marketing plans” can be easily traced back
to the grant contract;
OI_UP5.4 “Number of operators benefitting from compensation schemes” however
this is much broader defined, approaching even the level of results.
It is advisable to use always the “conservative” approach, i.e. clear link to the grant contract
for all cases. However this is a step that is fully controlled by the MAs, hence further
definition should be accorded with them.
NB: While it is not a “definition issue” in the narrower sense, the connection between output
indicator and grant should be clarified as soon as possible, since it might affect the
application forms and selection process of the OPs.
5 CPR, art. 2 (9) defines: 'operation' means a project, contract, action or group of projects
selected by the managing authorities of the programmes concerned, or under their responsibility, that contributes to the objectives of a priority or priorities; in the context of financial instruments, an operation is constituted by the financial contributions from a programme to financial instruments and the subsequent financial support provided by those financial instruments.