Embed Size (px)
Citation preview

Fairmont State University Financial Statements
Years Ended June 30, 2016 and 2015
and
Independent Auditor’s Reports

FAIRMONT STATE UNIVERSITY
TABLE OF CONTENTS
Page
INDEPENDENT AUDITOR’S REPORT 3 - 4
MANAGEMENT’S DISCUSSION AND ANALYSIS (RSI) (UNAUDITED) 5 - 19
FINANCIAL STATEMENTS
Statements of Net Position 20 - 21 Statements of Revenues, Expenses, and Changes in Net Position 22 - 23 Statements of Cash Flows 24 - 25 Notes to Financial Statements 26 - 68
ADDITIONAL INFORMATION AS OF AND FOR THE YEAR ENDED JUNE 30, 2016: 69 Schedule of Net Position Information 70 Schedule of Revenues, Expenses, and Changes in Net Position Information 71 Schedule of Cash Flow Information 72 - 73 Schedules of Natural vs. Functional Classifications Information 74 - 76 Note to Schedules 77 - 79
REQUIRED SUPPLEMENTARY INFORMATION 80
Schedule of Proportionate Share of the Net Pension Liability 81
Schedule of Pension Contributions 82
Note to Required Supplementary Information 83
INDEPENDENT AUDITOR’S REPORT ON INTERNAL CONTROL OVER FINANCIAL REPORTING AND ON COMPLIANCE AND OTHER MATTERS BASED ON AN AUDIT OF FINANCIAL STATEMENTS PERFORMED IN ACCORDANCE WITH GOVERNMENT AUDITING STANDARDS 84 - 85

The Virginia Center 1411 Virginia Street, East Suite 100 Charleston, WV 25301 Phone (304) 343-4126 or 1(800) 788-3844 Fax (304) 343-8008
Wharf District 68 Clay Street Suite C Morgantown, WV 26501 Phone (304) 554-3371 Fax (304) 554-3410
Towne Square 201 Third Street PO Box 149 Parkersburg, WV 26102 Phone (304) 485-6584 Fax (304) 485-0971
www.suttlecpas.com E-mail: [email protected] A Professional Limited Liability Company
3
INDEPENDENT AUDITOR’S REPORT Board of Governors Fairmont State University Fairmont, West Virginia Report on the Financial Statements We have audited the accompanying financial statements of the business-type activities of Fairmont State University (Fairmont State), a component unit of the West Virginia Higher Education Policy Commission, as of and for the years ended June 30, 2016 and 2015, and the related notes to the financial statements, which collectively comprise Fairmont State’s basic financial statements as listed in the table of contents. Management’s Responsibility for the Financial Statements Management is responsible for the preparation and fair presentation of these financial statements in accordance with accounting principles generally accepted in the United States of America; this includes the design, implementation, and maintenance of internal control relevant to the preparation and fair presentation of financial statements that are free from material misstatement, whether due to fraud or error. Auditor’s Responsibility Our responsibility is to express an opinion on these financial statements based on our audits. We conducted our audits in accordance with auditing standards generally accepted in the United States of America and the standards applicable to financial audits contained in Government Auditing Standards, issued by the Comptroller General of the United States. Those standards require that we plan and perform the audits to obtain reasonable assurance about whether the financial statements are free from material misstatement. An audit involves performing procedures to obtain audit evidence about the amounts and disclosures in the financial statements. The procedures selected depend on the auditor’s judgment, including the assessment of the risks of material misstatement of the financial statements, whether due to fraud or error. In making those risk assessments, the auditor considers internal control relevant to the entity’s preparation and fair presentation of the financial statements in order to design audit procedures that are appropriate in the circumstances, but not for the purpose of expressing an opinion on the effectiveness of the entity’s internal control. Accordingly, we express no such opinion. An audit also includes evaluating the appropriateness of accounting policies used and the reasonableness of significant accounting estimates made by management, as well as evaluating the overall presentation of the financial statements. We believe that the audit evidence we have obtained is sufficient and appropriate to provide a basis for our audit opinions. Opinions In our opinion, the financial statements referred to above present fairly, in all material respects, the financial position of the business-type activities of Fairmont State, as of June 30, 2016 and 2015, and the changes in financial position and cash flows thereof for the years then ended in accordance with accounting principles generally accepted in the United States of America.

4
Other Matters Required Supplementary Information Accounting principles generally accepted in the United States of America require that the management’s discussion and analysis on pages 5 through 19, the schedule of proportionate share of the net pension liability and schedule of pension contributions, and related footnote on pages 81 through 83 be presented to supplement the basic financial statements. Such information, although not a part of the basic financial statements, is required by the Governmental Accounting Standards Board, who considers it to be an essential part of financial reporting for placing the basic financial statements in an appropriate operational, economic, or historical context. We have applied certain limited procedures to the required supplementary information in accordance with auditing standards generally accepted in the United States of America, which consisted of inquiries of management about the methods of preparing the information and comparing the information for consistency with management’s responses to our inquiries, the basic financial statements, and other knowledge we obtained during our audit of the basic financial statements. We do not express an opinion or provide any assurance on the information because the limited procedures do not provide us with sufficient evidence to express an opinion or provide any assurance. Other Information Our audit was conducted for the purpose of forming an opinion on the financial statements that collectively comprise Fairmont State’s basic financial statements. The additional information listed in the table of contents is presented for the purpose of additional analysis and is not a required part of the basic financial statements. This additional information is the responsibility of management and was derived from and relates directly to the underlying accounting and other records used to prepare the basic financial statements. Such information has been subjected to the auditing procedures applied in the audit of the basic financial statements and certain additional procedures, including comparing and reconciling such information directly to the underlying accounting and other records used to prepare the basic financial statements or to the basic financial statements themselves, and other additional procedures in accordance with auditing standards generally accepted in the United States of America. In our opinion, such information is fairly stated in all material respects in relation to the basic financial statements as a whole. Other Reporting Required by Government Auditing Standards In accordance with Government Auditing Standards, we have also issued our report dated January 17, 2017, on our consideration of Fairmont State’s internal control over financial reporting and on our tests of its compliance with certain provisions of laws, regulations, contracts, and grant agreements and other matters. The purpose of that report is to describe the scope of our testing of internal control over financial reporting and compliance and the results of that testing, and not to provide an opinion on internal control over financial reporting or on compliance. That report is an integral part of an audit performed in accordance with Government Auditing Standards in considering Fairmont State’s internal control over financial reporting and compliance.
Charleston, West Virginia January 17, 2017

FAIRMONT STATE UNIVERSITY (Includes the following Internal Funds: Unrestricted, Restricted, and Other Fund, Auxiliary Fund, and Board of Governors Support Fund) Management’s Discussion and Analysis (Unaudited) Fiscal Year Ended June 30, 2016
5
About Fairmont State University Fairmont State University was founded in 1865 as the West Virginia Normal School at Fairmont, a private institution dedicated to educating teachers. The Normal School at Fairmont was eventually purchased by the State and, in 1917, moved to its hilltop location on Locust Avenue and the building we now call Hardway Hall. The name was changed to Fairmont State Teachers College in 1930 and to Fairmont State College in 1943-44. Fairmont State Community and Technical College was founded in 1974 and was renamed Pierpont Community & Technical College (Pierpont) effective July 1, 2006. Fairmont State College was recognized as a University and renamed Fairmont State University on April 7, 2004. Fairmont State University (Fairmont State or the Institution) is governed by a 12-member Board of Governors that determines, controls, supervises, and manages the financial, business, and educational policies and affairs of the Institution. New legislation became effective July, 1, 2008 that provided for a separate governing board for Pierpont. The Board of Governors of Pierpont and the Board of Governors of Fairmont State jointly agreed to a division of assets and liabilities. The agreement was executed on December 15, 2009 and was effective retroactively to July 1, 2009. The legislation requires a separate financial statement audit for Pierpont, which was effective beginning with fiscal year 2010. Total enrollment of Fairmont State is approximately 4,000 students from 28 states and 31 countries. The student to faculty ratio is 17:1. Approximately 72% of our students receive some form of scholarship or financial aid. Campus activities include more than 80 clubs, organizations, student publications, honoraries, sororities and fraternities, and intramural sports. Fairmont State is a member of the NCAA Division II and the Mountain East Conference. Overview This section of the annual financial report focuses on an overview of Fairmont State’s financial performance during the fiscal year ended June 30, 2016 with comparisons to the previous year. As the financial statements are reviewed, it is important to understand how the reporting structure changed beginning in fiscal year 2010 with the Separation of Assets and Liabilities Agreement. As the separate entities were created by the Legislature, it was realized that due to the bond debt responsibilities, shared campus facilities and infrastructure, and shared administrative and technical support, a Separation of Assets and Liabilities Agreement would be required. The agreement was effective as of July 1, 2009, and fiscal year 2016 is the seventh year of operating and reporting based on the agreement. The agreement establishes general principles to apply to the division of assets and liabilities and allocation of revenues and expenditures between Pierpont and Fairmont State. The Agreement also provides specific language in relation to outstanding bond indebtedness, including the responsibilities of both Pierpont and Fairmont State. Financial statement note 17, Separation of Assets and Liabilities Agreement, provides additional information about this Agreement and the defining legislation. The fiscal year 2016 audited financial statements are presented in comparative format and reflect the reporting structure defined in the agreement.

6
Fairmont State’s audited financial report includes additional information for Unrestricted, Restricted and Other Funds, University-owned Auxiliary Funds, and Fairmont State’s ownership in Board of Governors Support (BOG Support). The BOG Support component reports capital funds that support both academic institutions as a separate reporting component. BOG Support consists primarily of Educational and General (E&G) Capital, Infrastructure, and Bond funds for the repair and replacement of shared buildings and capital assets. This component accounts for capital assets, depreciation and debt obligations of the shared campus. These funds are allocated based on the average of the past ten (10) years of credit hour enrollments. The supplemental schedules were developed to show the component parts of Fairmont State and may be found in the additional information section of this report. The Fairmont State Foundation (the Foundation) financial information will not be presented. This presentation is no longer required to comply with GASB Statement No. 39 due to the fact that the Foundation supports both Fairmont State and Pierpont for fiscal years 2016 and 2015. Fairmont State’s annual report consists of three basic financial statements: the Statement of Net Position; the Statement of Revenues, Expenses and Changes in Net Position; and the Statement of Cash Flows. These statements focus on Fairmont State’s financial condition, results of operations, and cash flows as a whole. Each of these statements is discussed below. Financial Highlights The most significant financial highlight for fiscal year 2016 was the construction of the University Terrace Apartments. The Series 2015A Revenue Bonds were issued in April 2015 for $30,200,000. The new student housing facility funded by the bonds is a luxurious 347-bed apartment complex. The complex features three halls with various styles of apartments and suites. Construction was completed on time, and the complex opened for the Fall 2016 semester. Other financial highlights included an increase in enrollment, an increase in other postemployment benefits (OPEB) liability, and changes in net position. In fiscal year 2016, Fairmont State experienced slight enrollment increases. The undergraduate full-time
equivalent (FTE) increased from 3,391 for Fall 2014 to 3,423 for Fall 2015. The undergraduate headcount increased from 3,764 for Fall 2014 to 3,791 for Fall 2015. Graduate FTE and headcount decreased from Fall 2014 to Fall 2015 from 151 to 132 and from 250 to 234, respectively.
Effective July 1, 2007, Fairmont State adopted GASB Statement No. 45, Accounting and Financial
Reporting by Employers for Postemployment Benefits Other than Pensions. This statement provides standards for the measurement, recognition, and display of other postemployment benefit (OPEB) expenditures, assets, and liabilities. The compensated absences liability for sick leave calculated as of June 30, 2007 following GASB Statement No. 16 for approximately $2 million was removed from the financial statements. This accrual was replaced by the OPEB liability accrual. OPEB liability has been accrued annually since fiscal year 2008 for a total unfunded liability of
$9,384,887 at June 30, 2015. The additional OPEB liability for fiscal year 2016 was recorded in the amount of $581,169 for a
total unfunded liability of $9,966,056 as of June 30, 2016.
The OPEB liability is recorded based on records maintained by the West Virginia Public Employee Insurance Agency (PEIA). The State of West Virginia has instituted several measures to reduce the OPEB liability including: changes in eligibility criteria, retiree benefit changes, reduction in future retiree premium subsidy costs borne by the State, and passed legislation during fiscal year 2013 committing funds to pay down the liability. With the plan and design changes, an additional annual allocation plus the current funds designated for payment of OPEB costs, the liability is projected to be eliminated by fiscal year 2037. Reductions to the OPEB liability are expected to begin in fiscal year 2017.
Total net position decreased by $177,741 or 0.24%. The decrease can be attributed to the following:

7
Unrestricted primary operating funds of Fairmont State increased by $195,096 after the increase in OPEB liability of $581,169.
Unrestricted fund manager funds of Fairmont State increased by $535,014. Unrestricted net position balances for Auxiliary funds increased by $859,768 after the increase in
OPEB liability of $59,058. Unrestricted President’s control operating funds decreased by $1,199,686 after the increase in
OPEB liability of $522,111. Restricted for Capital Projects decreased by $423,979. Restricted for Debt Service decreased by $1,314,891. Net Investment in Capital Assets increased by $1,397,639.
Statement of Net Position The Statement of Net Position presents the assets (current and noncurrent), deferred outflows of resources, liabilities (current and noncurrent), deferred inflows of resources, and net position (assets plus deferred outflows of resources minus liabilities and deferred inflows of resources) of Fairmont State as of the fiscal year end. Assets denote the resources available to continue the operations of Fairmont State. Deferred outflows of resources represent the consumption of net position that is applicable to a future fiscal year. Liabilities indicate how much Fairmont State owes its vendors, employees, and lenders. Deferred inflows of resources represent an acquisition of net position that is applicable to a future fiscal year. Net position provides a way to measure the financial position of Fairmont State. Net position is divided into three major categories:
1. Net investment in capital assets. This category represents Fairmont State’s total investment in capital assets, net of depreciation and outstanding debt obligations related to those capital assets. To the extent debt has been incurred but not yet expended for capital assets, such amounts are not included as a component of this category.
2. Restricted net position. This category includes net position whose use is restricted either due to
externally imposed constraints or restrictions imposed by law. It is further divided into two additional components -- expendable and nonexpendable. Expendable restricted net position includes resources for which Fairmont State is legally or contractually obligated to spend resources in accordance with restrictions imposed by external third parties. Nonexpendable restricted net position includes endowment and similar type funds for which donors or other outside sources have stipulated, as a condition of the gift instruments, that the principal is to be maintained inviolate and in perpetuity, and invested for the purpose of producing present and future income, which may either be expended or added to principal. Fairmont State has no nonexpendable net position.
3. Unrestricted net position. This category includes resources that are not subject to externally imposed
stipulations. Such resources are derived from tuition and fees (not restricted as to use), state appropriations, sales and services of educational activities, and auxiliary enterprises. Unrestricted net position is used for transactions related to the educational and general operations of Fairmont State and may be designated for specific purposes by action of management or the Board of Governors.

8
Condensed Schedules of Net Position JUNE 30 2016 2015 2014
Assets Current Assets $ 37,257,470 $ 32,414,133 $ 34,449,159 Noncurrent Assets 144,544,288 147,782,426 116,459,269 Total Assets 181,801,758 180,196,559 150,908,428
Deferred Outflows of Resources 1,215,023 1,340,553 1,262,177
Total $ 183,016,781 $ 181,537,112 $ 152,170,605
Liabilities Current Liabilities $ 16,601,168 $ 11,204,288 $ 8,707,850 Noncurrent Liabilities 91,696,872 95,521,934 65,039,012 Total Liabilities 108,298,040 106,726,222 73,746,862
Deferred Inflows of Resources 357,582 271,990 -
Net Position Net Investment in Capital Assets 62,083,700 60,686,061 59,615,067 Restricted for: Expendable: Loans 131,548 142,966 156,150 Scholarships 6,625 26,813 6,353 Capital Projects 3,712,363 4,136,342 4,377,852 Debt Service 3,812 1,318,703 1,061 Total Restricted 3,854,348 5,624,824 4,541,416
Unrestricted (After OPEB) 8,423,111 8,228,015 14,267,260
Total Net Position 74,361,159 74,538,900 78,423,743
Total $ 183,016,781 $ 181,537,112 $ 152,170,605
Total current assets increased by $4,843,337 or 14.94% to $37,257,470, resulting primarily from an
increase in cash and cash equivalents of $4,477,558. The increase in cash consisted primarily of an increase in Auxiliary fund cash of $6,031,543. This increase was offset by a decrease in the E&G Operating fund cash of $1,214,802.
Total noncurrent assets, comprised primarily of capital assets including buildings and equipment, decreased by $3,238,138 or 2.19% to $144,544,288. Noncurrent cash reserved for construction costs of University Terrace decreased by $27,109,564. Capital assets, net of depreciation, increased by $24,329,547.
Total deferred outflows of resources decreased by $125,530 or 9.36% to $1,215,023. Total current liabilities increased by $5,396,880 or 48.17% to $16,601,168 due primarily to increases in
accounts payable of $2,226,087, retainages payable of $2,410,739, and the current portion of bonds payable of $727,980. The increases in accounts payable and retainages payable are primarily related to ongoing capital projects, including University Terrace. The increase in the current portion of bonds payable is due to the initial payment due for the Series 2015A revenue bonds, also related to the construction of University Terrace.
9
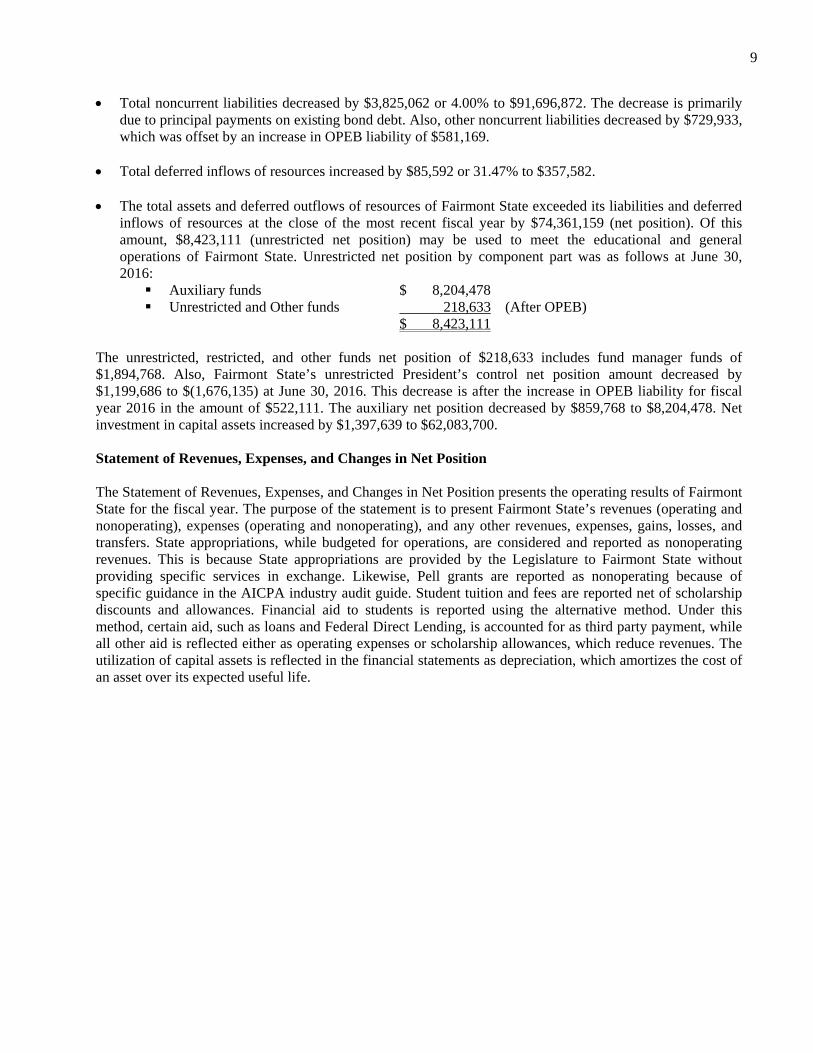
Total noncurrent liabilities decreased by $3,825,062 or 4.00% to $91,696,872. The decrease is primarily
due to principal payments on existing bond debt. Also, other noncurrent liabilities decreased by $729,933, which was offset by an increase in OPEB liability of $581,169.
Total deferred inflows of resources increased by $85,592 or 31.47% to $357,582. The total assets and deferred outflows of resources of Fairmont State exceeded its liabilities and deferred
inflows of resources at the close of the most recent fiscal year by $74,361,159 (net position). Of this amount, $8,423,111 (unrestricted net position) may be used to meet the educational and general operations of Fairmont State. Unrestricted net position by component part was as follows at June 30, 2016: Auxiliary funds $ 8,204,478 Unrestricted and Other funds 218,633 (After OPEB) $ 8,423,111
The unrestricted, restricted, and other funds net position of $218,633 includes fund manager funds of $1,894,768. Also, Fairmont State’s unrestricted President’s control net position amount decreased by $1,199,686 to $(1,676,135) at June 30, 2016. This decrease is after the increase in OPEB liability for fiscal year 2016 in the amount of $522,111. The auxiliary net position decreased by $859,768 to $8,204,478. Net investment in capital assets increased by $1,397,639 to $62,083,700. Statement of Revenues, Expenses, and Changes in Net Position The Statement of Revenues, Expenses, and Changes in Net Position presents the operating results of Fairmont State for the fiscal year. The purpose of the statement is to present Fairmont State’s revenues (operating and nonoperating), expenses (operating and nonoperating), and any other revenues, expenses, gains, losses, and transfers. State appropriations, while budgeted for operations, are considered and reported as nonoperating revenues. This is because State appropriations are provided by the Legislature to Fairmont State without providing specific services in exchange. Likewise, Pell grants are reported as nonoperating because of specific guidance in the AICPA industry audit guide. Student tuition and fees are reported net of scholarship discounts and allowances. Financial aid to students is reported using the alternative method. Under this method, certain aid, such as loans and Federal Direct Lending, is accounted for as third party payment, while all other aid is reflected either as operating expenses or scholarship allowances, which reduce revenues. The utilization of capital assets is reflected in the financial statements as depreciation, which amortizes the cost of an asset over its expected useful life.

10
Condensed Schedule of Revenues, Expenses, and Changes in Net Position Year Ended June 30: 2016 2015 2014
Operating Revenues $ 40,747,685 $ 39,257,792 $ 38,583,055 Operating Expenses 61,007,731 62,686,548 60,998,530 Operating Loss (20,260,046) (23,428,756) (22,415,475)
Total Net Nonoperating Revenues 19,779,077 21,301,033 22,582,231
(Decrease) Increase in Net Position before Other Revenues, Expenses, Gains or Losses, and Transfer (480,969) (2,127,723) 166,756
Payments Made and Expenses Incurred by the State on Behalf of Fairmont State 183,361 184,468 -
Capital Bond Proceeds from the State - 18,303 2,519,903
(Decrease) Increase in Net Position before Transfer (297,608) (1,924,952) 2,686,659
Transfer of Net Position (to) from Pierpont 119,867 (362,923) 263,710
(Decrease) Increase in Net Position (177,741) (2,287,875) 2,950,369
Net Position – Beginning of Year 74,538,900 78,423,743 75,473,374
Net Effect of Change in Accounting Policy - (1,596,968) -
Net Position – Beginning of Year (Restated) 74,538,900 76,826,775 75,473,374
Net Position – End of Year $ 74,361,159 $ 74,538,900 $ 78,423,743

11
Operating Revenues: The following are graphic illustrations of Fairmont State’s operating revenues by source.
34.06%
0.14%
29.92%
1.65%
2.54%
15.61%
4.79%
0.09%
1.01%4.13% 4.46% 1.60%
2016
30.44%
0.31%
29.49%1.87%
2.85%
16.48%
4.26%
0.10%1.41%
5.00%6.18% 1.61%
2015
Tuition Student Activity Support RevenueAuxiliary Enterprise RevenueAuxiliary Support Services RevenueFederal Contracts and GrantsState Contracts and GrantsPrivate Contracts and GrantsInterest on Student Loans ReceivableFaculty Services RevenueOperating Costs RevenueSupport Services RevenueMiscellaneous

12
Highlights of the information presented on the Statements of Revenues, Expenses, and Changes in Net Position are as follows: Tuition and fees revenue, after adjustment for scholarship allowance of $11,361,528, increased by
$1,928,765 or 16.14% to $13,879,414. The Board of Governors increased Tuition and Required E&G fees for fiscal year 2016. The resident fee increased by $147 to $2,295 or 0.06%, and the non-resident fee increased by $316 to $5,269 or 0.06%. E&G Capital Fees were increased by $4 for residents and $10 for non-residents.
Federal financial aid and federal grants revenues decreased by $81,818 or 7.32% to $1,035,589. Federal
grants active during fiscal year 2016 included the Title III Strengthening Institutions grant from the U.S. Department of Education, a Department of Justice grant (WVICASV), and a NASA Educator Resource Center (ERC) grant.
State contracts and grants decreased by $109,101 or 1.69% to $6,362,078. State contracts and grants include institutional grants from other State agencies and state-funded student financial aid.
Private contracts and grants increased by $281,663 or 16.85% to $1,952,834.
Auxiliary enterprise revenue increased by $615,080 or 5.31% to $12,190,788. The increase was primarily
due to an increase in housing fees. The Board of Governors also approved a facilities fee increase of $6 for both residents and non-residents.
Miscellaneous revenues increased by $18,204 or 2.86% to $655,761.
State appropriations decreased by $800,920 or 5.06% to $15,041,474.
Pell grant revenues decreased by $383,432 or 5.11% to $7,116,252.

13
FUNCTIONAL CLASSIFICATION CHART Operating Expenses: The following is a graphic illustration of operating expenses by function.
2016
2015
13.56%
30.36%
0.17%
0.95%7.06%
9.03%
11.84%
11.84%
8.18%
6.38% 0.63%Auxiliary
Instruction
Research
Public Service
Academic Support
Student Services
General Institutional Support
Student Financial Aid
Operations and Maintenance
Depreciation
Other
12.63%
29.46%
0.17%
0.62%
7.70%
9.38%
13.63%
11.16%
8.36%
6.28% 0.61%Auxiliary
Instruction
Research
Public Service
Academic Support
Student Services
General Institutional Support
Student Financial Aid
Operations and Maintenance
Depreciation
Other

14
Breakdown of Expense by Functional Classification: For fiscal year 2016, Fairmont State’s total operating expenses were $61,007,731. Instruction expenses totaled $18,523,756 or 30.36% of the total operating budget. The following reflects the amounts and percentages for these expenses: 2016 % 2015 % 2014 % Auxiliary $ 8,272,170 13.56% $ 7,917,771 12.63% $ 7,211,838 11.82% Instruction 18,523,756 30.36% 18,470,491 29.46% 17,809,371 29.20% Research 104,619 0.17% 108,416 0.17% 146,504 0.24% Public service 578,090 0.95% 388,799 0.62% 411,219 0.67% Academic support 4,305,131 7.06% 4,819,118 7.70% 5,108,631 8.38% Student services 5,509,520 9.03% 5,882,916 9.38% 6,178,459 10.13% General institutional support 7,223,121 11.84% 8,545,657 13.63% 5,978,821 9.80% Student financial aid 7,225,833 11.84% 6,998,665 11.16% 7,157,534 11.73% Operation and maintenance 4,987,834 8.18% 5,237,622 8.36% 6,603,558 10.83% Depreciation 3,892,198 6.38% 3,936,352 6.28% 3,830,363 6.28% Other 385,459 0.63% 380,741 0.61% 562,232 0.92% Total $ 61,007,731 100.00% $ 62,686,548 100.00% $ 60,998,530 100.00%

15
NATURAL CLASSIFICATION CHARTS The following is a graphic illustration of operating expenses by natural classification:
2016
2015
43.55%
10.93%
21.27%
4.20%
11.43%6.38%
0.85%
0.14%0.34% 0.63%
0.28%
Salaries and Wages
Benefits
Supplies and Other Services
Utilities
Scholarships and Fellowships
Depreciation
Assessment for Faculty Services
Assessments for Operating Costs
Assessment for Support Services
Loan Cancellations and Write-Offs
Fees Assessed by the Commission
42.72%
13.62%
19.78%
4.01%
11.07%6.28%
0.86%0.14%
0.62% 0.61%0.29%
Salaries and Wages
Benefits
Supplies and Other Services
Utilities
Scholarships and Fellowships
Depreciation
Assessment for Faculty Services
Assessments for Operating Costs
Assessment for Support Services
Loan Cancellations and Write-Offs
Fees Assessed by the Commission
16
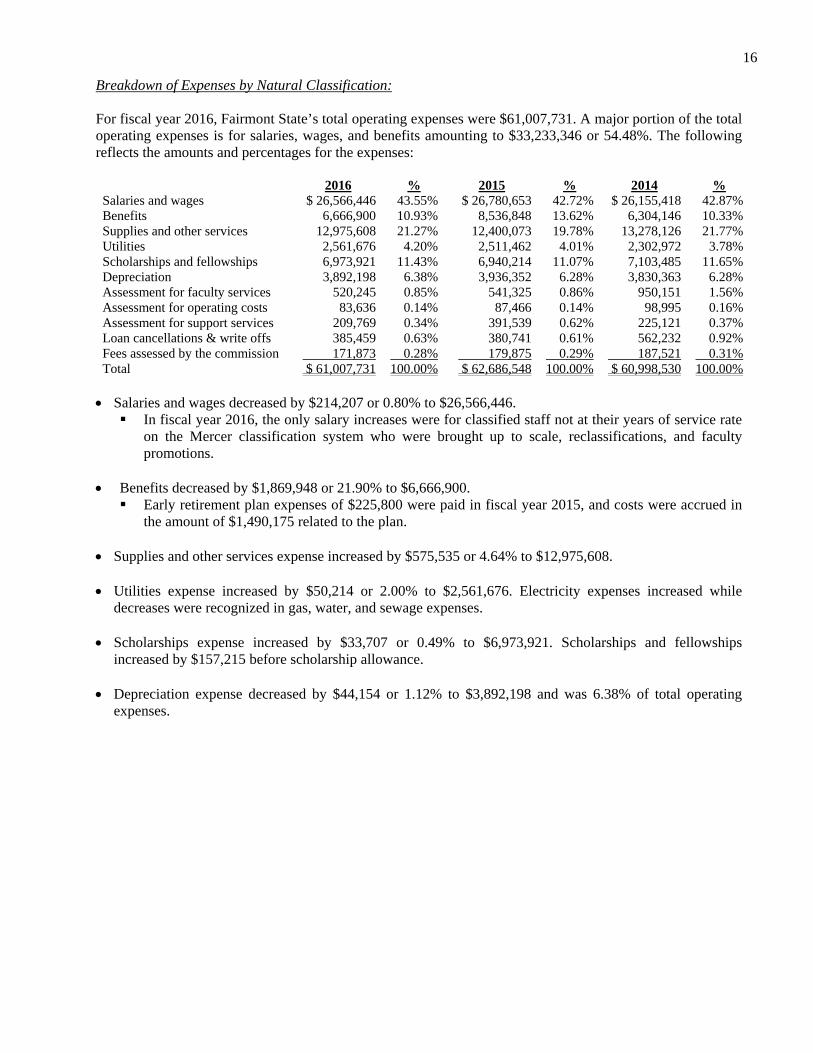
Breakdown of Expenses by Natural Classification: For fiscal year 2016, Fairmont State’s total operating expenses were $61,007,731. A major portion of the total operating expenses is for salaries, wages, and benefits amounting to $33,233,346 or 54.48%. The following reflects the amounts and percentages for the expenses:
2016 % 2015 % 2014 % Salaries and wages $ 26,566,446 43.55% $ 26,780,653 42.72% $ 26,155,418 42.87% Benefits 6,666,900 10.93% 8,536,848 13.62% 6,304,146 10.33% Supplies and other services 12,975,608 21.27% 12,400,073 19.78% 13,278,126 21.77% Utilities 2,561,676 4.20% 2,511,462 4.01% 2,302,972 3.78% Scholarships and fellowships 6,973,921 11.43% 6,940,214 11.07% 7,103,485 11.65% Depreciation 3,892,198 6.38% 3,936,352 6.28% 3,830,363 6.28% Assessment for faculty services 520,245 0.85% 541,325 0.86% 950,151 1.56% Assessment for operating costs 83,636 0.14% 87,466 0.14% 98,995 0.16% Assessment for support services 209,769 0.34% 391,539 0.62% 225,121 0.37% Loan cancellations & write offs 385,459 0.63% 380,741 0.61% 562,232 0.92% Fees assessed by the commission 171,873 0.28% 179,875 0.29% 187,521 0.31% Total $ 61,007,731 100.00% $ 62,686,548 100.00% $ 60,998,530 100.00%
Salaries and wages decreased by $214,207 or 0.80% to $26,566,446. In fiscal year 2016, the only salary increases were for classified staff not at their years of service rate
on the Mercer classification system who were brought up to scale, reclassifications, and faculty promotions.
Benefits decreased by $1,869,948 or 21.90% to $6,666,900. Early retirement plan expenses of $225,800 were paid in fiscal year 2015, and costs were accrued in
the amount of $1,490,175 related to the plan. Supplies and other services expense increased by $575,535 or 4.64% to $12,975,608.
Utilities expense increased by $50,214 or 2.00% to $2,561,676. Electricity expenses increased while
decreases were recognized in gas, water, and sewage expenses. Scholarships expense increased by $33,707 or 0.49% to $6,973,921. Scholarships and fellowships
increased by $157,215 before scholarship allowance.
Depreciation expense decreased by $44,154 or 1.12% to $3,892,198 and was 6.38% of total operating expenses.
17
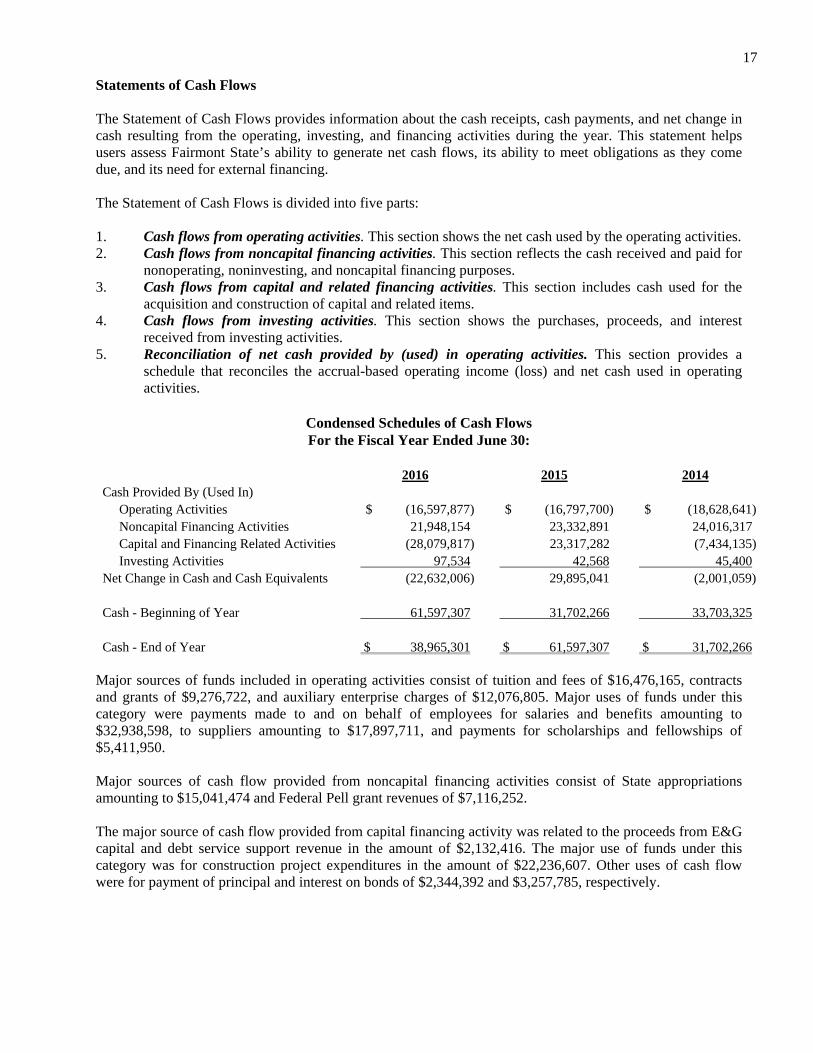
Statements of Cash Flows The Statement of Cash Flows provides information about the cash receipts, cash payments, and net change in cash resulting from the operating, investing, and financing activities during the year. This statement helps users assess Fairmont State’s ability to generate net cash flows, its ability to meet obligations as they come due, and its need for external financing. The Statement of Cash Flows is divided into five parts: 1. Cash flows from operating activities. This section shows the net cash used by the operating activities. 2. Cash flows from noncapital financing activities. This section reflects the cash received and paid for
nonoperating, noninvesting, and noncapital financing purposes. 3. Cash flows from capital and related financing activities. This section includes cash used for the
acquisition and construction of capital and related items. 4. Cash flows from investing activities. This section shows the purchases, proceeds, and interest
received from investing activities. 5. Reconciliation of net cash provided by (used) in operating activities. This section provides a
schedule that reconciles the accrual-based operating income (loss) and net cash used in operating activities.
Condensed Schedules of Cash Flows For the Fiscal Year Ended June 30:
2016 2015 2014
Cash Provided By (Used In) Operating Activities $ (16,597,877) $ (16,797,700) $ (18,628,641) Noncapital Financing Activities 21,948,154 23,332,891 24,016,317 Capital and Financing Related Activities (28,079,817) 23,317,282 (7,434,135) Investing Activities 97,534 42,568 45,400 Net Change in Cash and Cash Equivalents (22,632,006) 29,895,041 (2,001,059)
Cash - Beginning of Year 61,597,307 31,702,266 33,703,325
Cash - End of Year $ 38,965,301 $ 61,597,307 $ 31,702,266
Major sources of funds included in operating activities consist of tuition and fees of $16,476,165, contracts and grants of $9,276,722, and auxiliary enterprise charges of $12,076,805. Major uses of funds under this category were payments made to and on behalf of employees for salaries and benefits amounting to $32,938,598, to suppliers amounting to $17,897,711, and payments for scholarships and fellowships of $5,411,950. Major sources of cash flow provided from noncapital financing activities consist of State appropriations amounting to $15,041,474 and Federal Pell grant revenues of $7,116,252. The major source of cash flow provided from capital financing activity was related to the proceeds from E&G capital and debt service support revenue in the amount of $2,132,416. The major use of funds under this category was for construction project expenditures in the amount of $22,236,607. Other uses of cash flow were for payment of principal and interest on bonds of $2,344,392 and $3,257,785, respectively.
18
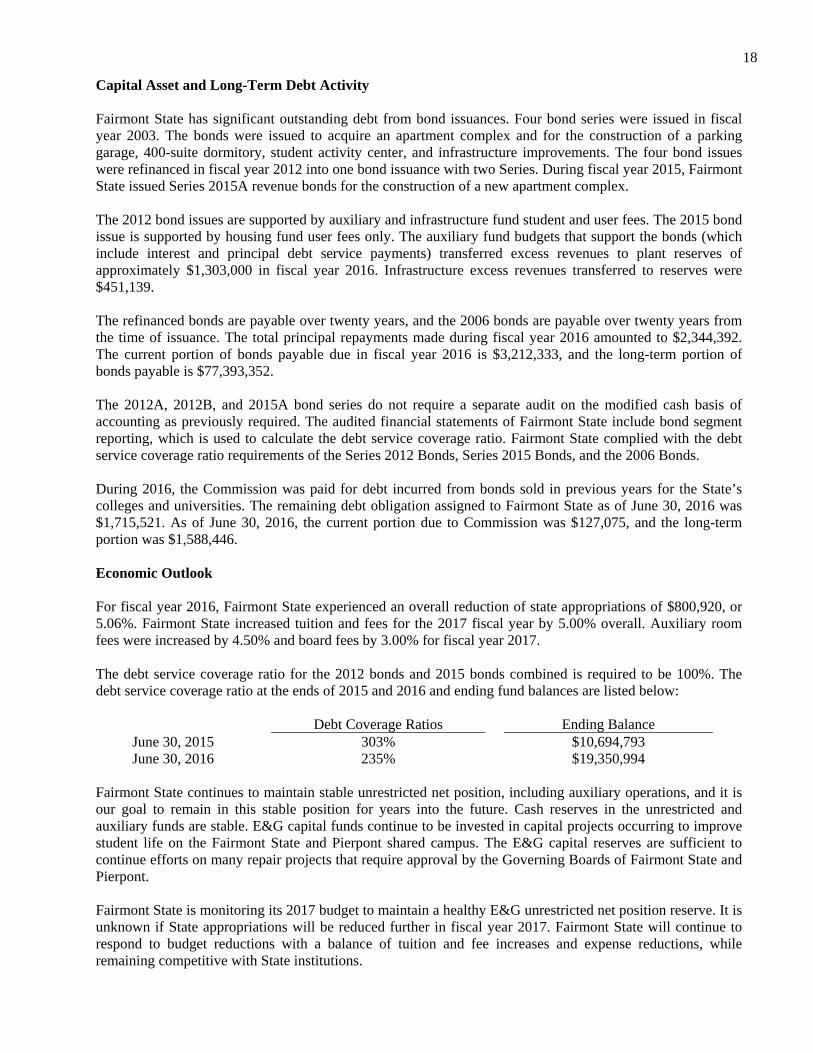
Capital Asset and Long-Term Debt Activity Fairmont State has significant outstanding debt from bond issuances. Four bond series were issued in fiscal year 2003. The bonds were issued to acquire an apartment complex and for the construction of a parking garage, 400-suite dormitory, student activity center, and infrastructure improvements. The four bond issues were refinanced in fiscal year 2012 into one bond issuance with two Series. During fiscal year 2015, Fairmont State issued Series 2015A revenue bonds for the construction of a new apartment complex. The 2012 bond issues are supported by auxiliary and infrastructure fund student and user fees. The 2015 bond issue is supported by housing fund user fees only. The auxiliary fund budgets that support the bonds (which include interest and principal debt service payments) transferred excess revenues to plant reserves of approximately $1,303,000 in fiscal year 2016. Infrastructure excess revenues transferred to reserves were $451,139. The refinanced bonds are payable over twenty years, and the 2006 bonds are payable over twenty years from the time of issuance. The total principal repayments made during fiscal year 2016 amounted to $2,344,392. The current portion of bonds payable due in fiscal year 2016 is $3,212,333, and the long-term portion of bonds payable is $77,393,352. The 2012A, 2012B, and 2015A bond series do not require a separate audit on the modified cash basis of accounting as previously required. The audited financial statements of Fairmont State include bond segment reporting, which is used to calculate the debt service coverage ratio. Fairmont State complied with the debt service coverage ratio requirements of the Series 2012 Bonds, Series 2015 Bonds, and the 2006 Bonds. During 2016, the Commission was paid for debt incurred from bonds sold in previous years for the State’s colleges and universities. The remaining debt obligation assigned to Fairmont State as of June 30, 2016 was $1,715,521. As of June 30, 2016, the current portion due to Commission was $127,075, and the long-term portion was $1,588,446. Economic Outlook For fiscal year 2016, Fairmont State experienced an overall reduction of state appropriations of $800,920, or 5.06%. Fairmont State increased tuition and fees for the 2017 fiscal year by 5.00% overall. Auxiliary room fees were increased by 4.50% and board fees by 3.00% for fiscal year 2017. The debt service coverage ratio for the 2012 bonds and 2015 bonds combined is required to be 100%. The debt service coverage ratio at the ends of 2015 and 2016 and ending fund balances are listed below:
Debt Coverage Ratios Ending Balance June 30, 2015 303% $10,694,793 June 30, 2016 235% $19,350,994
Fairmont State continues to maintain stable unrestricted net position, including auxiliary operations, and it is our goal to remain in this stable position for years into the future. Cash reserves in the unrestricted and auxiliary funds are stable. E&G capital funds continue to be invested in capital projects occurring to improve student life on the Fairmont State and Pierpont shared campus. The E&G capital reserves are sufficient to continue efforts on many repair projects that require approval by the Governing Boards of Fairmont State and Pierpont. Fairmont State is monitoring its 2017 budget to maintain a healthy E&G unrestricted net position reserve. It is unknown if State appropriations will be reduced further in fiscal year 2017. Fairmont State will continue to respond to budget reductions with a balance of tuition and fee increases and expense reductions, while remaining competitive with State institutions.

19
In fiscal year 2016, the enrollment of Fairmont State decreased by 13 or 0.004% in headcount and decreased by 11 or 0.003% in full-time equivalents. Also in fiscal year 2016, Pierpont enrollment decreased by 130 or 5.63% in headcount and decreased by 101 or 6.26% in full-time equivalents. While Fairmont State’s enrollment has recovered slightly, the decrease in Pierpont’s enrollment created a loss of revenue for the shared campus auxiliary enterprise operations and shared E&G capital funds available for repairs and replacement activity. In response to these losses, there have been reductions to operating budgets in the 2017 fiscal year to ensure maintaining a stable net position at the end of fiscal year 2017. As mentioned above, the E&G Operating Fund, Auxiliary Fund, and E&G Capital Fund have sufficient reserves to support the institution during this time of recovering enrollments and reductions in state funding. The net position values before and after the OPEB liability can be found on pages 47 - 48 of this report. It is important to again recognize that the OPEB liability, while recorded on Fairmont State’s financial statements, will be taken care of by the State and will not be a future payout of real dollars from the University funds. Therefore, the true Unrestricted Fund net position is before OPEB liability. This places Fairmont State with unrestricted reserves of $18,389,167 at the end of fiscal year 2016. The net position amount is broken down as follows:
Unrestricted Designated for Auxiliaries $ 9,259,125 Unrestricted for Fund Managers 1,894,768 Unrestricted Undesignated 7,235,274 Total Unrestricted $ 18,389,167

[This page intentionally left blank]

FAIRMONT STATE UNIVERSITY 20
STATEMENTS OF NET POSITIONJUNE 30, 2016 AND 2015
2016 2015
ASSETS AND DEFERRED OUTFLOWS
CURRENT ASSETS:Cash and cash equivalents 35,463,889$ 30,986,331$ Accounts receivable — net 1,193,253 751,639 Due from Pierpont for debt service — current portion 242,227 217,700 Loans to students — current portion 174,758 244,880 Inventories 162,895 166,364 Other current assets 20,448 47,219
Total current assets 37,257,470 32,414,133
NONCURRENT ASSETS:Cash and cash equivalents 3,501,412 30,610,976 Loans to students — net of allowance of
$183,650 and $205,777, respectively 638,527 772,576 Due from Pierpont for debt service 3,201,464 3,466,337 Other noncurrent assets 380,285 439,484 Capital assets — net 136,822,600 112,493,053
Total noncurrent assets 144,544,288 147,782,426
DEFERRED OUTFLOWS OF RESOURCES:Employer pension contributions 93,303 148,605 Deferred loss on refunding 1,121,720 1,191,948
Total deferred outflows of resources 1,215,023 1,340,553
TOTAL 183,016,781$ 181,537,112$
(Continued)
The Accompanying Notes Are An IntegralPart Of These Financial Statements.

FAIRMONT STATE UNIVERSITY 21
STATEMENTS OF NET POSITIONJUNE 30, 2016 AND 2015
2016 2015LIABILITIES, DEFERRED INFLOWS, AND NET POSITION
CURRENT LIABILITIES:Accounts payable 4,022,211$ 1,796,124$ Due to Pierpont 13,827 167,052 Due to the Commission 31,473 9,237 Accrued liabilities — payroll 3,610,549 3,599,243 Accrued interest payable 246,646 291,039 Retainages payable 2,485,272 74,533 Unearned revenue and deposits 1,868,845 1,627,683 Compensated absences — current portion 857,520 834,760 Capital leases — current portion 40,417 39,977 Debt obligation to the Commission — current portion 127,075 120,287 Bonds payable — current portion 3,212,333 2,484,353 Other current liabilities 85,000 160,000
Total current liabilities 16,601,168 11,204,288
NONCURRENT LIABILITIES:Other postemployment benefits liability 9,966,056 9,384,887 Compensated absences 433,475 394,554 Advances from federal sponsors 1,062,748 1,154,967 Capital leases 13,571 53,988 Debt obligation due to the Commission 1,588,446 1,709,342 Bonds payable 77,393,352 80,605,685 Net pension liability 1,132,445 1,381,799 Other noncurrent liabilities 106,779 836,712
Total noncurrent liabilities 91,696,872 95,521,934
DEFERRED INFLOWS OF RESOURCES: Differences between expected and actual experience 9,805 - Changes in proportion and differences in pension contributions 299,981 89,328 Net difference between projected and actual earnings on pension plan investments 47,796 182,662
Total deferred inflows of resources 357,582 271,990
NET POSITION:Net investment in capital assets 62,083,700 60,686,061
Restricted for — expendable:Loans 131,548 142,966 Scholarships 6,625 26,813 Capital projects 3,712,363 4,136,342 Debt service 3,812 1,318,703
Total restricted 3,854,348 5,624,824
Unrestricted 8,423,111 8,228,015
Total net position 74,361,159 74,538,900
TOTAL 183,016,781$ 181,537,112$
(Concluded)
The Accompanying Notes Are An IntegralPart Of These Financial Statements.

FAIRMONT STATE UNIVERSITY 22
STATEMENTS OF REVENUES, EXPENSES, AND CHANGES IN NET POSITION
YEARS ENDED JUNE 30, 2016 AND 2015
2016 2015
OPERATING REVENUES: Student tuition and fees — net of scholarship allowance of $11,361,528 and $11,238,020 in 2016 and 2015, respectively 13,879,414$ 11,950,649$ Student activity support revenue 57,386 120,383 Auxiliary enterprise revenue 12,190,788 11,575,708 Auxiliary support services revenue 671,754 732,807 Contracts and grants: Federal 1,035,589 1,117,407 State 6,362,078 6,471,179 Private 1,952,834 1,671,171 Interest on student loans receivable 35,179 37,740 Faculty services revenue 409,893 554,985 Operating costs revenue 1,681,195 1,961,657 Support services revenue 1,815,814 2,426,549 Miscellaneous — net 655,761 637,557
Total operating revenues 40,747,685 39,257,792
OPERATING EXPENSES: Salaries and wages 26,566,446 26,780,653 Benefits 6,666,900 8,536,848 Supplies and other services 12,975,608 12,400,073 Utilities 2,561,676 2,511,462 Student financial aid — scholarships and fellowships 6,973,921 6,940,214 Depreciation 3,892,198 3,936,352 Assessment for faculty services 520,245 541,325 Assessment for operating costs 83,636 87,466 Assessment for support services 209,769 391,539 Loan cancellations and write-offs 385,459 380,741 Fees assessed by the Commission for operations 171,873 179,875
Total operating expenses 61,007,731 62,686,548
OPERATING LOSS (20,260,046) (23,428,756)
(Continued)
The Accompanying Notes Are An Integral Part Of These Financial Statements.
FAIRMONT STATE UNIVERSITY 23
STATEMENTS OF REVENUES, EXPENSES, AND CHANGES IN NET POSITIONYEARS ENDED JUNE 30, 2016 AND 2015
2016 2015
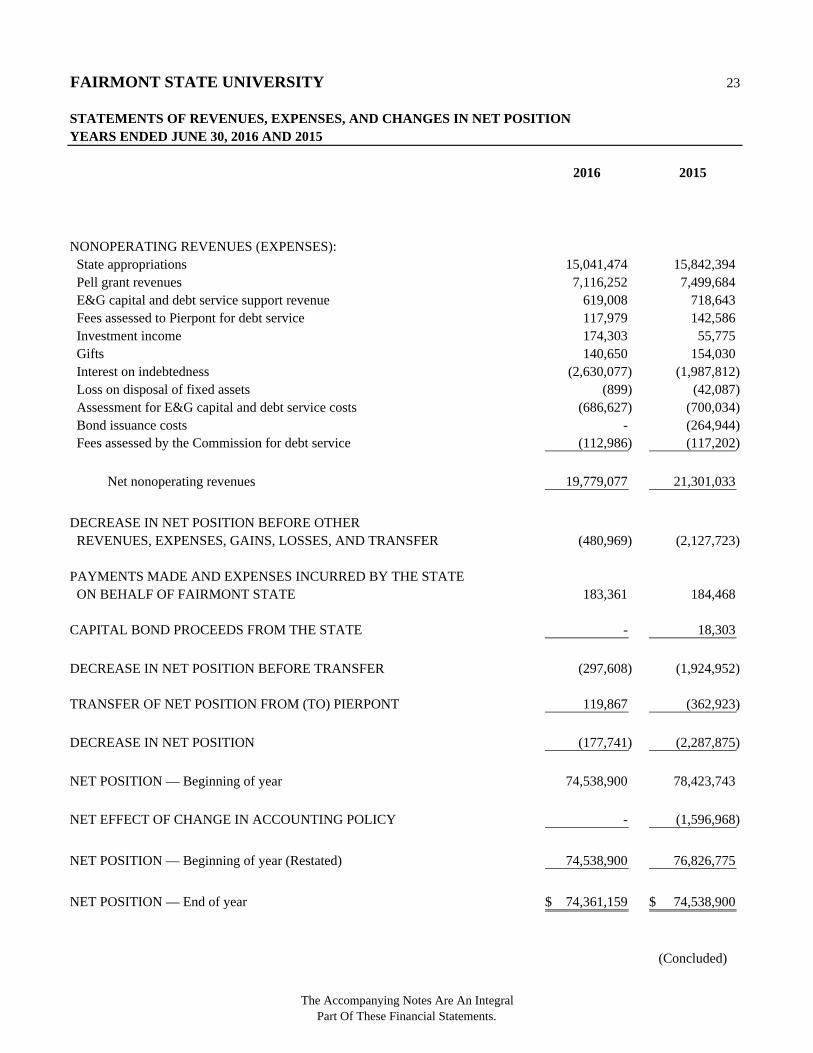
NONOPERATING REVENUES (EXPENSES): State appropriations 15,041,474 15,842,394 Pell grant revenues 7,116,252 7,499,684 E&G capital and debt service support revenue 619,008 718,643 Fees assessed to Pierpont for debt service 117,979 142,586 Investment income 174,303 55,775 Gifts 140,650 154,030 Interest on indebtedness (2,630,077) (1,987,812) Loss on disposal of fixed assets (899) (42,087) Assessment for E&G capital and debt service costs (686,627) (700,034) Bond issuance costs - (264,944) Fees assessed by the Commission for debt service (112,986) (117,202)
Net nonoperating revenues 19,779,077 21,301,033
DECREASE IN NET POSITION BEFORE OTHER REVENUES, EXPENSES, GAINS, LOSSES, AND TRANSFER (480,969) (2,127,723)
PAYMENTS MADE AND EXPENSES INCURRED BY THE STATE ON BEHALF OF FAIRMONT STATE 183,361 184,468
CAPITAL BOND PROCEEDS FROM THE STATE - 18,303
DECREASE IN NET POSITION BEFORE TRANSFER (297,608) (1,924,952)
TRANSFER OF NET POSITION FROM (TO) PIERPONT 119,867 (362,923)
DECREASE IN NET POSITION (177,741) (2,287,875)
NET POSITION — Beginning of year 74,538,900 78,423,743
NET EFFECT OF CHANGE IN ACCOUNTING POLICY - (1,596,968)
NET POSITION — Beginning of year (Restated) 74,538,900 76,826,775
NET POSITION — End of year 74,361,159$ 74,538,900$
(Concluded)
The Accompanying Notes Are An IntegralPart Of These Financial Statements.

FAIRMONT STATE UNIVERSITY 24
STATEMENTS OF CASH FLOWS
YEARS ENDED JUNE 30, 2016 AND 2015
2016 2015
CASH FLOWS FROM OPERATING ACTIVITIES: Student tuition and fees 16,476,165$ 10,167,166$ Contracts and grants 9,276,722 9,347,744 Payments to and on behalf of employees (32,938,598) (33,116,906) Payments to suppliers (17,897,711) (16,503,393) Payments to utilities (2,643,222) (2,421,710) Payments for scholarships and fellowships (5,411,950) (5,252,717) Loans issued to students 146,746 (3,851) Interest on student loans receivable 17,910 17,821 Federal government advances (66,656) - Auxiliary enterprise charges 12,076,805 11,464,359 Fees assessed by the Commission (171,873) (179,875) Other receipts — net 821,780 4,813,048 Student activity support revenue 57,386 132,974 Auxiliary fees and debt service support revenue 671,754 813,437 Assessment for support services (197,460) (396,014) Support services revenue 1,683,372 2,426,507 Faculty services revenue 409,893 554,985 Assessment for faculty services (520,245) (541,325) Operating support services revenue 1,694,212 1,975,340 Assessment for operating cost (82,907) (95,290)
Net cash used in operating activities (16,597,877) (16,797,700)
CASH FLOWS FROM NONCAPITAL FINANCING ACTIVITIES: State appropriations 15,041,474 16,019,946 Pell grant revenues 7,116,252 7,499,684 Gift receipts 140,650 131,569 William D. Ford direct lending receipts 18,783,424 18,552,545 William D. Ford direct lending payments (18,784,990) (18,544,832) Transfers from Pierpont 16,588 23,666 Transfers to Pierpont (365,244) (349,687)
Net cash provided by noncapital financing activities 21,948,154 23,332,891
CASH FLOWS FROM CAPITAL FINANCING ACTIVITIES: Proceeds from bond issuance - 30,583,173 Capital bond proceeds from State - 791,181 E&G capital and debt service support revenue 2,132,416 1,275,285 Payments from Pierpont on debt obligation 354,123 - Fees assessed by the Commission (112,986) (117,202) Purchases of capital assets (22,236,607) (3,511,348) Purchases of equipment (317,991) (562,806) Principal paid on leases (39,977) (137,243) Interest paid on leases (829) (4,035) Assessment for E&G capital and debt service costs (2,200,035) (700,033) Payments to the Commission on debt obligation (120,722) - Principal paid on bonds (2,344,392) (2,170,295) Interest paid on bonds (3,257,785) (1,877,804) Payment for bond issue costs - (264,943) Bond interest income 64,968 13,352
Net cash (used in) provided by capital financing activities (28,079,817) 23,317,282
(Continued)
The Accompanying Notes Are An Integral Part Of These Financial Statements.

FAIRMONT STATE UNIVERSITY 25
STATEMENTS OF CASH FLOWS
YEARS ENDED JUNE 30, 2016 AND 2015
2016 2015
CASH FLOW FROM INVESTING ACTIVITY — Interest on investments 97,534 42,568
(DECREASE) INCREASE IN CASH AND CASH EQUIVALENTS (22,632,006) 29,895,041
CASH AND CASH EQUIVALENTS — Beginning of year 61,597,307 31,702,266
CASH AND CASH EQUIVALENTS — End of year 38,965,301$ 61,597,307$
RECONCILIATION OF NET OPERATING LOSS TO NET CASH USED IN OPERATING ACTIVITIES:
Operating loss (20,260,046)$ (23,428,756)$ Adjustments to reconcile net operating loss to net cash used in operating activities:
Depreciation expense 3,892,198 3,936,352 Pension expense — special funding situation 183,361 184,468 Net effect of change in accounting policy - (1,596,968)
Changes in assets, deferred outflows of resources, liabilities, and deferred inflows of resources:Receivables — net (407,083) (108,182) Loans to students — net 204,172 48,997 Inventories 3,469 (1,898) Deferred outflows of resources 55,302 (148,605) Other assets 47,219 49,483 Advances from federal sponsors (92,219) (27,598) Accounts payable (314,377) 160,910 Accrued liabilities — payroll 17,505 1,381,259 Accrued liabilities — other (647,626) 581,937 Compensated absences 61,681 11,441 Other postemployment benefits liability 581,167 502,873 Net pension liability (249,354) 1,381,799 Deferred inflows of resources 85,592 271,990 Unearned revenue 36,576 (470,100) Undistributed receipts (disbursements) — deposits 204,586 472,898
NET CASH USED IN OPERATING ACTIVITIES (16,597,877)$ (16,797,700)$
NONCASH TRANSACTIONS:Construction in progress additions in accounts payable 3,160,519$ 670,791$
Construction in progress additions in retainages payable 113,103$ 74,533$
Transfer to Pierpont (exclusive of $16,587 and $273,247 of cash in 2016 and 2015, respectively) 135,369$ 21,800$
RECONCILIATION OF CASH AND CASH EQUIVALENTS TO THE STATEMENTS OF NET POSITION:
Cash and cash equivalents classified as current 35,463,889$ 30,986,331$ Cash and cash equivalents classified as noncurrent 3,501,412 30,610,976
38,965,301$ 61,597,307$
(Concluded)
The Accompanying Notes Are An Integral Part Of These Financial Statements.

FAIRMONT STATE UNIVERSITY NOTES TO FINANCIAL STATEMENTS YEARS ENDED JUNE 30, 2016 AND 2015
26
1. ORGANIZATION
Fairmont State University (Fairmont State or Fairmont) is governed by the Fairmont State University Board of Governors (the Board). The Board was established by Senate Bill (S.B.) 653, which was enacted by the West Virginia State Legislature (the Legislature) on March 19, 2000 and restructured higher education in West Virginia.
The Board’s powers and duties include, but are not limited to, the power to determine, control, supervise, and manage the financial, business, and educational policies and affairs of Fairmont State under its jurisdiction; the duty to develop a master plan for Fairmont State; the power to prescribe the specific functions and Fairmont State’s budget request; the duty to review, at least every five years, all academic programs offered at Fairmont State; and the power to fix tuition and other fees for the different classes or categories of students enrolled at Fairmont State.
S.B. 653 also created the West Virginia Higher Education Policy Commission (the Commission), which is responsible for developing, gaining consensus around, and overseeing the implementation and development of a higher education public policy agenda.
2. SUMMARY OF SIGNIFICANT ACCOUNTING POLICIES
The financial statements of Fairmont State have been prepared in accordance with generally accepted accounting principles as prescribed by Governmental Accounting Standards Board standards (GASB). The financial statement presentation required by GASB provides a comprehensive, entity-wide perspective of Fairmont State’s assets, deferred outflows of resources, liabilities, deferred inflows of resources, net position, revenues, expenses, changes in net position, and cash flows.
Reporting Entity - Fairmont State is an operating unit of the West Virginia Higher Education Fund and represents separate funds of the State of West Virginia (the State) that are not included in the State’s general fund. Fairmont State is a separate entity that, along with all State institutions of higher education and the Commission (which includes the West Virginia Network for Educational Telecomputing), forms the Higher Education Fund of the State. The Higher Education Fund is considered a component unit of the State, and its financial statements are discretely presented in the State’s comprehensive annual financial report.
The accompanying financial statements present all funds under the authority of Fairmont State. The basic criterion for inclusion in the accompanying financial statements is the exercise of oversight responsibility derived from Fairmont State’s ability to significantly influence operations and accountability for fiscal matters of related entities. Fairmont State Foundation, Inc. (the Foundation) and the Fairmont State Alumni Association (the Association) are not part of Fairmont State’s reporting entity and are not included in the accompanying financial statements since Fairmont State has no ability to designate management, cannot significantly influence operations, and is not accountable for the fiscal matters of the Foundation or the Association under GASB.

FAIRMONT STATE UNIVERSITY NOTES TO FINANCIAL STATEMENTS YEARS ENDED JUNE 30, 2016 AND 2015
27
2. SUMMARY OF SIGNIFICANT ACCOUNTING POLICIES (CONTINUED)
Financial Statement Presentation - GASB establishes standards for external financial reporting for public colleges and universities and requires that financial statements be presented on a combined basis to focus on Fairmont State as a whole. Net position is classified into four categories according to external donor restrictions or availability of assets for satisfaction of Fairmont State’s obligations. Fairmont State’s net position is classified as follows:
Net investment in capital assets - This represents Fairmont State’s total investment in capital assets, net of depreciation and outstanding debt obligations related to those capital assets. To the extent that debt has been incurred but not yet expended for capital assets, such amounts are not included as a component of net investment in capital assets.
Restricted net position - expendable - This includes assets for which Fairmont State is legally or contractually obligated to spend resources in accordance with restrictions imposed by external third parties.
The Legislature, as a regulatory body outside the reporting entity, has restricted the use of certain funds by Article 10, Fees and Other Money Collected at State Institutions of Higher Education of the West Virginia State Code. House Bill 101, passed in March 2004, simplified the tuition and fee restrictions to auxiliaries and capital items. These activities are fundamental to the normal ongoing operations of the institution. These restrictions are subject to change by future actions of the Legislature.
Restricted net position - nonexpendable - This includes endowment and similar-type funds in which donors or other outside sources have stipulated, as a condition of the gift instrument, that the principal is to be maintained inviolate and in perpetuity and invested for the purpose of producing present and future income, which may either be expended or added to principal. Fairmont State does not have any restricted nonexpendable net position at June 30, 2016 and 2015.
Unrestricted net position - Unrestricted net position represents resources derived from student tuition and fees, state appropriations, and sales and services of educational activities. These resources are used for transactions relating to the educational and general operations of Fairmont State and may be used at the discretion of the Board to meet current expenses for any purpose.
Basis of Accounting - For financial reporting purposes, Fairmont State is considered a special-purpose government engaged in only business-type activities. Accordingly, Fairmont State’s financial statements have been prepared on the accrual basis of accounting, with a focus on the flow of economic resources measurement. Revenues are reported when earned, and expenses are incurred when goods or services are received. All intercompany accounts and transactions have been eliminated.
Cash and Cash Equivalents - For purposes of the statements of net position, Fairmont State considers all highly liquid investments with an original maturity of three months or less to be cash equivalents.

FAIRMONT STATE UNIVERSITY NOTES TO FINANCIAL STATEMENTS YEARS ENDED JUNE 30, 2016 AND 2015
28
2. SUMMARY OF SIGNIFICANT ACCOUNTING POLICIES (CONTINUED)
Cash and cash equivalents balances on deposit with the State of West Virginia Treasurer’s Office (the State Treasurer) are pooled by the State Treasurer with other available funds of the State for investment purposes by the West Virginia Board of Treasury Investments (BTI). These funds were transferred to the BTI, and the BTI is directed by the State Treasurer to invest the funds in specific external investment pools in accordance with West Virginia State Code, policies set by the BTI, provisions of bond indentures, and provisions of trust agreements, when applicable. Balances in the investment pools are recorded at fair value or amortized cost, which approximates fair value. Fair value is determined by a third-party pricing service based on asset portfolio pricing models and other sources in accordance with GASB. The BTI was established by the West Virginia State Legislature and is subject to oversight by the West Virginia State Legislature. Fair value and investment income are allocated to participants in the pools based upon the funds that have been invested. The amounts on deposit are available for immediate withdrawal or on the first day of each month for the WV Short Term Bond Pool and accordingly are presented as cash and cash equivalents in the accompanying financial statements.
The BTI maintains the Consolidated Fund investment fund, which consists of eight investment pools and participant-directed accounts, three of which Fairmont State may invest in. These pools have been structured as multiparticipant variable net asset funds to reduce risk and offer investment liquidity diversification to the fund participants. Funds not required to meet immediate disbursement needs are invested for longer periods. A more detailed discussion of the BTI’s investment operations pool can be found in its annual audited financial report. A copy of that annual report can be obtained from the following address: 1900 Kanawha Blvd., E. Room E-122, Charleston, West Virginia 25305 or http://www.wvbti.com.
Permissible investments for all agencies include those guaranteed by the United States of America, its agencies, and its instrumentalities (U.S. government obligations); corporate debt obligations, including commercial paper, which meet certain ratings; certain money market funds; repurchase agreements; reverse repurchase agreements; asset-backed securities; certificates of deposit; state and local government securities; and other investments. Other investments consist primarily of investments in accordance with the Linked Deposit Program, a program using financial institutions in West Virginia to obtain certificates of deposit, loans approved by the Legislature, and any other program investments authorized by the Legislature.
Appropriations Due from Primary Government - For financial reporting purposes, appropriations due from the State are presented separate from cash and cash equivalents, as amounts are not specific deposits with the State Treasurer but are obligations of the State.
Allowance for Doubtful Accounts - It is Fairmont State’s policy to provide for future losses on uncollectible accounts, contracts, grants, and loans receivable based on an evaluation of the underlying account, contract, grant, and loan balances; the historical collectability experienced by Fairmont State on such balances; and such other factors that, in Fairmont State’s judgment, require consideration in estimating doubtful accounts.
Inventories - Inventories are stated at the lower of cost or market, cost being determined on the first-in, first-out method.
FAIRMONT STATE UNIVERSITY NOTES TO FINANCIAL STATEMENTS YEARS ENDED JUNE 30, 2016 AND 2015
29
2. SUMMARY OF SIGNIFICANT ACCOUNTING POLICIES (CONTINUED)
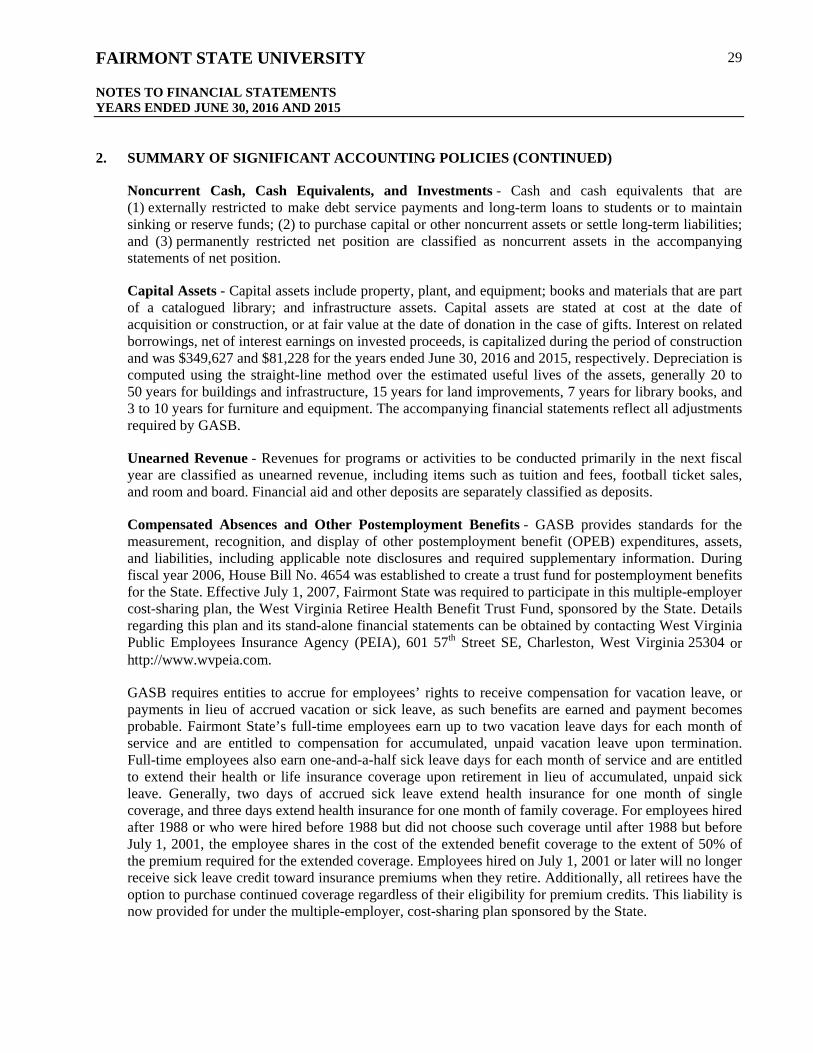
Noncurrent Cash, Cash Equivalents, and Investments - Cash and cash equivalents that are (1) externally restricted to make debt service payments and long-term loans to students or to maintain sinking or reserve funds; (2) to purchase capital or other noncurrent assets or settle long-term liabilities; and (3) permanently restricted net position are classified as noncurrent assets in the accompanying statements of net position.
Capital Assets - Capital assets include property, plant, and equipment; books and materials that are part of a catalogued library; and infrastructure assets. Capital assets are stated at cost at the date of acquisition or construction, or at fair value at the date of donation in the case of gifts. Interest on related borrowings, net of interest earnings on invested proceeds, is capitalized during the period of construction and was $349,627 and $81,228 for the years ended June 30, 2016 and 2015, respectively. Depreciation is computed using the straight-line method over the estimated useful lives of the assets, generally 20 to 50 years for buildings and infrastructure, 15 years for land improvements, 7 years for library books, and 3 to 10 years for furniture and equipment. The accompanying financial statements reflect all adjustments required by GASB.
Unearned Revenue - Revenues for programs or activities to be conducted primarily in the next fiscal year are classified as unearned revenue, including items such as tuition and fees, football ticket sales, and room and board. Financial aid and other deposits are separately classified as deposits.
Compensated Absences and Other Postemployment Benefits - GASB provides standards for the measurement, recognition, and display of other postemployment benefit (OPEB) expenditures, assets, and liabilities, including applicable note disclosures and required supplementary information. During fiscal year 2006, House Bill No. 4654 was established to create a trust fund for postemployment benefits for the State. Effective July 1, 2007, Fairmont State was required to participate in this multiple-employer cost-sharing plan, the West Virginia Retiree Health Benefit Trust Fund, sponsored by the State. Details regarding this plan and its stand-alone financial statements can be obtained by contacting West Virginia Public Employees Insurance Agency (PEIA), 601 57th Street SE, Charleston, West Virginia 25304 or http://www.wvpeia.com.
GASB requires entities to accrue for employees’ rights to receive compensation for vacation leave, or payments in lieu of accrued vacation or sick leave, as such benefits are earned and payment becomes probable. Fairmont State’s full-time employees earn up to two vacation leave days for each month of service and are entitled to compensation for accumulated, unpaid vacation leave upon termination. Full-time employees also earn one-and-a-half sick leave days for each month of service and are entitled to extend their health or life insurance coverage upon retirement in lieu of accumulated, unpaid sick leave. Generally, two days of accrued sick leave extend health insurance for one month of single coverage, and three days extend health insurance for one month of family coverage. For employees hired after 1988 or who were hired before 1988 but did not choose such coverage until after 1988 but before July 1, 2001, the employee shares in the cost of the extended benefit coverage to the extent of 50% of the premium required for the extended coverage. Employees hired on July 1, 2001 or later will no longer receive sick leave credit toward insurance premiums when they retire. Additionally, all retirees have the option to purchase continued coverage regardless of their eligibility for premium credits. This liability is now provided for under the multiple-employer, cost-sharing plan sponsored by the State.

FAIRMONT STATE UNIVERSITY NOTES TO FINANCIAL STATEMENTS YEARS ENDED JUNE 30, 2016 AND 2015
30
2. SUMMARY OF SIGNIFICANT ACCOUNTING POLICIES (CONTINUED)
Certain faculty employees (generally those with less than a 12-month contract) earn a similar extended health or life insurance coverage retirement benefit based on years of service. Generally, 3 1/3 years of teaching service extend health insurance for one year of single coverage, and five years extend health insurance for one year of family coverage. The same hire date mentioned above applies to coverage for faculty employees also. Faculty hired after July 1, 2009 will no longer receive years of service credit toward insurance premiums when they retire. Employees hired after July 1, 2010 receive no health insurance premium subsidy from Fairmont State. Two groups of employees hired after July 1, 2010 will not be required to pay the unsubsidized rate: 1) active employees who were originally hired before July 1, 2010 who have a break in service of fewer than two years after July 1, 2010; and 2) retired employees who retired before July 1, 2010, return to active service after July 1, 2010, and then go back into retirement. In those cases, the original hire date will apply.
The estimated expense and expense incurred for the vacation leave or OPEB benefits are recorded as a component of benefits expense in the statements of revenues, expenses, and changes in net position.
Net Pension Liability - For purposes of measuring the net pension liability, deferred outflows of resources and deferred inflows of resources related to pensions, and pension expense, information about the fiduciary net position of the West Virginia Teachers’ Retirement System (STRS), administered by the West Virginia Consolidated Public Retirement Board (CPRB), and additions to/reductions from the STRS fiduciary net position have been determined on the same basis as they are reported in the STRS financial statements, which can be found at https://www.wvretirement.com/Publications.html#CAFR. The plan schedules of STRS are prepared using the accrual basis of accounting and economic resources measurement focus in accordance with U.S. GAAP as prescribed by GASB. Employer contributions are recognized when due and when the employer has a legal requirement to provide the contributions. Investments are reported at fair value. Detailed information on investment valuation can be found in the STRS financial statements. Management of STRS has made certain estimates and assumptions relating to employer allocation schedules, and actual results could differ (see note 12). Deferred Outflows of Resources - Consumption of net position by Fairmont State that is applicable to a future fiscal year is reported as a deferred outflow of resources on the statement of net position. Deferred Inflows of Resources - An acquisition of net position by Fairmont State that is applicable to a future fiscal year is reported as a deferred inflow of resources on the statement of net position.
Risk Management - The State’s Board of Risk and Insurance Management (BRIM) provides general, property, and casualty liability coverage to Fairmont State and its employees. Such coverage may be provided to Fairmont State by BRIM through self-insurance programs maintained by BRIM or policies underwritten by BRIM that may involve experience-related premiums or adjustments to BRIM.
BRIM engages an independent actuary to assist in the determination of its premiums so as to minimize the likelihood of premium adjustments to Fairmont State or other participants in BRIM’s insurance programs. As a result, management does not expect significant differences between the premiums Fairmont State is currently charged by BRIM and the ultimate cost of that insurance based on Fairmont State’s actual loss experience. In the event that such differences arise between estimated premiums currently charged by BRIM to Fairmont State and Fairmont State’s ultimate actual loss experience, the difference will be recorded as the change in estimate becomes known.

FAIRMONT STATE UNIVERSITY NOTES TO FINANCIAL STATEMENTS YEARS ENDED JUNE 30, 2016 AND 2015
31
2. SUMMARY OF SIGNIFICANT ACCOUNTING POLICIES (CONTINUED)
In addition, through its participation in PEIA and a third-party insurer, Fairmont State has obtained health insurance, life insurance, prescription drug coverage, and coverage for job-related injuries for its employees. In exchange for payment of premiums to PEIA and the third-party insurer, Fairmont State has transferred its risks related to health insurance, life insurance, prescription drug coverage, and job-related injuries coverage.
West Virginia has a single private insurance company, BrickStreet Insurance, which provides workers’ compensation coverage to all employers in the state. Other private insurance companies began to offer coverage to the private-sector employers beginning July 1, 2009 and began to offer to government employers July 1, 2010. Nearly every employer in the State, who has a payroll must have coverage. The cost of all coverage is paid by the employers. BrickStreet retains the risk related to the compensation of injured employees under the program. Classification of Revenues - Fairmont State has classified its revenues according to the following criteria:
Operating revenues - Operating revenues include activities that have the characteristics of exchange transactions, such as (1) student tuition and fees, net of scholarship discounts and allowances; (2) sales and services of auxiliary enterprises, net of scholarship discounts and allowances; (3) most federal, state, local, and nongovernmental grants and contracts; and (4) sales and services of educational activities.
Nonoperating revenues - Nonoperating revenues include activities that have the characteristics of nonexchange transactions, such as gifts and contributions, and other revenues that are defined as nonoperating revenues by GASB, such as state appropriations, Federal Pell grants, investment income, and sale of capital assets (including natural resources).
Other revenues - Other revenues consist primarily of capital grants and gifts.
Use of Restricted Net Position - Fairmont State has not adopted a formal policy regarding whether to first apply restricted or unrestricted resources when an expense is incurred for purposes for which both restricted and unrestricted net position are available. Generally, Fairmont State attempts to utilize restricted net position first when practicable.
Federal Financial Assistance Programs - Fairmont State makes loans to students under the Federal Direct Student Loan Program. Under this program, the U.S. Department of Education makes interest-subsidized and nonsubsidized loans directly to students through universities such as Fairmont State. Direct student loan receivables are not included in Fairmont State’s statements of net position as the loans are repayable directly to the U.S. Department of Education. In 2016 and 2015, Fairmont State received and disbursed approximately $18.8 million and $18.5 million, respectively, under the Federal Direct Student Loan Program on behalf of the U.S. Department of Education, which is not included as revenue and expense in the statements of revenues, expenses, and changes in net position.
Fairmont State also distributes other student financial assistance funds on behalf of the federal government to students under the Federal Pell Grant, Supplemental Educational Opportunity Grant, and College Work-Study programs. The activity of these programs is recorded in the accompanying financial statements. In 2016 and 2015, Fairmont State received and disbursed $7.3 million and $7.7 million, respectively, under these federal student aid programs.

FAIRMONT STATE UNIVERSITY NOTES TO FINANCIAL STATEMENTS YEARS ENDED JUNE 30, 2016 AND 2015
32
2. SUMMARY OF SIGNIFICANT ACCOUNTING POLICIES (CONTINUED)
Scholarship Allowances - Student tuition and fee revenues, and certain other revenues from students, are reported net of scholarship allowances in the statements of revenues, expenses, and changes in net position. Scholarship allowances are the difference between the stated charge for goods and services provided by Fairmont State and the amount that is paid by students and/or third parties making payments on the student’s behalf.
Financial aid to students is reported in the financial statements under the alternative method as prescribed by the National Association of College and University Business Officers. Certain aid, such as loans, funds provided to students as awarded by third parties, and Federal Direct Lending, is accounted for as a third-party payment (credited to the student’s account as if the student made the payment). All other aid is reflected in the financial statements as operating expenses, or scholarship allowances, which reduce revenues. The amount reported as operating expense represents the portion of aid that was provided to the student in the form of cash. Scholarship allowances represent the portion of aid provided to the student in the form of reduced tuition. Under the alternative method, these amounts are computed on a college basis by allocating the cash payments to students, excluding payments for services, on the ratio of total aid to the aid not considered to be third-party aid.
Government Grants and Contracts - Government grants and contracts normally provide for the recovery of direct and indirect costs, subject to audit. Fairmont State recognizes revenue associated with direct costs as the related costs are incurred. Recovery of related indirect costs is generally recorded at fixed rates negotiated for a period of one to five years.
Income Taxes - Fairmont State is exempt from income taxes, except for unrelated business income, as a nonprofit organization under federal income tax laws and regulations of the Internal Revenue Service.
Cash Flows - Any cash and cash equivalents, including those escrowed, restricted for noncurrent assets, or in funded reserves, are included as cash and cash equivalents for the purpose of the statements of cash flows.
Use of Estimates - The preparation of financial statements in conformity with accounting principles generally accepted in the United States of America requires management to make estimates and assumptions that affect the reported amounts of assets and liabilities and disclosure of contingent assets and liabilities at the date of the financial statements and the reported amounts of revenues and expenses during the reporting period. Actual results could differ from those estimates.
Risk and Uncertainties - Investments are exposed to various risks, such as interest rate, credit, and overall market volatility. Due to the level of risk associated with certain securities, it is reasonably possible that changes in risk and values will occur in the near term and that such changes could materially affect the amounts reported in the financial statements.
FAIRMONT STATE UNIVERSITY NOTES TO FINANCIAL STATEMENTS YEARS ENDED JUNE 30, 2016 AND 2015
33
2. SUMMARY OF SIGNIFICANT ACCOUNTING POLICIES (CONTINUED)
Newly Adopted Statements Issued by the Governmental Accounting Standards Board - The Governmental Accounting Standards Board has issued Statement No. 72, Fair Value Measurement and Application, effective for fiscal years beginning after June 15, 2015. This Statement will enhance comparability of financial statements among governments by requiring measurement of certain assets and liabilities at fair value using a consistent and more detailed definition of fair value and accepted valuation techniques. This Statement also will enhance fair value application guidance and related disclosures in order to provide information to financial statement users about the impact of fair value measurements on a government's financial position. The adoption of GASB Statement No. 72 had no impact on the June 30, 2016 financial statements.
The Governmental Accounting Standards Board has also issued Statement No. 73, Accounting and Financial Reporting for Pensions and Related Assets That Are Not within the Scope of GASB Statement 68, and Amendments to Certain Provisions of GASB Statements 67 and 68, effective for fiscal years beginning after June 15, 2016, and the requirements of this Statement that address financial reporting for assets that accumulate for purposes of providing those pensions are effective for fiscal years beginning after June 15, 2015. The requirements of this Statement will improve financial reporting by establishing a single framework for the presentation of information about pensions, which will enhance the comparability of pension-related information reported by employers and nonemployer contributing entities. The adoption of GASB Statement No. 73 had no impact on the June 30, 2016 financial statements.
The Governmental Accounting Standards Board has also issued Statement No. 76, The Hierarchy of Generally Accepted Accounting Principles for State and Local Governments, effective for fiscal years beginning after June 15, 2015. The requirements of this Statement will identify—in the context of the current governmental financial reporting environment—the hierarchy of generally accepted accounting principles (GAAP). The “GAAP hierarchy” consists of the sources of accounting principles used to prepare financial statements of state and local governmental entities in conformity with GAAP and the framework for selecting those principles. This Statement reduces the GAAP hierarchy to two categories of authoritative GAAP and addresses the use of authoritative and nonauthoritative literature in the event that the accounting treatment for a transaction or other event is not specified within a source of authoritative GAAP. The adoption of GASB Statement No. 76 had no impact on the June 30, 2016 financial statements.
The Governmental Accounting Standards Board has also issued Statement No. 78, Pensions Provided through Certain Multiple-Employer Defined Benefit Pension Plans, effective for fiscal years beginning after December 15, 2015. The objective of this Statement is to address a practice issue regarding the scope and applicability of Statement No. 68, Accounting and Financial Reporting for Pensions. This issue is associated with pensions provided through certain multiple-employer defined benefit pension plans and to state or local governmental employers whose employees are provided with such pensions. The adoption of GASB Statement No. 78 had no impact on the June 30, 2016 financial statements.

FAIRMONT STATE UNIVERSITY NOTES TO FINANCIAL STATEMENTS YEARS ENDED JUNE 30, 2016 AND 2015
34
2. SUMMARY OF SIGNIFICANT ACCOUNTING POLICIES (CONTINUED)
The Governmental Accounting Standards Board has also issued Statement No. 79, Certain External Investment Pools and Pool Participants, effective for fiscal years beginning after June 15, 2015. This Statement addresses accounting and financial reporting for certain external investment pools and pool participants. Specifically, it establishes criteria for an external investment pool to qualify for making the election to measure all of its investments at amortized cost for financial reporting purposes. An external investment pool qualifies for that reporting if it meets all of the applicable criteria established in this Statement. The specific criteria address (1) how the external investment pool transacts with participants; (2) requirements for portfolio maturity, quality, diversification, and liquidity; and (3) calculation and requirements of a shadow price. Significant noncompliance prevents the external investment pool from measuring all of its investments at amortized cost for financial reporting purposes. Professional judgment is required to determine if instances of noncompliance with the criteria established by this Statement during the reporting period, individually or in the aggregate, were significant. The adoption of GASB Statement No. 79 had no impact on the June 30, 2016 financial statements. The Governmental Accounting Standards Board has also issued Statement No. 82, Pension Issues an amendment of GASB Statements No. 67, No. 68, and No. 73, effective for fiscal years beginning after June 15, 2016. The objective of this Statement is to address certain issues that have been raised with respect to Statements No. 67, Financial Reporting for Pension Plans, No. 68, Accounting and Financial Reporting for Pensions, and No. 73, Accounting and Financial Reporting for Pensions and Related Assets That Are Not within the Scope of GASB Statement 68, and Amendments to Certain Provisions of GASB Statements 67 and 68. Specifically, this Statement addresses issues regarding (1) the presentation of payroll-related measures in required supplementary information, (2) the selection of assumptions and the treatment of deviations from the guidance in an Actuarial Standard of Practice for financial reporting purposes, and (3) the classification of payments made by employers to satisfy employee (plan member) contribution requirements. The adoption of GASB Statement No. 82 had no impact on the June 30, 2016 financial statements. Recent Statements Issued by the Governmental Accounting Standards Board - The Governmental Accounting Standards Board has issued Statement No. 74, Financial Reporting for Postemployment Benefit Plans Other Than Pension Plans, effective for fiscal years beginning after June 15, 2016. The requirements of this Statement will improve the usefulness of information about postemployment benefits other than pensions (other postemployment benefits or OPEB) included in the general purpose external financial reports of state and local governmental OPEB plans for making decisions and assessing accountability. Fairmont State has not yet determined the effect that the adoption of GASB Statement No. 74 may have on its financial statements.
The Governmental Accounting Standards Board has also issued Statement No. 75, Accounting and Financial Reporting for Postemployment Benefits Other Than Pensions, effective for fiscal years beginning after June 15, 2017. The requirements of this Statement will improve accounting and financial reporting by state and local governments for postemployment benefits other than pensions (other postemployment benefits or OPEB). It also improves information provided by state and local governmental employers about financial support for OPEB that is provided by other entities. Fairmont State has not yet determined the effect that the adoption of GASB Statement No. 75 may have on its financial statements.

FAIRMONT STATE UNIVERSITY NOTES TO FINANCIAL STATEMENTS YEARS ENDED JUNE 30, 2016 AND 2015
35
2. SUMMARY OF SIGNIFICANT ACCOUNTING POLICIES (CONTINUED)
The Governmental Accounting Standards Board has also issued Statement No. 77, Tax Abatement Disclosures, effective for fiscal years beginning after December 15, 2015. The requirements of this Statement will improve financial reporting by giving users of financial statements essential information that is not consistently or comprehensively reported to the public at present. Disclosure of information about the nature and magnitude of tax abatements will make these transactions more transparent to financial statement users. As a result, users will be better equipped to understand (1) how tax abatements affect a government's future ability to raise resources and meet its financial obligations and (2) the impact those abatements have on a government's financial position and economic condition. Fairmont State has not yet determined the effect that the adoption of GASB Statement No. 77 may have on its financial statements. The Governmental Accounting Standards Board has also issued Statement No. 80, Blending Requirements for Certain Component Units an amendment of GASB Statement No. 14, effective for fiscal years beginning after June 15, 2016. The objective of this Statement is to improve financial reporting by clarifying the financial statement presentation requirements for certain component units. This Statement amends the blending requirements established in paragraph 53 of Statement No. 14, The Financial Reporting Entity, as amended. Fairmont State has not yet determined the effect that the adoption of GASB Statement No. 80 may have on its financial statements. The Governmental Accounting Standards Board has also issued Statement No. 81, Irrevocable Split-Interest Agreements, effective for fiscal years beginning after December 15, 2016. The objective of this Statement is to improve accounting and financial reporting for irrevocable split-interest agreements by providing recognition and measurement guidance for situations in which a government is a beneficiary of the agreement. Fairmont State has not yet determined the effect that the adoption of GASB Statement No. 81 may have on its financial statements.
3. CASH AND CASH EQUIVALENTS
The composition of cash and cash equivalents at June 30, 2016 and 2015, was held as follows:
2016 Current Noncurrent Total
State Treasurer/BTI $ 30,089,880 $ - $ 30,089,880 Trustee 5,194,256 3,120,400 8,314,656 In bank 176,637 381,012 557,649 On hand 3,116 - 3,116
$ 35,463,889 $ 3,501,412 $ 38,965,301
2015 Current Noncurrent Total
State Treasurer/BTI $ 30,799,377 $ - $ 30,799,377 Trustee - 30,330,499 30,330,499 In bank 183,838 280,477 464,315 On hand 3,116 - 3,116
$ 30,986,331 $30,610,976 $ 61,597,307
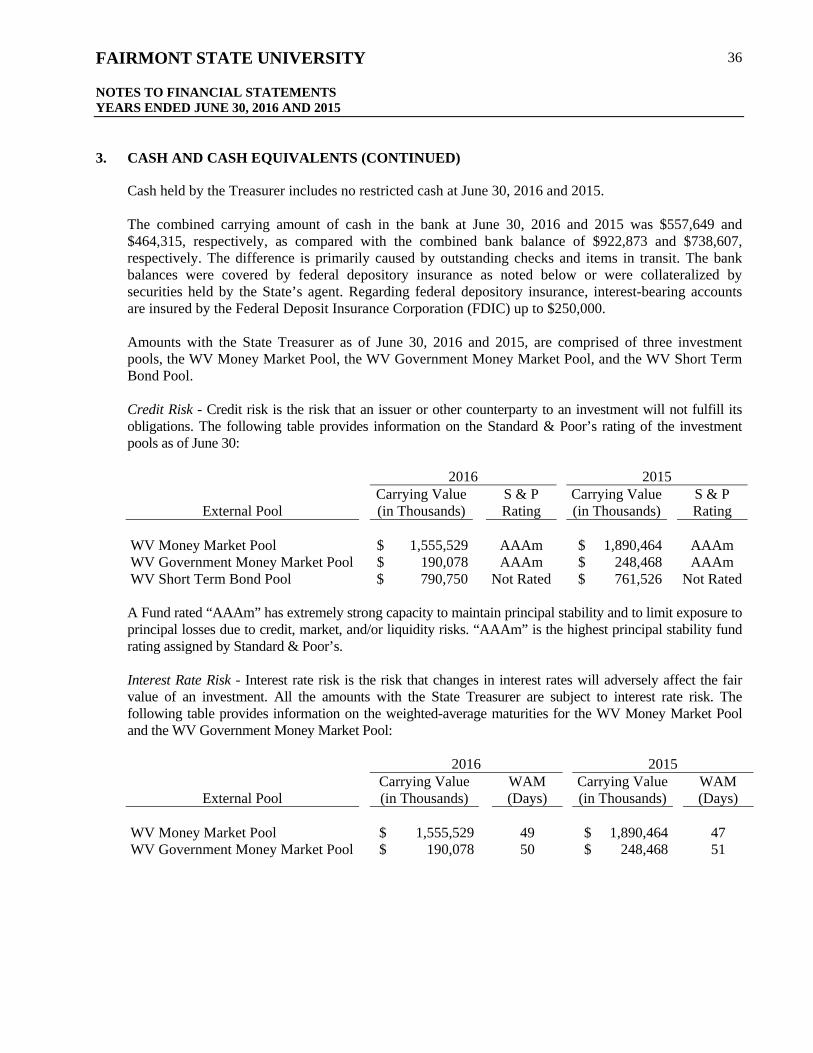
FAIRMONT STATE UNIVERSITY NOTES TO FINANCIAL STATEMENTS YEARS ENDED JUNE 30, 2016 AND 2015
36
3. CASH AND CASH EQUIVALENTS (CONTINUED)
Cash held by the Treasurer includes no restricted cash at June 30, 2016 and 2015. The combined carrying amount of cash in the bank at June 30, 2016 and 2015 was $557,649 and $464,315, respectively, as compared with the combined bank balance of $922,873 and $738,607, respectively. The difference is primarily caused by outstanding checks and items in transit. The bank balances were covered by federal depository insurance as noted below or were collateralized by securities held by the State’s agent. Regarding federal depository insurance, interest-bearing accounts are insured by the Federal Deposit Insurance Corporation (FDIC) up to $250,000. Amounts with the State Treasurer as of June 30, 2016 and 2015, are comprised of three investment pools, the WV Money Market Pool, the WV Government Money Market Pool, and the WV Short Term Bond Pool. Credit Risk - Credit risk is the risk that an issuer or other counterparty to an investment will not fulfill its obligations. The following table provides information on the Standard & Poor’s rating of the investment pools as of June 30:
2016 2015
Carrying Value S & P Carrying Value S & P External Pool (in Thousands) Rating (in Thousands) Rating
WV Money Market Pool $ 1,555,529 AAAm $ 1,890,464 AAAm WV Government Money Market Pool $ 190,078 AAAm $ 248,468 AAAm WV Short Term Bond Pool $ 790,750 Not Rated $ 761,526 Not Rated A Fund rated “AAAm” has extremely strong capacity to maintain principal stability and to limit exposure to principal losses due to credit, market, and/or liquidity risks. “AAAm” is the highest principal stability fund rating assigned by Standard & Poor’s. Interest Rate Risk - Interest rate risk is the risk that changes in interest rates will adversely affect the fair value of an investment. All the amounts with the State Treasurer are subject to interest rate risk. The following table provides information on the weighted-average maturities for the WV Money Market Pool and the WV Government Money Market Pool: 2016 2015
Carrying Value WAM Carrying Value WAM External Pool (in Thousands) (Days) (in Thousands) (Days)
WV Money Market Pool $ 1,555,529 49 $ 1,890,464 47 WV Government Money Market Pool $ 190,078 50 $ 248,468 51

FAIRMONT STATE UNIVERSITY NOTES TO FINANCIAL STATEMENTS YEARS ENDED JUNE 30, 2016 AND 2015
37
3. CASH AND CASH EQUIVALENTS (CONTINUED)
The following table provides information on the effective duration for the WV Short Term Bond Pool: 2016 2015
Effective Effective Carrying Value Duration Carrying Value Duration
External Pool (in Thousands) (Days) (in Thousands) (Days) WV Short Term Bond Pool $ 790,750 462 $ 761,526 410 Other Investment Risks - Other investment risks include concentration of credit risk, custodial credit risk, and foreign currency risk. None of the BTI’s Consolidated Fund’s investment pools or accounts is exposed to these risks as described below. Custodial Credit Risk - Custodial credit risk for investments is the risk that, in the event of the failure of the counterparty to a transaction, Fairmont State will not be able to recover the value of the investment or collateral securities that are in the possession of an outside party.
Interest Rate Risk - Interest rate risk is the risk that changes in interest rates will adversely affect the fair value of an investment. Fairmont State’s investment policy limits investment maturities from potential fair value losses due to increasing interest rates. No more than 5% of the money market fund’s total market value may be invested in the obligations of a single issuer, with the exception of the U.S. government and its agencies.
Foreign Currency Risk - Foreign currency risk is the risk that changes in exchange rates will adversely affect the fair value of an investment or a deposit. Fairmont State has no securities with foreign currency risk.
4. ACCOUNTS RECEIVABLE
Accounts receivable at June 30, 2016 and 2015, are as follows:
2016 2015
Student tuition and fees — net of allowance for doubtful accounts of $2,650,601 and $2,341,491, respectively $ 501,242 $ 486,842
Grants and contracts receivable 123,398 72,625 Due from the Commission 158,567 4,160 Due from other State agencies 131,658 5,150 Due from Pierpont 214,070 109,551 Other accounts receivable 64,318 73,311
$ 1,193,253 $ 751,639

FAIRMONT STATE UNIVERSITY NOTES TO FINANCIAL STATEMENTS YEARS ENDED JUNE 30, 2016 AND 2015
38
5. CAPITAL ASSETS
Capital asset activities for the years ended June 30, 2016 and 2015 are as follows:
2016 Beginning Ending Balance Transfers Additions Reductions Balance
Capital assets not being depreciated: Land $ 7,682,173 $ - $ - $ - $ 7,682,173 Construction in progress 2,690,801 421 27,716,806 (1,148,734) 29,259,294
Total capital assets not being depreciated $ 10,372,974 $ 421 $27,716,806 $ (1,148,734) $ 36,941,467
Other capital assets: Land improvements $ 4,910,215 $ 4,995 $ 266,302 $ - $ 5,181,512 Infrastructure 10,609,891 37,541 - - 10,647,432 Buildings 130,214,792 217,707 898,643 - 131,331,142 Equipment 6,435,572 2,374 315,365 (93,885) 6,659,426 Computer software 463,296 - - - 463,296 Library books 3,670,535 13,269 5,127 (264,205) 3,424,726
Total other capital assets 156,304,301 275,886 1,485,437 (358,090) 157,707,534
Less accumulated depreciation for: Land improvements 2,966,169 2,016 261,040 - 3,229,225 Infrastructure 6,896,957 24,432 613,641 - 7,535,030 Buildings 35,719,384 65,604 2,526,834 - 38,311,822 Equipment 4,557,209 1,338 458,061 (92,177) 4,924,431 Computer software 455,885 - 7,411 - 463,296 Library books 3,588,618 12,973 25,211 (264,205) 3,362,597
Total accumulated depreciation 54,184,222 106,363 3,892,198 (356,382) 57,826,401
Other capital assets — net $102,120,079 $ 169,523 $ (2,406,761) $ (1,708) $ 99,881,133
Capital asset summary: Capital assets not being depreciated $ 10,372,974 $ 421 $27,716,806 $ (1,148,734) $ 36,941,467 Other capital assets 156,304,301 275,886 1,485,437 (358,090) 157,707,534
Total cost of capital assets 166,677,275 276,307 29,202,243 (1,506,824) 194,649,001
Less accumulated depreciation 54,184,222 106,363 3,892,198 (356,382) 57,826,401
Capital assets — net $112,493,053 $ 169,944 $25,310,045 $ (1,150,442) $136,822,600

FAIRMONT STATE UNIVERSITY NOTES TO FINANCIAL STATEMENTS YEARS ENDED JUNE 30, 2016 AND 2015
39
5. CAPITAL ASSETS (CONTINUED)
2015 Beginning Ending Balance Transfers Additions Reductions Balance
Capital assets not being depreciated: Land $ 7,682,173 $ - $ - $ - $ 7,682,173 Construction in progress 1,743,400 2,169 4,035,399 (3,090,167) 2,690,801
Total capital assets not being depreciated $ 9,425,573 $ 2,169 $ 4,035,399 $ (3,090,167) $ 10,372,974
Other capital assets: Land improvements $ 4,393,126 $ 7,186 $ 509,903 $ - $ 4,910,215 Infrastructure 10,533,246 76,645 - - 10,609,891 Buildings 127,218,292 442,688 2,624,223 (70,411) 130,214,792 Equipment 5,989,821 4,720 491,793 (50,762) 6,435,572 Computer software 463,296 - - - 463,296 Library books 3,928,118 29,208 35,037 (321,828) 3,670,535
Total other capital assets 152,525,899 560,447 3,660,956 (443,001) 156,304,301
Less accumulated depreciation for: Land improvements 2,697,547 3,572 265,050 - 2,966,169 Infrastructure 6,216,084 45,302 635,571 - 6,896,957 Buildings 33,119,089 125,594 2,503,025 (28,324) 35,719,384 Equipment 4,121,179 2,258 479,983 (46,211) 4,557,209 Computer software 435,281 - 20,604 - 455,885 Library books 3,849,702 28,625 32,119 (321,828) 3,588,618
Total accumulated depreciation 50,438,882 205,351 3,936,352 (396,363) 54,184,222
Other capital assets — net $ 102,087,017 $ 355,096 $ (275,396) $ (46,638) $102,120,079
Capital asset summary: Capital assets not being depreciated $ 9,425,573 $ 2,169 $ 4,035,399 $ (3,090,167) $ 10,372,974 Other capital assets 152,525,899 560,447 3,660,956 (443,001) 156,304,301
Total cost of capital assets 161,951,472 562,616 7,696,355 (3,533,168) 166,677,275
Less accumulated depreciation 50,438,882 205,351 3,936,352 (396,363) 54,184,222
Capital assets — net $ 111,512,590 $ 357,265 $ 3,760,003 $ (3,136,805) $112,493,053

FAIRMONT STATE UNIVERSITY NOTES TO FINANCIAL STATEMENTS YEARS ENDED JUNE 30, 2016 AND 2015
40
5. CAPITAL ASSETS (CONTINUED)
Fairmont State maintains certain collections of inexhaustible assets to which no value can be practically determined. Accordingly, such collections are not capitalized or recognized for financial statement purposes. Such collections include contributed works of art, historical treasures, and literature that are held for exhibition, education, research, and public service. These collections are neither disposed of for financial gain nor encumbered in any means.
During December 2010, Fairmont State was approved to receive $18,700,000 of Education, Arts, Science, and Tourism (EAST) bond proceeds to be specifically used for four major facility renovation projects. During fiscal year 2015, additional funds in the amount of $27,569 were approved for Fairmont State. These bond proceeds were accounted for as prescribed in the Separation of Assets and Liabilities Agreement between Fairmont State and Pierpont. As of June 30, 2015, $18,727,569 had been incurred for HEPC bond projects. No additional funds were approved or incurred during fiscal year 2016. The West Virginia Development Office is responsible for repayment of this debt.
Fairmont State has construction commitments of $10,297,234 as of June 30, 2016.
6. LONG-TERM LIABILITIES
Long-term obligation activities for the years ended June 30, 2016, and 2015 are as follows:
2016
Beginning Ending Current
Balance Transfers Additions Reductions Balance Portion
Bonds payable $ 80,552,428 $ - $ - $ (2,344,392) $ 78,208,036 $ 3,072,372
Add (less) deferred amounts:
Premium on issuance 2,537,610 - - (139,961) 2,397,649 139,961
Total bonds payable — net 83,090,038 - (2,484,353) 80,605,685 3,212,333
Capital leases payable 93,965 - - (39,977) 53,988 40,417
Other long-term liabilities:
Other postemployment
benefits liability 9,384,887 - 1,360,846 (779,677) 9,966,056 -
Accrued compensated absences 1,229,314 - 778,467 (716,786) 1,290,995 857,520
Advances from federal sponsors 1,154,967 - - (92,219) 1,062,748 -
Payable to the Commission 1,829,629 4,392 - (118,500) 1,715,521 127,075
Net pension liability 1,381,799 - 141,247 (390,601) 1,132,445 -
Other long-term liabilities 996,712 - - (804,933) 191,779 85,000
Total long-term liabilities $ 99,161,311 $ 4,392 $ 2,280,560 $ (5,427,046) $ 96,019,217 $ 4,322,345
*Transfers represent the ownership change from FY15 to FY16

FAIRMONT STATE UNIVERSITY NOTES TO FINANCIAL STATEMENTS YEARS ENDED JUNE 30, 2016 AND 2015
41
6. LONG-TERM LIABILITIES (CONTINUED)
2015
Beginning Ending Current
Balance Transfers Additions Reductions Balance Portion
Bonds payable $ 52,610,432 $ - $ 30,200,000 $ (2,258,004) $ 80,552,428 $ 2,344,392
Add (less) deferred amounts:
Premium on issuance 2,282,692 - 383,173 (128,255) 2,537,610 139,961
Total bonds payable — net 54,893,124 30,583,173 (2,386,259) 83,090,038 2,484,353
Capital leases payable 231,209 - - (137,244) 93,965 39,977
Other long-term liabilities:
Other postemployment
benefits liability 8,882,014 - 1,293,411 (790,538) 9,384,887 -
Accrued compensated absences 1,217,873 - 768,056 (756,615) 1,229,314 834,760
Advances from federal sponsors 1,182,565 - - (27,598) 1,154,967 -
Payable to the Commission 1,930,810 14,358 - (115,539) 1,829,629 120,287
Net pension liability - - 1,381,799 - 1,381,799 -
Other long-term liabilities 255,000 - 836,712 (95,000) 996,712 160,000
Total long-term liabilities $ 68,592,595 $ 14,358 $ 34,863,151 $ (4,308,793) $ 99,161,311 $ 3,639,377
*Transfers represent the ownership change from FY14 to FY15

FAIRMONT STATE UNIVERSITY NOTES TO FINANCIAL STATEMENTS YEARS ENDED JUNE 30, 2016 AND 2015
42
7. BONDS PAYABLE
Bonds payable at June 30, 2016, and 2015, are summarized as follows (in thousands):
Annual 2016 2015 Interest Principal Principal Principal Rates Installments Outstanding Outstanding
Facilities Improvement Revenue Bonds
2006 Series, due through 2026 1.74% (10-year reset) $343 - $611 $ 5,113 $ 5,517 Revenue Refunding Bonds
2012, Series A, due through 2032 2.00 - 5.00 730 - 1,155 17,185 17,955 Revenue Refunding Bonds
2012, Series B, due through 2032 2.00 - 5.00 1,080 - 1,720 25,710 26,880 Revenue Refunding Bonds
2015, Series A, due through 2045 1.75 - 5.00 580 - 1,665 30,200 30,200
Total outstanding principal 78,208 80,552
Add unamortized bond premium 2,398 2,538
Total $ 80,606 $ 83,090
Current $ 3,212 $ 2,484 Noncurrent 77,394 80,606
Total $ 80,606 $ 83,090

FAIRMONT STATE UNIVERSITY NOTES TO FINANCIAL STATEMENTS YEARS ENDED JUNE 30, 2016 AND 2015
43
7. BONDS PAYABLE (CONTINUED)
Fairmont State has issued the following revenue bonds:
a. Facilities Improvement Revenue Bonds, 2006 Series — On May 9, 2006, Fairmont State issued Facilities Improvement Bonds, 2006 Series (the 2006 Bonds) amounting to $8,500,000. The 2006 Bonds were issued to (1) finance the costs of the design, acquisition, construction, and equipping of certain necessary improvements in the facilities of the main campus shared by Fairmont State & Pierpont, including, but not limited to, a technology wing addition/renovation and elevator/heating, ventilation, and air-conditioning (HVAC) improvements to infrastructure improvements, all of which will be owned by the Board, and (2) pay the costs of issuance of the 2006 Bonds and related costs.
b. Revenue Refunding Bonds, 2012 Series A — On June 12, 2012, Fairmont State University, in conjunction with Pierpont, issued Revenue Refunding Bonds Series A (the 2012A Bonds) amounting to $20,165,000. The 2012A Bonds were issued to (1) currently refund in full the outstanding 2002A and 2002B Bonds and (2) pay the costs of issuance of the Series 2012A Bonds and related costs. The issuance of the 2012A Bonds resulted in a loss of $561,866 and an economic gain of $3,866,063.
c. Revenue Refunding Bonds, 2012 Series B — On June 12, 2012, Fairmont State, in conjunction with Pierpont, issued Revenue Refunding Bonds Series B (the 2012B Bonds) amounting to $30,160,000. The 2012B Bonds were issued to (1) advance refund in full the outstanding 2003A and 2003B Bonds and (2) pay the costs of issuance of the Series 2012 B Bonds and related costs. The issuance of the 2012B Bonds resulted in a loss of $1,713,791 and an economic gain of $3,503,626.
d. Facilities Construction Revenue Bonds, 2015 Series A — On April 7, 2015, Fairmont State issued Revenue Bonds Series A (the 2015A Bonds) amounting to $30,200,000. The 2015A Bonds were issued to (1) finance the costs of planning, designing, constructing, acquiring, and equipping new student housing facilities; (2) provide payment of capitalized interest on the Series 2015 Bonds; (3) reimburse certain previously incurred expenditures related to the 2015 Project; and (4) pay the costs of issuance of the Series 2015 Bonds and related costs.
The bond issues are special obligations of Fairmont State and are secured by and payable from certain pledge revenues held under the Bond Indenture (the Indenture). The bonds shall not be deemed to be general obligations or debts of the State within the meaning of the Constitution of the State; neither the credit nor the taxing power of the State is pledged for the payment of the bonds. The 2012 Series A and 2012 Series B Bonds are fully insured as to principal and interest by Financial Guaranty Insurance Company.

FAIRMONT STATE UNIVERSITY NOTES TO FINANCIAL STATEMENTS YEARS ENDED JUNE 30, 2016 AND 2015
44
7. BONDS PAYABLE (CONTINUED)
The 2012 Series A and B and 2015 Series A Bonds’ covenants require that the schedules of rent, charges, and fees shall at all times be adequate to produce revenues from the auxiliary facilities sufficient to pay operating expenses and, when combined with infrastructure fees (as defined in the Indenture), to make the prescribed payments into the funds and accounts created hereunder, and that such schedule or schedules of rents, charges, and fees, that shall be revised from time to time to provide for all reasonable operating expenses and leave gross revenues, when combined with other monies legally available to be used for such purposes, each year equal at least 100% of the maximum annual debt service of the 2012 Series A and B Bonds and the 2015 Series A Bonds of $5,389,074.
For the years ended June 30, 2016 and 2015, Fairmont State and Pierpont had gross revenues that approximated 235% and 303%, respectively, of the maximum annual debt service of the 2012 Series A and B and 2015 Series A Bonds.
Future debt service requirements to maturity for the revenue bonds at June 30, 2016, are as follows:
Years Ending June 30, Principal Interest Total
2017 $ 3,072,372 $ 2,868,737 $ 5,941,109 2018 3,180,626 2,762,282 5,942,908 2019 3,294,025 2,651,883 5,945,908 2020 3,402,571 2,545,087 5,947,658 2021 3,481,267 2,459,391 5,940,658 2022-2026 19,512,175 10,203,391 29,715,566 2027-2031 20,200,000 6,709,844 26,909,844 2032-2036 9,080,000 3,217,919 12,297,919 2037-2041 6,680,000 1,952,063 8,632,063 2042-2045 6,305,000 602,063 6,907,063
Total $ 78,208,036 $ 35,972,660 $ 114,180,696

FAIRMONT STATE UNIVERSITY NOTES TO FINANCIAL STATEMENTS YEARS ENDED JUNE 30, 2016 AND 2015
45
8. LEASES
Operating Leases - Fairmont State leases office and storage spaces and various equipment. These obligations are accounted for as operating leases.
Future annual minimum lease payments on operating leases for years subsequent to June 30, 2016, are as follows:
Years Ending June 30,
2017 $ 34,850 2018 33,348 2019 33,678 2020 34,008 2021 34,338 2022-2032 385,273
Total $ 555,495
Total lease expense for the years ended June 30, 2016 and 2015, was $38,398 and $40,988, respectively. Fairmont State does not have any noncancelable leases.
Capital Leases - Fairmont State leases equipment accounted for as capital leases.
Fairmont State entered into a lease agreement with Bank of America in September 2012 to cover the acquisition and installation costs for an alarm system for Pence and Pritchard residence halls. The lease is accounted for as a capital lease, with a total cost of $198,522 and a net book value of $183,633 and $187,603 as of June 30, 2016 and 2015, respectively. Future annual minimum lease payments on capital leases for years subsequent to June 30, 2016, are as follows:
Years Ending June 30, Principal Interest Total
2017 $ 40,417 $ 389 $ 40,806 2018 13,571 31 13,602
Total $ 53,988 $ 420 $ 54,408

FAIRMONT STATE UNIVERSITY NOTES TO FINANCIAL STATEMENTS YEARS ENDED JUNE 30, 2016 AND 2015
46
9. OTHER POSTEMPLOYMENT BENEFITS
In accordance with GASB, OPEB costs are accrued based upon invoices received from PEIA based upon actuarial determined amounts. At June 30, 2016, 2015, and 2014, the noncurrent liability related to OPEB costs was $9,966,056, $9,384,887, and $8,882,014, respectively. The total OPEB expense incurred and the amount of OPEB expense that relates to retirees was $1,360,846 and $141,319, respectively, during 2016, or 10%. The total OPEB expense incurred and the amount of OPEB expense that relates to retirees was $1,293,411 and $131,998, respectively, during 2015, or 10%. The total OPEB expense incurred and the amount of OPEB expense that relates to retirees was $933,263 and $102,770, respectively, during 2014, or 11%. As of June 30, 2016, 2015, and 2014, there were 67, 73, and 66, respectively, retirees receiving these benefits. During the 2013 legislative session, the State took proactive measures to address this unfunded liability, which will take effect in future fiscal years and fully fund the liability by 2037.
10. STATE SYSTEM OF HIGHER EDUCATION INDEBTEDNESS
Fairmont State is a State institution of higher education and receives a State appropriation to finance its operations. In addition, it is subject to the legislative and administrative mandates of State government. Those mandates affect all aspects of Fairmont State’s operations, its tuition and fee structure, its personnel policies, and its administrative practices.
The State has chartered the Commission with the responsibility to construct or renovate, finance, and maintain various academic and other facilities of the State’s universities and colleges, including certain facilities of Fairmont State. Financing for these facilities was provided through revenue bonds issued by the former Board of Regents or the former Boards of University and College Systems (the Boards). These obligations administered by the Municipal Bond Commission are the direct and total responsibility of the Commission, as successor to the former Boards.
The Municipal Bond Commission has the authority to assess each public institution of higher education for payment of debt service on these system bonds. The tuition and registration fees of the members of the former State University System are generally pledged as collateral for the Commission’s bond indebtedness. Student fees collected by the institution in excess of the debt service allocation are retained by the institution for internal funding of capital projects and maintenance including payment of institution debt. Although the bonds remain as a capital obligation of the Commission, an estimate of the obligation of each institution is reported as a long-term payable by each institution and as a receivable by the Commission. During 2016 and 2015, Fairmont State reduced its debt to the Commission against the debt obligation by $114,108 and $101,181, respectively. The amount due to Commission at June 30, 2016 and 2015 is $1,715,521 and $1,829,629, respectively.

FAIRMONT STATE UNIVERSITY NOTES TO FINANCIAL STATEMENTS YEARS ENDED JUNE 30, 2016 AND 2015
47
11. NET POSITION
Fairmont State’s net position at June 30, 2016 and 2015 includes certain designated net position, as follows:
2016 Net Position
Before OPEB OPEB Total Liability Liability Net Position
Net investment in capital assets $ 62,083,700 $ - $ 62,083,700
Restricted for — expendable: Loans 131,548 - 131,548 Scholarships 6,625 - 6,625 Capital projects 3,712,363 - 3,712,363 Debt service 3,812 - 3,812
Total restricted 3,854,348 - 3,854,348
Unrestricted: Designated for auxiliaries 9,259,125 1,054,647 8,204,478 Designated for fund managers 1,894,768 - 1,894,768 Undesignated 7,235,274 8,911,409 (1,676,135)
Total unrestricted 18,389,167 9,966,056 8,423,111
Total net position $ 84,327,215 $ 9,966,056 $ 74,361,159
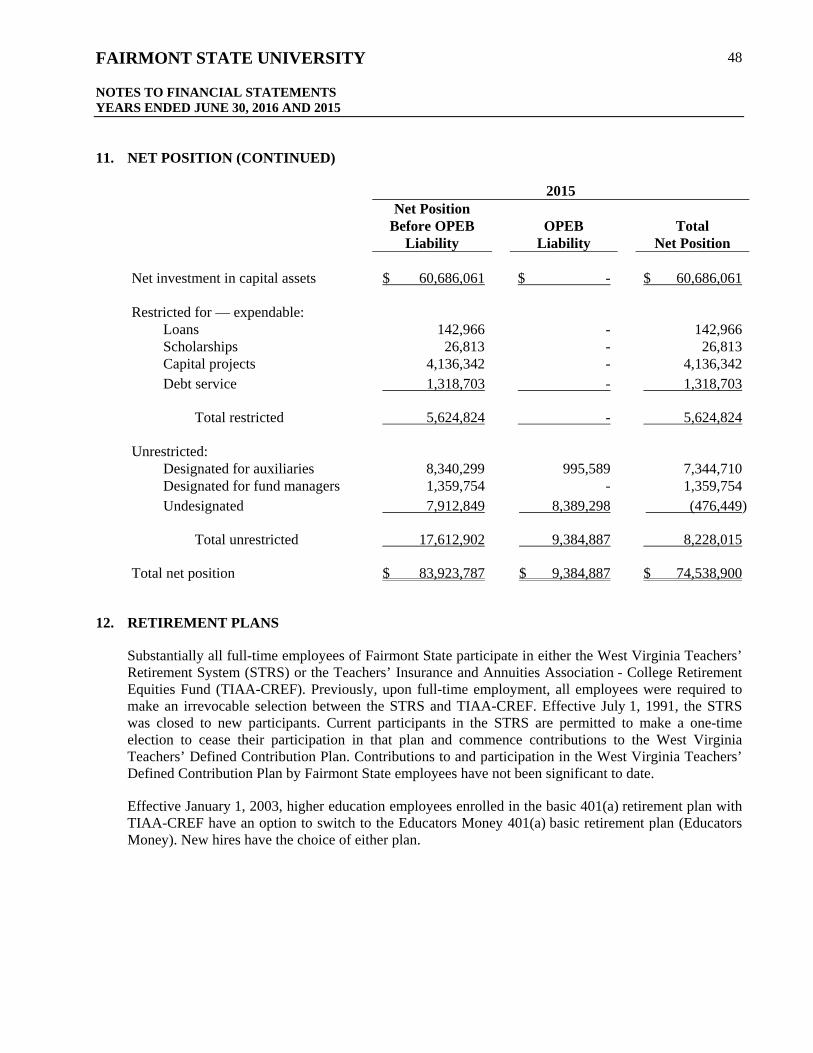
FAIRMONT STATE UNIVERSITY NOTES TO FINANCIAL STATEMENTS YEARS ENDED JUNE 30, 2016 AND 2015
48
11. NET POSITION (CONTINUED)
2015 Net Position
Before OPEB OPEB Total Liability Liability Net Position
Net investment in capital assets $ 60,686,061 $ - $ 60,686,061
Restricted for — expendable: Loans 142,966 - 142,966 Scholarships 26,813 - 26,813 Capital projects 4,136,342 - 4,136,342 Debt service 1,318,703 - 1,318,703
Total restricted 5,624,824 - 5,624,824
Unrestricted: Designated for auxiliaries 8,340,299 995,589 7,344,710 Designated for fund managers 1,359,754 - 1,359,754 Undesignated 7,912,849 8,389,298 (476,449)
Total unrestricted 17,612,902 9,384,887 8,228,015
Total net position $ 83,923,787 $ 9,384,887 $ 74,538,900
12. RETIREMENT PLANS
Substantially all full-time employees of Fairmont State participate in either the West Virginia Teachers’ Retirement System (STRS) or the Teachers’ Insurance and Annuities Association - College Retirement Equities Fund (TIAA-CREF). Previously, upon full-time employment, all employees were required to make an irrevocable selection between the STRS and TIAA-CREF. Effective July 1, 1991, the STRS was closed to new participants. Current participants in the STRS are permitted to make a one-time election to cease their participation in that plan and commence contributions to the West Virginia Teachers’ Defined Contribution Plan. Contributions to and participation in the West Virginia Teachers’ Defined Contribution Plan by Fairmont State employees have not been significant to date.
Effective January 1, 2003, higher education employees enrolled in the basic 401(a) retirement plan with TIAA-CREF have an option to switch to the Educators Money 401(a) basic retirement plan (Educators Money). New hires have the choice of either plan.

FAIRMONT STATE UNIVERSITY NOTES TO FINANCIAL STATEMENTS YEARS ENDED JUNE 30, 2016 AND 2015
49
12. RETIREMENT PLANS (CONTINUED) DEFINED BENEFIT PENSION PLAN Some employees of Fairmont State are enrolled in a defined benefit pension plan, the STRS plan, which is administered by the CPRB. As related to the implementation of GASB 68, following are Fairmont State’s net pension liability, deferred outflows of resources and deferred inflows of resources related to pensions, revenues, and the pension expense and expenditures for the fiscal years ended June 30, 2016 and 2015:
STRS 2016 2015 Net pension liability $ 1,132,445 $ 1,381,799 Deferred outflows of resources 93,303 148,605 Deferred inflows of resources 357,582 271,990 Revenues 183,361 184,468 Pension expense 189,742 241,289 Contributions made by Fairmont State 93,303 148,605
Plan Description STRS is a multiple employer defined benefit cost-sharing public employee retirement system providing retirement benefits as well as death and disability benefits. It covers all full-time employees of the 55 county public school systems in the State of West Virginia (the State) and certain personnel of the 13 State-supported institutions of higher education, State Department of Education, and the Higher Education Policy Commission hired prior to July 1, 1991. Employees of the State-supported institutions of higher education and the Higher Education Policy Commission hired after June 30, 1991 are required to participate in the Higher Education Retirement System. STRS closed membership to new hires effective July 1, 1991. STRS is considered a component unit of the State of West Virginia for financial reporting purposes, and, as such, its financial report is also included in the State of West Virginia’s Comprehensive Annual Financial Report. STRS issues a publicly available comprehensive annual financial report that includes financial statements and required supplementary information for the plan. A copy of the report may be obtained from the STRS website at https://www.wvretirement.com/Publications.html#CAFR.

FAIRMONT STATE UNIVERSITY NOTES TO FINANCIAL STATEMENTS YEARS ENDED JUNE 30, 2016 AND 2015
50
12. RETIREMENT PLANS (CONTINUED)
Benefits Provided STRS provides retirement, death, and disability benefits. A member is eligible for normal retirement at age 60 with five years of service, age 55 with 30 years of service, or any age with 35 years of service. A member may retire with 30 years of credited service at any age with the pension reduced actuarially if the member retires before age 55. Terminated members with at least five but less than 20 years of credited service who do not withdraw their accumulated contributions are entitled to a deferred retirement commencing at age 62. Retirement benefits are equivalent to 2% of average annual salary multiplied by years of service. Average salary is the average of the five highest fiscal years of earnings during the last 15 fiscal years of earnings. Chapter 18, Article 7A of the West Virginia State Code assigns the authority to establish and amend the provisions of the plan, including contribution rates, to the State Legislature. Contributions The funding objective of the CPRB pension trust funds is to meet long-term benefit requirements through contributions, which remain relatively level as a percent of member payroll over time, and through investment earnings. Contribution requirements are set by the CPRB. A member who withdraws from service for any cause other than death or retirement may request that the accumulated employee contributions plus interest be refunded. Member Contributions: STRS funding policy provides for member contributions based on 6% of members’ gross salary. Contributions as a percentage of payroll for members and employers are established by State law and are not actuarially-determined. Employer Contributions: Employers make the following contributions: The State (including institutions of higher education) contributes: 15% of gross salary of their State-employed members hired prior to July 1, 1991; 15% of School Aid Formula (SAF) covered payroll of county-employed members for entities other
than institutions of higher education; 7.5% of SAF covered payroll of members of the Teachers’ Defined Contribution Retirement System
for entities other than institutions of higher education; a certain percentage of fire insurance premiums paid by State residents; and under WV State code section 18-9-A-6a, beginning in fiscal year 1996, an amount determined by
the State Actuary as being needed to eliminate the STRS unfunded liability within 40 years of June 30, 1994. As of June 30, 2016 and 2015, Fairmont State’s proportionate share attributable to this special funding subsidy was $183,361 and $184,468, respectively.
Fairmont State’s contributions to STRS for the years ended June 30, 2016, 2015, and 2014, were $93,303, $148,605, and $184,514, respectively.
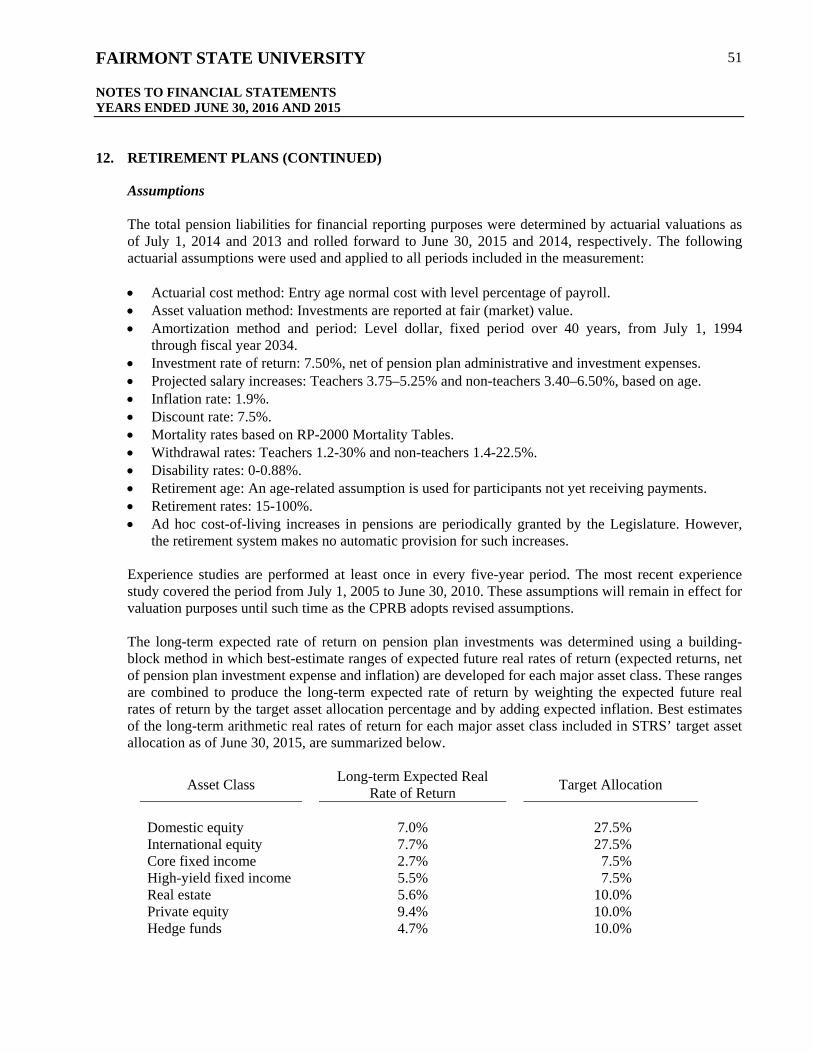
FAIRMONT STATE UNIVERSITY NOTES TO FINANCIAL STATEMENTS YEARS ENDED JUNE 30, 2016 AND 2015
51
12. RETIREMENT PLANS (CONTINUED)
Assumptions The total pension liabilities for financial reporting purposes were determined by actuarial valuations as of July 1, 2014 and 2013 and rolled forward to June 30, 2015 and 2014, respectively. The following actuarial assumptions were used and applied to all periods included in the measurement: Actuarial cost method: Entry age normal cost with level percentage of payroll. Asset valuation method: Investments are reported at fair (market) value. Amortization method and period: Level dollar, fixed period over 40 years, from July 1, 1994
through fiscal year 2034. Investment rate of return: 7.50%, net of pension plan administrative and investment expenses. Projected salary increases: Teachers 3.75–5.25% and non-teachers 3.40–6.50%, based on age. Inflation rate: 1.9%. Discount rate: 7.5%. Mortality rates based on RP-2000 Mortality Tables. Withdrawal rates: Teachers 1.2-30% and non-teachers 1.4-22.5%. Disability rates: 0-0.88%. Retirement age: An age-related assumption is used for participants not yet receiving payments. Retirement rates: 15-100%. Ad hoc cost-of-living increases in pensions are periodically granted by the Legislature. However,
the retirement system makes no automatic provision for such increases. Experience studies are performed at least once in every five-year period. The most recent experience study covered the period from July 1, 2005 to June 30, 2010. These assumptions will remain in effect for valuation purposes until such time as the CPRB adopts revised assumptions. The long-term expected rate of return on pension plan investments was determined using a building-block method in which best-estimate ranges of expected future real rates of return (expected returns, net of pension plan investment expense and inflation) are developed for each major asset class. These ranges are combined to produce the long-term expected rate of return by weighting the expected future real rates of return by the target asset allocation percentage and by adding expected inflation. Best estimates of the long-term arithmetic real rates of return for each major asset class included in STRS’ target asset allocation as of June 30, 2015, are summarized below.
Asset Class Long-term Expected Real
Rate of Return
Target Allocation
Domestic equity 7.0% 27.5% International equity 7.7% 27.5% Core fixed income 2.7% 7.5% High-yield fixed income 5.5% 7.5% Real estate 5.6% 10.0% Private equity 9.4% 10.0% Hedge funds 4.7% 10.0%

FAIRMONT STATE UNIVERSITY NOTES TO FINANCIAL STATEMENTS YEARS ENDED JUNE 30, 2016 AND 2015
52
12. RETIREMENT PLANS (CONTINUED)
Discount rate. The discount rate used to measure the total STRS pension liability was 7.50%. The projection of cash flows used to determine the discount rate assumed that State contributions will continue to follow the current funding policy. Based on those assumptions, STRS’ fiduciary net position was projected to be available to make all projected future benefit payments of current plan members. Therefore, the long-term expected rate of return on STRS’ investments was applied to all periods of projected benefit payments to determine the total pension liability. In the event of benefit payments that are not covered by the pension plan’s fiduciary net position, a municipal bond rate of 3.66% is to be used to discount the benefit payments not covered by the plan’s fiduciary net position. The rate equals the S&P Municipal Bond 20-Year High Grade Rate Index at June 30, 2015. Sensitivity of the net pension liability to changes in the discount rate. The following presents Fairmont State’s proportionate share of the STRS net pension liability as of June 30, 2016 calculated using the discount rate of 7.50%, as well as what Fairmont State’s STRS net pension liability would be if it were calculated using a discount rate that is one percentage point lower (6.50%) or one percentage point higher (8.50%) than the current rate.
1% Decrease (6.50%)
Current Discount Rate (7.50%)
1% Increase (8.50%)
Net pension liability $ 1,468,121 $ 1,132,445 $ 844,215
Pension Liabilities, Pension Expense, and Deferred Outflows of Resources and Deferred Inflows of Resources Related to Pensions The June 30, 2016 STRS net pension liability was measured as of June 30, 2015, and the total pension liability was determined by an actuarial valuation as of June 30, 2014, rolled forward to the measurement date of June 30, 2015. The June 30, 2015 STRS net pension liability was measured as of June 30, 2014, and the total pension liability was determined by an actuarial valuation as of June 30, 2013, rolled forward to the measurement date of June 30, 2014. At June 30, 2016, Fairmont State’s proportionate share of the STRS net pension liability was $3,716,422. Of this amount, Fairmont State recognized $1,132,445 as its proportionate share on the statement of net position. The remainder of $2,583,977 denotes Fairmont State’s proportionate share of net pension liability attributable to the special funding. At June 30, 2015, Fairmont State’s proportionate share of the STRS net pension liability was $4,504,098. Of this amount, Fairmont State recognized $1,381,799 as its proportionate share on the statement of net position. The remainder of $3,122,299 denotes Fairmont State’s proportionate share of net pension liability attributable to the special funding. The allocation percentage assigned to each participating employer and non-employer contributing entity is based on its proportionate share of employer and non-employer contributions to STRS for each of the fiscal years ended June 30, 2015 and 2014. Employer contributions are recognized when due. At the June 30, 2015 measurement date, Fairmont State’s proportion was 0.032680%, a decrease of 0.007374% from its proportion of 0.040054% calculated as of June 30, 2014.

FAIRMONT STATE UNIVERSITY NOTES TO FINANCIAL STATEMENTS YEARS ENDED JUNE 30, 2016 AND 2015
53
12. RETIREMENT PLANS (CONTINUED)
For the year ended June 30, 2016, Fairmont State recognized STRS pension expense of $189,742. Of this amount, $6,381 was recognized as Fairmont State’s proportionate share of the STRS expense and $183,361 as the amount of pension expense attributable to special funding from a non-employer contributing entity. Fairmont State also recognized revenue of $183,361 for support provided by the State. For the year ended June 30, 2015, Fairmont State recognized STRS pension expense of $241,289. Of this amount, $56,821 was recognized as Fairmont State’s proportionate share of the STRS expense and $184,468 as the amount of pension expense attributable to special funding from a non-employer contributing entity. Fairmont State also recognized revenue of $184,468 for support provided by the State. At June 30, 2016 and 2015, deferred outflows of resources and deferred inflows of resources related to the STRS pension are as follows.
June 30, 2016
Deferred Outflows of Resources
Deferred Inflows of Resources
Changes in proportion and difference between
employer contributions and proportionate share of contributions $ - $ 299,981
Net difference between projected and actual investment earnings - 47,796
Differences between expected and actual experience - 9,805
Contributions after the measurement date 93,303 - Total $ 93,303 $ 357,582
June 30, 2015
Deferred Outflows of Resources
Deferred Inflows of Resources
Changes in proportion and difference between
employer contributions and proportionate share of contributions $ - $ 89,328
Net difference between projected and actual investment earnings - 182,662
Contributions after the measurement date 148,605 - Total $ 148,605 $ 271,990

FAIRMONT STATE UNIVERSITY NOTES TO FINANCIAL STATEMENTS YEARS ENDED JUNE 30, 2016 AND 2015
54
12. RETIREMENT PLANS (CONTINUED)
Fairmont State will recognize the $93,303 reported as deferred outflows of resources resulting from pension contributions after the measurement date as a reduction of the STRS net pension liability in the year ended June 30, 2017. Other amounts reported as deferred outflows of resources and deferred inflows of resources related to pensions will be recognized in STRS pension expense as follows:
Fiscal Year Ended June 30, Amortization
2017 $ (61,190) 2018 (61,190) 2019 (61,190) 2020 (61,190) 2021 (61,190)
Thereafter (51,632) $ (357,582)
Payables to the Pension Plan Fairmont State did not report any amounts payable for normal contributions to the STRS as of June 30, 2016 and 2015. DEFINED CONTRIBUTION BENEFIT PLANS The TIAA-CREF and Educators Money are defined contribution benefit plans in which benefits are based solely upon amounts contributed, plus investment earnings. Employees who elect to participate in these plans are required to make a contribution equal to 6% of total annual compensation for the years ended June 30, 2016, 2015, and 2014. Fairmont State matches the employees’ 6% contribution. Contributions are immediately and fully vested. In addition, employees may elect to make additional contributions to TIAA-CREF and Educators Money, which are not matched by Fairmont State.
Total contributions to the TIAA-CREF for the years ended June 30, 2016, 2015, and 2014, were $2,533,362, $2,584,270, and $2,491,232, respectively, which consisted of equal contributions from Fairmont State and covered employees of $1,266,681, $1,292,135, and $1,245,616, respectively.
Total contributions to Educators Money for the years ended June 30, 2016, 2015, and 2014, were $131,098, $135,540, and $137,256, respectively, which consisted of equal contributions from Fairmont State and covered employees of $65,549, $67,770, and $68,628, respectively.
Fairmont State’s total payroll for the year ended June 30, 2016, was $26,431,773, and total covered employees’ salaries in the Educators Money, STRS, and TIAA-CREF were $1,092,481, $622,017, and $21,114,075, respectively.
Fairmont State’s total payroll for the year ended June 30, 2015, was $27,136,542, and total covered employees’ salaries in the Educators Money, STRS, and TIAA-CREF were $1,129,495, $998,972, and $21,532,219, respectively.

FAIRMONT STATE UNIVERSITY NOTES TO FINANCIAL STATEMENTS YEARS ENDED JUNE 30, 2016 AND 2015
55
12. RETIREMENT PLANS (CONTINUED)
Fairmont State’s total payroll for the year ended June 30, 2014, was $26,261,184, and total covered employees’ salaries in the Educators Money, STRS, and TIAA-CREF were $1,142,863, $1,226,834, and $20,747,802, respectively.
13. EARLY RETIREMENT INCENTIVE PLAN
Fairmont State’s BOG approved an Early Retirement Incentive Plan, made effective in August 2014 for those employees who elected to participate. Eligible faculty and staff members elected to participate in the plan during a specified period of time. In total, 22 Fairmont State faculty and staff members elected to participate and began the severance period on August 17, 2014. The severance dates extend to July 1, 2016 for a limited number of employees. Employees with 25 years of benefit-eligible service and any combination of age, for a total of 85 years or greater, qualified for 100% of their current base salary to be paid over a two-year period. Qualifying faculty and staff members with 15 to 24 years of benefit-eligible service qualify for a pro-rated amount of their current base salary to be paid over a two-year period. During fiscal years 2016 and 2015, Fairmont State paid benefits of the plan in the amounts of $583,969 and $225,800, respectively. Fairmont State’s liability to employees who elected to participate in the plan is $563,095 and $1,147,064 at June 30, 2016 and 2015, respectively. The current portion payable in fiscal year 2017 is $462,519. The noncurrent benefits estimated to be paid in fiscal years 2018 and 2019 are $97,649 and $2,927, respectively. In addition to the payments to participants in the plan, Fairmont State accrued a liability to the CPRB for costs associated with the plan in the amount of $343,111, which were paid during fiscal year 2016. Fairmont State intends to use estimated budget savings to offset the cost of the plan and estimates that realized savings to cover the cost of the plan will be achieved by June 30, 2019.
14. FAIRMONT STATE FOUNDATION, INC.
The Fairmont State Foundation, Inc. (the Foundation) is a separate nonprofit organization incorporated in the State whose purpose is to benefit the work and services of Fairmont State and Pierpont and their affiliated nonprofit organizations. The Foundation has a board of directors authorized to have 40 members selected by its Board members. At present, there are 26 members, including the President of Fairmont State as a nonvoting ex-officio member. In carrying out its responsibilities, the board of directors of the Foundation employs management, forms policy, and maintains fiscal accountability over funds administered by the Foundation. The economic resources of the Foundation do not entirely benefit Fairmont State. Since Pierpont was part of Fairmont State for many years, the Foundation has obtained resources designated for Pierpont’s programs and/or students. The Foundation currently supports both Fairmont State and Pierpont, and there is no specific allocation plan at this time. Fairmont State’s endowments are under the control and management of the Foundation. Accordingly, the financial statements of the Foundation are not included in the accompanying financial statements because it is not entirely or almost entirely for the benefit of Fairmont State.
The Foundation’s assets totaled $24,126,579 and $23,704,636 at June 30, 2016 and 2015, with net position of $24,059,529 and $23,549,718, respectively. Gifts, grants, and bequests to the Foundation totaled $2,673,509 and $2,135,385 in fiscal years 2016 and 2015, respectively.
Total funds expended by the Foundation in support of Fairmont State activities totaled $1,781,150 and $1,765,952 during 2016 and 2015, respectively.

FAIRMONT STATE UNIVERSITY NOTES TO FINANCIAL STATEMENTS YEARS ENDED JUNE 30, 2016 AND 2015
56
15. AFFILIATED ORGANIZATION
Fairmont State has a separately incorporated affiliated organization, the Fairmont State Alumni Association. Oversight responsibility for this entity rests with an independent board and management not otherwise affiliated with Fairmont State. Accordingly, the financial statements of this organization are not included in Fairmont State’s accompanying financial statements under the blended component unit requirements. It is not included in Fairmont State’s accompanying financial statements under the discretely presented component unit requirements as (1) it is not material, and (2) it has dual-purposes (i.e. not entirely or almost entirely for the benefit of Fairmont State).
16. RELATED-PARTY TRANSACTIONS
Fairmont State and Pierpont enter into an annual contractual agreement to establish the contractual services that will be provided by both institutions. These contract services are referred to as chargeback services and occur from each institution to the other. The definition of a chargeback service is a service provided from teaching, administrative, academic support, student services, and physical plant support areas of Fairmont State to Pierpont or vice versa. Chargeback services costs range from teaching services to everyday upkeep of the facilities. The chargeback agreement also provides for the transfer of auxiliary, capital, and student activity fee revenues from the institution in which the student is enrolled to the fund from which the operating, capital, and debt service expenditures will be paid. These transfers are primarily pledged revenues to bond funds and are required by bond covenants. A contractual agreement may be negotiated for services to be provided until the governing boards of both institutions mutually agree to end the contract agreement. Currently, a chargeback agreement for fiscal year 2016 has been negotiated and approved by the Boards of Governors of both Fairmont State and Pierpont. Additional information regarding these transactions may be found in the Component Parts Financial Data section of the Note to Schedules.
Fiscal years 2016 and 2015 transactions associated with the chargeback agreement are as follows:
2016 2015
Revenues: Student activity support revenue $ 57,386 $ 120,383 Auxiliary support service revenue 671,754 732,807 Faculty services revenue 409,893 554,985 Operating costs revenue 1,681,195 1,961,657 Support services revenue 1,815,814 2,426,549 E&G capital and debt service support revenue 619,008 718,643
Expenses: Assessment for faculty services 520,245 541,325 Assessment for operating costs 83,636 87,466 Assessment for support services 209,769 391,539 Assessment for E&G capital and debt service costs 686,627 700,034
Fairmont State does not show any expense for auxiliary support services due to its ownership of the auxiliaries.
FAIRMONT STATE UNIVERSITY NOTES TO FINANCIAL STATEMENTS YEARS ENDED JUNE 30, 2016 AND 2015
57
17. SEPARATION OF ASSETS AND LIABILITIES AGREEMENT
House Bill 3215, effective July 1, 2008, provided for a separate governing board for Pierpont. This new legislation defines a statewide network of independently-accredited community and technical colleges and required the newly established Pierpont Board of Governors and Fairmont State Board of Governors to jointly agree on a division of assets and liabilities. This agreement was executed on December 15, 2009, and was effective retroactively to July 1, 2009. The legislation requires a separate financial statement audit for Pierpont effective for fiscal year 2010 and all years thereafter.
The Board of Governors of Fairmont State University and the Board of Governors of Pierpont Community & Technical College recognize the historical association between the two institutions and the benefit of collaboration to the students. The preamble to the Separation of Assets and Liabilities Agreement that supports these statements reads as follows:
“The Board of Governors of Fairmont State University (BOG-FSU) and the Board of Governors of Pierpont Community and Technical College (BOG-PCTC) jointly endeavor to separate assets and liabilities in accordance with the provisions of HB3215, 2008. Despite the legal separation of the two institutions, the BOG-FSU and the BOG-PCTC wish to maintain the collaborative and cooperative spirit that has characterized the historical relationship between the University and the College.
The BOG-FSU and the BOG-PCTC recognize the historical association between the two institutions. The institution that is today Pierpont Community and Technical College grew from and was sponsored by Fairmont State University. Both institutions have been and, for the foreseeable future, will be co-located on a single campus in Fairmont, West Virginia. Both institutions have proportionally coordinated, shared, and paid for instructional services, course schedules, facilities, information systems, admissions processes, auxiliary functions, housing, debt service, development and advancement services, student activities and programs, and all the other resources necessary to deliver a high-quality postsecondary education experience.
Students have benefited and will continue to benefit from the relationship between Fairmont State University (FSU) and Pierpont Community and Technical College (PCTC). Those benefits include a wider range of instructional programs than would be available through an individual institution’s offerings; a lower cost of attendance realized from shared institutional infrastructure and reduced duplication of facilities, personnel, and services; and a more diverse mix of student backgrounds, interests, experiences, abilities, and ambitions.
Although the BOG-FSU and the BOG-PCTC recognize the necessity of separation of assets and liabilities, both pledge themselves to continuing, fostering, and promoting collaborative and cooperative relationships between the two institutions. Such relations respect the historical association that has existed between FSU and PCTC. Such relations are to the benefit and best interest of the students at both institutions. Such relations recognize the proportional participation in institutional operations. Such relations recognize that the two institutions have been, are, and will be co-located on one site. Such relations demonstrate responsible stewardship of public resources by achieving efficiencies and synergies that would otherwise not be possible. Therefore, the Board of Governors of Fairmont State University and the Board of Governors of Pierpont Community and Technical College incorporate into their agreement to separate assets and liabilities this pledge of perpetual cooperation and collaboration.”

FAIRMONT STATE UNIVERSITY NOTES TO FINANCIAL STATEMENTS YEARS ENDED JUNE 30, 2016 AND 2015
58
17. SEPARATION OF ASSETS AND LIABILITIES AGREEMENT (CONTINUED)
With both Fairmont State and Pierpont Boards of Governors promoting collaboration, the Separation of Assets and Liabilities Agreement was executed to comply with the guidelines established through West Virginia Legislation as stated in the agreement as follows:
“WHEREAS, West Virginia Code - §18B-2A-7a(e)(2008 supp.) states “For purposes of generating audited financial statements for inclusion in the higher education fund and state single audits, the division of all assets and liabilities shall be effective retroactively to the first day of July, two thousand nine.”
and
WHEREAS, West Virginia Code — §18B-2A-7a(2008 supp.) states as follows:
“(g) Each former sponsoring institution and community and technical college shall enter into a comprehensive agreement to address the division of assets and liabilities and the allocation of revenues and expenditures between former sponsoring institutions and newly independent community and technical colleges.
(h) Absent manifest injustice as determined jointly by the Council and Commission, the following general principles apply to the division of assets and liabilities and allocation of revenues and expenditures between former sponsoring institutions and the newly independent community and technical colleges:
(1) For accounting purposes, the institution that assumes responsibility for any asset also shall assume responsibility for any associated liabilities.
(2) Although one institution may assume responsibility for an asset and associated liabilities for accounting purposes, both institutions shall agree on their respective responsibilities for reducing and ultimately eliminating the liability over time if the asset was originally acquired and/or is being used for the benefit of both institutions.
(A) Any agreement to allocate system and institutional educational and general and auxiliary debt service payments shall be consistent with the provisions of all applicable bond covenants.
(B) Absent a controlling bond covenant or other agreement, debt service payments associated with bond indebtedness presumptively shall be allocated based on the relative full-time equivalent student enrollment of the two institutions either as a whole or on the campus where the asset is located and may be adjusted annually to reflect enrollment changes at the two institutions.
(3) The institutions shall agree to allocate educational and auxiliary capital fees in excess of those needed to cover bonded indebtedness to ensure that assets of both institutions are maintained in proper repair and that the institutions assume responsibility for a reasonable share of the total costs of maintaining the facilities.
(4) The institutions shall develop a plan that ensures the financial stability of auxiliary enterprises, including but not limited to, student housing, student centers, dining services, parking, and athletics through fiscal year two thousand twelve.

FAIRMONT STATE UNIVERSITY NOTES TO FINANCIAL STATEMENTS YEARS ENDED JUNE 30, 2016 AND 2015
59
17. SEPARATION OF ASSETS AND LIABILITIES AGREEMENT (CONTINUED)
(A) If community and technical college students pay a mandatory athletics fee for the benefit of a sponsoring institution, but receive no direct benefit from that fee, the community and technical college may phase out that fee over a five-year period.
(B) If certain community and technical college students were required to live in institution housing consistent with rules or policies in effect on the effective date of this section, the former sponsoring institution may continue to require these students to live in institution housing for at least one year.”
The Agreement also provides specific language in relation to outstanding bond indebtedness.
On June 12, 2012, Fairmont State, in conjunction with Pierpont, issued Revenue Refunding Bonds, Series 2012A in the principal amount of $20,165,000 and Revenue Refunding Bonds, Series 2012B in the principal amount of $30,160,000. Pierpont Board of Governors signed the Bond Indenture to evidence its agreement to certain covenants contained in the Indenture, which are applicable to Pierpont and to the pledge of fees imposed by it. The Official Statement for the bonds states “Pierpont is obligated to pay a portion of the debt service on the Series 2012 Bonds pursuant to a Separation of Assets and Liabilities Agreement, dated December 15, 2009, by and between the Issuer and Pierpont.”
The Official Statement provides information to further explain the Separation of Assets Agreement and the application of it to all existing and future bond covenants.
Therefore, the Agreement pertains to the following current outstanding bond indebtedness:
(A) Revenue Refunding Bonds 2012, Series A and Revenue Refunding Bonds 2012, Series B - On June 12, 2012, Fairmont State, in conjunction with Pierpont, issued Revenue Refunding Bonds Series A and Revenue Refunding Bonds Series B (the 2012 Bonds) amounting to $20,165,000 and $30,160,000, respectively. The 2012A Bonds were issued to (1) currently refund in full the outstanding 2002A and 2002B Bonds, and (2) pay the costs of issuance of the Series 2012A Bonds and related costs. The 2012 Bonds were issued to (1) advance refund in full the outstanding 2003A and 2003B Bonds, and (2) pay the costs of issuance of the Series 2012B Bonds and related costs.
(B) Fairmont State Board of Governors Subordinate Facilities Improvement Revenue Bonds, Series 2006 (the Series 2006 Bonds; the Series 2002A Bonds, the Series 2002B Bonds, the Series 2003A Bonds, the Series 2003B Bonds, and the Series 2006 Bonds are hereinafter referred to together as the Bonds), issued in the principal amount of $8,500,000 pursuant to a bond authorizing resolution adopted on May 3, 2006 (as supplemented and amended, the 2006 Resolution; the 2002A Indenture, the 2002B Indenture, the 2003A Indenture, the 2003B Indenture, and the 2006 Resolution, together with the other documents authorizing, securing or otherwise relating to the Bonds, are hereinafter referred to together as the Bond Documents), and currently outstanding in the principal amount of $5,113,038 and $5,517,429 updated as of June 30, 2016 and 2015, respectively.
The agreement further states the following with regard to bond indebtedness:
“WHEREAS, in addition to the statutory requirements described above, the Bond Documents define the College or University to include any successor thereto and, as such, bind both FSU and PCTC, and both FSU and PCTC have copies of the Bond Documents.

FAIRMONT STATE UNIVERSITY NOTES TO FINANCIAL STATEMENTS YEARS ENDED JUNE 30, 2016 AND 2015
60
17. SEPARATION OF ASSETS AND LIABILITIES AGREEMENT (CONTINUED)
and
WHEREAS, the Bond Documents set forth controlling bond covenants and require pledged revenues, and the intent of this document is to adhere to all existing and future bond covenants.”
The Boards of Governors of Fairmont State and Pierpont agreed to the following terms for Separation of Assets and Liabilities to comply with the above stated West Virginia State Code and bond covenants:
“Education and General Equipment Assets:
1. Equipment assets regardless of whether they are charged back, whether they be presently owned or purchased in the future by either the FSU or the PCTC will be owned by the institution that the equipment was intended for and reflected on the appropriate institution’s equipment schedule.
Education and General Buildings and Infrastructure:
1. All capital and infrastructure fees assessed to both FSU and PCTC students for the purpose of paying E&G building and infrastructure bonds, and provide for repair and renovation of same, continue to be collected under the terms outlined in the bond covenants.
2. All E&G Capital Fee Revenue and Infrastructure Capital Fee Revenue in excess of bond payments will be used for repair and renovation projects. When sufficient E&G and Infrastructure Capital excess revenues are available to bond for additional new capital project improvements, the E&G, and Infrastructure Capital Fees will be utilized and/or retained for that specific purpose. Both the FSU and the PCTC assume a shared responsibility proportionate to the full-time equivalent (FTE) enrollment of each institution for the total cost of maintaining the facilities.
3. Joint ownership of the E&G and Infrastructure Capital Assets and Liabilities shall be reflected on each Institution’s Financial Statements at the end of each year. The percentage of ownership of assets and liabilities will be assigned and based on the average fall term census date credit hour enrollments (FTE) over the most recent ten (10) years.
4. All land assets will be owned by FSU and land deeds will stay in the name of FSU Board of Governors.
5. Should either institution, after paying off all E&G and Auxiliary bond debt, upon proper acknowledgement of its ongoing obligations under existing bond covenants, decide to build and move its own campus, that institution agrees to sell its ownership rights to the E&G building assets to the other institution at an agreed upon price.
6. All new capital projects that are provided to FSU and PCTC through state appropriations, bonding and/or student capital fee initiatives, that add to the joint ownership of assets and liabilities on a shared campus, will be assigned proportionately based on the average fall term census date credit hour enrollments (FTE) over the most recent ten (10) years. Any capital project designated to only FSU or only to PCTC and not located on a shared campus will be added to the assets and liabilities of the institution to which the capital project is specified.

FAIRMONT STATE UNIVERSITY NOTES TO FINANCIAL STATEMENTS YEARS ENDED JUNE 30, 2016 AND 2015
61
17. SEPARATION OF ASSETS AND LIABILITIES AGREEMENT (CONTINUED)
Auxiliary Enterprises:
1. Assets and related liabilities of the Auxiliary Enterprises (Athletics, Bookstore, Conference Center, Convenience Store, Copy Center, Facilities [Parking & Security], Housing, and Recreation Center) are owned by FSU and all students of both FSU and PCTC who attend class on the main campus and/or pay user fees will have access to these facilities and activities.
2. All auxiliary-related student fees approved by the FSU BOG and the PCTC BOG and the Higher Education Policy Commission and the Community and Technical College Council, for the operation, debt service, and repair and maintenance of auxiliary enterprise facilities will be dedicated and provided to those specific Auxiliary Funds for appropriate indicated purposes. All Auxiliary net revenues annually are designated to support future costs of the auxiliary enterprise fund(s) and are managed by FSU for the benefit of each auxiliary enterprise.
3. Auxiliary Enterprise Bond Covenant obligations of FSU and PCTC will be met by continuing to honor the requirements stipulated in those covenants, and both FSU and PCTC students will be required to pay the fees stipulated in all Bond Document covenants.
4. FSU is responsible for managing the operation of the Auxiliary Enterprises, and maintaining the Auxiliary facilities in good repair.
5. All capital projects for the Auxiliary Enterprises will be approved by the FSU BOG.
6. Scholarship dollars provided from the non-athletic auxiliary enterprise funds will be allocated proportionately to FSU and PCTC students based on the percentage (%) of student fee contributions made to these funds from the respective FSU and PCTC students.
The agreement further specifies the methodology for the assignment of bond debt as follows:
“The Bond Debt assigned to each institution’s balance sheet for E&G facilities is allocated based on the average of the past ten (10) years of credit hour enrollments. This average allocated 65.66% of the debt to FSU and 34.34% to the PCTC as of July 1, 2009. The assignment of debt for the Auxiliary facilities will be with the FSU since the FSU will own the assets. However, the PCTC students will continue to pay all Auxiliary fees based on the requirements of those bonds. The allocation of Bond Debt by this Agreement does not affect the obligation of both FSU and PCTC to the bondholders to pay the principal of and interest on the Bonds as the same come due.”
As of June 30, 2016, the average allocated 66.63% of the debt to Fairmont State and 33.37% of the debt to Pierpont. As of June 30, 2015, the average allocated 66.39% of the debt to Fairmont State and 33.61% of the debt to Pierpont.
The Series 2012A and Series 2012B continuing disclosure agreement provides for disclosure of annual financial information to the Trustee and bond-rating agencies. This information includes the audited financial statements of Fairmont State and the audited financial statements of Pierpont. The Series 2015A Bonds also require continuing disclosure; however, they were issued by Fairmont State, and fees imposed by Pierpont do not secure the 2015A Bonds.

FAIRMONT STATE UNIVERSITY NOTES TO FINANCIAL STATEMENTS YEARS ENDED JUNE 30, 2016 AND 2015
62
17. SEPARATION OF ASSETS AND LIABILITIES AGREEMENT (CONTINUED)
The financial statements have been prepared to comply with the Separation of Assets and Liabilities Agreement.
18. CONTINGENCIES
The nature of the educational industry is such that, from time to time, claims will be presented against Fairmont State on account of alleged negligence, acts of discrimination, breach of contract, or disagreements arising from the interpretation of laws or regulations. While some of these claims may be for substantial amounts, they are not unusual in the ordinary course of providing educational services in a higher education system. In the opinion of management, all known claims are covered by insurance or are such that an award against Fairmont State would not seriously affect the financial position of Fairmont State.
Under the terms of federal grants, periodic audits are required, and certain costs may be questioned as not being appropriate expenditures under the terms of the grants. Such audits could lead to reimbursement to the grantor agencies. Fairmont State’s management believes disallowances, if any, will not have a significant financial impact on Fairmont State’s financial position.
The Internal Revenue Code of 1986 establishes rules and regulations for arbitrage rebates. There are no arbitrage rebate liabilities that have been recorded in the financial statements as of June 30, 2016 and 2015, respectively.
Fairmont State owns various buildings that are known to contain asbestos. Fairmont State is not required by federal, state, or local laws to remove the asbestos from its buildings. Fairmont State is required by federal environmental, health, and safety regulations to manage the presence of asbestos in its buildings in a safe condition. Fairmont State addresses its responsibility to manage the presence of asbestos in its buildings on a case-by-case basis. Significant problems of dangerous asbestos conditions are abated as the conditions become known. Fairmont State also addresses the presence of asbestos as building renovation or demolition projects are undertaken and through asbestos operation and maintenance programs directed at containing, managing, or operating with the asbestos in a safe condition.
19. SERVICE CONCESSION AGREEMENTS
Fairmont State has adopted GASB Statement No. 60. Fairmont State has identified two contracts for services that meet the four criteria of a Service Concession Agreement (SCA). An SCA is defined as a contract between a government and an operator, another government, or a private entity, in which the operator provides services, the operator collects and is compensated by fees from third parties, the government still has control over the services provided, and the government retains ownership of the assets at the end of the contract. The contracts are with Aladdin Food Management Services, LLC (Aladdin) and Follett Higher Education Group (Follett). The management of Fairmont State entered into these agreements to improve the quality of the services to students while increasing the revenues from these operations to support the Falcon Center operating budget.

FAIRMONT STATE UNIVERSITY NOTES TO FINANCIAL STATEMENTS YEARS ENDED JUNE 30, 2016 AND 2015
63
19. SERVICE CONCESSION AGREEMENTS (CONTINUED)
In the agreement with Aladdin that was effective on July 1, 2008, Fairmont State granted to Aladdin the exclusive right to provide food products and nonalcoholic beverages at its food service facilities. Aladdin provides food service in the Falcon Center, Nickel Snack Bar, Conference Center, Coffee Shop, Cafeteria, concessions, soda, snack, and food vending at mutually agreed-upon locations for Fairmont State. Aladdin operates the food service operation under a contract fee agreement. Aladdin is paid a fixed administrative fee that increases 5% per year. Aladdin provides vendor contract revenues to Fairmont State based on contractual agreement. The vendor contract revenue from Aladdin in fiscal years 2016 and 2015 were $1,026,280 and $922,301, respectively. Aladdin also provides $75,000 annually to Fairmont State and Pierpont during the term of the agreement for student scholarships. The scholarships are split between Fairmont and Pierpont based on FTE. The bookstore operating agreement was entered into on April 14, 2011 between Fairmont State and Follett. The agreement is for Follett to operate a bookstore for Fairmont State. The contract is for a period of 10 years and may be renewed if both parties agree. Fairmont State will cover the cost of store remodeling as required by Follett in order to properly operate and prepare store premises for business up to $50,000 over the term of the agreement. Follett pays commission to Fairmont State based on the contractual agreement. Follett provided vendor contract revenues to Fairmont State in fiscal year 2016 and 2015 in the amount of $263,273 and $280,982, respectively. In addition to the commission, Follett pays rent of $60,000 per year in monthly installments for rental of the space in the Falcon Center. Follett also provides $15,000 annually to Fairmont State and Pierpont during the term of the agreement for student scholarships. The scholarships are split between Fairmont and Pierpont based on FTE.
20. SEGMENT INFORMATION
Under the auspices of the State and the Board of Governors of Fairmont State (formerly Fairmont State College), Fairmont State issued revenue bonds to finance certain of their auxiliary enterprise and facilities improvement activities. Investors in the auxiliary bonds rely solely on the revenues generated by the activities of the auxiliaries for repayment. The Board of Governors of Fairmont State recognizes that it is bound by all bond covenants and is legally obligated for the bond debt payments. The facilities improvement bonds are special obligations of Fairmont State and payable from system fees held under the Indenture.
The Separation of Assets and Liabilities Agreement between the Boards of Governors of Fairmont State and Pierpont binds both Fairmont State and Pierpont to the debt obligation and is stated as:
“WHEREAS, in addition to the statutory requirements described above, the Bond Documents define the College or University to include any successor thereto and, as such, bind both FSU & PCTC, and both FSU & PCTC have copies of the Bond Documents.”

FAIRMONT STATE UNIVERSITY NOTES TO FINANCIAL STATEMENTS YEARS ENDED JUNE 30, 2016 AND 2015
64
20. SEGMENT INFORMATION (CONTINUED)
Descriptive information for each of Fairmont State’s segments is shown below:
a. Revenue Refunding Bonds 2012, Series A and Revenue Refunding Bonds 2012, Series B
On June 12, 2012, Fairmont State, in conjunction with Pierpont, issued Revenue Refunding Bonds Series A and Revenue Refunding Bonds Series B (the 2012 Bonds) amounting to $20,165,000 and $30,160,000, respectively. The 2012A Bonds were issued to (1) currently refund in full the outstanding 2002A and 2002B Bonds and (2) pay the costs of issuance of the Series 2012A Bonds and related costs. The 2012B Bonds were issued to (1) advance refund in full the outstanding 2003A and 2003B Bonds and (2) pay the costs of issuance of the Series 2012B Bonds and related costs.
The 2012A Bonds outstanding consist of $10,720,000 serial bonds with varying interest rates from 2% to 5%, which mature serially through June 1, 2027, and term bonds as follows:
Principal Maturity Interest Amount Date Rate
$ 2,430,000 June 1, 2029 3.600% $ 4,035,000 June 1, 2032 3.450%
The 2012B Bonds outstanding consist of $16,060,000 serial bonds with varying interest rates from 2% to 5%, which mature serially through June 1, 2027, and term bonds as follows:
Principal Maturity Interest Amount Date Rate
$ 1,000,000 June 1, 2032 3.450% $ 8,650,000 June 1, 2032 4.080%
Fairmont State and Pierpont have fixed, and will maintain, just and equitable rules, regulations, rents, charges, and fees for the use and occupancy of apartments, housing and parking facilities, and the student activities center. Fairmont State and Pierpont must fix rents, charges, and fees to produce revenues from these sufficient to pay operating expenses and to make the prescribed payments into the funds and accounts created under the Indenture, and such schedule of rents, charges, and fees shall be revised from time to time to provide for all reasonable operating expenses and provide gross operating revenues equal to at least 100% of maximum annual debt service for the 2012 Bonds and the 2015 Bonds combined. For the years ended June 30, 2016 and 2015, Fairmont State and Pierpont had gross revenues, as defined by the Indenture, that approximated 235% and 303% of the maximum annual debt service, respectively.
b. Board of Governors of Fairmont State, Facilities Improvement Revenue Bonds, 2006 Series
On May 9, 2006, Fairmont State issued Facilities Improvement Revenue Bonds (the 2006 Bonds) amounting to $8,500,000. The 2006 Bonds were issued to (1) finance the design, acquisition, construction, and equipping of certain necessary improvements in the facilities of the main campus, including, but not limited to, a technology wing addition/renovation and elevator/HVAC improvements to infrastructure improvements, all of which will be owned by the Boards, and (2) pay the costs of issuance of the 2006 Bonds and related costs.

FAIRMONT STATE UNIVERSITY NOTES TO FINANCIAL STATEMENTS YEARS ENDED JUNE 30, 2016 AND 2015
65
20. SEGMENT INFORMATION (CONTINUED)
The 2006 Bonds outstanding are $5,113,038 at June 30, 2016. The 2006 Bonds incurred interest at the rate of 4.18% until (but not including) May 1, 2016. On May 1, 2016, the interest rate on the 2006 Bonds automatically adjusted to the reset rate of 1.74% and shall bear the reset rate from May 1, 2016 to maturity.
c. Board of Governors of Fairmont State, Facilities Construction Revenue Bonds, 2015A Series
On April 7, 2015, Fairmont State issued Facilities Construction Revenue Bonds Series A (the 2015A Bonds) amounting to $30,200,000. The 2015A Bonds were issued to (1) finance the costs of planning, designing, constructing, acquiring, and equipping new student housing facilities; (2) provide payment of capitalized interest on the Series 2015 Bonds; (3) reimburse certain previously incurred expenditures related to the 2016 Project; and (4) pay the costs of issuance of the Series 2015 Bonds and related costs.
The 2015A Bonds outstanding consist of $10,630,000 serial bonds with varying interest rates from 1.75% to 5.00%, which mature serially from June 1, 2017 to June 1, 2030, and term bonds as follows:
Principal Maturity Interest Amount Date Rate
$ 2,045,000 June 1, 2032 3.500% $ 3,345,000 June 1, 2035 3.625%
$ 14,180,000 June 1, 2045 3.750%
Fairmont State has pledged all university fees as defined in the Indenture. University fees are the amounts remaining from the system fees after Fairmont State and Pierpont have (1) fulfilled their obligations with respect to the Commission bonds during each six-month period and (2) fulfilled their debt obligations of the Series 2006 bonds. All remaining university fees are allocated for the repair and replacement of the facilities financed with the system bonds.
Condensed financial information for each of Fairmont State’s segments as of and for the years ended June 30, 2016 and 2015 is as follows:
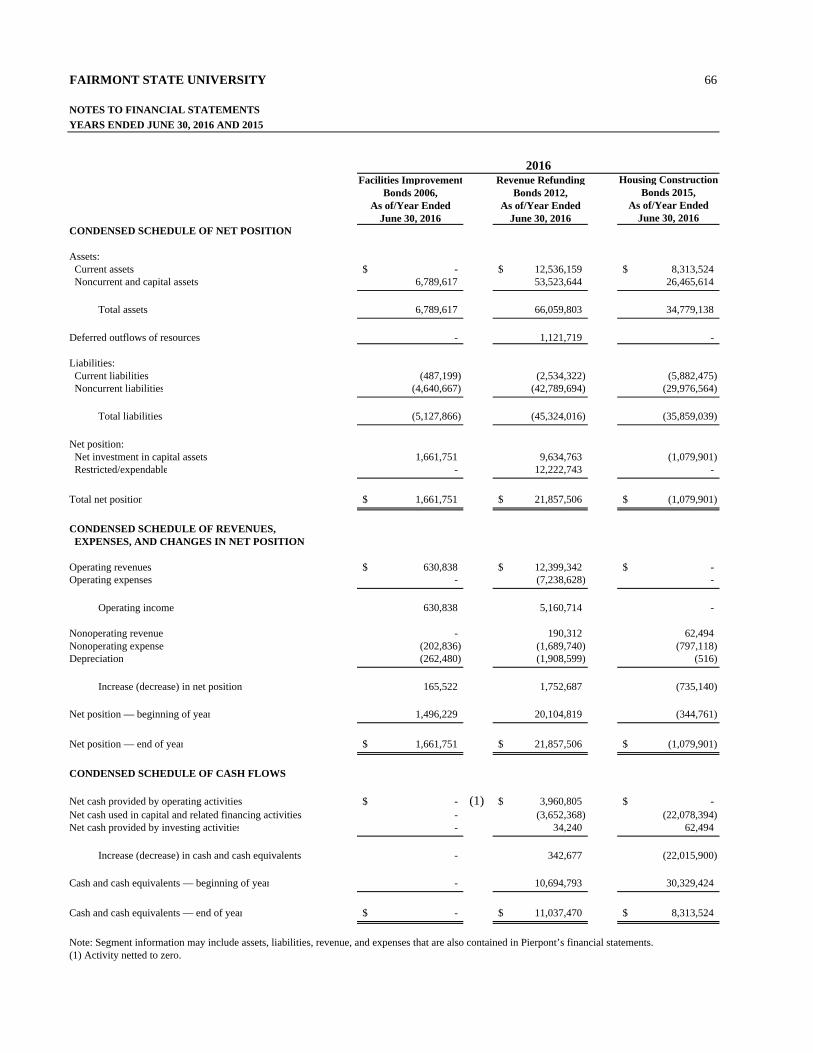
FAIRMONT STATE UNIVERSITY 66
NOTES TO FINANCIAL STATEMENTS
YEARS ENDED JUNE 30, 2016 AND 2015
Facilities Improvement Revenue Refunding Housing ConstructionBonds 2006, Bonds 2012, Bonds 2015,
As of/Year Ended As of/Year Ended As of/Year EndedJune 30, 2016 June 30, 2016 June 30, 2016
CONDENSED SCHEDULE OF NET POSITION
Assets: Current assets -$ 12,536,159$ 8,313,524$ Noncurrent and capital assets 6,789,617 53,523,644 26,465,614
Total assets 6,789,617 66,059,803 34,779,138
Deferred outflows of resources - 1,121,719 -
Liabilities: Current liabilities (487,199) (2,534,322) (5,882,475) Noncurrent liabilities (4,640,667) (42,789,694) (29,976,564)
Total liabilities (5,127,866) (45,324,016) (35,859,039)
Net position: Net investment in capital assets 1,661,751 9,634,763 (1,079,901) Restricted/expendable - 12,222,743 -
Total net position 1,661,751$ 21,857,506$ (1,079,901)$
CONDENSED SCHEDULE OF REVENUES, EXPENSES, AND CHANGES IN NET POSITION
Operating revenues 630,838$ 12,399,342$ -$ Operating expenses - (7,238,628) -
Operating income 630,838 5,160,714 -
Nonoperating revenue - 190,312 62,494 Nonoperating expense (202,836) (1,689,740) (797,118) Depreciation (262,480) (1,908,599) (516)
Increase (decrease) in net position 165,522 1,752,687 (735,140)
Net position — beginning of year 1,496,229 20,104,819 (344,761)
Net position — end of year 1,661,751$ 21,857,506$ (1,079,901)$
CONDENSED SCHEDULE OF CASH FLOWS
Net cash provided by operating activities -$ (1) 3,960,805$ -$ Net cash used in capital and related financing activities - (3,652,368) (22,078,394) Net cash provided by investing activities - 34,240 62,494
Increase (decrease) in cash and cash equivalents - 342,677 (22,015,900)
Cash and cash equivalents — beginning of year - 10,694,793 30,329,424
Cash and cash equivalents — end of year -$ 11,037,470$ 8,313,524$
Note: Segment information may include assets, liabilities, revenue, and expenses that are also contained in Pierpont’s financial statements. (1) Activity netted to zero.
2016

FAIRMONT STATE UNIVERSITY 67
NOTES TO FINANCIAL STATEMENTS
YEARS ENDED JUNE 30, 2016 AND 2015
Facilities Improvement Revenue Refunding Housing ConstructionBonds 2006, Bonds 2012, Bonds 2015,
As of/Year Ended As of/Year Ended As of/Year EndedJune 30, 2015 June 30, 2015 June 30, 2015
CONDENSED SCHEDULE OF NET POSITION
Assets: Current assets -$ 11,964,169$ 1,924,234$ Noncurrent and capital assets 7,052,097 54,648,211 29,096,883
Total assets 7,052,097 66,612,380 31,021,117
Deferred outflows of resources - 1,191,948 -
Liabilities: Current liabilities (442,830) (2,663,571) (796,542) Noncurrent liabilities (5,113,038) (45,035,938) (30,569,336)
Total liabilities (5,555,868) (47,699,509) (31,365,878)
Net position: Net investment in capital assets 1,496,229 8,697,055 (344,761) Restricted/expendable - 11,407,764 -
Total net position 1,496,229$ 20,104,819$ (344,761)$
CONDENSED SCHEDULE OF REVENUES, EXPENSES, AND CHANGES IN NET POSITION
Operating revenues 630,838$ 11,075,511$ -$ Operating expenses - (5,840,972) -
Operating income 630,838 5,234,539 -
Nonoperating revenue - 16,708 11,195 Nonoperating expense (240,131) (1,777,773) (355,956) Depreciation (293,514) (1,908,122) -
Increase (decrease) in net position 97,193 1,565,352 (344,761)
Net position — beginning of year 1,399,036 18,539,467 -
Net position — end of year 1,496,229$ 20,104,819$ (344,761)$
CONDENSED SCHEDULE OF CASH FLOWS
Net cash provided by operating activities -$ (1) 5,265,322$ -$ Net cash used in (provided by) capital and related financing activities - (5,663,945) 30,329,424 Net cash provided by investing activities - 14,458 -
(Decrease) increase in cash and cash equivalents - (384,165) 30,329,424
Cash and cash equivalents — beginning of year - 11,078,958 -
Cash and cash equivalents — end of year -$ 10,694,793$ 30,329,424$
Note: Segment information may include assets, liabilities, revenue, and expenses that are also contained in Pierpont’s financial statements. (1) Activity netted to zero.
2015

68
FA
IRM
ON
T S
TA
TE
UN
IVE
RS
ITY
NO
TE
S T
O F
INA
NC
IAL
ST
AT
EM
EN
TS
YE
AR
S E
ND
ED
JU
NE
30,
201
6 A
ND
201
5
21.
NA
TU
RA
L C
LA
SS
IFIC
AT
ION
S W
ITH
FU
NC
TIO
NA
L C
LA
SS
IFIC
AT
ION
S
Ope
rati
ng e
xpen
ses
wit
hin
both
nat
ural
and
fun
ctio
nal c
lass
ific
atio
ns f
or th
e ye
ars
ende
d Ju
ne 3
0, 2
016
and
2015
, are
rep
rese
nted
as
foll
ows:
Fee
sS
alar
ies
Su
pp
lies
Ass
essm
ent
Ass
essm
ent
Ass
essm
ent
Ass
esse
dan
dan
dfo
r F
acu
lty
for
Op
erat
ing
for
Su
pp
ort
Loa
nb
y th
eF
un
ctio
nW
ages
Ben
efit
sO
ther
sU
tili
ties
Sch
olar
ship
sD
epre
ciat
ion
Ser
vice
sC
osts
Ser
vice
sC
ance
llat
ion
sC
omm
issi
onT
otal
Aux
ilia
ry e
nter
pris
es2,
981,
093
$
706,
225
$
3,47
8,06
6$
1,
106,
786
$
-$
-
$
-$
-
$
-
$
-
$
-$
8,27
2,17
0$
In
stru
ctio
n12
,887
,660
2,94
1,51
0
2,02
8,89
6
3,02
1
-
-
52
0,24
5
72
,042
70
,382
-
-
18
,523
,756
Res
earc
h53
,673
3,00
3
47
,943
-
-
-
-
-
-
-
-
104,
619
Pub
lic
serv
ice
314,
494
68,7
91
194,
805
-
-
-
-
-
-
-
-
578,
090
Aca
dem
ic s
uppo
rt2,
170,
298
54
7,90
8
1,43
5,94
4
-
-
-
-
11
,594
13
9,38
7
-
-
4,
305,
131
S
tude
nt s
ervi
ces
3,13
7,85
8
792,
925
1,
578,
737
-
-
-
-
-
-
-
-
5,
509,
520
G
ener
al in
stit
utio
nal s
uppo
rt3,
439,
668
1,
151,
071
2,
459,
417
1,
092
-
-
-
-
-
-
171,
873
7,
223,
121
S
tude
nt f
inan
cial
aid
207,
234
44,6
78
-
-
6,97
3,92
1
-
-
-
-
-
-
7,
225,
833
O
pera
tion
and
mai
nten
ance
1,37
4,46
8
410,
789
1,
751,
800
1,
450,
777
-
-
-
-
-
-
-
4,98
7,83
4
Dep
reci
atio
n-
-
-
-
-
3,89
2,19
8
-
-
-
-
-
3,89
2,19
8
Loa
n ca
ncel
lati
ons
and
wri
te-o
ffs
-
-
-
-
-
-
-
-
-
38
5,45
9
-
385,
459
TO
TA
L26
,566
,446
$
6,66
6,90
0$
12,9
75,6
08$
2,
561,
676
$
6,97
3,92
1$
3,89
2,19
8$
520,
245
$
83,6
36$
209,
769
$
38
5,45
9$
171,
873
$
61
,007
,731
$
Fee
sS
alar
ies
Su
pp
lies
Ass
essm
ent
Ass
essm
ent
Ass
essm
ent
Ass
esse
dan
dan
dfo
r F
acu
lty
for
Op
erat
ing
for
Su
pp
ort
Loa
nb
y th
eF
un
ctio
nW
ages
Ben
efit
sO
ther
sU
tili
ties
Sch
olar
ship
sD
epre
ciat
ion
Ser
vice
sC
osts
Ser
vice
sC
ance
llat
ion
sC
omm
issi
onT
otal
Aux
ilia
ry e
nter
pris
es2,
948,
430
$
744,
676
$
3,11
2,73
4$
1,
111,
931
$
-$
-
$
-$
-
$
-
$
-
$
-$
7,91
7,77
1$
In
stru
ctio
n12
,926
,704
2,98
1,25
7
1,69
5,99
4
4,63
3
-
-
54
1,32
5
75
,781
24
4,79
7
-
-
18
,470
,491
Res
earc
h43
,602
2,13
5
62
,679
-
-
-
-
-
-
-
-
108,
416
Pub
lic
serv
ice
257,
591
46,5
58
84,6
50
-
-
-
-
-
-
-
-
38
8,79
9
A
cade
mic
sup
port
2,57
3,09
7
641,
156
1,
446,
438
-
-
-
-
11,6
85
146,
742
-
-
4,81
9,11
8
Stu
dent
ser
vice
s3,
404,
771
83
2,96
0
1,64
5,18
5
-
-
-
-
-
-
-
-
5,88
2,91
6
Gen
eral
inst
itut
iona
l sup
port
3,13
9,80
4
2,80
2,23
2
2,42
1,85
2
1,89
4
-
-
-
-
-
-
17
9,87
5
8,54
5,65
7
Stu
dent
fin
anci
al a
id-
42
,739
15
,712
-
6,94
0,21
4
-
-
-
-
-
-
6,
998,
665
O
pera
tion
and
mai
nten
ance
1,48
6,65
4
443,
135
1,
914,
829
1,
393,
004
-
-
-
-
-
-
-
5,23
7,62
2
Dep
reci
atio
n-
-
-
-
-
3,93
6,35
2
-
-
-
-
-
3,93
6,35
2
Loa
n ca
ncel
lati
ons
and
wri
te-o
ffs
-
-
-
-
-
-
-
-
-
38
0,74
1
-
380,
741
TO
TA
L26
,780
,653
$
8,53
6,84
8$
12,4
00,0
73$
2,
511,
462
$
6,94
0,21
4$
3,93
6,35
2$
541,
325
$
87,4
66$
391,
539
$
38
0,74
1$
179,
875
$
62
,686
,548
$
2016
2015

69
ADDITIONAL INFORMATION

FAIRMONT STATE UNIVERSITY 70
SCHEDULE OF NET POSITION INFORMATIONJUNE 30, 2016
Board of Unrestricted,Governors Restricted, and Internal
Support Auxiliary Other Fund TotalALL FUNDS Fund Funds Funds Eliminations Institution
ASSETS AND DEFERRED OUTFLOWS
CURRENT ASSETS: Cash and cash equivalents 4,249,298$ 16,631,431$ 14,583,160$ -$ 35,463,889$ Accounts receivable — net 10,438 231,994 1,807,040 (856,219) 1,193,253 Due from Pierpont for debt service — current portion 242,227 - - - 242,227 Loans to students — current portion - - 174,758 - 174,758 Inventories - - 162,895 - 162,895 Other current assets - - 20,448 - 20,448
Total current assets 4,501,963 16,863,425 16,748,301 (856,219) 37,257,470
NONCURRENT ASSETS: Cash and cash equivalents 159 3,120,241 381,012 - 3,501,412 Loans to students — net - - 638,527 - 638,527 Due from Pierpont for debt service 3,201,464 - - - 3,201,464 Other noncurrent assets - 22,799 357,486 - 380,285 Capital assets — net 46,840,980 83,402,562 6,579,058 - 136,822,600
Total noncurrent assets 50,042,603 86,545,602 7,956,083 - 144,544,288
DEFERRED OUTFLOWS OF RESOURCES:
Employer pension contributions - - 93,303 - 93,303
Deferred loss on refunding 100,836 1,005,708 15,176 - 1,121,720
Total deferred outflows of resources 100,836 1,005,708 108,479 - 1,215,023
TOTAL 54,645,402$ 104,414,735$ 24,812,863$ (856,219)$ 183,016,781$
LIABILITIES, DEFERRED INFLOWS, AND NET POSITION
CURRENT LIABILITIES: Accounts payable 514,771$ 3,780,259$ 583,400$ (856,219)$ 4,022,211$ Due to Pierpont - - 13,827 - 13,827 Due to the Commission - 7,504 23,969 - 31,473 Accrued liabilities — payroll - 202,683 3,407,866 - 3,610,549 Accrued interest payable 31,279 212,891 2,476 - 246,646 Retainages payable 45,702 2,439,570 - - 2,485,272 Unearned revenue and deposits - 803,782 1,065,063 - 1,868,845 Compensated absences — current portion - 127,622 729,898 - 857,520 Capital leases — current portion - 40,417 - - 40,417 Debt obligation due to the Commission — current portion 127,075 - - - 127,075 Bonds payable — current portion 725,884 2,448,291 38,158 - 3,212,333 Other current liabilities - - 85,000 - 85,000
Total current liabilities 1,444,711 10,063,019 5,949,657 (856,219) 16,601,168
NONCURRENT LIABILITIES: Other postemployment benefits liability - 1,054,647 8,911,409 - 9,966,056 Compensated absences - 72,536 360,939 - 433,475 Advances from federal sponsors - - 1,062,748 - 1,062,748 Capital leases - 13,571 - - 13,571 Debt obligation to the Commission 1,588,446 - - - 1,588,446 Bonds payable 9,694,675 66,937,982 760,695 - 77,393,352 Net pension liability - - 1,132,445 - 1,132,445 Other noncurrent liabilities - - 106,779 - 106,779
Total noncurrent liabilities 11,283,121 68,078,736 12,335,015 - 91,696,872
DEFERRED INFLOWS OF RESOURCES: Differences between expected and actual experience - - 9,805 - 9,805 Changes in proportion and differences in pension contributions - - 299,981 - 299,981 Net difference between projected and actual earnings on pension plan investments - - 47,796 - 47,796
Total deferred inflows of resources - - 357,582 - 357,582
NET POSITION: Net investment in capital assets 38,203,725 18,084,596 5,795,379 - 62,083,700
Restricted for — expendable: Loans - - 131,548 - 131,548 Scholarships 1,323 - 5,302 - 6,625 Capital projects 3,712,363 - - - 3,712,363 Debt service 159 3,571 82 - 3,812
Total restricted 3,713,845 3,571 136,932 - 3,854,348
Unrestricted E&G Plant and President’s Control - - (1,676,135) - (1,676,135) Unrestricted Auxiliary and Fund Manager Funds - 8,184,813 1,914,433 - 10,099,246
Total unrestricted - 8,184,813 238,298 - 8,423,111
Total net position 41,917,570 26,272,980 6,170,609 - 74,361,159
TOTAL 54,645,402$ 104,414,735$ 24,812,863$ (856,219)$ 183,016,781$
See note to schedules.

FAIRMONT STATE UNIVERSITY 71
SCHEDULE OF REVENUES, EXPENSES, AND CHANGES IN NET POSITION INFORMATIONYEAR ENDED JUNE 30, 2016
Board of Unrestricted,Governors Restricted, and Internal
Support Auxiliary Other Fund TotalALL FUNDS Fund Funds Funds Eliminations Institution
OPERATING REVENUES: Student tuition and fees — net -$ -$ 13,879,414$ -$ 13,879,414$ Student activity support revenue - - 414,671 (357,285) 57,386 Auxiliary enterprise revenue - 7,722,549 4,468,239 - 12,190,788 Auxiliary support services revenue - 5,127,197 - (4,455,443) 671,754 Contracts and grants: Federal - - 1,035,589 - 1,035,589 State - - 6,362,078 - 6,362,078 Private - - 1,952,834 - 1,952,834 Interest on student loans receivable - - 35,179 - 35,179 Faculty services revenue - - 409,893 - 409,893 Operating costs revenue - - 1,681,195 - 1,681,195 Support services revenue - - 1,815,814 - 1,815,814 Miscellaneous — net 7,763 273,322 374,676 - 655,761
Total operating revenues 7,763 13,123,068 32,429,582 (4,812,728) 40,747,685
OPERATING EXPENSES: Salaries and wages - 2,555,033 24,011,413 - 26,566,446 Benefits - 592,603 6,074,297 - 6,666,900 Supplies and other services 187,112 3,828,513 8,959,983 - 12,975,608 Utilities - 893,812 1,667,864 - 2,561,676 Student financial aid — scholarships and fellowships 666 561,311 6,411,944 - 6,973,921 Depreciation 1,927,423 1,613,360 351,415 - 3,892,198 Assessment for student activity costs - - 357,285 (357,285) - Assessment for auxiliary fees and debt service - - 4,455,443 (4,455,443) - Assessment for faculty services - - 520,245 - 520,245 Assessment for operating costs - - 83,636 - 83,636 Assessment for support services - - 209,769 - 209,769 Loan cancellations and write-offs - 236,835 148,624 - 385,459 Fees assessed by the Commission for operations - - 171,873 - 171,873
Total operating expenses 2,115,201 10,281,467 53,423,791 (4,812,728) 61,007,731
OPERATING (LOSS) INCOME (2,107,438) 2,841,601 (20,994,209) - (20,260,046)
NONOPERATING REVENUES (EXPENSES): State appropriations - - 15,041,474 - 15,041,474 Pell grant revenues - - 7,116,252 - 7,116,252 E&G capital and debt service support revenue 2,132,416 - - (1,513,408) 619,008 Fees assessed to Pierpont for debt service 117,979 - - - 117,979 Investment income 14,813 100,399 59,091 - 174,303 Gifts 4,527 118,773 17,350 - 140,650 Interest on indebtedness (353,547) (2,247,416) (29,114) - (2,630,077) Loss on disposal of fixed assets - - (899) - (899) Assessment for E&G capital and debt service costs - - (2,200,035) 1,513,408 (686,627)
Bond issuance costs - - - - - Fees assessed by the Commission for debt service (112,986) - - - (112,986)
Total net nonoperating revenues (expenses) 1,803,202 (2,028,244) 20,004,119 - 19,779,077
(DECREASE) INCREASE IN NET POSITION BEFORE OTHER REVENUES, EXPENSES, GAINS, LOSSES, AND TRANSFER (304,236) 813,357 (990,090) - (480,969)
PAYMENTS MADE AND EXPENSES INCURRED BY THE STATE ON BEHALF OF FAIRMONT STATE - - 183,361 - 183,361
CAPITAL BOND PROCEEDS FROM THE STATE - - - - -
INCREASE (DECREASE) IN NET POSITION BEFORE TRANSFER (304,236) 813,357 (806,729) - (297,608)
TRANSFER OF NET POSITION FROM (TO) PIERPONT 185,097 (30,001) (35,229) - 119,867
INCREASE (DECREASE) IN NET POSITION (119,139) 783,356 (841,958) - (177,741)
NET POSITION — Beginning of year 42,036,709 25,489,624 7,012,567 - 74,538,900
NET POSITION — End of year 41,917,570$ 26,272,980$ 6,170,609$ -$ 74,361,159$
See note to schedules.

FAIRMONT STATE UNIVERSITY 72
SCHEDULE OF CASH FLOW INFORMATIONYEAR ENDED JUNE 30, 2016
Board of Unrestricted,Governors Restricted, and Internal
Support Auxiliary Other Fund TotalFund Funds Funds Eliminations Institution
CASH FLOWS FROM OPERATING ACTIVITIES: Student tuition and fees -$ 4,380,155$ 12,096,010$ -$ 16,476,165$ Contracts and grants - - 9,276,722 - 9,276,722 Payments to and on behalf of employees - (3,028,755) (29,909,843) - (32,938,598) Payments to suppliers (194,525) (8,420,395) (9,282,791) - (17,897,711) Payments to utilities - (899,589) (1,743,633) - (2,643,222) Payments for scholarships and fellowships (666) (561,311) (4,849,973) - (5,411,950) Loans issued to students - - 146,746 - 146,746 Interest on student loans receivable - - 17,910 - 17,910 Federal government advances - - (66,656) - (66,656) Auxiliary enterprise charges - 7,619,457 4,457,348 - 12,076,805 Fees assessed by the Commission - - (171,873) - (171,873) Other receipts — net 7,763 469,682 344,335 - 821,780 Student activity support revenue - - 414,671 (357,285) 57,386 Auxiliary fees and debt service support revenues - 5,127,197 - (4,455,443) 671,754 Assessment for support services - - (197,460) - (197,460) Support services revenue - - 1,683,372 - 1,683,372 Assessment for student activity costs - - (357,285) 357,285 - Assessment for auxiliary fees and debt service - - (4,455,443) 4,455,443 - Faculty services revenue - - 409,893 - 409,893 Assessment for faculty services - - (520,245) - (520,245) Operating support services revenue - - 1,694,212 - 1,694,212 Assessment for operating cost - - (82,907) - (82,907)
Net cash (used in) provided by operating activities (187,428) 4,686,441 (21,096,890) - (16,597,877)
CASH FLOWS FROM NONCAPITAL FINANCING ACTIVITIES: State appropriations - - 15,041,474 - 15,041,474 Pell grant revenues - - 7,116,252 - 7,116,252 Gift receipts 4,527 118,773 17,350 - 140,650 William D. Ford direct lending receipts - - 18,783,424 - 18,783,424 William D. Ford direct lending payments - - (18,784,990) - (18,784,990) Transfers from Pierpont 16,588 - - - 16,588 Transfers to (from) Pierpont (300,016) (252,500) 187,272 - (365,244)
Net cash (used in) provided by noncapital financing activities (278,901) (133,727) 22,360,782 - 21,948,154
CASH FLOWS FROM CAPITAL FINANCING ACTIVITIES:
Proceeds from bond issuance - - - - - Capital bond proceeds from State - - - - - E&G capital and debt service support revenue 2,132,416 - - - 2,132,416 Payments from Pierpont on debt obligation 354,123 - - - 354,123 Fees assessed by the Commission (112,986) - - - (112,986) Purchases of capital assets (1,046,109) (21,190,498) - - (22,236,607) Purchases of equipment (33,134) (124,269) (160,588) - (317,991) Principal paid on leases - (39,977) - - (39,977) Interest paid on leases - (829) - - (829) Assessment for E&G capital and debt service costs - - (2,200,035) - (2,200,035) Payments to the Commission on debt obligation (120,722) - - - (120,722) Principal paid on bonds (628,387) (1,682,291) (33,714) - (2,344,392) Interest paid on bonds (432,933) (2,793,791) (31,061) - (3,257,785)
Payment of bond issue costs - - - - - Bond interest income 360 64,554 54 - 64,968
Net cash (used in) provided by capital financing activities 112,628 (25,767,101) (2,425,344) - (28,079,817)
CASH FLOW FROM INVESTING ACTIVITY — Interest on investments 14,573 35,845 47,116 - 97,534
(DECREASE) INCREASE IN CASH AND CASH EQUIVALENTS (339,128) (21,178,542) (1,114,336) - (22,632,006)
CASH AND CASH EQUIVALENTS — Beginning of year 4,588,585 40,930,214 16,078,508 - 61,597,307
CASH AND CASH EQUIVALENTS — End of year 4,249,457$ 19,751,672$ 14,964,172$ -$ 38,965,301$
(Continued)

FAIRMONT STATE UNIVERSITY 73
SCHEDULE OF CASH FLOW INFORMATIONYEAR ENDED JUNE 30, 2016
Board of Unrestricted,Governors Restricted, and
Support Auxiliary Other TotalFund Funds Funds Institution
RECONCILIATION OF NET OPERATING LOSS TO NET CASH (USED IN) PROVIDED BY OPERATING ACTIVITIES:Operating (loss) income (2,107,438)$ 2,841,601$ (20,994,209)$ (20,260,046)$ Adjustments to reconcile net operating income (loss) to net cash provided
by (used in) operating activities:Depreciation expense 1,927,423 1,613,360 351,415 3,892,198 Pension expense — special funding situation - - 183,361 183,361 Net effect of change in accounting policy - - - - Changes in assets, deferred outflows of resources,
liabilities, and deferred inflows of resources:Receivables — net - 98,109 (505,192) (407,083) Loans to students — net - - 204,172 204,172 Inventories - - 3,469 3,469 Deferred outflows of resources - - 55,302 55,302 Other assets - - 47,219 47,219 Advances from federal sponsors - - (92,219) (92,219) Accounts payable (7,413) (192,245) (114,719) (314,377) Accrued liabilities — payroll - 40,687 (23,182) 17,505 Accrued liabilities — other - - (647,626) (647,626) Compensated absences - 15,560 46,121 61,681 Other postemployment benefits liability - 59,057 522,110 581,167 Net pension liability - - (249,354) (249,354) Deferred inflows of resources - - 85,592 85,592 Unearned revenue - - 36,576 36,576 Undistributed receipts (disbursements) — deposits - 210,312 (5,726) 204,586
NET CASH (USED IN) PROVIDED BY OPERATING ACTIVITIES (187,428)$ 4,686,441$ (21,096,890)$ (16,597,877)$
NONCASH TRANSACTIONS:Construction in progress additions in accounts payable 386,233$ 2,774,286$ -$ 3,160,519$
Construction in progress additions in retainages payable 45,702$ 67,401$ -$ 113,103$
Transfer to Pierpont (exclusive of $16,587 of cash) 135,369$ -$ -$ 135,369$
RECONCILIATION OF CASH AND CASH EQUIVALENTSTO THE STATEMENTS OF NET POSITION:
Cash and cash equivalents classified at current 4,249,298$ 16,631,431$ 14,583,160$ 35,463,889$ Cash and cash equivalents classified at noncurrent 159 3,120,241 381,012 3,501,412
4,249,457$ 19,751,672$ 14,964,172$ 38,965,301$
(Concluded)
See note to schedules.

FA
IRM
ON
T S
TA
TE
UN
IVE
RS
ITY
SC
HE
DU
LE
OF
NA
TU
RA
L V
S. F
UN
CT
ION
AL
CL
AS
SIF
ICA
TIO
NS
IN
FO
RM
AT
ION
YE
AR
EN
DE
D J
UN
E 3
0, 2
016
INT
ER
NA
L F
UN
D:
BO
G S
up
por
t
Sal
arie
sS
up
pli
esan
dan
dL
oan
Fu
nct
ion
Fu
nct
ion
Wag
esB
enef
its
Oth
ers
Uti
liti
esS
chol
arsh
ips
Dep
reci
atio
nC
ance
llat
ion
sT
otal
Aux
ilia
ry e
nter
pris
es-
$
-
$
-$
-
$
-$
-
$
-
$
-
$
Inst
ruct
ion
-
-
-
-
-
-
-
-
R
esea
rch
-
-
-
-
-
-
-
-
P
ubli
c se
rvic
e-
-
-
-
-
-
-
-
Aca
dem
ic s
uppo
rt-
-
-
-
-
-
-
-
Stu
dent
ser
vice
s-
-
-
-
-
-
-
-
Gen
eral
inst
itut
iona
l sup
port
-
-
2,
237
-
-
-
-
2,
237
S
tude
nt f
inan
cial
aid
-
-
-
-
66
6
-
-
666
Ope
rati
on a
nd m
aint
enan
ce-
-
184,
875
-
-
-
-
184,
875
Dep
reci
atio
n-
-
-
-
-
1,
927,
423
-
1,92
7,42
3
Loa
n ca
ncel
lati
ons
and
wri
te-o
ffs
-
-
-
-
-
-
-
-
TO
TA
L-
$
-
$
187,
112
$
-$
66
6$
1,92
7,42
3$
-
$
2,
115,
201
$
See
not
e to
sch
edul
es.
(Con
tinu
ed)
74
See
not
e to
sch
edul
es.
(Con
tinu
ed)

FA
IRM
ON
T S
TA
TE
UN
IVE
RS
ITY
SC
HE
DU
LE
OF
NA
TU
RA
L V
S. F
UN
CT
ION
AL
CL
AS
SIF
ICA
TIO
NS
IN
FO
RM
AT
ION
YE
AR
EN
DE
D J
UN
E 3
0, 2
016
INT
ER
NA
L F
UN
D:
AU
XIL
IAR
Y
Sal
arie
sS
up
pli
esan
dan
dL
oan
Fu
nct
ion
Fu
nct
ion
Wag
esB
enef
its
Oth
ers
Uti
liti
esS
chol
arsh
ips
Dep
reci
atio
nC
ance
llat
ion
sT
otal
Aux
ilia
ry e
nter
pris
es2,
205,
239
$
502,
829
$
3,26
7,24
0$
89
3,81
2$
-
$
-
$
-
$
6,
869,
120
$
Inst
ruct
ion
-
-
-
-
-
-
-
-
Res
earc
h-
-
-
-
-
-
-
-
P
ubli
c se
rvic
e31
,733
10,3
95
13
,239
-
-
-
-
55,3
67
A
cade
mic
sup
port
-
-
-
-
-
-
-
-
Stu
dent
ser
vice
s50
,255
11,1
31
53
,515
-
-
-
-
114,
901
G
ener
al in
stit
utio
nal s
uppo
rt13
8,17
6
31,8
03
41
2,71
0
-
-
-
-
582,
689
S
tude
nt f
inan
cial
aid
-
-
-
-
561,
311
-
-
56
1,31
1
Ope
rati
on a
nd m
aint
enan
ce12
9,63
0
36,4
45
81
,809
-
-
-
-
247,
884
D
epre
ciat
ion
-
-
-
-
-
1,61
3,36
0
-
1,
613,
360
Loa
n ca
ncel
lati
ons
and
wri
te-o
ffs
-
-
-
-
-
-
23
6,83
5
236,
835
See
not
e to
sch
edul
es.
(Con
tinu
ed)
TO
TA
L2,
555,
033
$
592,
603
$
3,82
8,51
3$
89
3,81
2$
56
1,31
1$
1,61
3,36
0$
23
6,83
5$
10,2
81,4
67$
75
See
not
e to
sch
edul
es.
(Con
tinu
ed)

FA
IRM
ON
T S
TA
TE
UN
IVE
RS
ITY
SC
HE
DU
LE
OF
NA
TU
RA
L V
S. F
UN
CT
ION
AL
CL
AS
SIF
ICA
TIO
NS
IN
FO
RM
AT
ION
YE
AR
EN
DE
D J
UN
E 3
0, 2
016
INT
ER
NA
L F
UN
D:
FA
IRM
ON
T S
TA
TE
UN
IVE
RS
ITY
Ass
essm
ent
for
Act
ivit
y,A
sses
smen
tF
ees
Sal
arie
sS
up
pli
esC
apit
al,
for
Au
xili
ary
Ass
essm
ent
Ass
essm
ent
Ass
essm
ent
Ass
esse
dan
dan
dan
d D
ebt
Fee
s an
dfo
r F
acu
lty
for
Op
erat
ing
for
Su
pp
ort
Loa
nb
y th
eF
un
ctio
nF
un
ctio
nW
ages
Ben
efit
sO
ther
sU
tili
ties
Sch
olar
ship
sD
epre
ciat
ion
Ser
vice
Cos
tsD
ebt
Ser
vice
Ser
vice
sC
osts
Ser
vice
sC
ance
llat
ion
sC
omm
issi
onT
otal
Aux
ilia
ry e
nter
pris
es77
5,85
4$
20
3,39
6$
210,
826
$
21
2,97
4$
-$
-$
-$
4,
455,
443
$
-$
-$
-
$
-
$
-$
5,
858,
493
$
Inst
ruct
ion
12,8
87,6
60
2,
941,
510
2,02
8,89
6
3,
021
-
-
-
-
52
0,24
5
72,0
42
70,3
82
-
-
18,5
23,7
56
Res
earc
h53
,673
3,
003
47,9
43
-
-
-
-
-
-
-
-
-
-
10
4,61
9
Pub
lic
serv
ice
282,
761
58,3
96
18
1,56
6
-
-
-
-
-
-
-
-
-
-
522,
723
A
cade
mic
sup
port
2,17
0,29
8
547,
908
1,
435,
944
-
-
-
-
-
-
11
,594
13
9,38
7
-
-
4,30
5,13
1
S
tude
nt s
ervi
ces
3,08
7,60
3
781,
794
1,
525,
222
-
-
-
355,
474
-
-
-
-
-
-
5,
750,
093
Gen
eral
inst
itut
iona
l s
uppo
rt3,
301,
492
1,
119,
268
2,04
4,47
0
1,
092
-
-
1,81
1
-
-
-
-
-
171,
873
6,64
0,00
6
S
tude
nt f
inan
cial
aid
207,
234
44,6
78
-
-
6,
411,
944
-
-
-
-
-
-
-
-
6,66
3,85
6
O
pera
tion
and
m
aint
enan
ce1,
244,
838
37
4,34
4
1,48
5,11
6
1,
450,
777
-
-
-
-
-
-
-
-
-
4,55
5,07
5
D
epre
ciat
ion
-
-
-
-
-
35
1,41
5
-
-
-
-
-
-
-
351,
415
L
oan
canc
ella
tion
s a
nd w
rite
-off
s-
-
-
-
-
-
-
-
-
-
-
148,
624
-
14
8,62
4
TO
TA
L24
,011
,413
$
6,07
4,29
7$
8,
959,
983
$
1,66
7,86
4$
6,
411,
944
$
351,
415
$
35
7,28
5$
4,
455,
443
$
520,
245
$
83
,636
$
20
9,76
9$
148,
624
$
171,
873
$
53,4
23,7
91$
See
not
e to
sch
edul
es.
(Con
clud
ed)
76
See
not
e to
sch
edul
es.
(Con
clud
ed)

FAIRMONT STATE UNIVERSITY NOTE TO SCHEDULES YEAR ENDED JUNE 30, 2016
77
1. INTERNAL FUND FINANCIAL DATA
The additional information schedules are included to comply with the requirements of the Commission to provide financial information for all internal funds of Fairmont State. This presentation provides financial information for Fairmont State University, Fairmont State Auxiliaries, and Board of Governors Support (BOG Support). The BOG Support internal fund comprises Fairmont State’s ownership based on the Separation of Assets and Liabilities Agreement, which was 66.63% as of June 30, 2016. The BOG Support internal fund consists of capital funds for all E&G shared bonding and plant repairs and replacements, plant and other capitalized assets, and grants in support of capital projects.
Financial Schedules - The financial schedules for Fairmont State University, Auxiliary, and BOG Support are driven by rollup of funds to fund type. Separate fund types for each internal fund were established in each net position category (unrestricted, restricted, etc.). This setup has allowed Fairmont State and Pierpont to produce separate financial statements (statements of net position, statements of revenues, expenses, and changes in net position, and natural versus functional classification reports) from a shared financial accounting system. These supplemental schedules are produced as a by-product of the financial reporting system.
The following represents additional footnotes outlining faculty teaching services shared between Fairmont State and Pierpont, services that are charged to both Fairmont State and Pierpont, and student fee distributions. These representations are based on the approved chargeback agreement between Fairmont State and Pierpont and legislative actions:
a. Revenues - State appropriations are allocated by the Legislature each year. Appropriations decreased by 5.06% for Fairmont State.
Student fee revenues are directly credited to the appropriate two- and four-year college funds based on the students’ program major. Student enrollment drives the fee revenue dollars available to each Institution, as follows:
1. Required auxiliary, capital, and student activity fee revenues are recorded as revenues to the institution in which the student is enrolled. Under the contract agreement, all (100%) of these revenues will be transferred as an expense to the capital, auxiliary, and student activity funds from which the operating, capital, and debt service expenditures are paid (primarily Fairmont State funds). Most of these fees are pledged on revenue bonds and must be transferred to maintain compliance with bond covenants.
2. User fees collected from students of either institution are deposited directly to the appropriate auxiliary revenue account and are not recorded as revenues by separate institutions. Examples of this type of revenue are parking, books, meals, and rent.
3. Grant revenues are deposited in the institution’s fund to which the grant was awarded.
4. Student payments made via lockbox, web, etc., are deposited to Fairmont State’s clearing fund and are moved daily to the appropriate operating state fund for each institution.
5. Interest income is allocated by the Commission to both institutions based on current allocation methods.
FAIRMONT STATE UNIVERSITY NOTE TO SCHEDULES YEAR ENDED JUNE 30, 2016
78
b. Expenses:
Direct expenditures:
1. Direct expenditures will be assigned directly to either Fairmont State or Pierpont.
2. Full- and part-time faculty personnel services and fringe benefit expenditures are paid from the institution where the personnel are employed.
Chargeback expenditures:
1. Teaching service expenses are charged back from one institution to the other based on the number of credit hours taught. This chargeback process includes instructional salary and benefit costs. The calculation includes the faculty member’s salary and benefit costs, courses taught, the students being taught, and the number of student credit hours being taught. The teaching chargeback services calculations are performed once each semester. The teaching chargeback calculation results in a value allocated for each institution for the credit hours taught to both Pierpont and Fairmont State students.
2. Support service chargebacks are for salary and benefit costs from one institution to the other and/or services provided from the administrative, student service, and physical plant support areas of Fairmont State to Pierpont and vice versa. The salary and benefit chargeback services from each institution to the other for support services are based on the agreed-upon percentage in the chargeback agreement.
Support service chargebacks for adjunct and/or supplemental pay contracts:
Chargebacks at 100% of cost occur when one institution’s employee is hired to teach or work part-time by the other institution. This action of chargeback allows the employee to maintain one payroll account and ensures that one W-2 is issued to this employee.
Support services salary and benefit chargebacks are performed each pay cycle and are supported with detailed reports showing employee costs being charged by Pierpont to Fairmont State and vice versa.
3. Operating (nonlabor) expenses for all support offices are charged back based on state code requirements. The organization manager of those offices has budget authority to expend against these budgets during the fiscal year. All unspent budgets at the end of each fiscal year are not carried forward to future fiscal years. Therefore, unspent budget increases the fund balance of both institutions. These fund balances are under the direct control of the respective Presidents of each institution.
4. Support staff actual liability costs:
The liability costs incurred annually from employee benefits provided to support staff, such as retiree health premiums are allocated to the institutions based on the agreed-upon percentage in the chargeback agreement.

FAIRMONT STATE UNIVERSITY NOTE TO SCHEDULES YEAR ENDED JUNE 30, 2016
79
5. Support staff accrued liabilities:
Accrued liabilities (OPEB liability, annual leave, etc.) required to be recorded in the financial statements annually for all support staff are allocated to the institutions based on the agreed-upon percentage in the chargeback agreement.
6. PEIA retiree and severance payables in the current year:
Compensated absences - As of June 30, 2016, PEIA retiree and liabilities are distributed to the component units based on funding source. However, the chargeback agreement for fiscal year 2016 between the institutions reads as follows: Payout of PEIA retiree and incurred during the year will be allocated to the institutions based on the percentage defined in the chargeback agreement. For fiscal year 2016, the percentages are 30.56% for the two-year institution and 69.44% for the four-year institution.
80
REQUIRED SUPPLEMENTARY INFORMATION

81
2016
2015
2014
2013
2012
2011
2010
2009
2008
2007
Fai
rmon
t Sta
te's
pro
port
ion
of th
e ne
t pen
sion
liab
ilit
y (a
sset
) (p
erce
ntag
e)0.
0326
80%
0.04
0054
%
Fai
rmon
t Sta
te's
pro
port
iona
te s
hare
of
the
net p
ensi
on li
abil
ity
(ass
et)
1,13
2,44
5$
1,
381,
799
$
Sta
te's
pro
port
iona
te s
hare
of
the
net p
ensi
on li
abil
ity
(ass
et)
2,58
3,97
7
3,
122,
299
Tot
al p
ropo
rtio
nate
sha
re o
f th
e ne
t pen
sion
liab
ilit
y (a
sset
)3,
716,
422
$
4,50
4,09
8$
Fai
rmon
t Sta
te's
cov
ered
-em
ploy
ee p
ayro
ll98
8,97
2$
1,22
6,83
4$
Fai
rmon
t Sta
te's
pro
port
iona
te s
hare
of
the
net p
ensi
on li
abil
ity
(ass
et)
as a
pe
rcen
tage
of
its
cove
red-
empl
oyee
pay
roll
114.
51%
112.
63%
Pla
n fi
duci
ary
net p
osit
ion
as a
per
cent
age
of th
e to
tal p
ensi
on li
abil
ity
66.2
5%65
.95%
* -
The
am
ount
s pr
esen
ted
for
each
fis
cal y
ear
wer
e de
term
ined
as
of J
une
30th
.T
his
sche
dule
is p
rese
nted
to il
lust
rate
the
requ
irem
ent t
o sh
ow in
form
atio
n fo
r 10
yea
rs. H
owev
er, u
ntil
a f
ull 1
0-ye
ar tr
end
is c
ompi
led,
Fai
rmon
t Sta
tes
shou
ld p
rese
nt in
form
atio
n fo
r th
ose
year
s fo
r w
hich
info
rmat
ion
is a
vail
able
.
FA
IRM
ON
T S
TA
TE
UN
IVE
RS
ITY
SC
HE
DU
LE
OF
PR
OP
OR
TIO
NA
TE
SH
AR
E O
F T
HE
NE
T P
EN
SIO
N L
IAB
ILIT
YJU
NE
30,
201
6
Sta
te T
each
ers'
Ret
irem
ent
Sys
tem
Las
t 10
Fis
cal Y
ears
*
RE
QU
IRE
D S
UP
PL
EM
EN
TA
RY
IN
FO
RM
AT
ION

82
2016
2015
2014
2013
2012
2011
2010
2009
2008
2007
Con
trac
tual
ly r
equi
red
cont
ribu
tion
93,3
03$
14
8,60
5$
Con
trib
utio
ns in
rel
atio
n to
the
cont
ract
uall
y re
quir
ed
cont
ribu
tion
(93,
303)
(1
48,6
05)
Con
trib
utio
n de
fici
ency
(ex
cess
)-
$
-
$
Fai
rmon
t Sta
te's
cov
ered
-em
ploy
ee p
ayro
ll62
2,01
7$
988,
972
$
Con
trib
utio
ns a
s a
perc
enta
ge o
f co
vere
d-em
ploy
ee
payr
oll
15.0
0%15
.03%
RE
QU
IRE
D S
UP
PL
EM
EN
TA
RY
IN
FO
RM
AT
ION
FA
IRM
ON
T S
TA
TE
UN
IVE
RS
ITY
SC
HE
DU
LE
OF
PE
NS
ION
CO
NT
RIB
UT
ION
SJU
NE
30,
201
6
Sta
te T
each
ers'
Ret
irem
ent
Sys
tem
Las
t 10
Fis
cal Y
ears

FAIRMONT STATE UNIVERSITY NOTE TO REQUIRED SUPPLEMENTARY INFORMATION YEAR ENDED JUNE 30, 2016
83
There are no factors that affect trends in the amounts reported, such as a change of benefit terms or assumptions. Addition information, if necessary, can be obtained from the CPRB Comprehensive Annual Financial Report for the year ended June 30, 2015.

The Virginia Center 1411 Virginia Street, East Suite 100 Charleston, WV 25301 Phone (304) 343-4126 or 1(800) 788-3844 Fax (304) 343-8008
Wharf District 68 Clay Street Suite C Morgantown, WV 26501 Phone (304) 554-3371 Fax (304) 554-3410
Towne Square 201 Third Street PO Box 149 Parkersburg, WV 26102 Phone (304) 485-6584 Fax (304) 485-0971
www.suttlecpas.com E-mail: [email protected] A Professional Limited Liability Company
84
INDEPENDENT AUDITOR’S REPORT ON INTERNAL CONTROL OVER FINANCIAL REPORTING AND ON COMPLIANCE AND OTHER MATTERS BASED ON AN AUDIT OF
FINANCIAL STATEMENTS PERFORMED IN ACCORDANCE WITH GOVERNMENT AUDITING STANDARDS
Board of Governors Fairmont State University Fairmont, West Virginia We have audited, in accordance with the auditing standards generally accepted in the United States of America and the standards applicable to financial audits contained in Government Auditing Standards issued by the Comptroller General of the United States, the financial statements of the business-type activities of Fairmont State University (Fairmont State) as of and for the year ended June 30, 2016, and the related notes to the financial statements, which collectively comprise Fairmont State’s basic financial statements, and have issued our report thereon dated January 17, 2017. Internal Control Over Financial Reporting In planning and performing our audit of the financial statements, we considered Fairmont State’s internal control over financial reporting (internal control) to determine the audit procedures that are appropriate in the circumstances for the purpose of expressing our opinions on the financial statements, but not for the purpose of expressing an opinion on the effectiveness of Fairmont State’s internal control. Accordingly, we do not express an opinion on the effectiveness of Fairmont State’s internal control. A deficiency in internal control exists when the design or operation of a control does not allow management or employees, in the normal course of performing their assigned functions, to prevent, or detect and correct, misstatements on a timely basis. A material weakness is a deficiency, or a combination of deficiencies, in internal control, such that there is a reasonable possibility that a material misstatement of the entity’s financial statements will not be prevented, or detected and corrected on a timely basis. A significant deficiency is a deficiency, or a combination of deficiencies, in internal control that is less severe than a material weakness, yet important enough to merit attention by those charged with governance. Our consideration of internal control was for the limited purpose described in the first paragraph of this section and was not designed to identify all deficiencies in internal control that might be material weaknesses or, significant deficiencies. Given these limitations, during our audit we did not identify any deficiencies in internal control that we consider to be material weaknesses. However, material weaknesses may exist that have not been identified.

85
Compliance and Other Matters As part of obtaining reasonable assurance about whether Fairmont State’s financial statements are free from material misstatement, we performed tests of its compliance with certain provisions of laws, regulations, contracts, and grant agreements, noncompliance with which could have a direct and material effect on the determination of financial statement amounts. However, providing an opinion on compliance with those provisions was not an objective of our audit, and accordingly, we do not express such an opinion. The results of our tests disclosed no instances of noncompliance or other matters that are required to be reported under Government Auditing Standards. Purpose of this Report The purpose of this report is solely to describe the scope of our testing of internal control and compliance and the results of that testing, and not to provide an opinion on the effectiveness of the entity’s internal control or on compliance. This report is an integral part of an audit performed in accordance with Government Auditing Standards in considering the entity’s internal control and compliance. Accordingly, this communication is not suitable for any other purpose.
Charleston, West Virginia January 17, 2017