Embed Size (px)
Citation preview

1
UGWU, ONYEDIKACHI DANIEL
PG/M.Sc./2010/58003
HYDROLYSIS OF CASSAVA STARCH BY MALTED ACHA (DIGITARIA
EXILIS) FOR BIOETHANOL PRODUCTION
FACULTY OF BIOLOGICAL SCIENCES
DEPARTMENT OF BIOCHEMISTRY
Ameh Joseph Jnr
Digitally Signed by: Content manager’s Name
DN : CN = Webmaster’s name
O= University of Nigeria, Nsukka
OU = Innovation Centre

2
TITLE
HYDROLYSIS OF CASSAVA STARCH BY MALTED ACHA
(DIGITARIA EXILIS) FOR BIOETHANOL PRODUCTION
A PROJECT REPORT SUBMITTED IN PARTIAL
FULFILMENT OF THE REQUIREMENTS FOR AWARD OF
DEGREE OF MASTER OF SCIENCE (M. Sc) IN INDUSTRIAL
BIOCHEMISTRY & BIOTECHNOLOGY,
UNIVERSITY OF NIGERIA,
NSUKKA
BY
UGWU, ONYEDIKACHI DANIEL
(PG/M.Sc/2010/58003)
DEPARTMENT OF BIOCHEMISTRY
UNIVERSITY OF NIGERIA
NSUKKA
SUPERVISOR: DR. S.O.O EZE
FEBRUARY, 2013

3
CHAPTER ONE
INTRODUCTION
Energy and environmental issues are the major concerns facing the global community today (Hu
et al., 2008). Renewable fuels (biofuels) such as bioethanol are becoming increasingly important
due to heightened concern for the green house effect, depleting oil reserves and rising oil prices
(Ohgren et al., 2007). Ethanol, chemically known as ethyl alcohol, is a clear, colourless liquid,
with an agreeable odour (Bugaje, 2008). Bioethanol can be utilized as oxygenator of gasoline,
elevating its oxygen content, allowing a best oxidation of hydrocarbons and reducing the amount
of aromatic compounds and carbon monoxide released into the atmosphere (Cardona and
Sanchez, 2007). Bioethanol is obtained from bioenergy crops and biomass which distinguishes it
from that which is produced synthetically from petroleum (Ranola et al., 2009). Different
countries use different bioenergy crops such as corn, cassava and sugarcane for bioethanol
production. Cassava and sugarcane are used mainly in Nigeria and Brazil (Naylor et al., 2007).
Experts have pointed out that cassava is the best energy crop for bioethanol production due to its
comparative advantages over all known energy crops (Wang, 2002). The ethanol yield of cassava
per unit land area is the highest among all known energy crops (Wang, 2002). High fermentable
sugar content, stable shelf live, complete and easier hydrolysis, low cost of raw materials and
simpler ethanol processing technology are the advantages of cassava flour over other flours
(Grace, 1977; Ocloo, 2002 and Vijayagopal et al., 1980). Malted cereals have been used as
sources of starch hydrolyzing enzymes, due to the fact that germination induces the synthesis of
hydrolytic enzymes (Obatolu, 2002). These malted cereals are employed in the enzymatic
saccharification of starch in most starch-based industries in Nigeria (Egwim and Oloyede, 2006).
Barley and wheat malts give high yield of amylase and fermentable sugar but are quite expensive
to import. However local sources can be used effectively for malt and enzyme production.
Sorghum and acha (Digitaria exilis) have been shown to have higher germination capacity than
other cereals such as maize and rice (Egwim and Oloyede, 2006). Sorghum alpha amylase have
been shown to be the closest alternative to imported alpha amylase for industrial purposes and
acha alpha amylase can also be as good as sorghum amylase and indeed could be a better source
(Egwim and Oloyede, 2006). Development of hydrolytic enzymes was significantly higher in
4
Digitaria exilis than in sorghum (Nzelibe and Uwasike, 1995). Acha has been shown to has
higher alpha amylase yield than sorghum, acha may be a better source of alpha amylase and can
substitute for sorghum alpha amylase in industrial processing (Egwim and Oloyede, 2006). In the
present study, malted acha (Digitaria exilis) was employed as local enzyme source in the
hydrolysis of locally sourced cassava starch for bioethanol production.
1.1 Ethanol
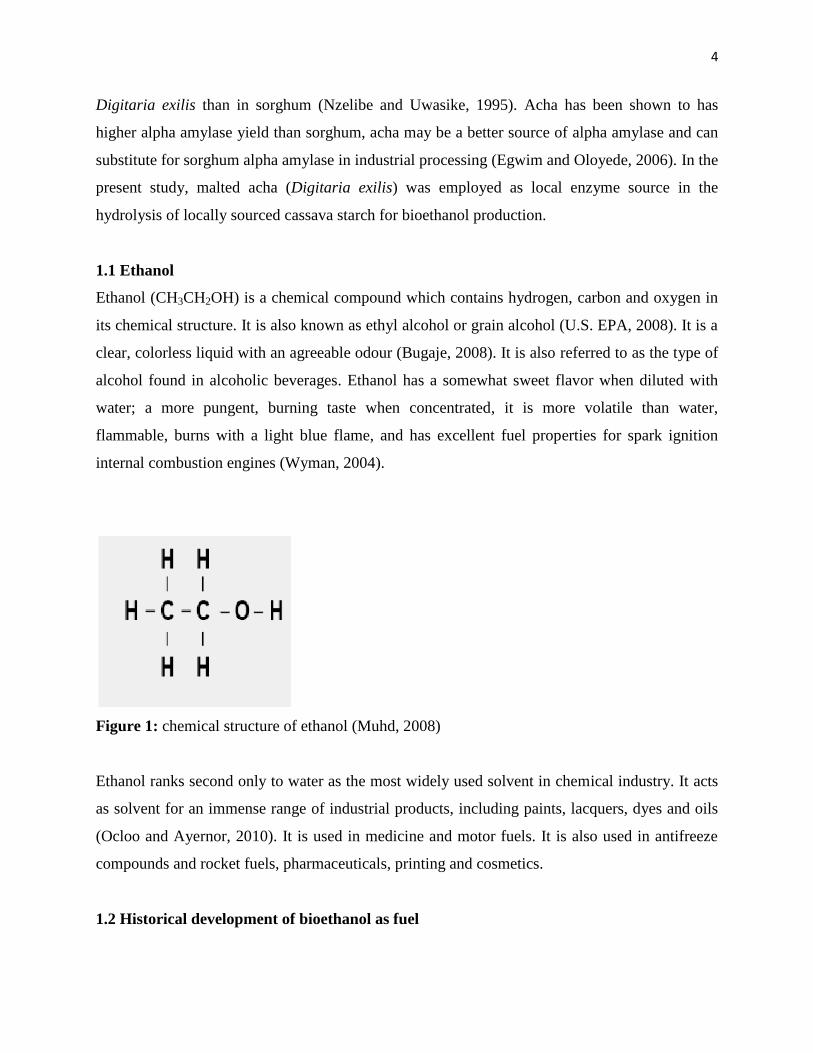
Ethanol (CH3CH2OH) is a chemical compound which contains hydrogen, carbon and oxygen in
its chemical structure. It is also known as ethyl alcohol or grain alcohol (U.S. EPA, 2008). It is a
clear, colorless liquid with an agreeable odour (Bugaje, 2008). It is also referred to as the type of
alcohol found in alcoholic beverages. Ethanol has a somewhat sweet flavor when diluted with
water; a more pungent, burning taste when concentrated, it is more volatile than water,
flammable, burns with a light blue flame, and has excellent fuel properties for spark ignition
internal combustion engines (Wyman, 2004).
Figure 1: chemical structure of ethanol (Muhd, 2008)
Ethanol ranks second only to water as the most widely used solvent in chemical industry. It acts
as solvent for an immense range of industrial products, including paints, lacquers, dyes and oils
(Ocloo and Ayernor, 2010). It is used in medicine and motor fuels. It is also used in antifreeze
compounds and rocket fuels, pharmaceuticals, printing and cosmetics.
1.2 Historical development of bioethanol as fuel

5
The use of ethanol as fuel dates back to 1826, when Samuel Morey developed an engine that ran
on ethanol and turpentine called camphene. Bioethanol was used in Germany and France by the
then incipient industry of internal combustion (IC) engines as early as 1894 (Demirbas and
Karslioglu, 2007). Bioethanol as fuel gained more prominence in 1908, when the Ford Motors in
the USA developed the Henry Ford‟s model T vehicle which was designed to use gasoline,
ethanol (from corn) or a combination of both. The use of bioethanol for fuel was widespread in
Europe and the United States during this period. Brazil has utilized bioethanol as transportation
fuel since 1925. The potential of bioethanol was ignored, especially after the World War II,
because it became more expensive than petroleum-based fuel. The energy crisis of the 1970‟s
then renewed interest in ethanol production for fuel and chemicals in both the USA and Brazil,
where mass production of bioethanol grown from corn and sugar cane started, respectively (Balat
and Balat, 2009; Balat, 2009).
The United States is the world‟s largest producer of bioethanol fuel, accounting for nearly 47%
of global bioethanol production. Brazil is the world‟s largest exporter of bioethanol and second
largest producer after the United States (Balat and Balat, 2009). Brazil produces her bioethanol
from sugarcane and cassava while the USA produces hers from corn (Naylor et al., 2007). China
is also a leading contender in bioethanol production, producing over I billion litres per year from
wheat and corn, while France which is leading other European countries, produces over 200
million gallons of ethanol from sugar beets and wheat (Sperling and Cannon, 2004).
Table 1: World bioethanol production during 2005 and 2006 (billion liters), (Balat and
Balat, 2009).
Country 2005 2006 share total in 2006 (%)
USA 15.0 18.3 46.9
Brazil 15.0 17.5 44.9
China 1.0 1.0 2.6
India 0.3 0.3 0.8
France 0.15 0.25 0.6
Others 1.55 1.65 4.2
Total 33.0 39.0

6
Nigeria in 2004 joined the league of biofuel users, with a policy thrust according to the Nigeria
National Petroleum Cooperation (NNPC), to generate fuel ethanol from cassava and sugar cane.
This policy thrust was designed with the aim of generating wealth and reducing environmental
pollution (Kupolokun, 2006; Umar, 2006). At present, the Federal Government of Nigeria has
agreed to the blending of 5 percent ethanol (E5) by composition with premium motor spirit
(PMS) (Ezeobi 2008). The government adopted E5 because it believes that the level will not
damage vehicles in Nigeria, although this proportion is expected to increase to 10 per cent (E10)
in the nearest future (Ugwuanyi, 2008). The core focus of the Nigeria biofuel programme is to
ensure the production of fuel ethanol domestically.
1.3 The need for bioethanol
Bioethanol being a biofuel is produced from biological sources and has a lot of benefits which
makes it a better energy source than fossil-based fuels.
1.3.1 Environmental benefit of bioethanol
Carbon dioxide emission due to combustion of fossil fuels has become a major environmental
concern. Carbon dioxide emission contributes greatly to green house effect, climate change and
global warming. Bioethanol, is primarily seen as a good fuel alternative because the source crops
can be grown renewably and in most climates around the world. In addition, the use of
bioethanol is generally CO2 neutral. This is achieved because, in the growing phase of the source
crop, CO2 is absorbed by the plant and oxygen is released in the same volume that CO2 is
produced in the combustion of the fuel. This creates an obvious advantage over fossil fuels,
which emit CO2 as well as other poisonous emissions that have great negative impact on the
environment (Cardona and Sanchez, 2007; Hu et al., 2008). Bioethanol is bio-degradable, more
environmentally friendly and less toxic than fossil fuel.
Also, bioconversion processes in general do not produce hazardous compounds, and if toxic
solvents and chemicals are avoided in the processing stages, then fewer environmental pollutants
are produced. In addition, biomass production and microbial conversion processes can be
developed and used in a more distributed manner, avoiding the need for transport of fuels via
cargo ships or pipeline for long distances (Drapcho et al., 2008).

7
Also, CO2 from ethanol fermentation can be used to extract oils and nutraceutical compounds
from biomass instead of using toxic organic solvents such as hexane (Walker et al., 1999).
Bioethanol, can be used in biodiesel production from biological oils in place of toxic petroleum-
based methanol traditionally used (Drapcho et al., 2008).
1.3.2 Respite to energy issues, depleting oil reserves and rising oil prices
Bioethanol has also become increasingly important as alternative energy source, due to depleting
oil reserves and rising oil prices (Ohgren et al., 2007). Currently, available fossil fuel sources are
estimated to become nearly depleted within the next century, with petroleum fuel reserves
depleted within 40 years (Energy Information Agency, 2007). For instance, the United States
imports 10 million barrels of oil per day of the existing world reserves (1.3 trillion barrels) as
shown in table (1). Crude oil prices have risen from less than $20/barrel in the 1990‟s to nearly
$100/barrel in 2007. The true cost of oil has been estimated as greater than $100/barrel since
2004 (Drapcho et al., 2008).
Bioethanol can create energy security and vary energy portfolio (Azmi et al., 2011). The U.S
Energy Information Administration determined that total world energy consumption in 2005 was
488EJ (exajoule, 1018
J). World consumption is expected to surpass 650EJ by 2025 (Energy
information Agency, 2007).
Bioethanol, has emerged as the most suitable renewable alternative to fossil fuel, as their quality
constituents match diesel and petrol respectively (Nugesha, 2009). Bioethanol is the most
employed liquid biofuel either as fuel or as a gasoline enhancer.
Table 2: World oil reserves and U.S import based on leading producers (Energy Information
Agency, 2007).
Country Oil reserves (billion barrels) US oil imports (million
barrels)
Saudi Arabia 267 1.50
Canada 179 1.62
Iran 132 -
Iraq 115 0.66
Kuwait 104 0.24

8
United Arab Emirate 98 -
Venezuela 80 1.30
Russia 60 -
Libya 39 -
Nigeria 36 1.08
United States 21 -
China 18 -
Qatar 15 -
Mexico 13 1.60
Algeria 11 0.22
Brazil 11 -
Others 91 1.84
Total 1290 10.06 (60%)
1.3.3 Socio-economic benefit of bioethanol
The utilization of biofuels has important economic and social effects. Sheeman and Himmel
(1999) pointed out that the diversification of fuel portfolio would bring money and job back to
the USA economy. Moreover, the development of energy crops dedicated to the biofuel
production would imply a boost to agricultural sector. This analysis is also valid for developing
countries (Cardona and Sanchez, 2007), of which Nigeria is one. Fuel ethanol production has
increased remarkably, because many countries look for means of reducing oil import, boosting
rural economies and improving air quality. Global biofuel demand is projected to grow 133% by
2020 (Kosmala, 2010) and this will be of great benefit to those economies involved in bioethanol
production for export.
1.3.4 Advantages of bioethanol as engine fuel
Adding bioethanol to gasoline increases the oxygen content of the fuel, which implies a less
amount of required additive. The increased percentage of oxygen allows a better oxidation of the
gasoline hydrocarbons with consequent reduction in the emission of CO and aromatic
compounds (Malca and Freire, 2006). Wang et al (1999) corroborated this by writing that “using

9
bioethanol blended fuel for automobiles can significantly reduce petroleum use and exhaust
greenhouse gas emission”.
Bioethanol has a higher octane number, broader flammability limits, higher flame speed and
higher heat of vaporization (Yoosin and Sorapipatana, 2007). These properties allow for higher
compression ratio and shorter burn time, which lead to theoretical efficiency advantages over
gasoline in an internal combustion engine (Balat, 2009). Octane number is a measure of the
gasoline quality for prevention of early ignition, which leads to cylinder knocking. An
oxygenated fuel such as bioethanol, with high octane number, provides a reasonable antiknock
value (Balat and Balat, 2009).
It is believed that a given volume of ethanol could provide energy enough to drive about 75-80%
of the distance as the same amount of gasoline, although it has only about two-third of the energy
content (Galbe and Zachi, 2002).
Bioethanol when related to MTBE (methyl tert butyl ether), which is also an oxygenator of
gasoline, is not toxic and does not pollute ground water. Bioethanol is most commonly blended
with gasoline in concentrations of 10% bioethanol to 90% gasoline, known as E10 and
nicknamed “gasohol” (Oliveria et al., 2005). Bioethanol can be used as a 5% blend with petrol
under the EU quality standard EN228. Bioethanol can be used at higher levels, for example, E85
(85% bioethanol) (Demirbas and Karslioglu, 2007)
1.3.5 Disadvantages of bioethanol as engine fuel
Bioethanol has lower energy density than gasoline (bioethanol has 66% of the energy that
gasoline has). Also, the high oxygen content of ethanol and its ability to oxidize into acetic acid
induce compatibility issues with some materials used in the engine, such as metals or polymers.
In addition, ethanol leads to azeotropes with light hydrocarbon fractions and can lead to volatility
issues, low flame luminosity, lower vapour pressure and high latent heat of vapourization
(making cold starts difficult), miscibility with water (which can cause demixing issues when
blended with hydrocarbons), toxicity to ecosystem (since its combustion in engines induces
aldehyde emissions, which has negative impact on health) (Jeuland et al., 2004). Though the use

10
of bioethanol as engine fuel has some disadvantages, its advantages as engine fuel far outweigh
its disadvantages.
1.4 Feed stocks for bioethanol production
Bioethanol feedstock can be divided into three major groups: (1) starchy materials (2) sugar or
sucrose-containing feed stocks and (3) lignocellulosic biomass
1.4.1 Starch feed stocks
The starch feed stocks are mainly; cereals, tubers and roots. Cereal grains are used mostly as
food and feed. However because of their high starch content, they are also good feed stocks for
conversion to biofuels and other biobased products. Ethanol is the only biofuel that has been
produced commercially from these feed stocks in large quantities (Drapcho et al., 2008). Cereals
used as bioethanol feed stocks include: wheat, sorghum, rice and oats. The United States and
Canada are predominantly producers of bioethanol derived from corn. Tubers and roots are
potential feed stocks for ethanol production because of their high starch content. The two crops
that have been given much attention are cassava and potato. Cassava is mainly used as feed stock
in Brazil, Nigeria and China (Drapcho et al., 2008).
1.4.2 Sugar feed stocks
Main feedstock for ethanol production is sugar cane in form of either cane juice or molasses (by
-product of sugar mills). About 79% of ethanol in Brazil is produced from fresh sugar cane juice
and the remaining percentage from cane molasses (Wilkie et al., 2000). Sugar cane molasses is
the main feedstock for ethanol production in India, cane juice is not presently used for this
purpose (Ghosh and Ghose, 2003). Beet molasses are other source of fermentable sugars for
ethanologenic fermentation. Nigeria and other tropical countries use sugar cane as main feed
stock for ethanol production (Cardona and Sanchez, 2004). Sugar beet is the main feedstock for
the production of bioethanol in European Union member states (Cardona and Sanchez, 2007).
1.4.3 Lignocellulosic feedstocks
The three main components of lignocellulosic biomass are cellulose, hemicelluloses and lignin.
Cellulose, which is an abundant component in plants and wood, come in various forms and a
large fraction, comes from domestic and industrial wastes (Abella et al., 2007). Cellulose and
11
hemicelluloses can be hydrolyzed with chemicals and or enzymes to monomeric sugars, which
can subsequently become converted biologically to biofuels (Drapcho et al., 2008).
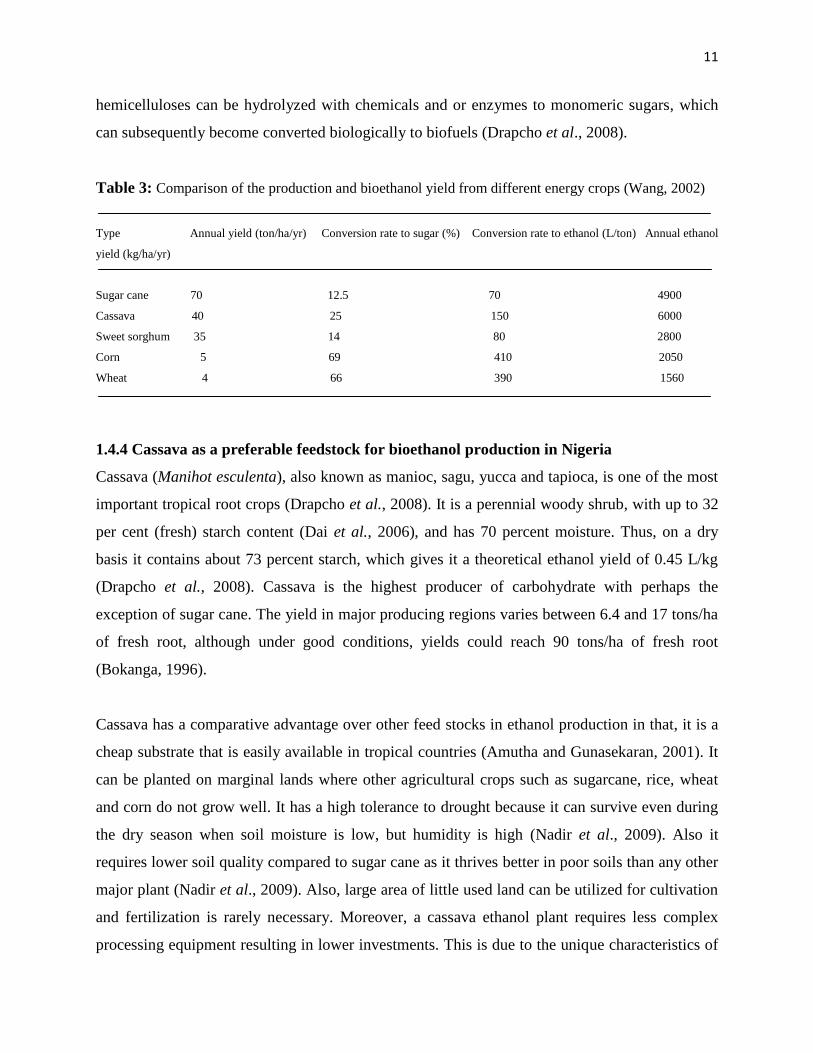
Table 3: Comparison of the production and bioethanol yield from different energy crops (Wang, 2002)
Type Annual yield (ton/ha/yr) Conversion rate to sugar (%) Conversion rate to ethanol (L/ton) Annual ethanol
yield (kg/ha/yr)
Sugar cane 70 12.5 70 4900
Cassava 40 25 150 6000
Sweet sorghum 35 14 80 2800
Corn 5 69 410 2050
Wheat 4 66 390 1560
1.4.4 Cassava as a preferable feedstock for bioethanol production in Nigeria
Cassava (Manihot esculenta), also known as manioc, sagu, yucca and tapioca, is one of the most
important tropical root crops (Drapcho et al., 2008). It is a perennial woody shrub, with up to 32
per cent (fresh) starch content (Dai et al., 2006), and has 70 percent moisture. Thus, on a dry
basis it contains about 73 percent starch, which gives it a theoretical ethanol yield of 0.45 L/kg
(Drapcho et al., 2008). Cassava is the highest producer of carbohydrate with perhaps the
exception of sugar cane. The yield in major producing regions varies between 6.4 and 17 tons/ha
of fresh root, although under good conditions, yields could reach 90 tons/ha of fresh root
(Bokanga, 1996).
Cassava has a comparative advantage over other feed stocks in ethanol production in that, it is a
cheap substrate that is easily available in tropical countries (Amutha and Gunasekaran, 2001). It
can be planted on marginal lands where other agricultural crops such as sugarcane, rice, wheat
and corn do not grow well. It has a high tolerance to drought because it can survive even during
the dry season when soil moisture is low, but humidity is high (Nadir et al., 2009). Also it
requires lower soil quality compared to sugar cane as it thrives better in poor soils than any other
major plant (Nadir et al., 2009). Also, large area of little used land can be utilized for cultivation
and fertilization is rarely necessary. Moreover, a cassava ethanol plant requires less complex
processing equipment resulting in lower investments. This is due to the unique characteristics of

12
cassava starch (Wang, 2002) and the low amounts of impurities which make the extraction of
starch from the root relatively easy.
Cassava crop is highly efficient in producing starch, and its starch is one of the best fermentable
substances for the production of ethanol. Cassava starch has several characteristics, which favour
its industrial use in general and in particular as a raw material in ethanol production. Some
characteristics of cassava starch are: its high purity, neutral flavour, solubility, development of
high viscosity and low tendency to retrograde compared with other starches such as those from
potato, rice and corn. According to Grace (1977) and Ocloo (2002), cassava flour promises to be
a good substrate for alcohol production due to its high content of fermentable sugars and stable
shelf life. Besides these, cassava flour has advantages such as complete and easier hydrolysis
compared to other flours (Vijayagopal et al., 1980). The ethanol yield of cassava per unit land
area is the highest among all known energy crops (Wang, 2002).
Nigeria is the world‟s largest cassava producer, producing about 36 million tons in 2004, 41.6
million metric tons in 2005(Drapcho et al., 2008), while in 2007, it was estimated at about 46
million metric tons (FAO, 2008), these figures represent about 18% of the world production.
With the current emphasis by the federal government on cassava production, future projections,
under a middle road scenario, targets 150 million tons by 2020 (Phillips et al., 2004). Adeoti
(2008) in his research found that fuel ethanol production from cassava root poses no threat to the
cassava food resource of Nigeria under various growth assumptions made.
1.5 Starch
Starch is a major energy storage component in cereal grains such as corn, wheat, sorghum, rice,
tubers (potato, yam, coco yam etc), and roots (cassava and sweet potato), (Van Beynum and
Roels, 1985).
1.5.1 Chemical composition of starch
Starch, chemical formula (C6H10O5)n, is a polymer of glucose and consist of two types of
polysaccharides; amylose and amylopectin, which represent approximately 98-99 % of the dry
weight. The ratio of the two polysaccharides varies according to the botanical origin of the

13
starch; normal starches contain 70-80 % amylopectin and 20-30 % amylose (Jane, 2009). In
mutant lines of diploid species originating from crops such as maize, starches can be obtained
with amylose contents in the range of 0% (waxy maize) to 84% (amylomaize) (Matveev et al.,
2001).
Amylose and amylopectin have different structures and properties; however, both molecules are
composed of a number of monosaccharides (glucose) linked together with alpha-1-4 and/or
alpha-1-6 linkages.
Figure 2: Structure of the starch granule (Jane, 2009).
1.5.2 Amylose
Amylose is a mainly linear polymer consisting of long chains of alpha-1,4-linked glucose units.
Its molecular weight is approximately 1×10⁵
- 1×10⁶, it has a degree of polymerisation (DP) by
number (DPn) of 324-4920 with around 9-20 branch points equivalent to 3-11 chains per
molecule (Smith, 2001). The chains can easily form single or double helices. On the basis of X-
ray diffraction studies, the presence of A-type and B-type amylose is indicated. The structural
elements of B-type are double helices, which are packed in an anti parallel, hexagonal mode. The
central channel surrounded by 6 double helices is filled with water (36 H2O/unit cell). A-Type is
very similar to B-type, except that the central channel is occupied by another double helix,
making the packing closer. In this type, only 8 molecules of water per unit cell are inserted
between the double helices. (Sajilata et al., 2006).

14
Figure 3: Chemical structure of amylose (Reis et al., 2002).
1.5.3 Amylopectin
Amylopectin is a much larger molecule than amylose with a molecular weight of 1×10⁷
– 1× 10⁹
and a heavily branched structure built from about 95 % alpha-1,4 and 5 % alpha-1,6 linkages.
The DPn is typically within the range 9600-15900. Chain lengths of 20 to 25 glucose units
between branch points are typical.
Figure 4: chemical structure of amylopectin (Reis et al., 2002).
Amylopectin structure is often described by a cluster model (Figure 2). Short chains (A) of DP
12-16 that can form double helices are arranged in clusters. The clusters comprise 80 % to 90 %
of the chains and are linked by longer chains (B) that form the other 10 % to 20 % of the chains.
Most B-chains extend into 2 (DP about 40) or 3 clusters (DP about 70), but some extend into
more clusters (DP about 110). B chains bind to other B chains or to a C chain which has a
reducing end and of which there is one per molecule (Sajilata et al., 2006).
On the basis of X-ray diffraction experiments, about 70 % of the mass of starch granule is
regarded as amorphous and about 30 % as crystalline (semicrystalline character). The amorphous
regions contain the main amount of amylose but also a considerable part of the amylopectin. The

15
crystalline region consists primarily of the amylopectin (Sajilata et al., 2006). The schematic
organisation of amylose and amylopectin molecules in starch granule can be seen in Figure 3.
Classification based on diffractometric spectra does not follow the morphological classification,
but is also able to group most starches conveniently according to their physical properties.
Generally, most cereal starches give the so-called A-type pattern; some tuber starches (e.g.
potato) and cereal starches rich in amylose yield the B-type pattern, while legume starches
generally give a C-type pattern while V-type occurs in swollen granules (Pérez et al., 2009).
These types depend partly on the chain length making up the amylopectin lattice, the density of
packing within the granules, and the presence of water (Sajilata et al., 2006).
1.5.4 Sources and industrial application of starch
The most important sources for starch are potatoes, maize, wheat and cassava (Ellis et al., 1998).
The properties of the starches from these species differ considerably, not only in the relative
proportions of amylose and amylopectin and the characteristics of these molecules, but also in
the amount of non-starch components of starch granules, such as lipids, proteins and phosphate
groups.
Numerous industrial applications of starch exist, either in its native form or after modification.
Starch is, for example, applied in adhesive, agrochemical, cosmetic, detergent, food, medical, oil,
drilling, paper and board, pharmaceutical, plastic, purification, and textile industries (Ellis et al.,
1998).
Starch can be modified by thermal treatment, by chemical treatment, or by enzymatic treatment.
The most important enzymatic treatment method used to modify starch consists of treatment with
hydrolytic enzymes during which glycosidic bonds are broken (Guzman-Maldonado and
Paredes-Lopez, 1995).
1.5.5 Starch swelling and gelatinization
Starch granules are partially insoluble in water. They must typically undergo a multi-stage
process called gelatinization in order to solubilize the particles. At low temperatures, starch is

16
insoluble because of hydrogen bonding forces between starch molecules. Though the hydrogen
bonding forces are weak, the large number of bonds involved keeps the granules from dissolving
in cold water. When starch granules in water are heated from 20oC - 60
oC, they absorb water that
disrupts the weak hydrogen bonds, and allows them to swell (Xie et al., 2006). At this phase, the
process is reversible. With further heating, the granules begin to rupture and collapse, releasing
starch chains into solution, leaving a viscous dispersion of swollen granule fragments and
dissolved starch molecules. The point at which the process becomes irreversible is called the
initial or onset gelatinization temperature. For cornstarch granules, this generally occurs between
65-80oC (Van Beynum and Roels, 1985). Further heating above the gelatinization temperature
causes further hydrogen bonding disruption, swelling and crystalline structure melting (Parker
and Ring, 2001) In addition, differential scanning calorimetry (DSC) measurements indicate that
heat is taken up during this temperature increase (Donovan, 1979). Together with all these
phenomena occurring during gelatinization, an irreversible order-disorder transition takes place
(Jenkins and Donald, 1998).
Gelatinization of starch is affected by the starch-water ratio (Parker and Ring, 2001). When the
moisture content of the starch-water mixture is low, complete swelling and disruption of the
starch granules is not possible and only part of the crystallinity of the starch granules is lost. The
remaining crystallinity only disappears after heating to higher temperatures. This could be
quantitatively described by a model based on the Flory equation that was developed for the
description of the degree of gelatinization as a function of temperature and starch concentration
(Baks et al., 2007). The article of Jenkins and Donald (1998) provides an overview of the various
theories that provide explanations for the phenomena that take place during thermal
gelatinization of starch.
Starch can also be gelatinized by application of high pressures. In certain aspects, high pressure
gelatinization differs from thermal gelatinization. During high pressure gelatinization,
disintegration of the granules is less (or the granules even remain intact), amylose solubilization
is less, and swelling of the granules is limited (Knorr et al., 2006). On the other hand, the effect
of the starch-water ratio on high pressure gelatinisation is similar. In case of thermal
gelatinisation, a higher temperature is required to achieve complete gelatinisation and in case of

17
high pressure gelatinisation a higher pressure is required to achieve complete gelatinisation
(Kawai et al., 2007).
Figure 5: Gelatinization of starch granule (Kendra, 2012)
1.6 Enzymatic hydrolysis of starch
Starch is a high yield feedstock for ethanol production, but its hydrolysis is required to produce
ethanol by fermentation. Starch degradation process catalysed by enzyme is known as enzymatic
hydrolysis. One of the most important enzymatic reactions that are carried out at an industrial
scale is the enzymatic hydrolysis of starch. Starch can be hydrolysed enzymatically to yield
several commercially relevant hydrolysates (Marchal, 1999). Starch can be converted to simple
sugars by acid or enzymatic hydrolysis, but commercially, most hydrolysis today has been
replaced by enzymatic hydrolysis, as enzymatic hydrolysis has many advantages over acid
hydrolysis. Enzymes have higher specificity, so products can be developed with better control.
Secondly, enzymatic hydrolysis is performed under milder conditions, which results in fewer
side reactions and lower operating costs (Nigam and Singh, 2011). Starch must be hydrolyzed to
single glucose units before being fermented into ethanol. The enzymatic hydrolysis of starch
consists of three steps: gelatinization, liquefaction and saccharification.
Gelatinization of starch is required to increase the accessibility of the substrate and to
enhance the hydrolysis rate (Van der Maarel et al., 2002). After gelatinization, starch can be
hydrolyzed. The degree of gelatinisation is an important parameter during the enzymatic
hydrolysis of starch. The degree of gelatinisation is affected by temperature, pressure, starch
concentration, and treatment time (Baks et al., 2007). Besides the degree of gelatinisation, the
activity and stability of the enzyme are also very important.

18
During liquefaction which is the first stage of hydrolysis, the viscosity of the gelatinized
starch mixture is reduced due to partial hydrolysis of the carbohydrate polymers. During the
second hydrolysis stage called saccharification, these partially hydrolyzed starch chains are
broken down into glucose, maltose, maltotriose, and some higher oligomers. The dextrose
equivalent varies between 40 and 98 depending on the enzyme that was used.
The properties of the product formed during enzymatic hydrolysis of starch can be varied by
using different enzymes (Guzman-Maldonado and Paredes-Lopez, 1995; Van der Maarel et al.,
2002). Hydrolysate products are usually characterized by their dextrose equivalent (D.E.), which
is a measure of the amount of glycosidic linkages that have been hydrolysed (Chaplin and Bucke,
1990). Three major product groups can be distinguished (Kennedy et al., 1988). Firstly, high
maltose syrups (dextrose equivalent between 40 and 55) are used in the confectionery industry
for the manufacture of hard sweets, in industries producing frozen desserts to control the crystal
formation, and in the brewing industry due to their high non-glucose fermentability (Fullbrook,
1984). Secondly, high dextrose equivalent syrups (dextrose equivalent between 56 and 68) are
used in the confectionery industry; in brewing and fermentation industries, and in general food
production (for soft drinks, jams, conserves, and sauces). Thirdly, high glucose syrups (dextrose
equivalent between 96 and 98) are used in brewing and fermentation industries, in beverage
industry, for the manufacture of crystalline D-glucose, and as starting material for the production
of fructose syrup (Fullbrook, 1984).
Alpha amylase (1,4-α-D-glucanohydrolase, E.C. 3.2.1.1) is often used for the enzymatic
hydrolysis of starch at an industrial scale, where it plays an essential role in the liquefaction and
subsequent saccharification of starch to give smaller carbohydrates (Chaplin and Bucke, 1990;
Van der Maarel et al., 2002).
1.7 Alpha amylase
The starch-degrading enzyme, alpha amylase (1,4-α-D-glucanohydrolase, E.C. 3.2.1.1) is widely
distributed in nature. This extracellular enzyme hydrolyses α-1,4 glycosidic linkages randomly
throughout the starch molecule in an endo-fashion, producing oligosaccharides and
monosaccharides including maltose, glucose and alpha limit dextrin (Nigan and Singh, 2011).

19
1.7.1 Structural and functional characteristics of alpha amylase
Alpha amylase is a monomeric, calcium binding glycoprotein. Its single polypeptide chain has
496 amino acid residues with four disulfide bridges. The alpha amylases belong to glycosyl
hydrolase family 13, which also include pollulanase, iso-amylase, and cyclodextrin glycosyl
transferase. These enzymes are highly homologous in structure consisting of two distinct
domains. Domain A contains the catalytic site surrounded by a (β/α)8-barrel that was first
discovered in triosephosphate isomerase (Janecek et al., 1 997). Domain B is composed of a
complex loop of varying length inserted between β strand 3 and α helix 3 of the (β/α)8-barrel.
The functional diversity and stability of different enzymes may be attributed to domain B
(Janecek et al., 1997).
Al1 alpha amylases share eight conserved residues and seven of these residues are located at the
active site of the catalytic (β/α)8-barrel.
Figure 6: Schematic representation of the(β/α)8- barrel (A) and 3D structure of the α-amylase of
Aspergillus oryzae or Taka amylase(B), obtained from the Protein Database (Janecek et al.,
1997).
There are always two invariant residues with carboxylic acid side chains (Glu, Asp) located at
about 4.5 to 5.5 A from each other, a characteristic of retaining enzymes which conserve the
anomeric configuration in the product.
The enzyme-catalyzed hydrolysis of the glycosidic bond takes place via general acid catalysis,
and requires a proton donor and a nucleophile/base. The hydroxyl group at the anomeric carbon
of the newly formed product can be the same (retaining) or inverted (inverting) compared to the
configuration in the glycosidic linkage. The proton donor is located at the same position in both
retaining and inverting enzyme. The nucleophilic base in the retaining enzyme is in close

20
proximity to the sugar anomeric carbon. However, this base is more distant in inverting enzymes,
in order to accommodate a water molecule between the two catalytic residues. Hence, the
commonly observed distance between the two carboxylic acid residues in the retaining enzymes
is about 4.5 to 5.5 A as compared to 10 A in the inverting enzymes (McCaxter and Withers,
1994). Two X-ray structures have been determined for cyclodextrin glycosyltransferase in
complex with an intact substrate, and the other with a covalently bound intermediate. The
study provides more definite proof for the α-retaining mechanism used by all the enzymes in
the α-amylase family.
1.7.2 Factors affecting the activity and stability of alpha amylase
The activity and stability of α-amylase are affected by temperature, pressure, pH, substrate
concentration, and additives (Fitter et al., 2001). According to Wiseman 1987, alpha amylase has
an isoelectric point of 5.4, excellent pH and temperature of enzymatic activity at 4.7 and 55oC
respectively. Optimal temperature for alpha amylase has been reported from 40oC – 60
oC; while
in the presence of calcium ion, it was increased to 75oC. The optimal requirements for the
activity and stability of alpha amylase vary with the enzyme source.
1.7.3 Sources of alpha amylase
Alpha amylases are found in most organisms that require the conversion of stored or ingested
carbohydrate. They are widespread among higher plants, animals and microorganisms (Kumar et
al., 2009). Alpha amylase has been derived from several fungi, yeasts and bacteria. However,
enzymes from fungal and bacterial sources have dominated applications in industrial sectors
(Gupta et al., 2003). In animals, the main sources of the enzyme are: the salivary gland and the
pancreas, whereas in plants, alpha amylase is most often associated with seed germination.
Table 4: Optimal pH and temperature requirements for various alpha amylases (Maureen, 1999)
Enzyme Source pH range Optimal pH Optimal
temperature(oC)
Inactivation
temperature(oC)
Pancreatic Porcine
pancrease
5.5-8.5 6.0-7.0 40-45 75
Bacterial Bacillus 4.5-9.0 6.5-7.5 70-85 95

21
subtilis
Thermo
stable
Bacterial
Bacillus
licheniforms
5.8-8.0 7.0 90-105 120
Fungal Aspergillus
oryzae
4.0-7.0 5.0-6.0 55-85 80
Malt Barley 3.5-7.5 4.5-7.0 60-70 85
1.7.4 Industrial application of alpha amylase enzyme
Alpha amylases are one of the most important and widely used enzymes whose spectrum of
application has widened in many sectors such as clinical, medical and analytical chemistry. The
most widespread applications of α-amylases are in the starch industry, where they are used in the
hydrolysis of starch into fructose and glucose syrups (Nielsen and Borchert, 2000). Beside their
use in starch saccharification, they also find application in food, baking, detergent, textile, paper,
brewing and distilling industries (Aktinson and Morituna, 1991). For instance, alpha amylase is
employed in the milling and baking industry (Anderson and Watson, 1982) to hydrolyse starch to
smaller carbohydrate, so as to reduce the dough viscosity and increase sugar levels, prolong
freshness, improve softness and crust quality. Similarly, in the brewing and beverage industries
(Shallenberger,1990; Yeshajaha, 1991), alpha amylase is employed in mash thinning, improving
runoff of wort and the general quality of the end product. The sweetener and confectionery
industries (Johnson, 1976; Wardrip, 1971; Alvin et al., 2002) have used alpha amylase to control
the ratios of different saccharrides to achieve specific product qualities. Also it has been reported
that, the use of enzymes in detergent formulations enhances the detergent ability to remove tough
stains and make the detergent environmentally safe. Amylases are the second type of enzymes
used in the formulation of enzymatic detergents, and 90% of all liquid detergents contain these
enzymes (Gupta et al., 2003). These enzymes are used in detergents for laundry and automatic
dishwashing to degrade the residues of starchy foods such as potatoes, gravies, custard,
chocolate, etc. to dextrin and other smaller oligosaccharides (Mukherjee et al., 2009). Moraes et
al (1999), Oner (2006) and Ocloo and Ayernor (2010), separately reported the use of amylase in
hydrolysis of starch for bioethanol production. Increasing utility and consumption of alpha

22
amylase in different industries has placed a greater stress on increasing indigenous production
and search of more rapid process (Gupta et al., 2008).
1.7.5 Malted cereals as sources of alpha amylase
Malted cereals have been used as sources of starch-hydrolyzing enzymes, due to the fact that
germination induces the synthesis of hydrolytic enzymes (Obatolu, 2002). Malting forms a
critical stage in the production of cereal-based beverages in which amylase and proteases
inherently embedded in the cereal grain are activated for the purpose of hydrolysis of starch and
protein into sugars and amino acids respectively (Okafor, 1987). Evans et al (2003), reported that
alpha amylase is synthesized during cereal development and stored in matured endosperms.
Alpha-amylase, as other amylases, increase markedly during germination. It has been shown that
alpha amylase yield will peak within 3 - 4 days of cereal germination (Egwim and Oloyede,
2006). George-Kraemer et al (2001), have shown that amylase activity is a good predictor of
Diastatic Power (DP) which is required in brewing processes and an important characteristic for
estimating the quality of malt for beer production (Evans, et al., 1995).
Sprouting cereals appear to be one of the popular sources of industrial amylase for some
developing economies. Amylase obtained from cereals during malting is the main enzyme
employed in enzymatic saccharification of starch in most starch-based industries in Nigeria.
Such industries include breweries, pharmaceuticals, distilleries etc. The major cereals employed
in Nigerian industries are maize, sorghum and millet (Egwim and Oloyede, 2006). Solomon et al
(1987) developed standard malt and amylase for the brewing industry from sorghum. Okafor et
al (1998) have shown however that maize, sorghum and millet have poor malting quality. This
results in low yield of amylase and consequently a low yield of fermentable sugars. Barley and
wheat are most popular sources of cereal amylase employed in the food industries. It is estimated
that about 10.4% of barley produced worldwide is used in malt and enzyme production for the
brewery and confectionery industry (Palmer, 1989). The cultivation of barley in Nigeria has
however met with little success. As such, huge amount of foreign exchange was spent annually
in importing barley malt before the ban in 1988. Industrialists have therefore resorted to
importation of microbial amylases for starch hydrolysis. However, present realities show that
local resources can be used effectively for malt and enzyme production. The common cereals
include maize, rice, sorghum, acha and millet. Earlier studies have shown sorghum to be the

23
most suitable (Shambe et al., 1989). Other local and unpopular cereals may also be a close
alternative (Egwim and Oloyede, 2006). Sorghum and acha (Digitaria exilis) were shown to
have higher germination capacity than other cereals such as maize and rice (Egwim and Oloyede,
2006). Before now, sorghum alpha amylase was shown to be the closest alternative to imported
alpha amylase for industrial purposes and acha alpha amylase can also be as good as sorghum
amylase and indeed could be a better source (Egwim and Oloyede, 2006). Nzelibe and Uwasike
(1995), reported that development of hydrolytic enzymes was significantly higher in Digitaria
exilis ("acha") than in sorghum. Though recently, Egwim and Oloyede (2006), estabilished that
alpha amylase from acha (Digitaria exilis) is a superior alternative to sorghum alpha amylase for
industrial processes. Acha has been shown to have higher alpha amylase yield than sorghum.
Acha may be a better source of amylase production and can substitute for sorghum alpha
amylase in industrial processing (Egwim and Oloyede, 2006).
1.8 Acha (Digitaria exilis)
Acha (Digitaria exilis) is probably the oldest African cereal which has survived for several
centuries mostly as weed (Jideani, 1999; Jideani, 1990). Acha, also known as finidi, fonio,
hungry rice, fonio blanc and petit mil, is the dry seed of Digitaria exilis (Jideani, 1999). For
thousands of years, West Africans have cultivated acha across the dry savannas. Indeed, it was
once their major crop. Even though few other people once heard of it, this crop still remains
important in areas scattered from Cape Verde to Lake Chad. In certain parts of Nigeria, for
instance, it is either the staple or major part of their diet (TNAP, 1996). It is one of the crops in
the West African sub region neglected by researchers and thus described as one of the orphan
crops or lost crops of Africa (National Research Council, 1996). Acha grows to a height of 30-80
cm (Gyang and Wuyep, 2005).
There are over 300 Digitaria species, which are sometimes grown as fodder; only three or four
are sometimes grown as cereals (CIRAD, 2004). The crop is perhaps one of the world‟s fastest
maturing cereals, producing grains just 6 to 8 weeks (42 to 56 days) after they are planted
(Ibrahim, 2001). The late varieties take up to 150 days to grow (CIRAD, 2004). In West Africa,
the two common species cultivated are Digitaria exilis or fonio, white fonio, fundi or findi, acha,

24
hungry rice and Digitaria iburua or black fonio, iburu etc. Of the two species, white fonio
(Digitaria exilis) is the more widely grown and used.
1.8.1 Acha cultivation, production and processing
Fonio thrives in the sandy, rocky soils of the Sahel both in drought and flood, and grows so fast
that two or three crops can be harvested each year; it is capable of growing where other crops
fail. It grows mostly in the Northern part of Nigeria and has a common Hausa name as Acha.
Philip and Itodo (2006) reported that Acha is not a demanding crop and will tolerate a wide
range of soil fertility. The potential for the production of acha grain in Nigeria is high, as it is
superior to other cereals in performance under moisture stress and low soil fertility. It also has
good capacity to respond to improved inputs.
In Nigeria, it is widely grown in commercial quantities in the cool region of Plateau State (which
is the highest producing state with an estimated production of 20,000 tons per annum), part of
Bauchi, Kebbi, Taraba, Kaduna, Gombe and Niger States (Gyang and Wuyep, 2005). Each year,
West African farmers devote approximately 300,000 hectare to acha cultivation, and yields of
600-700 kg per ha are recorded which translate to 180,000- 210,000 tons of grain annually
(National Research Council, 1996). Acha production and processing have been at a zero
mechanization level and no proper research effort has been carried out towards its mechanization
in Nigeria (Philip, 2011). There are no machines for planting, harvesting, threshing and dehulling
of acha crop on Nigerian farms. In order to bring acha to prominence, its competitiveness has to
be addressed by providing appropriate information and technologies that can support its mass
production (Philip and Issac, 2012).
Figure 7: Paddy Acha (Philip and Itodo, 2006)

25
1.8.2 Nutritional Importance of acha
Acha is one of the most nutritious of the cereals known to man (NAS, 1996). Ruskin et al (1996)
reported that acha is rich in methionine and cysteine, the limiting amino acids of most cereals.
Acha contains about 7% crude protein that is high in leucine (9.8%), methionine (5.6%) and
valine (5.8%). It is believed that its methionine content is twice as high as those of egg proteins
(Temple and Bassa, 1991).The low carbohydrate content of acha has made it to be a complement
in diabetes‟ diets. It gives attractive flavour to porridges, is a good substitute for semolina for
Europeans and has been used for brewing beer. According to Philip and Itodo (2006), acha has
the potential of providing enough food for the increasing population of poor people in West
Africa and in the Continent. Its increased utilization has prompted present study on the
possibility of modifying the grain into „acha malt‟ for making quality malt drinks and for
industrial application in hydrolyzing starch for the production of sugar syrup and bioethanol.
1.9 The Malting process
Malting is the germination of cereal grain in moist air under controlled conditions, the primary
objective being to promote the development of hydrolytic enzymes which are not present in the
ungerminated or raw grain. The malting process can be divided into three physically distinct
operations i.e. steeping, germination and drying (kilning) (Dewar et al., 1997).
1.9.1 Steeping
Steeping, which is the soaking of the cereal grain in water, is widely acknowledged as the most
critical stage of the malting process. It is performed to increase the moisture content of the grain,
to ensure rapid and uniform germination while minimizing embryo growth and respiration
(French and McRuer, 1990; Bamforth and Barclay, 1993). During imbibitions, the grain swells,
increasing its volume by approximately one quarter, the width and dept of the grain increase but
the length does not (Briggs, 1998). The acrospires, or sprout, and rootlet begin to grow, and these
are traditionally used as a guide to the malting process. The growing acrospires presses a visible
groove into the outer tissues and its length is noted as a fraction of the grain‟s (Briggs, 1998).
When imbibitions begin, the embryo and husk absorb water more rapidly than the endosperm,
and it has been thought that the embryo regulates water uptake (Bamforth and Barclay, 1993).

26
More recently, it has been suggested that structural differences in starchy endosperm also affect
water uptake during germination (Chandra et al., 1999).
1.9.2 Germination
During the malting process, germination is targeted to maximize the production of extractable
material for malt, through the process of endosperm modification. Modification describes the
physical and chemical changes that occur during malting, including the degradation of the
starchy endosperm and the associated biochemical changes (Briggs, 1998). The rate of
modification depends on several factors; the rate of moisture distribution through the endosperm,
the rate of enzyme synthesis, the extent of enzyme release and the structure of the endosperm
which will determine its digestibility (Bamforth and Barclay, 1993). Factors that are important
for the successful initiation of germination are: adequate moisture, temperature and presence of
oxygen (French and McRuer, 1990). For barley grain, germination normally occurs between
16oC to 20
oC, higher temperatures can increase growth rate, however, this cannot be sustained
over time as the rate of enzyme formation decreases.
The hormone activity of giberellic acid (GA) and abscisic acid (ABA) plays a large part in
endogenous regulation of germination by inducing and repressing the synthesis and secretion of
hydrolytic enzymes respectively (Fincher and Stone, 1993). GA stimulates the production of
hydrolytic enzymes, including alpha – amylase and beta – glucanase (Briggs, 1998; Fincher and
Stone, 1993). Alpha-amylase acts to break down starch to generate soluble sugars and is the most
extensively studied aleurone enzyme (Gibson, 2004).
1.9.3 Kilning
Kilning gradually dries the grain, reducing the high moisture levels required for germination
down to less than 5%. This must be regulated carefully to ensure the survival of the enzymes that
are crucial to brewing and distilling processes (Bamforth and Barclay, 1993). On completion of
kilning the malt grain is milled, ready to be used.

27
1.10 Fermentation
Fermentation is the internally balanced oxidation/reduction of organic compounds that takes
place in the absence of external electron acceptors (O2, NO3−, SO4
2−, etc.). In fermentation, the
oxidation of an intermediate organic compound is coupled to the reduction of another organic
intermediate. Fermentation, typically results in the formation of a carbon compound that is more
reduced than the original organic electron donor, and a carbon compound that is more oxidized.
Therefore, only a partial amount of the potential energy in the compound is captured by the
microorganism (Drapcho et al., 2008).
1.10.1 Production of ethanol from hydrolyzed starch by Saccharomyces cerevisiae
The yeast Saccharomyces cerevisiae is the universal organism for fuel ethanol production using
starch and sugar feed stocks. The sugars that are metabolizable by this organism include glucose,
fructose, mannose, galactose, sucrose, maltose, and maltotriose. Ethanol production by S.
cerevisiae is carried out via the glycolytic pathway (also known as the Embden-Myerhof-Parnas
or EMP pathway). In the fermentation of glucose by yeast such as Saccharomyces cerevisiae,
glycolysis proceeds with the electron (e-), transferred to NAD
+. Pyruvate is split into
acetaldehyde and CO2. To regenerate NAD+, acetaldehyde is reduced to ethanol by accepting the
2 e-. Thus, the net energy yield for the yeast cell is 2 ATP/ mol glucose, formed by substrate-
level phosphorylation. The oxidation states of C in glucose, ethanol, and carbon dioxide are 0,
−2, and +4, respectively, demonstrating the internal oxidation/reduction that is characteristic of
fermentation processes.
In the simplest form, production of ethanol from glucose can be expressed by the following
equation:
C6H12O6 + 2 Pi + 2 ADP →2 C2H5OH + 2 CO2 + 2 ATP + 2 H2O ……….. (1)
Glucose → 2 ethanol + 2 carbon dioxide + energy
From the above equation, it can be calculated that the theoretical yield is 0.511 g ethanol
produced per gram glucose consumed. This yield can never be realized in practice since not all
of the glucose consumed is converted to ethanol but part of it is used for cell mass synthesis, cell
maintenance, and production of by-products such as glycerol, acetic acid, lactic acid, and

28
succinic acid. Under ideal conditions, however, 90 to 95 percent of the theoretical yield can be
achieved (Thomas et al., 1996).

29
Glucose
Glucose-6-phosphate
Figure 8: Fermentation of glucose to ethanol by yeast. (Adapted from Drapcho et al., 2008)
Acetaldehyde + CO2
ATP
ADP
Fructose -6- Phosphate
ATP
ADP
Fructose -1- Phosphate
Acetaldehyde + CO2
Glyceraldehyde -3- phosphate
NAD+
NADH
P
1,3- biphosphoglycerate
ADP
ATP
3- Phosphoglycerate
Phosphoenolpyrurate
ADP
ATP
Pyrurate
NADH
NAD+
Ethanol
Glyceraldehyde -3- phosphate
NAD+
NADH
P
1,3- biphosphoglycerate
ADP
ATP
3- Phosphoglycerate
Phosphoenolpyrurate
ADP
ATP
Pyrurate
NADH
NAD+
Ethanol

30
Sugar transport is the first and also most important step in ethanol production. It has been
suggested to be the rate-limiting step of glycolysis in yeast (Becker and Betz, 1972).
Saccharomyces cerevisiae has a complex and highly effective system for sugar transport. There
are 20 genes for hexose transporters on the genome. The rate of transport can exceed 107 glucose
molecules per cell per second in fast fermenting cells (Kruckeberg, 1996).The hexose
transporters in S. cerevisiae can be divided into three classes: low-affinity transporters (Km (glucose)
=50–100 mM), moderate-affinity transporters (Km (glucose) about 10 mM), and high-affinity
transporters (Km (glucose) =1–2 mM) (Reifenberger et al., 1997).
Despite the complexity of the system, all the hexose transporters in S. cerevisiae use facilitated
diffusion for glucose transport. This mode of transport requires only a concentration gradient
across the plasma membrane. Sucrose, the major sugar in sugarcane and sugar beet, is
hydrolyzed to glucose and fructose by the enzyme invertase, which is located between the cell
membrane and the cell wall. The two monosaccharide products then are taken up by the cell.
Fructose enters the glycolytic pathway via its conversion to fructose-6-phosphate by hexokinase.
The two sugars obtained in starch hydrolysis, maltose and maltotriose, pass intact through the
cell membrane and are hydrolyzed intracellularly to glucose by the enzyme α-glucosidase.
Maltotetraose and higher polysaccharides (dextrin) are not metabolized by S. cerevisiae (Russel,
2003).
Glucose and sucrose are the two most preferred substrates among the sugars metabolized by S.
cerevisiae. In industrial applications, where many sugars are present, glucose and sucrose are
always consumed first. In fact, the presence of these two sugars causes repression in uptake and
metabolism of other sugars (Verstrepen, 2004).This catabolite repression is the result of both
competition for sugar transporters and down-regulation of the genes involved in the uptake and
metabolism of the other sugars. For example, the uptake of fructose is slowed down by glucose
since both sugars are transported into the cell by the same carriers, which have higher affinity for
glucose. In addition, glucose also can repress the expression of specific fructose transporters
(Verstrepen, 2004). Glucose represses the expression of the maltose-utilisation genes even when
maltose is present (Federoff et al., 1983).Glucose also causes repression of the galactose
utilisation genes even in the presence of that sugar (Adams, 1972). Catabolite repression is not

31
immediately relieved after glucose and sucrose are depleted. In fact the effect may last for
several hours. The repression of utilization of other sugars by glucose and/ or sucrose may have a
negative effect on fermentation rates in industrial ethanol production (Drapcho et al., 2008).
Saccharomyces cerevisiae requires certain minerals (e.g., Ca, Mg, Mn, Co, Fe, Cu, K, Na, Zn)
for growth and ethanol fermentation. A number of organic compounds also have been observed
to improve ethanol production. Most of the required nutrients normally are already available in
industrial feed stocks for ethanol production (Jones and Greenfield, 1984).
Saccharomyces cerevisiae is inhibited by its own product, that is, ethanol. Ethanol increases
fluidity and permeability of cell membrane and causes leakages of ions and small metabolites
(Salgueiro et al., 1988). Ethanol inhibition in S. cerevisiae can be reversed by addition of
calcium. However, addition of calcium to the fermentor must be controlled tightly since high Ca:
Mg ratios may cause antagonism of essential biochemical functions of magnesium and
negatively affect growth and ethanol production (Russel, 2003).
Acetic or lactic acid can also inhibit S. cerevisiae. In ethanol fermentation these acids are minor
by-products and accumulate only to relatively low concentrations, which are well below the
inhibitory levels. However, in industrial ethanol production completely sterile conditions are
never maintained and contamination by lactic acid and acetic acid bacteria can raise the
concentrations of these acids to harmful levels. The inhibitory effects of lactic acid and acetic
acid on growth and ethanol production are synergistic (Narendranath et al., 2001) and pH
dependent . Oxygen plays an important role in S. cerevisiae metabolism (Russel, 2003). Ethanol
inhibition of growth is reduced under micro-aerobic conditions compared to anaerobic conditions
(Hoppe and Hansford, 1984). Aeration conditions also impact the synthesis of by-products. At a
respiratory quotient (RQ) controlled at 17 or below, glycerol synthesis was almost eliminated
(Franzen, 2003). However, excess oxygen will result in significantly higher cell mass production
and lower ethanol yield (Russel, 2003).Thus, in practice optimal aeration conditions must be
carefully determined and maintained to achieve optimal ethanol production (Drapcho et al.,
2008).

32
1.11 AIM AND OBJECTIVES
The aim of this study was to investigate the potential of acha (Digitaria exilis) as local source of
hydrolytic enzymes in the production of bioethanol from cassava starch. The specific objectives
included:
Production of hydrolytic enzymes by malting of acha grains.
Hydrolysis of cassava starch by the malted acha and determination of the simple/reducing
sugar yields.
Determination of the optimal conditions for the hydrolysis of cassava starch by the
malted acha.
Fermentation of the cassava starch hydrolysate by yeast and the determination of the
ethanol yield.
Distillation of the alcohol produced from the fermented cassava starch hydrolysate.
33
CHAPTER TWO
MATERIALS AND METHODS
2.1 Materials
The cassava starch and acha grains used for this study were obtained from the Department of
Biochemistry, University of Nigeria Nsukka. The dry cassava starch flour was washed with
water and sun dried to remove dirt from it. The acha grains were carefully sorted to remove
damaged kernels and debris.
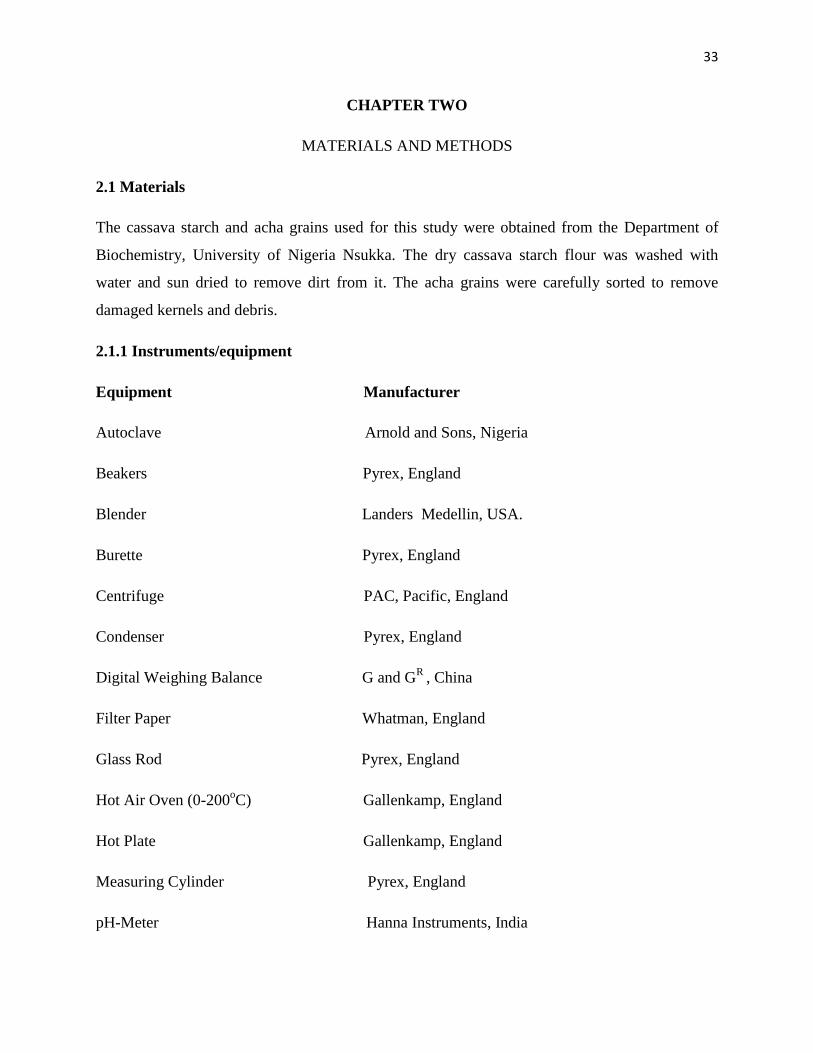
2.1.1 Instruments/equipment
Equipment Manufacturer
Autoclave Arnold and Sons, Nigeria
Beakers Pyrex, England
Blender Landers Medellin, USA.
Burette Pyrex, England
Centrifuge PAC, Pacific, England
Condenser Pyrex, England
Digital Weighing Balance G and GR
, China
Filter Paper Whatman, England
Glass Rod Pyrex, England
Hot Air Oven (0-200oC) Gallenkamp, England
Hot Plate Gallenkamp, England
Measuring Cylinder Pyrex, England
pH-Meter Hanna Instruments, India

34
Reagent Bottle Pyrex, England
Refrigerator Haier Thermocool, Nigeria.
Retort Stand Pyrex, England
Round Bottom Flask Pyrex, England
Spatula Pyrex, England
Spectrophotometer Spectrumlab 22PC, England
Syringe Dana-Jet, Nigeria
Test Tube Pyrex, England
Thermometer Pyrex, England
Water Bath Waterbath, Model DK, England
Wrist Watch Corum, Switzerland
2.1.2 Chemicals
The chemicals used for this study were of analytical grade and were procured from scientific
shops in Nsukka, Enugu State of Nigeria as well as from the Department of Biochemistry,
University of Nigeria, Nsukka. The chemicals and their manufacturers include;
Chemical Manufacturer
Acetic Acid M&B, England
Ammonium Molybdate Hopkin & Williams, England
Anhydrous Sodium Carbonate M&B, England
Baker‟s Yeast Keramel, Germany
Copper Sulfate Riedel-de Haan, Germany
Crystalline Phenol M&B, England
Dinitrosalicylic Acid BDH, England
Dipotassium Hydrogen Phosphate Lab Tech, India

35
Distilled Water STC, UNN
Glucose BDH, England
Potassium Dichromate Riedel-de Haan, Germany
Potassium Dihydrogen phosphate Merck, Germany
Potassium Sodium Tartrate Sigma, USA
Sodium Acetate Sigma, USA
Sodium Hydrogen Arsenate M&B, England
Sodium Hydroxide Riedel-de Haan, Germany
Sodium Sulfate Riedel-de Haan, Germany
Sodium sulfite M&B, England
Sodium Thiosulfate Penta Hydrate M&B, England
Starch Hopkins & Williams, England
Sulfuric Acid M&B, England
2.2 Methods
2.2.1 Preparation of reagents
Reagents for reducing sugar determination and preparation of glucose standard curve
Alkaline copper tartrate reagent
A) A quantity, 2.5 g anhydrous sodium carbonate, 2 g sodium bicarbonate, 2.5 g potassium
sodium tartrate and 20 g anhydrous sodium sulfate were dissolved in 80 ml distilled water
and made up to 100 ml.
B) A quantity, 15 g copper sulfate was dissolved in a small volume of distilled water. One
drop of sulfuric acid was added and the volume made up to 100 ml with distilled water.
Then, 4 ml of solution B was mixed with 96 ml of solution A before use.

36
Arsenomolybdate reagent
A quantity, 2.5 g ammonium molybdate was dissolved in 45 ml of distilled water and 2.5 ml of
sulfuric acid was added and mixed well. Then, 0.3 g of disodium hydrogen arsenate was
dissolved in 25 ml of water. The two solutions were mixed thoroughly and incubated at 37oC for
24 h.
Stock Standard glucose solution
A quantity, 100 mg of glucose, was dissolved in 100 ml of distilled water.
Working standard glucose solution
A quantity, 10 ml of stock, was diluted to 100 ml with distilled water.
Reagents for the determination of ethanol yield during fermentation
Acid dichromate solution (0.01 molL-1
)
A quantity, 125 ml of water was measured into 500 ml conical flask. Then, 70 ml of concentrated
sulfuric acid was carefully added with constant swirling. The flask was cooled under cold water
tap and 0.75 g of potassium dichromate added. The solution was diluted to 250 ml with distilled
water.
Starch indicator solution (1.0 % solution)
A quantity, 1.0 g of soluble starch, was dissolved in 100 ml of hot distilled water. The solution
was stirred until the starch dissolved.
Sodium thiosulfate solution (0.03 molL-1
)
A quantity, 7.44 g of Na2S3O3.5H2O, was dissolved with distilled water in a one litre volumetric
flask. The solution was subsequently made up to the one litre mark.

37
Reagents for assay of α-amylase activity during malting
Dinitrosalicylic Acid reagent (DNS Reagent)
The following, 1 g dinitrosalicylic acid, 200 mg crystalline phenol and 50 mg sodium sulphite
were dissolved by stirring in 100 ml of 1 % NaOH and stored at 4oC.
2 % soluble starch
A quantity, 2 g of starch dissolved in 100 ml of hot water and stirred thoroughly.
Preparation of buffers
0.05 M Citrate buffer
A quantity, 10.51g of sodium citrate, was dissolved in 500ml of distilled water, then the pH was
adjusted to 6.0 with citric acid and the volume made up to 1000ml with distilled water.
0.2 M Acetate buffer
A quantity, 5.45 g of sodium acetate, was dissolved in 200 ml of distilled water to give 0.2 M
sodium acetate buffer.
A quantity, 3 ml of acetic acid, was dissolved in 252 ml of distilled water to give 0.2 M acetic
acid.
0.2 M Phosphate buffer
A quantity, 2.72 g of potassium dihydrogen phosphate, was dissolved in 100 ml of distilled water
to give 0.2 M potassium dihydrogen phosphate buffer.
A quantity, 3.48 g of dipotassium hydrogen phosphate, was dissolved in 100 ml of distilled water
to give 0.2 M dipotassium hydrogen phosphate buffer.
2.2.2 Glucose standard curve by the Nelson-Somogy method.
A quantity, 0.1, 0.2, 0.3, 0.4, 0.5, 0.6, 0.7, 0.8, 0.9 and 1 ml, of the working standard glucose
solutions was each pipetted into ten test tubes. The sample and standard test tubes were made up
to 2 ml with distilled water. Then, 2 ml of distilled water was added into a separate test tube to

38
set as blank. After wards, 1ml alkaline copper tartrate reagent was added to each test tube. The
test tubes were placed in a boiling water bath for ten minutes. The tubes were cooled and 1ml
arsenomolybdate reagent was added to each test tube. The volume of each test tube was made up
to 10ml with distilled water. The absorbance of the blue colour was read at 620 nm after ten
minutes. The graph of the absorbance against glucose concentration was plotted.
2.2.3 Alpha amylase yield in sprouting acha cereal (Ezeogu et al., 1997)
A quantity, 500 g of cereal, was cleaned and sprouted using a modified method described by
Ezeogu et al (1997). Samples were withdrawn from the sprouting cereal at 24 h intervals up to
144 h (six days). A quantity, 1 g of sprouting cereal, was milled and added with 5 ml of pre-
chilled 0.05 M citrate buffer, pH 6.0; the resulting homogenate was centrifuged at 10,000 xg for
10 minutes. Enzyme activity was assayed in the supernatant as yield of crude enzyme.
2.2.4 Assay of Enzyme Activity (Kang et al., 1997)
Alpha amylase activity was assayed using a modified method described by Kang et al (1997). A
quantity, 0.1 ml of supernatant (crude enzyme), was pipetted into separate test tubes and 0.9 ml
of 2 % soluble starch was added. The mixtures were incubated under constant shaking in a water
bath at 50oC for 30 minutes. The reaction was subsequently stopped by adding dinitrosalicylic
acid (DNSA) reagent. The mixture was boiled for at least 3 minutes for colour development.
Absorbance of the mixture was read at 550 nm against blank. The blank contained all the assay
reagents without the enzyme.
2.2.5 Malting of acha grains (modification of Ezeogu et al., 1997)
Acha grains (1 kg) were steeped in 3 litres of distilled water after prior sterilization with sodium
hypochlorite solution (containing 1 % available chlorine for 20 min). Steeping lasted for 96 h.
Grains were thereafter germinated for six days in germination trays in an atmosphere of near
water saturation. Grains were turned every 12 h and watered by spraying with 60 ml distilled
water At 24 h intervals, germinating grains were withdrawn and immediately kiln dried. Kilning
was for 24 h at 50°C in a forced draught oven. The malt was ground using a blender.

39
2.2.6 Hydrolysis of cassava starch using malted acha (Ocloo and Ayernor, 2010)
The method described by Ocloo and Ayernor (2010) was used. A quantity, 1 kg of cassava flour,
was mixed with 5000 ml of water to form slurry. The slurry was heated to gelatinization at 70°C
and allowed to cool at 50oC. About 250 g of malted Acha was added to the gelatinized mash at
70oC, stirred, and the mixture allowed to cool gradually to 50°C for the amylase in the malt to
convert the gelatinized starch to sugars. Thinned liquour was then heated to 70°C and the last
batch of 250 g malted Acha added to further convert the unhydrolysed starch to sugars. The
mixture was boiled briefly and immediately filtered using sieving cloth. The sweetwort (which is
the liguid extracted from the hydrolysed cassava starch which contains the sugars that will be
fermented by the yeast) produced was boiled again to arrest further enzyme action and then
cooled. Cassava flour hydrolysate having specific reducing sugar content was obtained.
2.2.7 Determination of reducing sugar content by the Nelson-Somogy method.
A quantity, 0.2 ml of the sweetwort, was made up to 2 ml with distilled water and 2 ml of
distilled water was added into a separate test tube to set as blank. After wards, 1 ml alkaline
copper tartrate reagent was added to each test tube. The test tubes were placed in a boiling water
bath for ten minutes. The tubes were cooled and 1 ml arsenomolybdate reagent was added to
each. The volume of each test tube was made up to 10 ml with distilled water. The absorbance of
the blue colour that developed was read at 620 nm after ten minutes. The reducing sugar content
was deduced from the graph of the glucose standard curve.
The reducing sugar concentration was calculated from the standard glucose curve using the
equation: y = 0.017 x + 0.126
Where y = absorbance and x = concentration of reducing sugars (µg/ml).
The total reducing sugar concentration = x (µg/ml) X dilution factor (200)
The dextrose equivalent (DE) or percentage reducing sugar is calculated as:
g reducing sugar expressed as glucose
% Reducing sugar = X 100
g dry solid weight

40
2.2.8 Determination of optimum quantity of enzyme (malted acha) to substrate (cassava
starch) during the hydrolysis of cassava starch (modification of Ocloo and Ayernor, 2010)
A) A quantity, 1 g of cassava starch, was weighed into five test tubes and 10 ml of water was
added to give 10 % w/v slurry. The slurry mixtures in the test tubes were shaken to mix
thoroughly. Then, 0.1 g, 0.2 g, 0.3 g, 0.4 g, and 0.5 g of the malted acha were weighed
out respectively. The test tubes were labeled as follows: 0.1 g, 0.2 g, 0.3 g, 0.4 g and 0.5
g respectively. The test tubes containing the starch slurries were put in a water bath and
heated to 70oC for 20 min until the starch slurries gelatinized. The test tubes were
subsequently allowed to cool to 50oC. The weighed out malted acha were added to the
labeled test tubes accordingly. The mixtures were stirred thoroughly using a glass rod and
the temperature raised gradually to 70oC and then incubated for 2 h in a water bath. The
mixture was sieved using a sieving cloth. The sweetwort was boiled further to arrest
further enzyme action and its reducing sugar content determined using the Nelson-
Somogy method.
The experiment above was repeated using 2 g of cassava starch.
2.2.9 Determination of optimum pH for cassava starch hydrolysis using malted acha
(modification of Ocloo and Ayernor, 2010)
A quantity, 1 g of cassava starch, was weighed into eight test tubes labeled, pH 3.0, pH 3.5, pH
4.0, pH 4.5, pH 5.0, pH 5.5, pH 6.0, pH 6.5, pH 7.0 and pH 7.5 respectively. Buffer solutions of
pH range 3.0 - 7.5 were prepared using both 0.2 M acetate (3.0 - 5.0) and 0.2 M phosphate (5.5 -
7.5) buffers. Then, 10 ml of the corresponding buffers were added to each of the labeled test
tubes accordingly to form slurry. The cassava starch slurries in the test tubes were shaken to mix
thoroughly. The test tubes containing the starch slurries were put in a water bath and heated to
70oC for 20 min until the starch slurries gelatinized. The test tubes were allowed to cool to 50
oC.
A quantity, 0.5 g of malted acha was added to each test tube. The mixture was stirred thoroughly
using a glass rod and the temperature raised gradually to 70oC and then incubated for 2 h in a
water bath. The mixture was sieved using a sieving cloth. The sweetwort was boiled further to
arrest further enzyme action and its reducing sugar content determined by the Nelson-Somogy
method.

41
2.2.10 Determination of optimum temperature for cassava starch hydrolysis using malted
acha (modification of Ocloo and Ayernor, 2010)
A quantity, 1 g of cassava starch, was weighed into four test tubes labeled, 50oC, 60
oC, 70
oC and
80oC respectively. Then, 10 ml of 0.2 M acetate buffer of pH 4.5 was added to each of the
labeled test tubes to form slurry. The slurry mixtures in the test tubes were shaken to mix
thoroughly. The test tubes containing the starch slurries were put in a water bath and heated to
70oC for 20 min until the starch slurries gelatinized. The test tubes were allowed to cool to 50
oC.
A quantity, 0.5 g of malted acha was added to each test tube. The mixtures were stirred
thoroughly using a glass rod. Each of the labeled test tube was incubated at its particular
temperature (i.e, 50oC, 60
oC, 70
oC and 80
oC) for 2 h in a water bath respectively. The mixture
was sieved using a sieving cloth. The sweetwort was boiled further to arrest further enzyme
action and its reducing sugar content determined by the Nelson-Somogy method.
2.2.11 Determination of optimum time for cassava starch hydrolysis using malted acha
(modification of Ocloo and Ayernor, 2010)
A quantity, 1 g of cassava starch, was weighed into seven test tubes labeled, 1 h, 2 h, 3 h, 4 h, 5
h, 6 h, and 7 h respectively. Then, 10ml of 0.2 M acetate buffer of pH 4.5 was added to each of
the labeled test tubes to form slurry. The slurry mixtures in the test tubes were shaken to mix
thoroughly. The test tubes containing the cassava starch slurries were put in a water bath and
heated to 70oC for 20 min until the starch slurries gelatinized. The test tubes were then allowed
to cool to 60oC. A quantity, 0.5 g of malted acha was added into each of the test tubes. The
mixture was stirred thoroughly using a glass rod, the temperature maintained at 60oC and then
incubated for 1 h, 2 h, 3 h, 4 h, 5 h, 6 h, and 7 h in a water bath accordingly. The mixture was
sieved using a sieving cloth after each time interval. The sweetwort was boiled further to arrest
further enzyme action and its reducing sugar content determined by the Nelson-Somogy method.
Note: it is important to state that the sweetworths produced after the hydrolysis of the cassava
starch by the malted acha was diluted by a factor of 1:200 dilutions (i.e 1 ml of the sweetworth in
200 ml of water) before the determination of its reducing sugar content by the Nelson-Somogy
method.

42
2.2.12 Production of ethanol from cassava starch hydrolysate (modification of Ocloo and
Ayernor, 2010)
A) A quantity, 20 g of cassava starch was weighed into 200 ml of 0.2 M acetate buffer of pH 4.5
to form slurry. The slurry mixture was stirred thoroughly and heated in a water bath to 70oC for
20 min, until the cassava starch slurry gelatinized. The slurry was allowed to cool to 50oC. A
quantity, 10 g of malted acha was added to the gelatinized cassava starch and the mixture
incubated at 60oC for 5 h. The mixture was sieved using a sieving cloth after the hydrolysis. The
sweetwort was boiled further to arrest further enzyme action and its reducing sugar content
determined by the Nelson-Somogy method. The cassava starch hydrolysate produced after the
hydrolysis of the cassava starch by the malted acha, was fermented in fermentation bottles
(previously sterilized to exclude any microorganis) containing about 30 ml cassava starch
hydrolysate and 1 ml of yeast inocula, of varying concentrations of 5 % (5 g of baker‟s yeast
dissolved in 100 ml of distilled water), 10 %, 15 %, 20 % and 25 % respectively, for each
fermentation bottle. The bottles were topped with tubes to allow carbon dioxide (CO2) to escape.
Fermentation was allowed for 9 days at 28oC - 30°C. The ethanol yield of each fermentation
medium was determined after each day.
2.2.13 Determination of ethanol yield (Acid dichromate redox titration method)
The fermented cassava starch hydrolysate sample was diluted to 1:50 (1 ml of sample made up to
50 ml) with distilled water. Then, 10 ml of acid dichromate solution was transferred to a 250 ml
conical flask with matching stoppers. Also, 1 ml of the diluted sample was added into a sample
holder (5 ml beaker). The sample holder was subsequently suspended over the dichromate
solution and held in place with a rubber stopper. The flask was stored overnight at 25 oC -30
oC,
after which the stopper was carefully removed and the sample holder discarded. The wall of the
flask was subsequently rinsed with 100 ml of distilled water and 1 ml of potassium iodide
solution was also added. The flask was swirled to mix its content. Blank was prepared by adding
10 ml of acid dichromate solution into another conical flask, after which 100 ml of water and 1
ml of potassium iodide solution were added and the flasks swirled to mix. A burette was filled
with sodium thiosulfate and both the sample and blank flask titrated with the sodium thiosulfate
solution. 1 ml of starch indicator solution was added when the brown iodine colour faded to
yellow and the titration was continued until the blue colour caused by the indicator disappeared.

43
The samples were titrated twice to get concordant results. The ethanol concentration was
calculated using the equations for the reaction shown below.
Cr2O72-
+ 14 H+ + 6I
- 2 Cr
3+ + 3I2 + 7H2O ………….. (1)
2 S2O32-
+ I2 S4O62-
+ 2I- ……………………………… (2)
The average volume of sodium thiosulfate used for both blank and sample titrations were
determined. The volume of sodium thiosulfate used for the sample was subtracted from the
volume used for the blank titration. This volume of sodium thiosulfate was now used to
determine the ethanol concentration. The number of moles of sodium thiosulfate in this volume
was calculated.
Using the equations above, the relationship between the moles of sodium thiosulfate and the
moles of ethanol was determined as follows
- 6 mol of S2O32-
is equivalent to 1 mol Cr2O72-
- And 2 mol of Cr2O72-
is equivalent to 3 mol of C2H5OH
- Then 1 mol of S2O32
is equivalent to 0.25 mol of C2H5OH
The equation for the ethanol yield in mol/dm3 is given as
Ethanol yield (mol/dm3) = 0.0075 M of ethanol × difference in volume of sodium thiosulfate
used in blank and sample × dilution factor.
Ethanol yield (g/dm3) = Molarity × Molar mass
Ethanol yield (g/100 ml) = Concentration (g/dm3)/ 10

44
2.2.14 Distillation process (Ocloo and Ayernor, 2010)
About 4000 ml of the fermented cassava starch hydrolysate was measured into a volumetric flask
at 20 °C and was washed into the distillation flask with about 20ml of distilled water. The
sample was distilled slowly into a receiving flask at temperatures between 78.3oC – 80°C, using
a simple distillation set up. About 150 ml of the distillate was collected and stored in a bottle.
2.2.15 Qualitative determination of ethanol (Chromic Acid test)
The chromic acid test may be used to distinguish an aldehyde, primary and secondary alcohols
from ketones and tertiary alcohols. A quantity, 5 drops of test sample was added to a test tube. A
quantity, 10 drops reagent grade acetone was also added to the test tube. Also, 2 drops of the
Jones reagent (chromic acid reagent) were added. The test tube was stirred to mix its contents.
The solution was allowed to stand for 1 minute. The result was recorded. The appearance of a
blue-green color or precipitate was a positive result.
2.2.16 Statistical analyses
The comparison of the significant effect of yeast concentration and time was made using one –
way Analysis of Variance (ANOVA). The variability of ethanol concentration, with differences
in means was compared using Post – Hoc multi comparison test. Their differences were
considered significant at p< 0.05 and our decisions made using Least Significant Difference
(LSD) method at p< 0.05. Also a regressional model was proposed to account for how yeast
concentration relate with time in determining ethanol yield. Statistical Package for Social
Sciences (SPSS) version 16 was used for this analysis.

45
CHAPTER THREE
RESULTS
3.1 Result of reducing sugar determination
Figure 9: Glucose standard curve
y = 0.0176x + 0.1263 R² = 0.9961
0
0.2
0.4
0.6
0.8
1
1.2
0 10 20 30 40 50 60
Ab
sorb
an
ce
Concentration (µg/ml)

46
3.2 Result of the malting process
The alpha amylase activity (mg glucose/ml/min) of the malted acha was determined for 6 days of
malting. Maximum alpha amylase activity was observed on the 5th
day of malting (Fig 10).
Figure 10: alpha amylase activity during malting of acha
0.04
0.042
0.044
0.046
0.048
0.05
0.052
0 1 2 3 4 5 6 7
am
yla
se a
ctiv
ity (
mg/m
l/m
in)
Malting time in days

47
3.3 Optimal conditions for cassava starch hydrolysis using the malted acha
Malted acha (0.1 g, 0.2 g, 0.3 g, 0.4 g and 0.5 g) was used to hydrolyse 10 % and 20 % w/v
cassava starch slurries. As shown in figure 11, 0.5 g malted acha to 10 % starch slurry gave the
maximum reducing sugar yield as was observed.
Figure 11: Optimum quantity of enzyme (malted acha) to substrate (cassava starch) during
cassava starch hydrolysis.
0
0.1
0.2
0.3
0.4
0.5
0.6
0.7
0.8
0 0.1 0.2 0.3 0.4 0.5 0.6
Ab
sorb
an
ce (n
m)
Quantity of malted acha (g)
10% starch slurry
20% starch slurry

48
The optimum pH for the hydrolysis of cassava starch with malted acha was determined over a
pH range of 3.0 to 7.5. As shown in figure 12, optimum pH of 4.5 was observed.
Figure 12: Effect of pH on cassava starch hydrolysis.
0
0.1
0.2
0.3
0.4
0.5
0.6
0.7
0.8
0.9
1
0 1 2 3 4 5 6 7 8
Ab
sorb
ance
(n
m)
pH

49
The optimum temperature for the hydrolysis of cassava starch with malted acha was determined
over a temperature range of 50oC to 80
oC. Optimum temperature of 60
oC was observed (Fig 13).
Figure 13: Effect of temperature on cassava starch hydrolysis.
0
0.1
0.2
0.3
0.4
0.5
0.6
0 10 20 30 40 50 60 70 80 90
Ab
sorb
an
ce (
nm
)
Temperature (oC)

50
The optimum time for the hydrolysis of cassava starch with malted acha was determined over a
time range of 1 to 7 h. Optimum time of 5 h was observed (Fig14).
Figure 14: Effect of time (in hours) on cassava starch hydrolysis.
0
0.1
0.2
0.3
0.4
0.5
0.6
0.7
0 1 2 3 4 5 6 7 8
Ab
sorb
ance
(n
m)
Time (h)

51
3.3 Results of the alcohol production process/ fermentation
The effect of yeast concentration and time on ethanol yield was determined over a period of 9
days; yeast concentrations of 5 % to 25 % were used. As shown in figure 14, least ethanol yield
of 1.38 g/100ml which was produced by the 5 % fermentation medium after one day and
maximum ethanol yield of 8.11 g/100ml, which was produced by the 25 % yeast fermentation
medium after 9 days were observed.
Figure 15: Effect of yeast concentration (percent) and time (days) on ethanol yield (g/100ml)
during fermentation.
0
1
2
3
4
5
6
7
8
9
0 2 4 6 8 10
eth
an
ol
yie
ld (
g/1
00m
l)
fermentation time in days
five percent
ten percent
fifteen percent
twenty percent
twenty-five percent
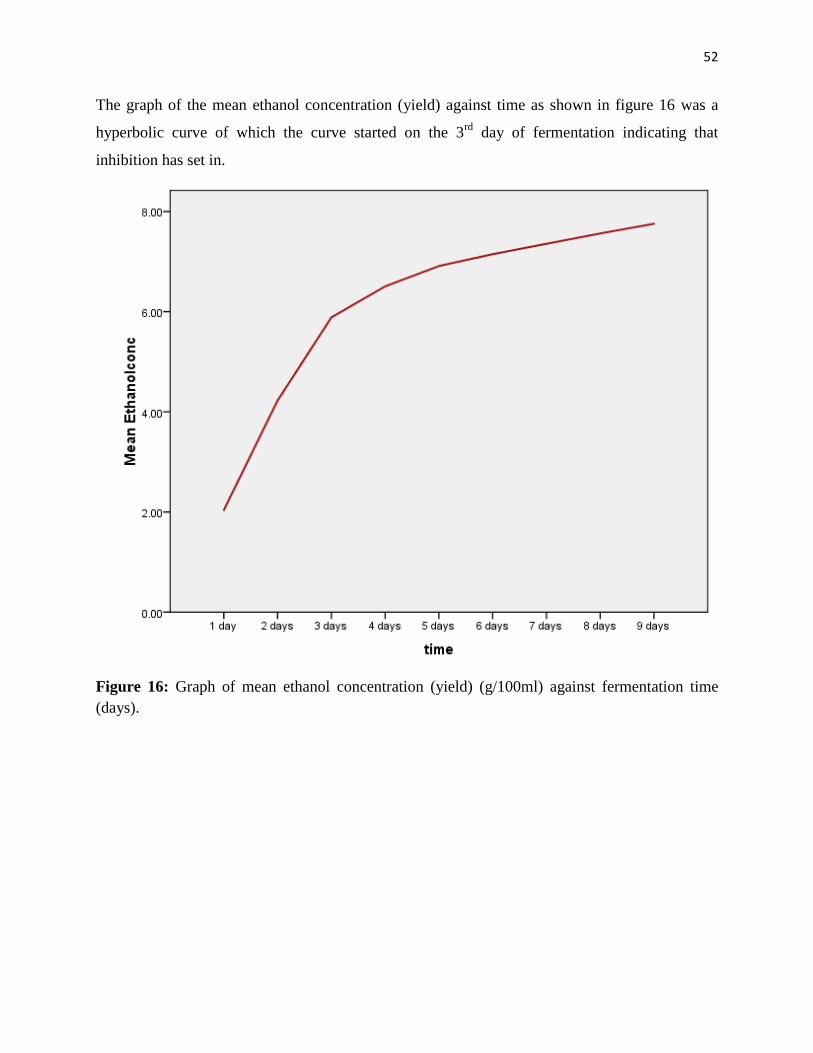
52
The graph of the mean ethanol concentration (yield) against time as shown in figure 16 was a
hyperbolic curve of which the curve started on the 3rd
day of fermentation indicating that
inhibition has set in.
Figure 16: Graph of mean ethanol concentration (yield) (g/100ml) against fermentation time
(days).

53
CHAPTER FOUR
DISCUSSION AND CONCLUSION
4.1 Discussion
The goal of the study was to employ locally sourced raw materials for the production of
bioethanol. Locally sourced cereal (Digitaria exilis) was used as the source of hydrolytic
enzymes for the hydrolysis of locally sourced starch (cassava) feed stock.
Bioethanol has emerged as the most suitable renewable alternative to fossil fuel, since, it is
environmentally friendly, biodegradable, less toxic and do not contribute to green house gas
effect and global warming. In addition, large scale bioethanol production has positive economic
and social effect by providing more money and job in those countries involved in its large scale
production. Malted cereals have been used as sources of starch hydrolysing enzymes, due to the
fact that germination induces the synthesis of hydrolytic enzymes such as alpha amylase
(Obatolu, 2002). Alpha amylase plays important role in the liquefaction and subsequent
saccharification of starch to give smaller carbohydrate (Chaplin and Bucke, 1990). The major
cereals previously used in Nigeria as sources of alpha amylase are maize, sorghum, millet and
barley. Due to the ban on the importation of barley in 1988 by the Federal Government of
Nigeria, sorghum became the closest alternative to barley in terms of synthesis of hydrolytic
enzymes until Nzelibe and Uwasike (1995) reported that “development of hydrolytic enzymes
was significantly higher in Digitaria exilis (Acha) than in sorghum”. Acha is referred to as the
lost crop of Africa, since little is known about this cereal and its potentials. In the present study,
the potential of acha (Digitaria exilis) as a local source of hydrolytic enzymes for cassava starch
hydrolysis was studied and the optimum conditions for this process investigated.
The development of alpha amylase during the germination of acha grain was studied for six days,
after the grain was initially steeped for four days. The enzyme activity was given as the amount
of enzyme required to liberate a unit of glucose per minute (mg glucose/ml/min) under the
reaction conditions. The result represented by figure 9, showed a gradual increase in the alpha
amylase activity with time from day 0 to day 5 of sprouting, after which there was a sharp
decline in the amylase activity on the 6th
day. The least activity of the alpha amylase (0.0416 mg
glucose/ml/min) was observed on day 0 of the acha sprouting while the maximum activity

54
(0.0510) was observed on the 5th
day of the sprouting. The result showed that time was
significant to alpha amylase yield during germination i.e., as time increased, alpha amylase yield
also increased. This observation agrees with the finding of Egwim and Adenomom (2009) which
showed that time was significant to alpha amylase yield in the cereals they studied of which acha
grain was among them. Nzelibe and Uwasike (1995) reported that alpha amylase activity
increased with germination time. Egwim and Oloyede (2006) also observed a similar trend when
they sprouted different cereals including acha for 200 h and obtained the maximum activity of
the alpha amylase at 96 h. The present study showed that acha must be sprouted for at least five
days for maximum alpha amylase production. According to Egwim and Adenomon (2009), the
yield of alpha amylase which is a function of time (when other conditions are constant), is a good
indicator of malting quality. This fact also agrees with the findings of Jin – Xin et al (2006), who
did show a strong relationship between amylase activity and malting quality.
Optimum quantity of enzyme (malted acha) to substrate (cassava starch) during cassava starch
hydrolysis with malted acha was studied. The experiment was carried out in two batches, in the
first batch, the substrate concentration was kept constant at 10 % w/v (1 g of cassava starch in 10
ml of distilled water), while the enzyme (malted acha) quantity was varied from 0.1 g – 0.5 g.
In the second batch, the substrate concentration was kept at 20 % w/v (2 g of cassava starch in
10ml of water), while the enzyme (malted acha) quantity was varied also from 0.1 g – 0.5 g. At
the end of the hydrolysis, the result (see figure 11) showed that 0.5 g enzyme (malted acha) to 10
% w/v cassava starch slurry gave the maximum concentration of reducing sugar released after
the hydrolysis. The 0.5 g enzyme (malted acha) to 20 % w/v starch slurry gave a lower reducing
sugar concentration when compared to the 0.5 g enzyme (malted acha) to 10 % w/v starch slurry.
From the result, it can be observed that lower substrate concentrations are more suitable in the
enzymatic hydrolysis of starch. Mojovic et al (2006), made a similar observation when he
reported that a 16% corn starch suspension gave far much higher glucose yield when hydrolyzed,
than a 40% corn starch suspension that was also hydrolyzed by the same quantity of enzyme.
Monica et al (2011) reported that increased substrate concentrations produced a decreased
enzymatic activity. A similar observation has also been reported by Baks et al (2008). These
observations could be due to diffusional constraints during enzymatic hydrolysis of starch caused
by increasing viscosity by gelatinized starch and also due to substrate inhibition experienced
when higher substrate concentrations were used.
The optimum pH for the hydrolysis of cassava starch by malted acha was determined over the
pH range of 3.0 to 7.5, the result represented by figure 12, showed that the amount of reducing
sugar produced during the hydrolysis of the cassava starch using the malted acha increased
gradually as the pH increased from 3.0 to 4.5, after which there was a gradual decrease in the

55
amount of reducing sugar produced as the pH increased further from 4.5 to 7.5. Higher reducing
sugar concentrations were observed between the pH 4.5 - 6.0, with the maximum concentration
of reducing sugar obtained at the pH 4.5.This means that the optimum pH for the hydrolysis of
cassava starch using the malted acha was 4.5. Lower reducing sugar concentration was obtained
at pH values less than 4.5 and higher than 6.0, with the least reducing sugar concentration
obtained at pH 3.0 and 7.5 respectively. The lower reducing sugar concentration observed at
these pH ranges (3.0 - 4.0 and 6.5 - 7.5) may be due to denaturation effect on the hydrolytic
enzymes of the malted acha at these pH values. The effect of pH observed in the present study,
indicated that change in pH had a significant effect on the rate of hydrolysis of cassava starch by
the amylolytic enzymes present in the malted acha. It has been reported that pH affects the
stability and activity of enzymes (Chaplin and Bucke, 1990). Similarly, Betiku and Ajala (2010)
reported that pH had a significant effect on the rate of hydrolysis of bread fruit starch by alpha
amylase.
The optimum temperature for the hydrolysis of cassava starch using malted acha was determined
over a temperature range of 50oC – 80
oC. The result represented by figure 13, showed that the
reducing sugar concentration during the hydrolysis of the cassava starch using malted acha
increased between 50oC – 60
oC and then decreased as the temperature increased above 60
oC.
The optimum temperature for the hydrolysis process was 60oC, since maximum amount of
reducing sugar was released at this temperature as indicated by the peak shown in figure (13).
The least amount of reducing sugar was released at higher temperature of 80oC. These
observations showed that, hydrolytic enzymes in malted acha worked best at milder temperatures
and became inactivated, with a reduction in their activity, at higher temperatures during the
enzymatic hydrolysis. This observation was possibly due to the denaturation of the hydrolytic
enzymes present in the malted acha at high temperatures. Ayernor et al (2006) and Carter et al
(1989) reported that, above the optimum temperature of hydrolysis, the higher the temperature of
hydrolysis, the lower the amount of glucose obtained and vice versa. Also, Ayoola et al (2012),
observed a similar trend, where the optimum temperature for the hydrolysis of both cassava and
sorghum starch by alpha amylase was 60oC. They reported that there was a decline in glucose
production as the temperature was increased from 60oC to 80
oC, then to100
oC. Our findings in
the present study agree with these previously published works. The relatively mild optimum
56
temperature of 60oC for the hydrolysis of cassava starch with malted Acha is economically
favourable for its large scale production, since it will help to save and reduce energy cost.
The effect of time on the hydrolysis of cassava starch with the malted acha was also studied over
a time range of 1 – 7 h. The result, figure 14, showed a gradual increase in the concentration of
reducing sugars during the hydrolysis of the cassava starch with the malted acha as time
increased from 1 – 5 h after which there was a sharp decrease in the reducing sugar concentration
as the time increased to 7 h. High concentration of reducing sugar was recorded between 3 – 5 h,
with the maximum concentration of reducing sugars obtained at the 5 h interval. This
observation showed that time is an important factor in the hydrolysis of cassava starch by malted
acha. Akin-Osanaiye et al (2005) reported that duration of hydrolysis significantly affected the
amount of reducing sugar released during the saccharification of Carica papaya by Aspergillus
niger. In their report the amount of reducing sugar released with time increased till after 48h
after which there was a decrease in the amount of reducing sugar released as time increased.
Afiukwa et al (2009) also did observe that time had effect on the hydrolysis of starch by crude
extract from partially germinated mango seeds. The optimum time (5 h) for the hydrolysis of the
cassava starch by the malted acha as observed from the present study, is relatively short and this
can be advantageous in large scale industrial starch hydrolysis.
The optimal conditions for the hydrolysis of starch by hydrolytic enzymes depends on the
sources of these enzymes, substrate concentration, amount of enzyme present and other
molecules present in the solution. Hammond and Ayernor (2000) studied the optimum pH and
temperature conditions for the hydrolysis of cassava starch by malted cereals prepared from rice,
maize, sorghum and millet. They reported that high amount of sugar was produced by malted
maize, sorghum and rice at pH 5.0, while that of malted millet was at pH 5.5. They also reported
an optimum temperature of 60oC for malted millet, maize and sorghum, while that of rice was
55oC. Ocloo and Ayernor 2010 obtained 50
oC as the optimum temperature for the hydrolysis of
cassava flour by malted rice. For malted barley, optimal pH for its amylase activity has been
reported as from 4.5 – 7.0, and its optimum temperature reported as between 60-70oC. Egwim
and Oloyede (2006), reported an optimum temperature of 70oC for the amylase enzyme in the
malted acha they studied. Afiukwa et al (2009) reported an optimum temperature of 60oC and pH
6.0 for the hydrolysis of starch by amylase crude extract from partially germinated mango seed,

57
while Adebiyi et al (2005) reported an optimum temperature of 55oC and pH 5.0 for the
hydrolysis of sorghum bicolor starch with amylase from Rhizopus spp. Optimal temperature for
alpha amylase has been reported from 40 – 70oC (Haq et al., 2010). In the present study,
optimum temperature of 60oC and pH of 4.5 were observed for the hydrolysis of cassava starch
by malted acha. Subsequently, optimal conditions of starch to malted acha concentration,
temperature (oC), pH, and time (h) were employed in the hydrolysis of cassava starch by malted
acha and a cassava starch hydrolysate (CSH) having a reducing sugar content of 5.4% was
obtained.
The effect of different concentrations of yeast (5 %, 10 %, 15 %, 20 % and 25%) and time on
ethanol yield during the fermentation of cassava starch hydrolysate (CSH) was determined over a
period of 9 days, at a temperature between 28oC – 30
oC. Saccharomyces cerevisae (Baker‟s
yeast) was used and the ethanol concentration (yield) of each fermentation media was
determined after each day. The result obtained (figure 15) indicated that nearly equal amounts of
ethanol were produced by the various fermentation media with different concentrations of yeast,
at the end of the 9-day fermentation period. This observation supports the fact that yeast
concentration did not affect the maximum ethanol yield significantly (p< 0.05). A similar
observation was made by Ocloo and Ayernor (2010), who used yeast concentrations ranging
between 5- 20% and obtained nearly equal amounts of ethanol from the different fermentation
media after five days of fermentation. The yeast concentration, however, significantly (p< 0.05)
affected the time for fermentation to be completed, i.e. to achieve maximum ethanol yield.
Similar observation was also made by Ocloo and Ayernor (2010) in their work. Also, this
observation agrees with the findings of Akin-Osanaiye et al (2005), Morris and Sarad, (1990)
who reported that amount of yeast influenced ethanol production by reducing the time of
maximum ethanol production.
However, the result showed that time had a significant (p< 0.05) effect on the ethanol yield by
the various fermentation media. The graph of the mean ethanol concentration against time as
shown in figure 16 gave a hyperbolic curve. The hyperbolic nature of the curve indicates that
there are some inhibitory actions occurring after the 3rd
day of fermentation and this could be as
a result of the inhibition of the yeast by its product (ethanol) and other fermentation by products.
Gutcho (1973) reported that high alcohol content in a fermenting medium slowed down or

58
stopped the growth of yeast. A positive correlation (r = 0.875, R2 = 0.765) was obtained between
yeast concentration and time on the amount of ethanol produced. The maximum ethanol
concentration obtained after the 9-day fermentation was 8.11 (g/100ml), while over 95% of this
maximum ethanol concentration was obtained by nearly all the fermentation media at the end of
the fermentation period.
Having established the relationship between yeast concentration and time on ethanol yield, a
yeast concentration of 20% was used to ferment cassava starch hydrolysate with 5.4% reducing
sugar content for six days, to obtain appreciable ethanol yield of 7.42 (g/100ml). The implication
of this is that time and money were saved and cost of ethanol production reduced. At the end of
the 6-day fermentation period, the ethanol produced in the fermentation medium was distilled
using simple distillation setup at temperatures of between 78oC – 80
oC. Qualitative test on the
distillate was positive for ethanol and the ethanol was stored in a plastic container.
4.2 Conclusion
From this research work, it was evident that malted acha (Digitaria exilis), though being a
relatively unknown crop, has hydrolytic potentials just like other malted cereals, which can be
employed by Nigeria in its different sugar-based industries, breweries and distilleries. It was also
observed that malted acha has mild optimal conditions of temperature, pH and time at which it
works best and this could be of great economic benefit in its application in large scale starch
hydrolysis for bioethanol production and other purposes. Since very little is known about acha,
further research needs to be carried out on the development of new breeds of this plant with
better amylolytic potentials.

59
REFERENCES
Abella, L., Nanbu, S. and Fukuda, K. A. (2007). Theoretical study on levoglucosan pyrolysis
reactions yielding aldehydes and a ketone in biomass. Memoirs of Faculty of
Engineering, Kyushu University, 67:67–74.
Adams, B. (1972). Induction of galactokinase in Saccharomyces cerevisiae: Kinetics of
induction and glucose effects. J Bacteriol, 111:308–315.
Adebiyi, A.O., Adebiyi, A.P. and Olaniyi, E.O. (2005). Nutritional composition of sorghum
bicolor starch hydrolysed with amylase from Rhizopus sp. African Journal of
Biotechnology, 4(10): 1089 – 1094.
Adeoti, O. (2008). Could fuel ethanol production from cassava root pose threat to food security
in Nigeria? Department of Agricultural Engineering, The Federal Polytechnic Ado
Ekiti, Ekiti State, Nigeria. Pp. 1-10.
Afiukwa, C.A., Ibiam, U.A., Edeogu, C.O., Nweke, F.N. and Chukwu, U.E. (2009).
Determination of amylase activity of crude extract from partially germinated mango
seeds (Mangifere oraphila). Afr. J. Biotechnol, 8(14): 3294-3296.
Akin-Osanaiye, B.C., Nzelibe, H.C. and Agbaji, A.S.I. (2005). Production of ethanol from
Carica papaya (pawpaw) agro waste: effect of sacccharification and different
treatments on ethanol yield. Afr. J. Biotechnol., 4(7): 657-659.
Aktinson, B. and Morituna, F. (1991). Upstream processing. In: Biochemical Engineering and
Biotechnology, Stockton Press, USA. P. 525.
Alvin, S.A., Karthik, K. and Xiao-xing, L. (2002). Textural and sensory properties of α-amylase
treated Poi. Stored at 4oC. J. Food Process. Preserv, 26: 1-10.
Amutha, R. and Gunasekaran, P. (2001). Production of ethanol from liquefied Cassava starch
using co Immobilized cells of Zymomonas mobilis and Saccharomyces diastaticus. J.
Biosci. Bioeng, 92: 560-564.
Anderson, R.A. and Watson S.A. (1982). He Corn Milling Industry. In: Hand Book of
Processing and Utilization in Agriculture, Wolf, I.A. (2nd
Edition). CRC press, Boca
Raton, Florida. Pp. 31-61.

60
Ayernor, G.S., Hammond, T.K. and Graffham, A. (2006). The combination of Rice malt and
amyloglucosidase for the production of sugar from cassava flour, Department of
Nutrition and Food Science, University of Legon.
Ayoola, A.A., Adeeyo, O.A., Efeovbokhan, V.C. and Ajileye, O. (2012). A comparative study
on glucose production from sorghum bicolor and cassava species in Nigeria. International
Journal of Science and Technology, 2(6): 2224-3577.
Azmi, A.S., Ngoh, G.C., Maizirwan M. and Hassan, M. (2011). Single step bioconversion of
unhydrolyzed cassava starch in the production of bioethanol and its value added
product. Journal Bioethanol, 2: 1-18.
Baks, T., Kappenb, F.H.J., Janssen, A.E.M. and Boom, R.M. (2008). J. Cereal Sci., 47: 214.
Baks, T., Ngene, I.S., Van Soest, J.J.G., Janssen, A.E.M. and Boom, R.M. (2007). Comparison
of methods to determine the degree of gelatinisation for both high and low starch
concentrations. Carbohydr Polym, 67:481-490.
Balat, M. (2009). New biofuel production technologies. Energy Educ Sci Technol, 22(1): 47-61.
Balat, M. and Balat, H. (2009). Recent trends in global production and utilization of bio-ethanol
fuel. Applied Energy, 86: 2273-2282.
Bamforth, C.W. and Barclay, A.H.P. (1993). Malting technology and uses of malt. In Barley:
Chemistry and Technolgy. (MacGregor, A.W. and Bhatty, R.S., eds). Minnesota:
American Association of Cereal Chemists, Inc. Pp. 297-354.
Becker, J-U., and A. Betz. (1972). “Membrane transport as controlling pacemaker of glycolysis
in Saccharomyces carlsbergensis.” Biochimica Biophysica Acta, 274:584–597.
Betiku, E.and Ajala, O. (2010). Enzymatic hydrolysis of breadfruit starch: case study with
utilization for gluconic acid production. Ife Journal of Technology, 19(1): 10-14.
Bokanga, M. (1996). Biotechnology and cassava processing in Africa. IITA Research, 12: 14-18.
Briggs, D.E. (1998). Malt and Malting. London: Blackie Academic and Professional, Chapman
and Hall.
Bugaje, I. (2008). Bio-ethanol is not a fuel contaminant. The Punch (Lagos), April 18, p.14.
Cardona, C.A. and sánchez, O.J. (2004). Analysis of integrated flow sheets for biotechnological
production of fuel ethanol. In: PRES 2004, 16th International Congress of Chemical and
Process Engineering, CHISA 2004, 22-26 August 2004 Prague, Czech Republic.

61
Cardona, C.A. and Sanchez, O.J. (2007). Fuel ethanol production: process design trends and
integration opportunities. Bioresource Technology, 98:2415–2457.
Carter, P.R., Hicks, D.R., Oplinger, E.S., Doll, J.D., Bundy, L.G., Schuler, R.T. and Holmes, B.J.
(1989). Grain Sorghum (Milo). Alternative Field Crops Manual.
Chandra, G.S., Proudlove, M.O. and Baxter, E.D. (1999). The structure of barley endosperm- An
important determinant of malt modification. J. Sci. Food Agr., 79: 37-46.
Chaplin, M.F. and Bucke, C. (1990). The large-scale use of enzymes in solution. In: Chaplin
MF, Bucke C. Enzyme technology. Cambridge: Cambridge University Press. Pp. 146-
161.
CIRAD. French Agricultural Research Centre for International Development (2004). Fonio: An
African cereal crop. Available at: www.cirad.fr/en. Retieved 28 October 2006.
Dai, D., Hu, Z., Pu, G., L.H. and Wang, C. (2006). Energy efficiency and potentials of Cassava
fuel ethanol in Guangxi region of China. Energy Convers. Manager, 47: 1686 – 1679.
Demirbas, A. and Karslioglu, S. (2007). Biodiesel production facilities from vegetable oils and
animal fats. Part Energy Source A, 29(1):33-41.
Dewar, J., Taylor, J.R.N. and Berjak, P. (1997). Determination of improved steeping conditions
for sorghum malting. J. Cereal Sci., 26: 129-136.
Donovan, J.W. (1979). Phase transitions of the starch-water system. Biopolymers, 18:263-275.
Drapcho, C.M., Nhua, N.P. and Walker, T.H. (2008). Biofuels Engineering Process Technology.
McGraw Hill, Pp. 1-371.
Egwim, C.E. and Adenomon, M.O. (2009). Predicting α-amylase yield and malt quality of some
sprouting cereals using 2nd
order polynomial model. African Journal of Biochemistry,
3(8): 288-292.
Egwim, E.C. and Oloyede, O.B. (2006). Comparison of α-amylase activity in some sprouting
Nigerian cereals. Biokemistry, 18(1): 15-20.
Ellis, R.P., Cochrane, M.P., Dale, M.F.B., Duffus, C.M., Lynn, A., Morrison, I.M., Prentice,
R.D.M., Swanston, J.S. and Tiller, S.A. (1998). Starch production and industrial use. J
Sci Food Agric, 77:289-311.
Energy Information Agency, (2007). Official Energy Statistics from the U.S. Government.”
Energy Information Administration. Available at: http://eia. doe.gov. Retrieved
20/10/2012.

62
Evans, D.E., Lance, R.C.M. and Elington, J.K. (1995). The Influence of α-Amylase Isofirm
Pattern on α-Amylase Activity in Barley and Malt. Proc. 25th
Austr. Cer. Chem. Conf.
Adelaid. Pp. 357-364.
Evans, D.E., Van Weger, B., Ma, Y.F. and Eghinton, J. (2003). The Impact of the
Thermostability of α-amylase, β-amylase and limit Dextrinase on Potential work
Fermentability. J. Am. Society of Brewing Chem, 61: 210-218.
Ezeobi, O. (2008). Yar‟Adua approves five per cent ethanol in PMS. The Punch (Lagos), April
14, p17.
Ezeogu, L.I., Okoro, B.N. and Ugwuanyi, K.E. (1997). Amylolysis of sorghum starch as
influenced by cultivar, germination time and gelatinization temperature. J. Inst. Brew.,
103:371-376.
FAO (2008). FAOSTAT database
[Online].http://faostat.fao.org/site/567/DesktopDefault.aspx?PageID=567#ancor.
Retrieved 20/08/2012.
Federoff, H. J., Eccleshall, T.R. and Marmur, J. (1983). Carbon catabolite repression of maltase
synthesis in Saccharomyces carlsbergensis. J Bacteriol, 156: 301–307.
Fincher, G.B. and Stone, B.A. (1993). Physiology and Biochemistry of Germination in Barley. In
Barley: Chemistry and Technology (MacGregor, A. W. and Bhatty, R. S., eds).
Minnesota: American Association of Cereal Chemists, Inc. Pp. 247 - 295.
Fitter J., Herrmann R., Dencher N.A., Blume A. and Hauss T. (2001). Activity and stability of a
thermostable α-amylase compared to its mesophilic homologue: mechanisms of thermal
adaptation. Biochemistry, 40: 10723 - 10731.
Franzen, C. J. (2003). Metabolic flux analysis in RQ-controlled microaerobic ethanol production
by Saccharomyces cerevisiae. Yeast, 20:117–132.
French, B.J. and McRuer, G.R. (1990). Malt quality as affected by various steep aeration
regimes. Technical Quarterly, 27: 10–14.
Fullbrook, P.D. (1984). The enzymic production of glucose syrups. In: Dziedzic SZ; Kearsley
MW, editors. Glucose syrups: science and technology. London: Elsevier. Pp. 65-115.
Galbe, M. and Zacchi, G. (2002). A review of the production of ethanol from softwood. Applied
Microbiol. Biotech, 59: 618-628.

63
George-Kraemer, J.E., Mundstock, E.C., Cawalli-Mohina, S. (2001). Developmental Expression
of Amylase during Barley Malting. J. Cereal Sci., 33: 279-288.
Ghosh, P. and Ghose, T.K. (2003). Bioethanol in India: recent past and emerging future.
Advances in Biochemical Engineering.Biotechnology, 85:1–27.
Gibson, S.I. (2004). Sugar and phytohormone response pathways: navigating a signalling
network. J. Exp. Bot., 55: 253 - 264.
Grace, M.R. (1977). Cassava Production. Food and Agriculture Organisation of the United
Nations. Rome, Italy. P. 100.
Gupta, A., Gupta, V.K., Modi, D.R. and Yadava, L.P. (2008). Purification and characterization
of α-amylase from Aspergillus niger. Biotechnol., 7: 551-556.
Gupta, R., Gigras, P., Mohapatra, H., Goswami, V.K. and Chauhan, B. (2003). Microbial α-
amylases: a biotechnological perspective. Process Biochem, 38: 1599 - 1616.
Gutcho, S.J. (1973). Chemicals by fermentation. Noyes Data Corporation, England. Pp. 276.
Guzman-Maldonado, H. and Paredes-Lopez, O. (1995). Amylolytic enzymes and products
derived from starch: a review. Crit Rev Food Sci Nutr, 35:373-403.
Gyang, J.D. and Wuyep, E.O. (2005). Acha:The grain of life. A Bi-annual Publication of the
Raw Material Research and Development Council, 6(1):39-41.
Hammond, T.K. and Ayernor, G.S. (2000). Combination of malted cereals and cassava starch in
the Production of sugar syrup. Journal of the Ghana Science Association, 2(1): 87-92.
Hoppe, G. K. and Hansford G.S. (1984). The effect of micro-aerobic conditions on continuous
ethanol production by Saccharomyces cerevisiae. Biotechnol Lett., 6:681–686.
Hu, G., Heitmannn, J.A. and Rojas, O.J. (2008). Feed stock pretreatment strategies for producing
ethanol from wood, bark and forest residues. BioResources, 3(1): 270-294.
Ibrahim, A. (2001). Hungry Rice (Acha): A Neglected Cereal Crop. NAQAS Newsletter, 1(4): 4-
5.
Jane, J.L. (2009). Structural features of starch granules II. In: BeMiller, J.N. & Whistler, R.L.
(ed) Starch - Chemistry and Technology (3rd edition). Academic Press, New York,
USA. Pp. 194-227
Janecek, S., Svensson, B. and Henrissat, B. (1997). Domain evolution in the a-amylase family. J.
Mol. Evol., 45(3): 22-3 1.

64
Jenkins, P.J. and Donald, A.M. (1998). Gelation of starch: a combined SAXS/WAXS/DSC and
SANS study. Carbohydr Res, 308:133-147.
Jeuland, N., Montagne, X. and Gautrot, X. (2004). Potentiality of ethanol as a fuel for dedicated
engine. Oil and Gas Science and Technology. Rev. IFP, 59(6): 559-570.
Jideani, I. A. (1990). Acha-Digitaria exilis-the neglected cereal. Agric. Intl, 42(5): 133-143.
Jideani, I. A. (1999). Traditional and possible technological uses of Digitaria exilis (acha) and
Digitaria iburua (iburu): A review. Plant Food for Human Nutrition, 54: 363-374.
Jin-Xin, C., Fei, D., Kang, W. and Guo-ping, Z. (2006). Relationship between malt qualities and
β- amylase activities and protein content as affected by timing of nitrogen fertilizer application.
J. Zhejiang University Sci. B., 7(1): 79-84.
Johnson, J.C. (1976). Specialized sugars for the food industries. Noyes Date Corporation, Partk
Ridge, New Jersey.
Jones, R. P. and Greenfield, P.F. (1984). A review of yeast ionic nutrition: Growth and
fermentation requirements. Proc Biochem, 19:48–60.
Kang, G.J., Mo-Jeong, K., Jeon-Weon, K. and Kwanhwa, P. (1997). Immobilization of
thermostable maltogenic amylase from Bacillus Stearothermophilus for continuous
production of branched oligosaccharide. J. Agric. Food Chem., 45: 4168-4172.
Kawai, K. Fukami, K. and Yamamoto, K. (2007). Effect and mechanism of ultrahigh hydrostatic
pressure on the structure and properties of starches. Carbohydr Polym, 67:530-535.
Kennedy, J.F., Cabalda, V.M. and White, C.A. (1988). Enzymic starch utilization and genetic
engineering. Trends Biotechnol, 6:184-189.
Kendra, M. (2012). Cationic polymer enhanced hydrolysis of corn starch for the production of
biofuels. A dissertation presented to the academic faculty in partial fulfillment of the
requirements for the degree of doctor of philosophy in the school of chemical and biomolecular
engineering, Georgia Institute of Technology. Pp. 19.
Knorr, D., Heinz, V. and Buckow, R. (2006). High pressure application for food biopolymers.
Biochim Biophys Acta, 1764:619-631.
Kosmala, F. (2010). Global biofuel demand projected to grow 133% by 2020, production must
increase by 32 billion liters: New report (September 24, 2010). Available from
http://www.soyatech.com/news_story.php?id=20284. Retrieved 13th
April 2011.

65
Kruckeberg, A. L. (1996). The hexose transporter family of Saccharomyces cerevisae.
Arch Microbiol, 166:283–292.
Kumar, R.S.S., Singh S.A. and Rao G.A. (2009). Conformational stability of α-amylase from
malted sorghum (sorghum bicolor): Reversible unfolding by denaturants. Biochemie,
91: 548-557.
Kupolokun, F. (2006). Nigeria biofuel programme: Overview and perspective. A paper presented
at the International Renewable Energy Conference held in Abuja, Nigeria, 16-20
October, 2006.
Malca, J. and Freire, F. (2006). Renewability and life-cycle energy efficiency of bioethanol and
bio-ethyl tertiary butyl ether (bio-ETBE): assessing the implications of allocation.
Energy, 31(33): 62-80.
Marchal, L.M. (1999). Towards a rational design of commercial maltodextrins: a mechanistic
approach. PhD thesis, Wageningen University, Wageningen, the Netherlands. P. 197.
Matveev, Y.I., van Soest, J.J.G., Nieman, C., Wasserman, L.A., Protserov, V.A., Ezernitskaja,
M. and Yuryev, V.P. (2001). The relationship between thermodynamic and structural
properties of low and high amylose maize starches. Carbohydrate Polymers, 44:151-
160.
Maureen, J.P. (1999). Structure activity relationship studies of inhibitors of industrially and
medically important enzymes. A thesis submitted in partial fulfillment of the
requirements for the degree of doctor of philosophy in chemistry at the University of
Canterbury. Pp. 12.
McCaxter, J. D. and Withers, S. G. (1994). Mechanisms of enzymatic glycoside hydrolysis.
Curr. Opin. Stmct. Biol., 48: 85-92.
Mojovic, L., Nikolic, S., Rakim, M. and Vukasinovic, M. (2006). Production of bioethanol from
corn meal hydrolyzates. Fuel, 85: 1750-1755.
Monica, I.R., Clara, I.S., Rodrigo, G.T. and Daniel, R.M. (2011). Enzymatic hydrolysis of
cassava starch for production of bioethanol with a Colombian wild yeast strain. J. Braz.
Chem. Soc., 22(12): 2337-2343.

66
Moraes, L.M.P., Filho, S.A. and Ulhoa, C.J. (1999). Purification and some properties of an α-
amylase glucoamylase fusion protein from Saccharomyces cerevisiae. World J.
Microbiol. Biotechnol, 15: 561-564.
Morris, W. and Sarad, R.P. (1990). Biotechnology of biomass conversion. Fuels and Chemicals
from Renewable Resources. Pp. 235.
Muhd, B.B.A.B. (2008). Production of bioethanol from tapioca starch using Saccharomyces
cerevisiae : effect of inoculums concentration and temperature. A thesis submitted in
fulfillment of the requirements for the award of the degree of bachelor of chemical
engineering in the faculty of chemical and natural resources engineering, University of
Malaysia. Pp. 5.
Mukherjee, A.K., Borah, M. and Raí, S.K. (2009). To study the influence of different
components of fermentable substrates on induction of extracellular α-amylase synthesis
by Bacillus subtilis DM-03 in solid-state fermentation and exploration of feasibility for
inclusion of α-amylase in laundry detergent formulations. Biochem. Eng. J., 43: 149-
156.
Nadir, N., Mel, M., Karim, M.I.A. and Yunus, R.M. (2009). Comparison of Sweet Sorghum and
Cassava for Alcohol production by using saccharomyces Cerevisea. Journal of Applied
Sciences, 9(17): 3068-3073.
Narendranath, N. V., Thomas, K.C. and Ingledew, W.M. (2001). Effects of acetic and lactic acid
on the growth of Saccharomyces cerevisiae in a minimum medium. J Ind Microbiol
Biotechnol, 26:171–177.
NAS (1996). Lost crops of Africa. Volume I: Grains. Washington: National Academy Press.
National Research Council (NRC). (1996). Lost Crops of Africa Vol.1 Grains, National
Academy Press, Washington DC. Pp. 59-75.
Naylor, R.L., Liska, A., Burke, M., Falcon, W.P., Gaskell, J., Razelle, S. and Cassman, K.
(2007). The ripple effect: Biofuels, food security, and the Environment. Environment,
49 (9): 30-43.
Nielsen, J.E. and Borchert, T.V. (2000). Protein engineering of bacterial alpha-amylases.
Biochim Biophys Acta, 1543: 253-274.

67
Nigam, P. S. and Singh, A. (2011). Production of liquid biofuels from renewable resources.
Progress in Energy and Combustion Science, 37: 52
Nugesha, L. (2009). Bioethanol production from spoilt sorghum grains. Thesis submitted to the
University of Agricultural Sciences, Dharwad. Pp. 1-60.
Nzelibe, C.H. and Uwasike, C.C. (1995). The Brewing potential of “Acha” (Digitaria Exilis)
Malt compared with pearl millet (Pennisetum Typhoides) malts and sorghum and
(Sorghum Bicolor) Malts. J. Hist. Brew, 101:45-50.
Obatolu, V.A. (2002). Nutrient and sensory qualities of extruded malted or unmalted
millet/soybean mixture. Food Chem., 76: 129-133.
Ocloo, F.C.K. (2002). Fermentability and yield of alcohol from sugar syrup produced from
cassava flour using rice malt as source of enzymes. M. Phil. Thesis. University of
Ghana, Legon. P. 176.
Ocloo, F.C.K and Ayernor, G.S. (2008). Physical, Chemical and Microbiological changes in
alcoholic fermentation of sugar syrup from cassava flour. Afr. J. Biotechnol. 7(2): 164- 168.
Ocloo, F.C.K. and Ayernor G.S. (2010). Production of alcohol from cassava flour hydrolysate.
Journal of brewing and distilling, 1(2): 15-21.
Ohgren, K., Vehmaanpera, J., Siika-Aho, M.L., Glabe, M., Viikari, L. and Zacchi, G. (2007).
High temperature enzymatic hydrolysis prior to simultaneous saccharification and
fermentation of steam pretreated corn stover for ethanol production. Enzyme and
Microbial Technology, 40(4): 607-613.
Okafor, N. (1987). Processing of Nigerian Indigenous Foods: A Chance of Innovation, Nig. Food
J., 1: 32-34.
Okafor, N. Aniche, G. and Adewoyin, (1998). Preliminary studies of larger beer brewing from
corn. Journal of food and agriculture, 2:33-37.
Oliveria, M.E.D., Vaughan B.E. and Rykiel, E.J. Jr. (2005). Ethanol as fuel: energy carbon
dioxide balances, and ecological footprint. Bioscience, 55: 593-602.
Oner, E.T. (2006). Optimization of ethanol production from starch by an amylolytic nuclear
petite Saccharomyces cerevisiae strain. Yeast, 23: 849-856.
Palmer, G.H. (1989). Cereal Science Technology. Aberdeen University Press UK. Pp. 147-148.
Parker, R. and Ring, S.G. (2001). Aspects of the physical chemistry of starch. J Cereal Sci, 34:1-
17.

68
Pérez, S., Baldwin, P.M. and Gallant, D.J. (2009). Structural features of starch granules I. In:
BeMiller, J.N. & Whistler, R.L. (ed) Starch - Chemistry and Technology (3rd edition).
Academic Press, New York, USA. Pp. 149-188.
Philip, T.K. and Isaac, N.I. (2012). Demographic characteristics, agricultural and technological
profile of acha farmers in Nigeria. Agric Eng Int: CIGR Journal, 14(1): 89-93.
Philip, T. and Itodo, I. (2006). “Acha (Digitaria spp.) a “Rediscovered” Indigenous Crop
of West Africa”. Agricultural Engineering International: the CIGR E-journal Invited Overview
No. 23. Vol. VIII December.
Philip, T.K. (2011). Development of an acha (digitaria exilis) dehulling machine. Ph.D. Thesis,
University of Agriculture, Makurdi, Nigeria.
Phillips, T.P., Taylor, D.S., Sanni, L. and Akoroda, M.O. (2004). A cassava industrial revolution
in Nigeria: The potential for a new industrial crop [Online].
http://www.fao.org/docrep/007/y5548e/y5548e00.htm. Retrieved 11/02/2012.
Ranola, R.F. Jr., Rex, B.D., Edwin, D.R. and Butch, G.B. (2009). Enhancing the viability of
cassava feed stock for bioethanol in the Philippines. J. JSSAAS, 15(2):147-158.
Reifenberger, E., Boles, E. and Ciriacy, M. (1997). Kinetic characterization of individual hexose
transporters of Saccharomyces cerevisiae and their relation to the triggering
mechanisms of glucose repression. Eur J Biochem, 245:324–333.
Reis, M.M., Ferreira, M.M.C. and Sarmento, S.S.B. (2002). A multi-way analysis of starch
cassava properties. ELSEVIER, 64:123-135.
Ruskin, F. R., Mark, R., Brent, E.M., Donald, O. and Michael, M.D. (1996). Grains Boards of
Science for International Development.
Russell, I. (2003). Understanding yeast fundamentals. The Alcohol Textbook, 4th
ed. K. A.
Jacques, T. P. Lyons, and D. R. Kelsall (eds.). Nottingham University Press:
Nottingham, UK. Verstrepen, K. J., et al. (2004). Glucose and sucrose: Hazardous fast-
food for industrial yeast? Trends Biotechnol, 22:531–537.
Sajilata, M.G., Singhal, R.S. and Kulkarni, P.R. (2006). Resistant starch – A review.
Comprehensive Reviews in Food Science and Food Safety, 5:1-17.
Salgueiro, S. P., Sa-Correia, I. and Novais, J.M. (1988). Ethanol-induced leakage in
Saccharomyces cerevisiae: Kinetics and relationship to yeast ethanol tolerance and
alcohol fermentation productivity. Appl Environ Microbiol, 54:903–909.
69
Shallenberger, R.S. (1990). Introduction to sweeteners chemistry. Cereal Foods World, 35: 377-
381.
Shambe, T., Voncir, N. and Gambo, E. (1989). Enzyme and acid hydrolysis of malted millet
(Peminsetun tyhoides) and sorghum (Sorghum bicolour). Journal of the Institute of
Brewing 95:13-16.
Sheeman, J. and Himmel, M. (1999). Enzymes, energy and the environment: A strategic
perspective on the US Department of Energy‟s Research and development activities for
bioethanol. Biotechnology Progress, 15: 817-827.
Smith, A.M. (2001). The biosynthesis of starch granules. Biomacromolecules, 2:335-341.
Solomon, B.O., Layokem, S.K. and Oladimeji, S. (1987). Development of malt for the Nigeria
brewing industries. Malting of sorghum grain. J.Nig.Soc.Chem.Eng., 6:60-64.
Sperling, D. and Cannon, J.S. (2004). The Hydrogen Energy Transition: Moving Toward the
Post Petroleum Age in Transportation. P. 80.
Temple, V.J. and Bassa, J.D. (1991). Proximate Chemical Composition of Acha (Digitaria
exilis) grain. J. Sci. Food Agr, 56:561-564.
Thomas, K. C., Hynes, S.H. and Ingledew, W.M. (1996). Practical and theoretical
considerations in the production of high concentrations of alcohol by fermentation. Process
Biochem, 31:321–331.
TNAP (The National Academies Press). 1996. Lost crops of Africa: Volume 1: Grains. Pp 59 -
76. Available at:www.nap.edu/books. Retrieved 19 January 2010.
Ugwuanyi, E. (2008). Firm begins process for biofuel refining. The Nation (Lagos), September
16, p18.
Umar, M. (2006). Nigeria joins league of global ethanol fuel producers. The Punch (Lagos), July
26:16.
U.S. EPA (United States Environmental Protection Agency) (2008). Ethanol manufacturing
facility response overview. Weston Solutions Inc. Pp. 1-21.
Van Beynum, G. M. A. and Roels, J. A. (Eds.). (1985). Starch Conversion Technology (Vol. 14).
New York: Marcel Dekker, INC.

70
Van der Maarel, M.J.E.C., Van der Veen, B., Uitdehaag, J.C.M., Leemhuis, H. and Dijkhuizen,
L. (2002). Properties and applications of starch-converting enzymes of the α-amylase
family. J Biotechnol, 94:137-155.
Verstrepen, K. J., et al. (2004). Glucose and sucrose: Hazardous fast-food for industrial yeast?
Trends Biotechnol, 22:531–537
Vijayagopal, K., Balagopalan, C. and Hrishi, N. (1980). Saccharification of cassava starch with
acids for ethanol fermentation. In: Proceedings Seminar on Post-Harvest Technologies
(India), Trivadrum. Pp. 54-56.
Walker, T. H., Cochran, H.D. and Hulbert, G.J. (1999). Supercritical carbon dioxide extraction
of lipids from Pythium irregulare. J Am Oil Chem Soc.76(5): 595–602.
Wang, M., Saricks, C. and Santini, D. (1999). Effects of fuel ethanol use on fuel-cycle energy
and green house gas emissions. Argonne(IL): Argonne National Laboratory.
Wang, W. (2002). Cassava production for industrial utilization in China – present and future
perspective. In: Cassava research and development in Asia: exploring new opportunities
for an ancient crop, 7th Regional Cassava Workshop, Bangkok, Thailand. Pp. 33-38.
Wardrip, E.K. (1971). High fructose corn syrup. Food Technol, 25: 47.
Wilkie, A.C., Riedesel, K.J. and Owens, J.M. (2000). Stillage characterization and anaerobic
treatment of ethanol stillage from conventional and cellulosic feedstocks. Biomass and
Bioenergy 19: 63–102.
Wiseman, A. (1987). Handbook of Enzyme Biotechnology, 2nd edition. John Wiley Sons. New
York, USA.
Wyman, C.E. (2004). Ethanol Fuel. Elsevier, 2: 541-555.
Xie, X., Liu, Q. and Cui, S.W. (2006). Studies on the granular structure of resistant starches
(type 4) from normal, high amylose and waxy corn starch citrates. Food Research
International, 39:332-341.
Yeshajaha, P. (1991). Functional properties of food components. Academic Press Inc. London.
Pp: 116-121.
Yoosin, S. and Sorapipatana, C. (2007). A study of ethanol production cost for gasoline
substitution in Thailand and its competitiveness. Thammasat Int J Sci Technol, 12: 69-80.