Embed Size (px)
Citation preview

• STOCKHOLM • COLOGNE • BARCELONA •
5. Smart lighting, lampposts and traffic posts as hubs for communication
6. New business models for district heating and cooling
7. Smart waste collection, turning waste into energy
8. Big open data platform
INTEGRATED INFRASTRUCTURES
FACTSHEETS

Main authors: Esben Pejstrup (ICLEI Europe) & work package leader Julia Egenolf (City of Cologne)
Contributors: All partners in GrowSmarter, especially site managers in GrowSmarter’s three Lighthouse Cities; Julia Egenolf (Cologne), Gonzalo Cabezas (Barcelona) and Mika Hakosalo (Stockholm).
Copyright: This publication has been as part of the GrowSmarter project and is licensed under a Cre-ative Common Attribution 4.0. International (CC BY-ND 4.0)
Date: November 2019
Design: Martin Freire and Rebekka Dold About GrowSmarter: In a rapidly urbanising world cities need to become smarter to respond to citizen needs and to reduce their environmental footprint. GrowSmarter brought together cities and industry to integrate and demonstrate ‘12 smart city solutions’ in energy, infrastructure and transport, to provide other cities with valuable insights on how they work in practice and opportunities for replication. The idea was to create a ready market for these smart solutions to support growth and the transition to a smart, sustainable Europe.
About the publication: This booklet presents the solutions demonstrated in GrowSmarter under the action area Integrated Infrastructures
More information: More information about the solutions described in these factsheets can be found in different reports on www.Grow-Smarter.eu/insights. Recommended readings include:
This project has received funding from the European Union’s Horizon 2020 research and innovation programme under grant agreement no 646456. The sole responsibility for the content of this document lies with the author and in no way reflects the views of the European Union.
Concluding report Integrated Infrastructures
Report on technicaland social validation
Report on smart city market introduction

SMART ACTION AREA 2: INTEGRATED INFRASTRUCTURES
Integration of new and existing infrastructure is the second of 3 action areas on which the GrowSmarter project has focused.
To find out more about the other solutions area please visit:www.grow-smarter.eu/solutions
Significant and as yet insufficiently tapped value is offered by integrating both active and passive infrastructure networks within and across cities – be they energy, transport,
communications or others – rather than duplicating these needlessly. Many such infrastructures are ageing; budgets to replace them are stretched; they are procured and managed ‘in silos’; so the potential for cities and their customers through new joined-up approaches, exploiting modern technologies is substantial. The Lighthouse cities have
applied a range of smart integrated infrastructure solutions, as described in the following factsheets.
19. Smart street lighting
20. Smart multifunctional tower
21. Combined electric charging and street lighting
22. Smart connected street environments
23. Smart meter information analysis and actuators
24. OpenDh - feed-in of waste heat into district heating network
25. Local energy generation towards nZEB
26. Optical sorting of waste, introduction of AWCS in an existing neighbour-
hood & waste collection statistics for individual households / businesses
27. Open urban big data platform in Cologne
28. Big open data platform in Stockholm
29. Urban models & semi-automatic instance mapping
30. Integration of sensor and heterogeneous data in standard data format
31. Sustainable connected lighting to enhance safety and mobility

Smart street lightingSmart solution 5Smart lighting, lampposts and traffic posts as hubs for communication
Integrated infrastructures / FACTSHEET
Measured impacts
19
StockholmTechnical partners
City contact
Mika Hakosalo:[email protected]
What is it? Smart street lighting aims to deploy the most successful technology(-ies) for controlling a city s lighting program in order to provide optimal lighting for residents while still lowering the energy usage and CO2 emissions.
What did GrowSmarter do? Three approaches to smart street lighting were tested:
Motion sensor controlled LED lighting for pedestrian and bicycle paths to enable the lights to provide more light (100% and three lamps ahead when someone approaches). If there was no activity in the area, the light level automatically returned to an optimized minimum of 40%.
Self-controlled LED street lighting dimming down in the later phase of the night. Each individual light fitting recorded when it was turned on and off and used those times to calculate the middle point. From this point, light was lowered to 66% for 6 hours, or until it was turned off.
reduction in CO2 emissions
reduction in CO2 emissions
reduction in CO2 emissions
31% 21% 25%
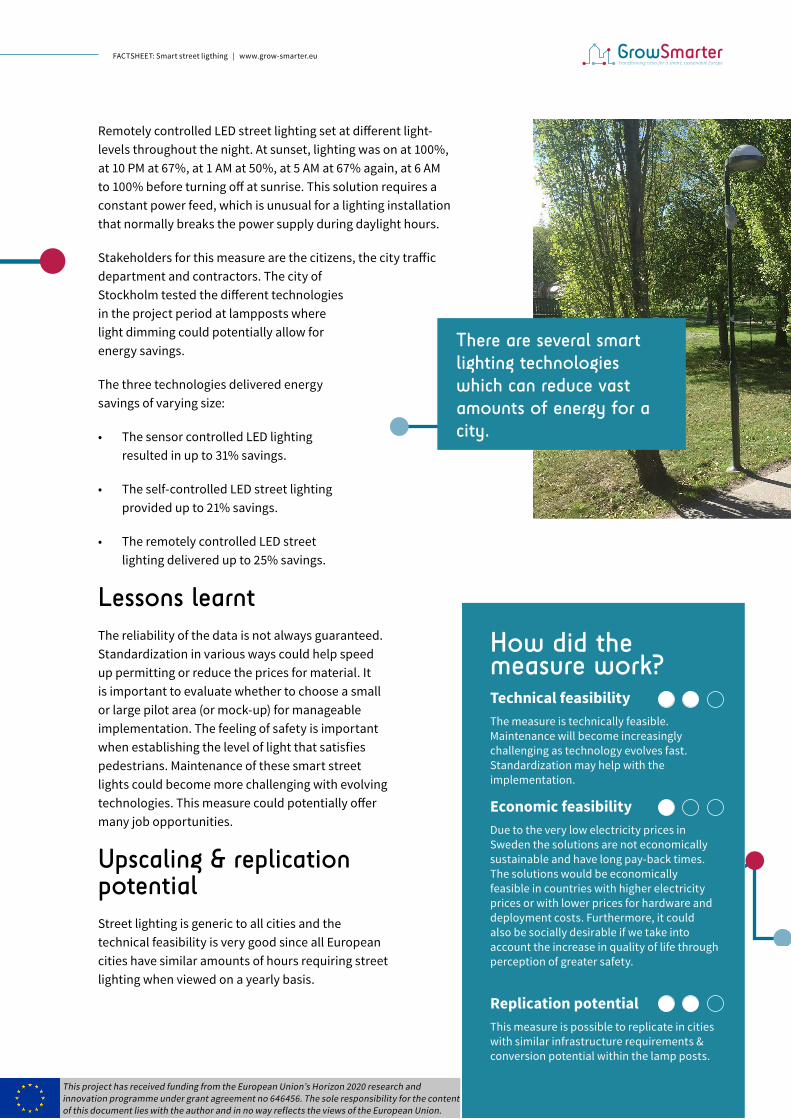
Remotely controlled LED street lighting set at different light- levels throughout the night. At sunset, lighting was on at 100%, at 10 PM at 67%, at 1 AM at 50%, at 5 AM at 67% again, at 6 AM to 100% before turning off at sunrise. This solution requires a constant power feed, which is unusual for a lighting installation that normally breaks the power supply during daylight hours.
Stakeholders for this measure are the citizens, the city traffic department and contractors. The city of Stockholm tested the different technologies in the project period at lampposts where light dimming could potentially allow for energy savings.
The three technologies delivered energy savings of varying size:
• The sensor controlled LED lighting resulted in up to 31% savings.
• The self-controlled LED street lighting provided up to 21% savings.
• The remotely controlled LED street lighting delivered up to 25% savings.
Lessons learntThe reliability of the data is not always guaranteed. Standardization in various ways could help speed up permitting or reduce the prices for material. It is important to evaluate whether to choose a small or large pilot area (or mock-up) for manageable implementation. The feeling of safety is important when establishing the level of light that satisfies pedestrians. Maintenance of these smart street lights could become more challenging with evolving technologies. This measure could potentially offer many job opportunities.
Upscaling & replication potentialStreet lighting is generic to all cities and the technical feasibility is very good since all European cities have similar amounts of hours requiring street lighting when viewed on a yearly basis.
There are several smartlighting technologies which can reduce vast amounts of energy for a city.
FACTSHEET: Smart street ligthing | www.grow-smarter.eu
Technical feasibilityThe measure is technically feasible. Maintenance will become increasingly challenging as technology evolves fast. Standardization may help with the implementation.
Economic feasibility Due to the very low electricity prices in Sweden the solutions are not economically sustainable and have long pay-back times. The solutions would be economically feasible in countries with higher electricity prices or with lower prices for hardware and deployment costs. Furthermore, it could also be socially desirable if we take into account the increase in quality of life through perception of greater safety.
Replication potentialThis measure is possible to replicate in cities with similar infrastructure requirements & conversion potential within the lamp posts.
How did the measure work?
This project has received funding from the European Union’s Horizon 2020 research and innovation programme under grant agreement no 646456. The sole responsibility for the content of this document lies with the author and in no way reflects the views of the European Union.

Smart multifunctional tower
Smart solution 5Smart lighting, lampposts and traffic posts as hubs for communication
Integrated infrastructures / FACTSHEET
Measured impacts
20
Barcelona
Technical partners
Cellnex Telecom:Carmen [email protected]
City contact
Gonzalo Cabezas [email protected]
What is it? ‘Smart Towers’ exploit city infrastructure to provide enhanced wireless access networks, in order to support the growing demand of mobile connectivity in the city for broadband mobile connections and IoT services. The solution is based on transforming urban furniture like street lighting poles into new small urban telecom sites, which are called Smart Towers. The multifunctional Smart Towers are able to provide connectivity and can be supplemented with different types of sensors.
What did GrowSmarter do? In Barcelona, the Smart Tower solution converts the traditional lamppost into a new telecommunication micro-site that integrates wireless communication devices and sensors. In addition, Smart Towers are connected to the Fiber Optic Backbone Network and thus offer hyper-connected areas to resolve the growing demand for connectivity in the city.
data per month users per month deployed sites
55GB 2.200 9

Smart Towers offer new services that enhance daily life of citizens. For example, hyper-connected spaces resolve the wireless connectivity demand; while environmental sensors hosted into Smart Towers provides real time information about the status of the city, helping city managers to take the most suitable decision.
Lessons learntUse the opportunity of adapting existing lighting infrastructure to develop new services for citizens. When installing smart technology as part of lighting infrastructure, it is essential not only to make good use of the implemented infrastructure (connecting to Fiber Optic networks ) but also to analyse the data collected. Connectivity, positioning and electricity need to be available to support the implementation of new, smart solutions in lampposts. The Smart Towers should be connected to backbone networks, in order to grant the provision of advanced communication access services.
An added benefit of the solution could be to use the Wi-Fi data to monitor connectivities in any given area. Connected users tend to be pedestrians and an increase or decrease in users connecting could be used to monitor crowded areas.
Upscaling & replication potentialThe Smart Tower solution can be easily replicated in other European cities. The add-on option chosen by Barcelona Municipality can be fitted in any other lamppost around the world. The solution can be easily adapted to include the required IoT devices and wireless access points. If Smart Towers are connected to the backbone network, then the offer of wide-broadband wireless connectivity services is improved.
Smart Towers rationalize the use of the public space and organize the deployment of access points for wireless communications and IoT devices in the city.
FACTSHEET: Smart Multifunctional tower | www.grow-smarter.eu
Technical feasibilityThere is a range of options to implement Smart Towers that make easy to fulfill technical requirements.
Economic feasibility Transformation of urban furniture allows Neutral Host Operators to offer Infrastructure as a Services to support the growing demand of advanced wireless connectivity in cities.
Replication potentialThe solution can be easily adapted to any other city in order to provide wireless connectivity services, as well as to position sensors.
How did the measure work?
This project has received funding from the European Union’s Horizon 2020 research and innovation programme under grant agreement no 646456. The sole responsibility for the content of this document lies with the author and in no way reflects the views of the European Union.

Combined electric charging and street lighting
Smart solution 5Smart lighting, lampposts and traffic posts as hubs for communication
Integrated infrastructures / FACTSHEET
Measured impacts
21
CologneTechnical partners
RheinEnergieChristian Remacly [email protected]
City contact
Julia Egenolf:[email protected]
What is it? Lampposts are no longer only a source of light, but have become multifunctional, smart or “Humble Lampposts”, which can also be used to provide electrical charging points and act as WiFi hotspots. Using existing lampposts in this way, provides operational savings, delivers better services to citizens and offers the potential for additional revenue for cities.
What did GrowSmarter do? In Cologne, the industry partner RheinEnergie installed three electric charging stations to existing lampposts in the “Klimastraße”, which is part of the initiative SmartCity Cologne where RheinEnergie tests innovative technologies. The lampposts had already been fitted out with a Wi-Fi hotspots. The aim is to enable a shared sensing infrastructure in the open street spaces of the city and make urban areas universally connected.
Rhein Energie owns and operates the lampposts used in GrowSmarter and
Ton CO2 reduction annually
Charging points kWh yearly loading volume
10 3 14.000

was able to implement the charging stations without major difficulties once a suitable location was found.
The charging stations are all open to the public and have a maximum charging capacity of 11kW.
Lessons learntIn cases such as Cologne, where city furniture such as street lampposts belong to the same company that installs the charging stations, implementation of this solution is not particularly difficult. New manufacturers can pose some solvable challenges such as connections to the lanterns and technical problems with the back-end connections.
Finding suitable locations is not easy and many different parameters must be considered, such as ownership or the network situation on site.
On a technical level, it is important, that the space in the lantern cavities is sufficient to allow the cable installation. In addition, the lantern structure must be strong enough to withstand the additional load from the charging station.
Upscaling & replication potentialAn essential precondition for successful implementation was the advantage that the lanterns belonged to RheinEnergie and this facilitated the entire installation process. In other cities this may not be the case and the installation process could therefore be more costly and less feasible.
Lampposts no longer provide light only, but turn “humble lampposts” into smart and multi- functional city furnishing
FACTSHEET: Combined electric charging and street lighting | www.grow-smarter.eu
Technical feasibilityThe measure is feasible, but some technical challenges - such as space in the lantern cavities and finding suitable locations - will have to be dealt with.
Economic feasibility Within GrowSmarter it was possible for the electric vehicles to use the charging stations without payment. If a suitable (near parking etc.) location is found, charging a fee will improve the economic feasibility
Replication potentialReplication can be eased significantly by a single operator being in control of both the lanterns and the power grid.
How did the measure work?
This project has received funding from the European Union’s Horizon 2020 research and innovation programme under grant agreement no 646456. The sole responsibility for the content of this document lies with the author and in no way reflects the views of the European Union.

Smart connected street environments Smart solution 5Smart lighting, lampposts and traffic posts as hubs for communication
Integrated infrastructures / FACTSHEET 22
StockholmTechnical partners
IBMStanley Ekberg [email protected]
City contact
Mika Hakosalo:[email protected]
What is it? A combination of multiple functionalities within public infrastructure such as street lighting poles, traffic lights, and traffic signs can make walkable urban areas ubiquitously connected with sensors. By relying on the extensive fiber infrastructure prevalent in some cities, new Wi-Fi connections are made available for a variety of urban sensors whose data can be analysed and used. The sensor-data can also be used for visualization and fed into an IOT platform to test the possibility of using the data for direct communication with citizens and to pre-program and steer city infrastructure such as streetlights.
What did GrowSmarter do? Originally, the idea was to add the sensors to street lights or traffic poles in Stockholm, but the traffic measuring sensors were too heavy for the street light poles. It was also impossible to use the same electricity for the sensors and street lights, so separate poles were used. Four traffic-measuring sensors were
accurate climate emission data in real-time
accuracy of planning and decision making to reduce climateemissions
use of real-time data in planning traffic signals and flows according to people and vehicle flow.
PROVIDE IMPROVES ENABLESImpacts

installed on a pedestrian bridge running over the street with another four being installed in an already existing portal that had to be extended to make measurements possible on the other side of the street. The Wi-Fi-nodes they were installed in buildings owned by the city and used the existing connectivity (broadband) there. No additional cabling for electricity was needed as the WiFi-nodes were connected with power over Ethernet (PoE).
The existing infrastructures can be extended with other types of sensors if necessary and the City of Stockholm is looking into adding multi-sensors and/or air pollution sensors.
Lessons learntAn important part of the implementation is understanding the end-users and their needs. A too common approach is to set up sensors in an area, collect data to share and then hope developers make innovative applications with the data. Unfortunately, this is rarely the case, so GrowSmarter took a different approach: The end users where asked in the beginning of the process about their needs and as a result the collection of data focused on collecting data on pedestrian movements and providing a better overview of vehicles in the city and what kind of pollution they create. With a clearly defined use-case was possible to get the most out of the sensors in the smart connected street environment as there was a defined user who gained from the collected sensor data (see more Factsheet 28, Big Open Data Platform).
Upscaling & replication potentialThis is an enabling measure and the number of end-users is small. The data collected into the IOT-platform is very rich and can be used by both users inside a city organisation as well as stakeholders (different service providers) in the Slakthus/Globen of Stockholm area. The data collected was used to develop a mobile application for visitors, but was not tested in public as of October 2019. For upscaling purposes it is wise to standardise the sensors used and the initial workload is increased if the sensors are from different manufacturers using different logic. If standardised approaches are used, it is very easy to scale up the amount of sensors as the same protocols can be used.
Start with defined physical places, involve internal and external users, and work with practical use-cases that can be scaled-up
FACTSHEET: Smart connected street environments | www.grow-smarter.eu
Technical feasibilityThe technical feasibility depends on the sensors used. The camera-based technology has a high technical feasibility and produced accurate data during the whole project. The WiFi-based technology on the other hand had a low technical feasibility in product quality and performance as well as data quality.
Economic feasibility The initial economic feasibility is low with high cost, few users and little added value. However, as up-scaling costs are low, the amount of possible end-users and use-cases make the economic feasibility higher in the long term.
Replication potentialThe replication potential is high on camera-based sensors, but lower on Wi-Fi nodes.
How did the measure work?
This project has received funding from the European Union’s Horizon 2020 research and innovation programme under grant agreement no 646456. The sole responsibility for the content of this document lies with the author and in no way reflects the views of the European Union.

Smart meter information analysis and actuators
Smart solution 5Smart lighting, lampposts and traffic posts as hubs for communication
Integrated infrastructures / FACTSHEET
Measured impacts
23
Barcelona and CologneTechnical partners
BarcelonaEndesa: [email protected]
CologneAGT: [email protected]
City contacts
Gonzalo Cabezas (Barcelona) [email protected]
Julia Egenolf (Cologne) [email protected]
What is it? Smart technologies, operating either through a centralized hub on a city-scale or individual use in the home, that enable data collection of different utilities usage to facilitate optimization in energy management and behavioral change.
What did GrowSmarter do? In Barcelona Endesa worked with Cellnex to implement a central data hub. Sensors were installed at five power substations. With the help of a camera, those sensors were used to visualize the real-time status of the installed sensors on an app. By collecting all data on a central platform, it becomes possible to have better maintenance and reduced intervention time in case of an emergency. In Barcelona this meant fewer management costs fewer black-outs and the potential to save expenses in the long run. The LoRa Communications protocol was also used and verified in Barcelona.
energy savings potential in Cologne
power substations monitored in Barcelona
minutes intervals when pulling data in Barcelona
15% 5 5
Dashboard used for monitoring

In Cologne, smart plugs were deployed as part of the SmartHome system (see factsheet 13) due to legal issues with deploying smart meters. A fully cloud-based data collection and analysis infrastructure has been implemented to provide insights about energy consumptions to tenants. A web-based energy insight dashboard was offered to tenants for visualizing and comparing their historic and real-time energy consumption. This means that tenants were able to identify high energy consumers and analyze their energy consumption in detail and reduce their overall energy consumptions and cost.
Lessons learntIt is important to understand that a large number of sensors were needed in Barcelona to create a larger communications network and to see the operation on a larger scale with more impact. The costs associated with installing the sensors also decreases per sensor when installing a larger number of sensors.
In Cologne, it was clear that it is crucial to invest significantly and early in getting tenants to participate in the planned measures. On one hand this is because the topic of smart meters and smart plugs is very much driven by certificates, standards and privacy issues. On the other hand tenants in Cologne did not have a smart home solution yet and thus had reservations in adopting the measure. Thus, a solution was offered to users that already used Smart Home systems extensively and had experienced how they used the measure for optimizing their energy usage. While there is reason to be optimistic about the potential of this measure, further data needs to be collected to measure the impact.
Upscaling & replication potentialThe upscaling and replication potential for the SmartHome system has already been demonstrated by extending the measure to a Germany-wide testbed. As the dashboard is a cloud-based solution, it can easily be scaled up to virtually any size of users and energy metering devices and easily be replicated in different cities or residential areas. Any home in any city can benefit from this measure.
In Barcelona, the system is cloud-based so upscaling and replication only requires relevant data to upload. The technology has developed rapidly in later years and alongside fallings costs, this makes it ready for a large scale rollout.
Scale is an important factor, as is understanding the legal framework
FACTSHEET: Smart meter information analysis and actuators | www.grow-smarter.eu
Technical feasibilityDepends on legal situation in each country. Updating with real-time data adds a layer of complexity. The solution in Cologne is highly feasible.
Economic feasibility Financially and economically feasible because it enables better decision-making. It can be an enabling measure and/ or open up new business models.
Replication potentialThis measure is replicable in any city, depending on the legal situation; distribution network is important. The fellow city of Cork is looking at replication.
How did the measure work?
Do we mean that more sensors than expected were needed and that it is advisa-ble to include a buffer financi-ally?
SmartHome system in Cologne
This project has received funding from the European Union’s Horizon 2020 research and innovation programme under grant agreement no 646456. The sole responsibility for the content of this document lies with the author and in no way reflects the views of the European Union.

OpenDH - feed-in of waste heat into district heating network
Smart solution 6New business models for district heating and cooling
Integrated Infrastructures / FACTSHEET
Reduced CO2 emissions yearly
Heat recovery ratio recovered per year
208 T 73% 3,1GWhMeasured impacts
24
Stockholm
Technical partners
Stockholm Exergi Martin [email protected]
City contact
Mika [email protected]
What is it? A technology that recovers surplus heat and integrate it into existing district heating (DH) networks to meet local heating demands by citizens in an urban environment. An innovative business model has been developed for a yet unexplored potential, where installation of plug and play heat pumps at the waste heat producer facilities the ability to recover the energy into the DH network.
Waste heat is abundant in cities but rarely used. Data centres and shopping malls with many freezers and coolers generate lots of excess heat which is often costly to get rid of. The technical innovation used is a heat pump model that can produce hot water at a temperature of 85°C instead of around 68ºC.
What did GrowSmarter do? The potential for heat recovery in Stockholm alone is estimated at 1 TWh annually, and the district heating utility Stockholm Exergi has developed this

innovative approach called Open District Heating (OpenDH). Within GrowSmarter, the utility company Stockholm Exergi has delivered two heat recovering projects: one local supermarket and a data centre in the city. The heat recovered in those two projects is then injected into the existing DH network of the area.
The installation at the supermarket proved to be promising, and the initial results showed the heat production from the freezers and coolers to be stable and economical feasible during a larger part of the year than originally expected. Only initial results are available, as the supermarket stopped the testing after a change of ownership. The implementation at the data centre proved very successful both for Stockholm Exergi and the data centre owner Glesys. The heat reuse of the data center chosen for the GrowSmarter project is expected to increase gradually to a level of approximately 1MW heat, a heat recovery that is sufficient to heat more than 1,000 apartments while reducing annual CO2 emissions in Stockholm
Lessons learntRobustness of the measured data collection is crucial and much more important than the periodicity of measurements. In cases of data loss, mean values for invoicing must be created and, in areas with higher proportion of recovered heat, the delivery temperature to the district heating customer must be ensured. Furthermore, since the heat pump operation responsibility is on the waste heat supplier, the Operations and Maintenance governance needs to be ensured for a successful project.
Upscaling & replication potentialThis measure is applicable to any city where there is a heating system nearby into which the waste heat can be fed. The DSO (Distribution System Operator) needs to allow, and pay, for third-party feed-in into the network. Therefore, the upscaling possibility of this measure is good when there is a DH-network in place and a DSO who are willing to apply a waste heat business model towards third parties.
It is important to build a first case/pilot together with one or several customers when large-scale heat recovery is identified.
FACTSHEET: OpenDH - feed-in of waste heat into district heating network | www.grow-smarter.eu
Technical feasibilitySince the excess energy recovered is not a high-level heat (25-40ºC), the energy can be consumed either in the return lines or in the supply line after being further heated by efficient heat pumps (using renewable electricity).
Economic feasibility The business model is based on the balance between connection/pipe investment and value of avoided other own production due to purchased waste heat. The heat supplier can lower their operating expenditure due to a new income for waste heat and avoid reinvestment cooling system costs.
Replication potentialIf the foundation is in place, focusing on the data centre segment (a growing worldwide business where the cooling demand is the same throughout the year) is seen as a promising replication area.
How did the measure work?
This project has received funding from the European Union’s Horizon 2020 research and innovation programme under grant agreement no 646456. The sole responsibility for the content of this document lies with the author and in no way reflects the views of the European Union.

Local energy generation
towards nZEB
Smart solution 6New business models for district heating and cooling
Integrated infrastructues / FACTSHEET
Measured impacts
25
Barcelona
Technical partners
IREC:Manel [email protected]
City contact
Gonzalo Cabezas [email protected]
What is it? Local energy generation towards nearly-zero energy building (nZEB) is about the connection of a public tertiary building to an energy-efficient District Heating and Cooling (DHC) network and the installation of local electricity generation through photovoltaics (PV). This is an important part of the technologies installed to reach a nearly-zero energy building (nZEB).
What did GrowSmarter do? Barcelona Municipality has promoted the use of local energy in the design of the full retrofitting action for the innovation centre Ca l’Alier (See factsheet 2: ‘Energy efficient refurbishment..’) in order to transform it into a nZEB.
A 68kWp photovoltaic plant was installed on the building rooftop. According to the Spanish Building Technical Code, Ca l’Alier does not meet the requirements for a compulsory installation of PV generation units.
local thermal energy supply
of electricity covered by on-site photovoltaics.
reduction of CO2 emissions by the heating system
100% 20% 84%

However, according to Barcelona Municipal regulation for retrofitted tertiary buildings, Ca l’Alier must have PV generation units. Based on the building roof area, the minimum PV power to be installed was 16.5 kWp but the Municipality decided to install a much larger PV plant.
The retrofitted building is fed by heating and cooling energy from the local District Heating and Cooling (DHC) network of the district where it is located. This thermal network uses local resources. The existence of large waste heat sources in the urban environment represent an opportunity for the deployment of DHC infrastructure. The network distributes heating and cooling energy generated in a nearby plant based on: thermal energy recovery, incineration of municipal solid waste from the city, and use of sea water (for cooling) coupled to energy efficient equipment. The combination of technologies largely reduces fossil energy consumption.
Lessons learntEven if nZEB criteria is applied in the building design and associated investment, once commissioned, it is essential to invest in operations and maintenance activities aimed at reaching the nZEB status and perform a thorough follow-up of the building’s energy behaviour.
The installation of a large photovoltaic plant on the building rooftop demonstrates the possibility for conciliation between on-site renewable energy production and building heritage protection concerns.
Upscaling & replication potentialIn mild climates, the DHC infrastructure is less spread than in cold climates. Notwithstanding, local regulation encourages the connection of large consumers (such as public tertiary buildings) to the existing networks, which fosters the potential for upscaling and replication of this measure.
A favorable local legislation is crucial for the massive roll-out of on-site RES and connection to DHC networks.
FACTSHEET: Local energy generation towards nZEB | www.grow-smarter.eu
How did the measure work?
Technical feasibilityThe connection of the building to the local DHC network allows using the available local waste energy resources to supply the energy demand of the district, which is not possible for individual thermal systems. This helps to upgrade the energy rating of the building.
Economic feasibility In moderate climates, the economic feasi-bility of the connection of a building to a DHC network is strongly dependent on the proximity of the building to the existing network(s), the building energy needs, and the planned expansion plans of the network.
Replication potentialThe existence of large waste heat sources in the urban environment represents an opportunity to deploy DHC infrastructure, which (accompanied by favourable local regulation) ensures a replicable business case. The combination of local energy sources (i.e. DHC, PV) enabled the nZEB certification.This project has received funding from the European Union’s Horizon 2020 research and
innovation programme under grant agreement no 646456. The sole responsibility for the content of this document lies with the author and in no way reflects the views of the European Union.

Optical sorting of waste, introduction of AWCS in an existing neighbourhood & waste collection statistics for individual households / businesses
Smart solution 7Smart waste collection, turning waste into energy
Integrated infrastructures / FACTSHEET
Measured impacts
26
StockholmTechnical partners
ENVACHans Anebreid [email protected]
City contact
Mika [email protected]
What is it? An automated waste collection system (AWCS) in residential areas using differently coloured bags for efficient sorting of waste and less effort for the residents. The aim is to improve the quality of life for residents and increase recycling rates as well as resource efficiency.
What did GrowSmarter do? Nine newly designed waste inlets were placed in the housing area Valla Torg in Stockholm with approximately 300 dwellings. The residents can sign in at the individual inlets before depositing their colour-coded waste. The waste is weighted when deposited and the system registers what kind of waste is being deposited using the colour-coding. From the individual inlets the waste is transported to a central collection station by pressurized tubes, which allows collection of waste from a single location.
reduction in CO2 emissions
reduction of waste collection traffic
reduction of unsorted waste
71% 90% 66%

The control system is brand new and the installation of a fibre network instead of copper allows for increased data traffic and greater possibilities for system control and operational statistics. Waste sorting has increased to include food waste, and the sorting rates are better than comparable areas.
Lessons learntUnderstanding judicial restrictions about who can collect and where the waste should go as well as the topic of tenant consent (GDPR) are essential. Energy consumption for operating the installation is higher than expected. However, a substantial reduction of the energy consumption is expected after preforming a minor upgrading of the technology. The upgrading will have a positive impact on the CO2 emissions as well and reduce them even further.
The measure reduces traffic related to garbage collection, which results in CO2 savings. Less space for waste handling also means more shared recreational spaces. Incentives for and feedback from tenants improves the outcome of the solution and patience is needed to encourage tenants. Technology is sophisticated and requires trained staff.
Upscaling & replication potentialAs the technical installation of the system is straight forward, the most important factor is securing the infrastructure for the waste sorting once it has been collected. GDPR, and possibly other judicial restrictions, must be understood in order to build up a database on waste deposited in the AWCS. Tenant information campaigns help with the acceptance. The follower cities of Porto and Suceava are looking into replication.
Reduced traffic reduces CO2 emissions and less space for waste handling means more public space.
FACTSHEET: Smart waste | www.grow-smarter.eu
Technical feasibilityThe system is technically feasible with sophisticated technology. Improvements, such as replacing minor technical components, could increase the end user experience and reduce energy use.
Economic feasibility The system is economically and financially feasible, with an impact in job creation, not just during the deployment phase but also during the operation phase.
Replication potentialScale advantage is high for areas with an existing sorting facility and recycling industry. Otherwise costs and benefits escalate proportionally to the area covered by the service. The follower cities of Porto and Suceava are looking into replication.
How did the measure work?
This project has received funding from the European Union’s Horizon 2020 research and innovation programme under grant agreement no 646456. The sole responsibility for the content of this document lies with the author and in no way reflects the views of the European Union.

Open urban big data platform in Cologne
Smart solution 8Big open data platform
Integrated infrastructures / FACTSHEET 27
CologneTechnical partners
[ui!] - the urban instituteStephan Borgert [email protected]
City contact
Julia Egenolf:[email protected]
What is it? The open urban big data platform is able to store and process urban data in real-time in order to enable vertical and horizontal integration of data and services and to enable the optimal use of the data on this basis. Data can be integrated from different departments of a city administration as well as from different utilities or third parties with relevant data.A Cockpit visualizes the data and gives a fast and easy overview of the current situation of the city. Different focal areas such as the environment or the traffic situation can be considered.
What did GrowSmarter do? The partner [ui!] developed the open urban big data platform ‘[ui!] Urban Pulse’ which is used to integrate information from the City of Cologne, utility partners , private partners etc. UrbanPulse is compliant to a standard, which was developed during GrowSmarter in order to reduce the risk of vendor lock-ins. The standard is part of the European-wide standardisation efforts.
of any urban data by using open standards, protocols and architecture.
processing of data by smart services and scalable cloud-based platform
and easy overview of the current city state
INTEGRATION REAL-TIME FASTImpacts

Some of the data integrated in Urban Pulse are also on the cities open data platform “offenedaten.koeln (est. 2008) and open for all. Some data are limited to the project partners for different reasons (competitiveness, data protection). For this reason, on top of the urban pulse two Cockpits were developed: The Urban Cockpit intern and extern. After integrating, consolidating, aggregating and using existing and new sensor data from infrastructures, the cockpits can display many different kinds of information and generate a new base for innovation to support management, control and future policies. The aim is to monitor the status and the impact of various measures in real time as well as simulate short and long term scenarios to improve the quality of decisions
The architecture of the Urban Pulse consists of three main layers: Urban Sensors and Data (bottom), Data Storage and Processing (middle) and Apps (top). Data is produced in the bottom layer, is processed in real time by smart services and stored in the middle layer and used (and visualized) on the top layer.
Lessons learntThe potential of urban data platforms is large and most parties recognize so. The main obstacles are concerns about data provision (ethics, security, value etc.) and legal limitations. It is very important to define early how the data will be handled in order to provide clear information for any private or public partner looking to share data.
Upscaling & replication potentialSmall use cases can help remove fear from data owners before moving on to larger solutions. The UrbanPulse platform is running on the Microsoft Azure Cloud in Cologne, but could run on any Cloud environment, and is easy to scale to big data streams of any urban domain.
Data protection, competitiveness and other issues can lead to some data being kept (temporarily) internally
FACTSHEET: Open urban big data platform in Cologne | www.grow-smarter.eu
Technical feasibilityThe implementation of an urban data platform is technically possible in all cities.Depending on requirements, the city has to check whether it will set up the urban data platform by itself or have an external provider assist.
Economic feasibility The benefit of an urban data platform depends on the available data and the willingness of the stakeholders to implement it. This must be assessed individually for each city.
Replication potentialBefore replicating it is recommended to create a city-wide handling strategy looking at issues of data protection, innovation drivers, infrastructure, legality, public relations and everything else that is deemed relevant.
How did the measure work?
Read a full description on how the Urban platform can be deployed in different ways on GrowSmarter’s website:
Cross-city integration Environmental monitoring Traffic

Big open data platform in Stockholm
Smart solution 8Big open data platform
Integrated infrastructures / FACTSHEET
Impacts
28
StockholmTechnical partners
IBMStanley Ekberg [email protected]
City contact
Mika [email protected]
What is it? The Stockholm City Data Platform analyses the flow and movements of vehicles and people in designated areas. The aim is to improve situational awareness and to use the acquired insights to support better planning, decision- and policy-making within the city, and to communicate up-to-date information to people staying in the area. Better planning and management can lead to an improved experience when staying in the city and to reduced emissions from vehicles.
What did GrowSmarter do? Growsmarter applied this measure in Slakthusområdet, an area of Stockholm housing several big arenas with an ever-changing flow of people attending different events and activities. Ten vehicle identification sensors were used to track traffic and retrieve emission data to calculate environmental impact. 30 Wi-Fi and camera-based sensors deployed in a limited area monitored the movement
bicyclists and pedestrians
citizens to avoid congestions
vehicle flows & emission impacts
TRACKS ASSIST TRACKS

of vehicles and people complemented by statistical calculations providing estimates for blind spots not covered by sensors and to determine the probable path between sensors where multiple routes were possible. The sensors measured data 24/7, and the project partner KTH and specialists at the city of Stockholm calculated levels of emissions during the project. These findings can be used to implement different traffic limiting actions and programs that can reduce emissions even further.
Complementary data from various sources such as weather data, event information from the local arenas, local traffic planning functions and live data from SL, Stockholm Public Transport, and Libelium environmental sensors were collected and compiled in the IBM Cloud platform to enrich the analytical capabilities and provide additional insights for the city of Stockholm, making the platform ready for future analytics and AI applications.
Lessons learntIt is important to have relevant stakeholders and user groups (event organisers, visitors, commuters etc.) involved at an early stage to identify requirements and expectations in order to provide real value for these groups. Implementation of new sensor systems are time consuming and this aspect should not be underestimated. The positioning of the cameras/ sensors for vehicles is crucial to obtain useful data and the responsibility for maintenance must be clearly defined. The data gathered during this implementation is central in order to establish a modern and useful urban planning and can be repurposed for many other applications and future development.
Upscaling & replication potentialAll technologies used in this project are proven and widely available. The cloud platform and data ingestion procedures can be used regardless of location. Sensors already installed can be reused to provide data. If no sensor data is available, sensors must be installed to replicate the solution. Big Data sources and connected devices are getting more common. This project has successfully demonstrated a real example of how these technologies can be combined to support new innovative opportunities.
An open data platform must be designed for flexibility and scalability
FACTSHEET: Big open data platform in Stockholm | www.grow-smarter.eu
Technical feasibilityThe measure has proved technically feasible to implement and to use as intended. The main challenges have been setup and configuration of sensors and initial quality issues with data.
Economic feasibility The implementation of a Big Data platform often imposes a high start-up cost for the first use case. Adding additional use cases or scaling the application usage can dramatically lower the cost per unit or use case.
Replication potentialThe measure is ready for use and can be replicated as-is. The number of data sources are expanding rapidly which opens up for new and innovative use cases. To accommodate the growth, in data volumes and applications, and to realize even more value over time, it is extremely important use an open data platform that is designed for flexibility and scalability.
How did the measure work?
This project has received funding from the European Union’s Horizon 2020 research and innovation programme under grant agreement no 646456. The sole responsibility for the content of this document lies with the author and in no way reflects the views of the European Union.

Urban models & semi-automatic instance mapping
Smart solution 8Big open data platform
Integrated infrastructures / FACTSHEET
Impacts
29
BarcelonaTechnical partners
Barcelona Supercomputing CentreMaria Marinescu [email protected]
City contact
Gonzalo Cabezas [email protected]
What is it? Creating a semantic urban model and semi-automatic instance mapping makes it possible to connect three domains of interest for smart cities: mobility, energy, and integrated infrastructures, and integrate heterogeneous data sources.
When data from different sources are mapped to a single urban model, the semantic layer makes it possible for users to browse and query the data through the ontology. The model makes a data schema transparent to the user/app, while the semantic layer translates automatically between the semantic queries and the actual API calls to the city platform. The exploration and query tool allows users to access to the data without the need to understand the data model nor manage the query language.
What did GrowSmarter do? The Urban Model contains a generic high-level city model, to which energy, mobility, integrated infrastructures, and contamination monitoring verticals are added. This consist in defining the entities
integration of heterogeneous data sources
cities to take up smart solutions
complex queries in a user-friendly way
EASES ENABLES GENERATES

handled by these domains, the relationships between them, and the constraints that need to hold. Three different components have been created to implement this solution. A fourth one – the exploration and query tool – was adapted from a tool developed in a past project. The Urban Model contains a generic high-level city model, to which energy, mobility, and contamination monitoring, as well as relationships between concepts in the different domains are added. Three different components have been created to implement this solution:
• City ontology: A semantic model that represents several vertical domains and the relationships between them provides a single point of access to integrated heterogeneous data. Data is enriched by interconnections defined by the model.
• Exploration and query tool: Exploration, query, and visualization made user friendly. Exploration is keyword and graphical-based and queries are constructed in a graphical manner.
• Semi-automatic mapping tool: This tool aligns the semantic model (city ontology) with the specific city data schema in a semi-automatic fashion. Concretely, it recommends mappings to domain specialists, who can choose the correct ones using a collaborative tool. The core mapping tool is LogMap from Oxford. This process makes it easier to add new data sources or modify existing ones. These mappings are used by the Semantic access layer.
• Semantic access layer: This layer allows users to access data from different city platforms combined if their data sets
have been included in the city platform.
This is an enabling functionality for any measure and application that wants to easily cross data from different domains without having to know the underlying structure and of each individual data stream.
Lessons learntWith this enabling functionality, it is essential to understand the benefits of the system and to identify partners who can develop applications on top of the technology, stress the model and use data in complex manners. Extensive amounts of data is needed to make the case for such a labour intensive approach. If data either changes quickly, is highly heterogeneous, or a low-risk approach is needed instead of designing a massive database, semantic technologies are the right approach.
Upscaling & replication potentialThe urban model may be re-used by any other city as is, although a domain specialist should help extend it with concepts that may not have been modelled. Additionally, a city re-using it should re-implement the Semantic access layer to adapt its own city platform and remap the data.
A lot of data is needed to make the semantic approach scalable.
FACTSHEET: Urban models & semi-automatic instance mapping | www.grow-smarter.eu
Technical feasibilityThe urban model may be re-used by any other city when adapted to its own platform.
Economic feasibility A solution based on a semantic model makes sense when integrating data from many heterogeneous sources, when data (and data schemas) change often, is incomplete, sparse, or otherwise dynamic; otherwise the effort involved in this large scale approach may not be justified.
Replication potentialA new semantic access layer needs to be implemented and the model may need to be extended.
How did the measure work?
This project has received funding from the European Union’s Horizon 2020 research and innovation programme under grant agreement no 646456. The sole responsibility for the content of this document lies with the author and in no way reflects the views of the European Union.

Integration of sensor and heterogeneous data in standard data format
Smart solution 8Big open data platform
Integrated infrastructures / FACTSHEET
Measured impacts
30
BarcelonaTechnical partners
Cellnex TelecomCarmen [email protected]
City contact
Gonzalo Cabezas [email protected]
What is it? The measure creates an horizontal core platform that aggregates data from all measures deployed in Barcelona. Main capabilities are focused both, on urban data gathering, and the distribution of data services to the northbound applications.
Based on a set of Application Programming Interfaces (APIs), the platform also offers a marketplace of data services that promotes co-creation of added value applications and urban services to manage and monitor the smart city, boosting new business models.
What did GrowSmarter do? In Barcelona, the horizontally organized platform manages and shares data from the implemented GrowSmarter measures. The platform is like a middleware component of the Big Consolidated Data Platform that collects and standardizes different types of data with the aim
integrated sensors integrated data through a marketplace of integrated data services
875 4.8 GB DATA INTEROPERABILITY

of offering them in a common marketplace where business applications like Business Intelligence algorithms, Monitoring Applications, City Dashboards, Semantic Layer, etc, can make use of the GrowSmarter data (see, for example, factsheets 29 and 31).
The platform includes data from a wide range of measures in GrowSmarter, including freight information (see factsheet 33), smart taxis (factsheet 44), data from Smart Towers (factsheet 20) and all the retrofitting done in Barcelona (factsheets 1-4).
The solution allows processing and sharing of large amounts of heterogeneous urban data in real-time to support decision-making applications and therefore grants interoperability and a standardised management. In total, the platform is processing about 875.000 observation updates per month.
Lessons learntThe challenge is filling the platform with enough data because not all measures provide enough information and data. The horizontal concept allows the platform to work across vertical services. Additionally, the modular concept allows the platform to provide new functionalities or to process new types of data sets, without disturbing the previous features.
Upscaling & replication potentialThis solution of a horizontal platform based on standards and open source components is an enabling measure and is easily scalable and replicable to any other city because it is independent of specific data-sets and application domains.
Easily replicable, but needs data input and use cases
FACTSHEET: Integration of sensor and heterogeneous data in standard data format | www.grow-smarter.eu
Technical feasibilityThe horizontal concept of the platform allows to work across several vertical services. Its modular concept allows adapting its capabilities to any environment.
Economic feasibility The solution has been devised as a Platform as a Service (PaaS), that proposes a modular cost system to be flexible with different needs and requirements.
Replication potentialThis solution is easily scalable and replicable for any city.
How did the measure work?
This project has received funding from the European Union’s Horizon 2020 research and innovation programme under grant agreement no 646456. The sole responsibility for the content of this document lies with the author and in no way reflects the views of the European Union.

Sustainable connected lighting to enhance safety and mobility
Smart solution 8Big open data platform
Integrated infrastructures / FACTSHEET
Measured impacts
31
BarcelonaTechnical partners
Cellnex TelecomCarmen [email protected]
City contact
Gonzalo Cabezas [email protected]
What is it? Smart sustainable connected ligthing provides a smart solution to efficiently link the lighting management systems with other city services and infrastructures. This is done by developing an API (Application Programming Interface) for smart lighting systems implemented in the municipality to connect the lighting management system with other applications (e.g. traffic management, weather systems) and software platforms in order to exchange data between systems.
What did GrowSmarter do? Typically, street lighting poles are managed by their own lighting management systems following a vertical/silo solution. This makes it difficult to get an integrated view and to create a common lighting management system for all. The Smart Lighting measure uses the two smart towers for lighting and wireless communications located on
interoperability between different management systems for municipal services
API’s to manage smart lighting infrastructure
SmartLighting applications and services
IMPROVES SECURES ENHANCES

Cellnex’ premises as a part of their work in GrowSmarter.
A customized module developed by Cellnex Telecom, makes remote real-time management compatible with the Smart City platform Sentilo.
The lighting management systems will seamlessly connect to different software platforms available in cities using the API based on open standards. This means that lighting will be influenced not just by the decisions of the lighting system, but also by other systems managing other assets. Barcelona’s showcase of what intelligent public lighting can do for cities when they become more interactive, can serve as a motivator for changing views on what intelligent public lighting can do for cities in terms of creating a base for novel services.
Lessons learntThe Smart Lighting API should be a requirement defined by a municipality’s own street lighting service management. This avoids mistrust when external actors propose the deployment of horizontal solutions to get interoperable management of several systems, even when the solution is based on secured interfaces for systems interconnections. It is also recommended to implement city street lighting systems that allow remote management solutions through web services or APIs, in order to facilitate interoperability with other urban service management platforms.
Upscaling & replication potentialIt is important to involve all stakeholders (the owners of the lampposts) early, but an up-scaling should be easily implemented if all parties agree to the implementation.
A secured link between lighting management and other city services enables better decision-making processes for city managers and added value applications.
FACTSHEET: Sustainable connected lighting to enhance safety and mobility | www.grow-smarter.eu
Technical feasibilityThe Smart Lighting API offers interoperability to enable an integrated view of all lighting systems in the city.
Economic feasibility The Smart Lighting API offers lighting management as a Service, enabling the creation of added value Smart Lighting Applications and Services.
Replication potentialAdaptations to each specific Lighting System should be developed to provide the Smart Lighting API.
How did the measure work?
This project has received funding from the European Union’s Horizon 2020 research and innovation programme under grant agreement no 646456. The sole responsibility for the content of this document lies with the author and in no way reflects the views of the European Union.

PARTNERS:
This project has received funding from the European Union’s Horizon 2020 research and innovation
programme under grant agreement No 646456. The sole responsibility for the content of this publication
lies with the GrowSmarter project and in no way reflects the views of the European Union.
GrowSmarter brought together cities, networks, academia and industry sharing a wealth of experience
and technical know-how. To find out more, please visit www.grow-smarter.eu/the-team
MEET THE PROJECT TEAM:
CONTACT:[email protected] | @EUGrowSmarter
STOCKHOLM COLOGNE BARCELONA
For more information about theGrowSmarter project, please visit:
www.grow-smarter.eu