Embed Size (px)
Citation preview

San Diego Community College District
Facts on File
2007-2008 Edition
Published August 2007

www.sdccd.edu 3375 Camino Del Rio South, San Diego, CA 92108 (619) 388-6500
San Diego Community College DistrictFacts on File: 2007-2008 Edition
Description:Chancellor
C C ll h Description:The San Diego Community College District serves approximately 100,000 students eachsemester through three two-year colleges and six continuing education campuses. Thethree colleges - San Diego City College, San Diego Mesa College and San Diego MiramarCollege - offer associate degrees and certificates in occupational programs that preparestudents for entry-level jobs, and arts and sciences programs that transfer to four-yearcolleges and universities.
Constance M. Carroll, Ph. D.
Board of Trustees
Marty Block, J.D.
Rich Grosch
Bill Schwandt
The Continuing Education Campuses offer adults the opportunity to renew theirlearning experiences through noncredit vocational, basic skills, life skills, and enrichmentclasses at sites throughout the city. A number of special programs are unique to the city,including KSDS-FM all-jazz radio, the Center for Competitive and Applied Technologies,and the Workplace Learning Resource Center.
Th S Di C i C ll Di i i d b i fi b l ll
Maria Nieto Senour, Ph. D.
Peter Zschiesche
Presidents
Terrence J. Burgess City College
Rita Cepeda, Ed. D.The San Diego Community College District is governed by its five-member, locallyelected Board of Trustees and three student members serving on a rotating basis. Sharedgovernance activities involve faculty, students and staff in the development of solutionsto key policy and budget issues. The five trustees are elected in even-numbered years tofour-year terms by the voters of San Diego. The Chancellor, the District's chief executiveofficer, is responsible for carrying out the policies approved by the Board of Trustees.
Rita Cepeda, Ed. D.Mesa College
Patricia Hsieh, Ed.D.Miramar College
Anthony Beebe, Ed. D.Continuing Education
Vice ChancellorsMajor Construction Projects/Improvements Underway or Planned for the Year:1) District Office- Seismic upgrade and remodel of the District Office. 2) District Service Center- Remodel of newly acquired property to house maintenance
facility operations.
Henry Ingle, Ph. D.Instructional Services,Planning and Technology
Wayne MurphyHuman Resources &
Administrative Services
Lynn Ceresino Neault
Continuing Education Terms:Fall: September 5, 2007- January 26, 2008
College Terms:Fall: August 27, 2007- December 19, 2007
Lynn Ceresino NeaultStudent Services
David UmstotFacilities Management
Terry DavisBusiness Services
Spring: January 27, 2008- June 7, 2008Summer: June 8, 2008- August 30, 2008
Student Information
ll
Intersession: January 2, 2008- January 26, 2008Spring: January 28, 2008- May 24, 2008Summer: June 2, 2008- August 9, 2008
CollegeTotal
Continuing Education
District Total
Total 2006-2007 FTES (Resident Only)For the District, this is an increase of 1.4% (568.33 FTES) from 2005-2006. 31,373.76 9,931.15 41,304.91
Annual Unduplicated Headcount 2006-2007For the District, this is an increase of 4.8% (6,680 individuals) from 2005-2006. 76,848 69,929 146,777
Headcount by Term (Unduplicated within Terms)
Summer 2006 24,824 24,826 49,650
Fall 2006 47,120 36,528 83,648
Spring 2007 49,540 39,124 88,6641

Student InformationFall 2006 end of term
San Diego Community College District
Race/Ethnicity College Total Continuing Education District
American Indian 434 (0.9%) 231 (0.6%) 665 (0.8%)
Asian/Pacific Islander 6,089 (12.9%) 4,397 (12.0%) 10,486 (12.6%)
African American 3,972 (8.4%) 3,406 (9.3%) 7,378 (8.8%)
White 17,780 (37.8%) 12,100 (33.1%) 29,880 (35.7%)
Latino 10,168 (21.6%) 13,193 (36.1%) 23,361 (27.9%)
Filipino 2,954 (6.3%) 1,078 (3.0%) 4,032 (4.8%)
Other 1,564 (3.3%) 677 (1.9%) 2,241 (2.7%)
Unknown 4,159 (8.8%) 1,446 (4.0%) 5,605 (6.7%)
Total 47,120 (100%) 36,528 (100%) 83,648 (100%)
Age Group College Total Continuing Education District
Under 18 994 (2.1%) 1,337 (3.7%) 2,331 (2.8%)
18-24 25,056 (53.2%) 6,322 (17.3%) 31,378 (37.5%)
25-29 8,111 (17.2%) 4,163 (11.4%) 12,274 (14.7%)
30-34 4,070 (8.6%) 3,779 (10.3%) 7,849 (9.4%)
35-39 2 837 (6 0%) 3 314 (9 1%) 6 151 (7 3%)35 39 2,837 (6.0%) 3,314 (9.1%) 6,151 (7.3%)
40-49 3,662 (7.8%) 5,301 (14.5%) 8,963 (10.7%)
50 & over 2,103 (4.5%) 12,304 (33.7%) 14,407 (17.2%)
Unknown 287 (0.6%) 8 (0.0%) 295 (0.4%)
Total 47,120 (100%) 36,528 (100%) 83,648 (100%)
Gender College Total Continuing Education District
Female 24,897 (52.9%) 22,125 (60.6%) 47,022 (56.2%)
Male 22,210 (47.1%) 13,890 (38.0%) 36,100 (43.2%)( ) ( ) ( )
Unknown 13 (0.0%) 513 (1.4%) 526 (0.6%)
Total 47,120 (100%) 36,528 (100%) 83,648 (100%)
2
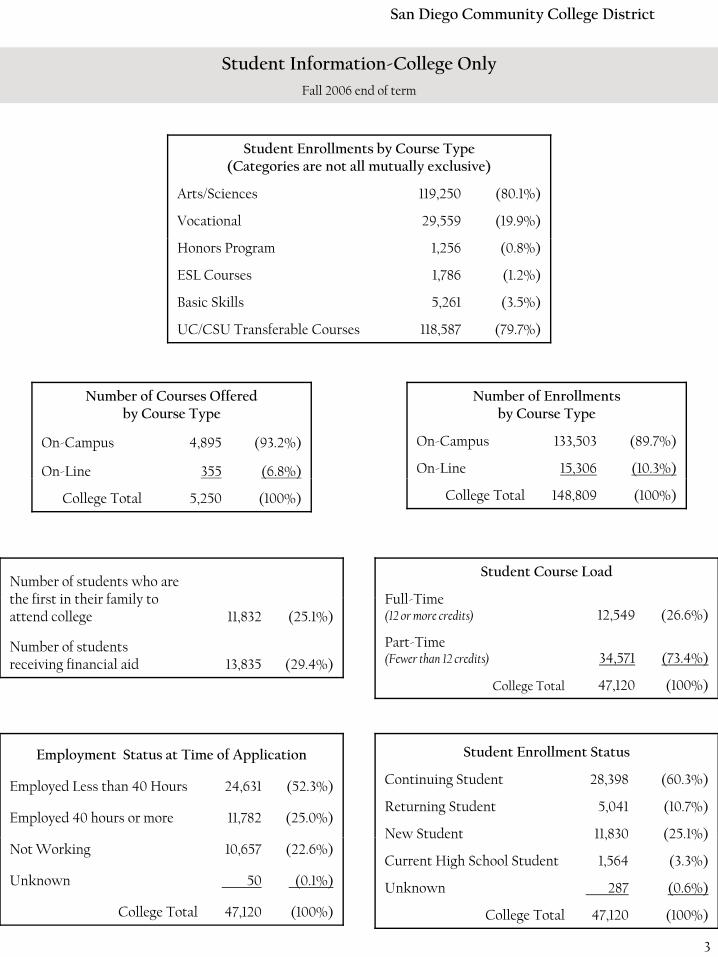
Student Information-College OnlyFall 2006 end of term
San Diego Community College District
Student Enrollments by Course Type(Categories are not all mutually exclusive)
Arts/Sciences 119,250 (80.1%)
Vocational 29,559 (19.9%)
Honors Program 1,256 (0.8%)
ESL Courses 1,786 (1.2%)
Basic Skills 5,261 (3.5%)
UC/CSU Transferable Courses 118,587 (79.7%)
Number of Enrollmentsby Course Type
On-Campus 133,503 (89.7%)
On-Line 15,306 (10.3%)
Number of Courses Offered by Course Type
On-Campus 4,895 (93.2%)
On-Line 355 (6.8%)
Number of students who are the first in their family to
Student Course Load
Full Time
College Total 148,809 (100%)
( )
College Total 5,250 (100%)
the first in their family to attend college 11,832 (25.1%)
Number of students receiving financial aid 13,835 (29.4%)
Full-Time (12 or more credits) 12,549 (26.6%)
Part-Time(Fewer than 12 credits) 34,571 (73.4%)
College Total 47,120 (100%)
Employment Status at Time of Application
Employed Less than 40 Hours 24,631 (52.3%)
Employed 40 hours or more 11,782 (25.0%)
Student Enrollment Status
Continuing Student 28,398 (60.3%)
Returning Student 5,041 (10.7%)
New Student 11,830 (25.1%)Not Working 10,657 (22.6%)
Unknown 50 (0.1%)
College Total 47,120 (100%)
New Student 11,830 (25.1%)
Current High School Student 1,564 (3.3%)
Unknown 287 (0.6%)
College Total 47,120 (100%)
3
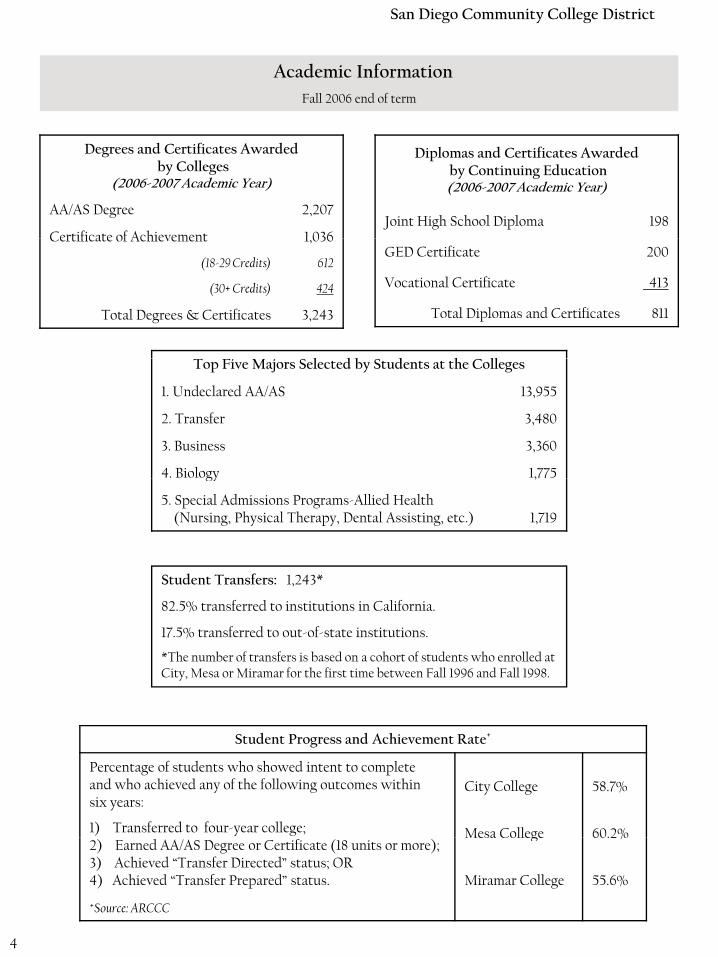
Academic InformationFall 2006 end of term
San Diego Community College District
Degrees and Certificates Awardedby Colleges
(2006-2007 Academic Year)
AA/AS Degree 2,207
Certificate of Achievement 1 036
Diplomas and Certificates Awardedby Continuing Education(2006-2007 Academic Year)
Joint High School Diploma 198Certificate of Achievement 1,036
(18-29 Credits) 612
(30+ Credits) 424
Total Degrees & Certificates 3,243
l d b d h ll
GED Certificate 200
Vocational Certificate 413
Total Diplomas and Certificates 811
Top Five Majors Selected by Students at the Colleges
1. Undeclared AA/AS 13,955
2. Transfer 3,480
3. Business 3,360
4. Biology 1,775
Student Transfers: 1,243*
gy ,77
5. Special Admissions Programs-Allied Health (Nursing, Physical Therapy, Dental Assisting, etc.) 1,719
82.5% transferred to institutions in California.
17.5% transferred to out-of-state institutions.
*The number of transfers is based on a cohort of students who enrolled at City, Mesa or Miramar for the first time between Fall 1996 and Fall 1998.
Student Progress and Achievement Rate+
Percentage of students who showed intent to complete and who achieved any of the following outcomes within six years:
1) Transferred to four-year college;
City College 58.7%
Mesa College 60.2%2) Earned AA/AS Degree or Certificate (18 units or more);3) Achieved “Transfer Directed” status; OR4) Achieved “Transfer Prepared” status.
Mesa College 60.2%
Miramar College 55.6%
+Source: ARCCC
4
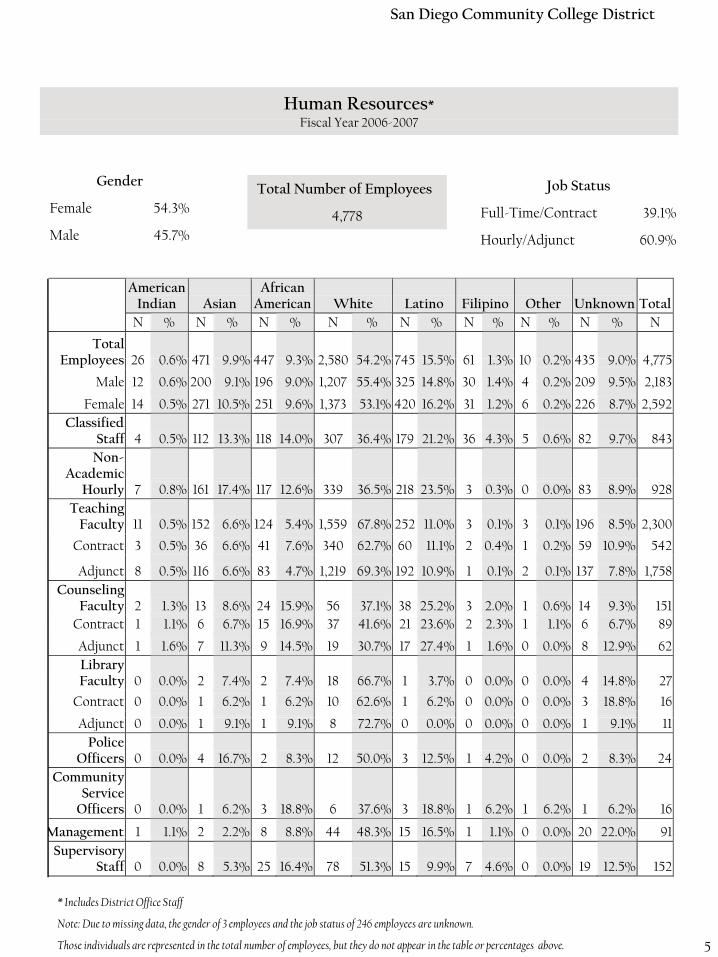
Human Resources*Fi l Y 2006 2007
San Diego Community College District
Fiscal Year 2006-2007
Gender
Female 54.3%
Male 45.7%
Total Number of Employees
4,778
Job Status
Full-Time/Contract 39.1%
Hourly/Adjunct 60 9%Male 45.7% Hourly/Adjunct 60.9%
American Indian Asian
African American White Latino Filipino Other Unknown Total
N % N % N % N % N % N % N % N % N
Total Employees 26 0 6% 471 9 9% 447 9 3% 2 580 54 2% 745 15 5% 61 1 3% 10 0 2% 435 9 0% 4 775 Employees 26 0.6% 471 9.9% 447 9.3% 2,580 54.2% 745 15.5% 61 1.3% 10 0.2% 435 9.0% 4,775
Male 12 0.6% 200 9.1% 196 9.0% 1,207 55.4% 325 14.8% 30 1.4% 4 0.2% 209 9.5% 2,183
Female 14 0.5% 271 10.5% 251 9.6% 1,373 53.1% 420 16.2% 31 1.2% 6 0.2% 226 8.7% 2,592 Classified
Staff 4 0.5% 112 13.3% 118 14.0% 307 36.4% 179 21.2% 36 4.3% 5 0.6% 82 9.7% 843 Non-
Academic Hourly 7 0.8% 161 17.4% 117 12.6% 339 36.5% 218 23.5% 3 0.3% 0 0.0% 83 8.9% 928
Teaching Faculty 11 0.5% 152 6.6% 124 5.4% 1,559 67.8% 252 11.0% 3 0.1% 3 0.1% 196 8.5% 2,300
Contract 3 0.5% 36 6.6% 41 7.6% 340 62.7% 60 11.1% 2 0.4% 1 0.2% 59 10.9% 542
Adjunct 8 0.5% 116 6.6% 83 4.7% 1,219 69.3% 192 10.9% 1 0.1% 2 0.1% 137 7.8% 1,758 Counseling
Faculty 2 1.3% 13 8.6% 24 15.9% 56 37.1% 38 25.2% 3 2.0% 1 0.6% 14 9.3% 151 Contract 1 1.1% 6 6.7% 15 16.9% 37 41.6% 21 23.6% 2 2.3% 1 1.1% 6 6.7% 89
Adjunct 1 1.6% 7 11.3% 9 14.5% 19 30.7% 17 27.4% 1 1.6% 0 0.0% 8 12.9% 62 Library Faculty 0 0.0% 2 7.4% 2 7.4% 18 66.7% 1 3.7% 0 0.0% 0 0.0% 4 14.8% 27
Contract 0 0.0% 1 6.2% 1 6.2% 10 62.6% 1 6.2% 0 0.0% 0 0.0% 3 18.8% 16
Adjunct 0 0.0% 1 9.1% 1 9.1% 8 72.7% 0 0.0% 0 0.0% 0 0.0% 1 9.1% 11 Police
Officers 0 0.0% 4 16.7% 2 8.3% 12 50.0% 3 12.5% 1 4.2% 0 0.0% 2 8.3% 24 Community
Service Officers 0 0.0% 1 6.2% 3 18.8% 6 37.6% 3 18.8% 1 6.2% 1 6.2% 1 6.2% 16
Management 1 1.1% 2 2.2% 8 8.8% 44 48.3% 15 16.5% 1 1.1% 0 0.0% 20 22.0% 91
* Includes District Office Staff
Note: Due to missing data, the gender of 3 employees and the job status of 246 employees are unknown.
Those individuals are represented in the total number of employees, but they do not appear in the table or percentages above.
g % % % % % % % % Supervisory
Staff 0 0.0% 8 5.3% 25 16.4% 78 51.3% 15 9.9% 7 4.6% 0 0.0% 19 12.5% 152
5
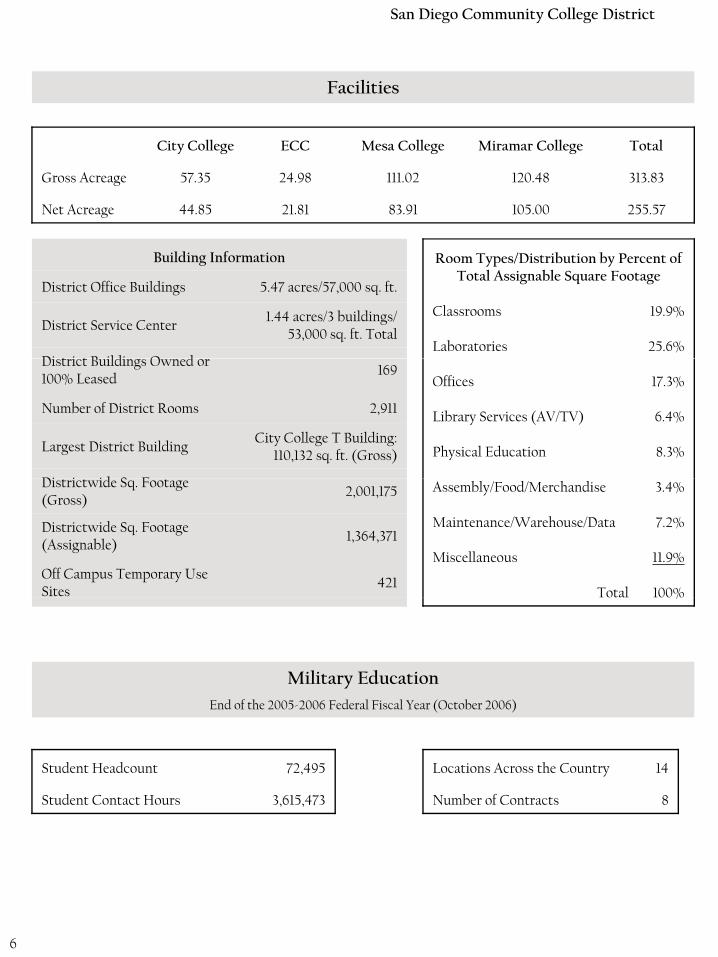
Facilities
San Diego Community College District
City College ECC Mesa College Miramar College Total
Gross Acreage 57.35 24.98 111.02 120.48 313.83
Net Acreage 44.85 21.81 83.91 105.00 255.57
Room Types/Distribution by Percent of Total Assignable Square Footage
Classrooms 19.9%
Laboratories 25.6%
Building Information
District Office Buildings 5.47 acres/57,000 sq. ft.
District Service Center1.44 acres/3 buildings/
53,000 sq. ft. Total
Di t i t B ildi O d Offices 17.3%
Library Services (AV/TV) 6.4%
Physical Education 8.3%
District Buildings Owned or 100% Leased
169
Number of District Rooms 2,911
Largest District BuildingCity College T Building:
110,132 sq. ft. (Gross)
Di i id S F Assembly/Food/Merchandise 3.4%
Maintenance/Warehouse/Data 7.2%
Miscellaneous 11.9%
Total 100%
Districtwide Sq. Footage (Gross)
2,001,175
Districtwide Sq. Footage (Assignable)
1,364,371
Off Campus Temporary Use Sites
421
Military Education End of the 2005-2006 Federal Fiscal Year (October 2006)
%
Student Headcount 72,495
Student Contact Hours 3,615,473
Locations Across the Country 14
Number of Contracts 8
6

Finances Fiscal Year 2006-2007
San Diego Community College District
Funding Source City Mesa MiramarContinuing Education Districtwide Total
General Fund Unrestricted $32,406,081 $47,571,124 $22,695,971 $23,760,584 $86,677,266 $213,111,026
General Fund Restricted $20,960,009 $8,699,268 $5,654,717 $10,456,609 $25,971,835 $71,742,438
Child Development $313,985 $223,518 $149,754 0 $142,800 $830,057 Child Development $313,985 $223,518 $149,754 0 $142,800 $830,057
Special Revenue 0 0 0 0 $513,096 $513,096
Capital Projects $1,268,687 $2,415,418 $967,447 $666,892 $17,979,663 $23,298,107
Other Trust and Agency 0 0 0 0 $1,889,195 $1,889,195
Student Representation Trust $40,800 $126,705 $59,316 0 0 $226,821
Scholarship & Loan Trust $78,361 0 0 0 $68,464 $146,825 p
Retiree Health Benefit Trust 0 0 0 0 $11,163,265 $11,163,265
Associated Students $70,769 $172,395 $51,485 $93,244 0 $387,893
Student Financial Aid $14,106,146 $10,377,290 $3,751,517 $327,749 0 $28,562,702
Internal Services 0 0 0 0 $12,041,473 $12,041,473
Proposition "S" $20,881,023 $32,210,660 $39,938,486 $46,172,174 $96,787,837 $235,990,180
Bookstore 0 0 0 0 $11,762,675 $11,762,675
Food Service 0 0 0 0 $3,675,038 $3,675,038
Total $90,125,861 $101,796,378 $73,268,693 $81,477,252 $268,672,607 $615,340,790
Grants and Contracts ActivityFiscal Year 2006-2007
Grant Management Location
City College
Mesa College
Miramar College
Continuing Education
ISPT/ District Office
Combined Colleges and/or ISPT/
District Office Total
$3,158,360 $815,172 $1,820,439 $504,583 $3,546,890 $3,936,146 $13,781,590
7
Definition of Terms
l d l d d h b d d l ll d ll
San Diego Community College District
Annual Unduplicated Headcount: This is based on students actively enrolled in Summer, Fall,Winter, and/or Spring terms. This headcount includes both credit and noncredit students. Astudent enrolled in multiple terms is counted only once for the year (i.e., not counted separatelyfor each term).
Headcount by Term (Unduplicated within Terms): This is based on students actively enrolledin a specific term (Summer, Fall, Winter, or Spring terms). This headcount includes both creditand noncredit students. A student is counted only once in each term in which the student isactively enrolled. However, if the student is enrolled in more than one term during the periodbeing discussed, the student will be counted for each term.
Example: A student enrolled in Fall 2006 and Spring 2007. For the Annual UnduplicatedHeadcount, the student will be counted once. For the Student Headcount by Term, the studentwill be counted once in each term.
Full-Time Equivalent Students (FTES): FTES is the major student workload measure, one ofseveral, used in determining the eligibility for state funding of community colleges. The FTESdoes not reflect “headcount enrollment” It is the equivalent of 525 hours of student instructiondoes not reflect headcount enrollment . It is the equivalent of 525 hours of student instructionper each FTES. FTES is derived by considering that one student could be enrolled in courses for3 hours a day, 5 days a week, for an academic year of 35 weeks- a total of 525 hours per one FTES.
8
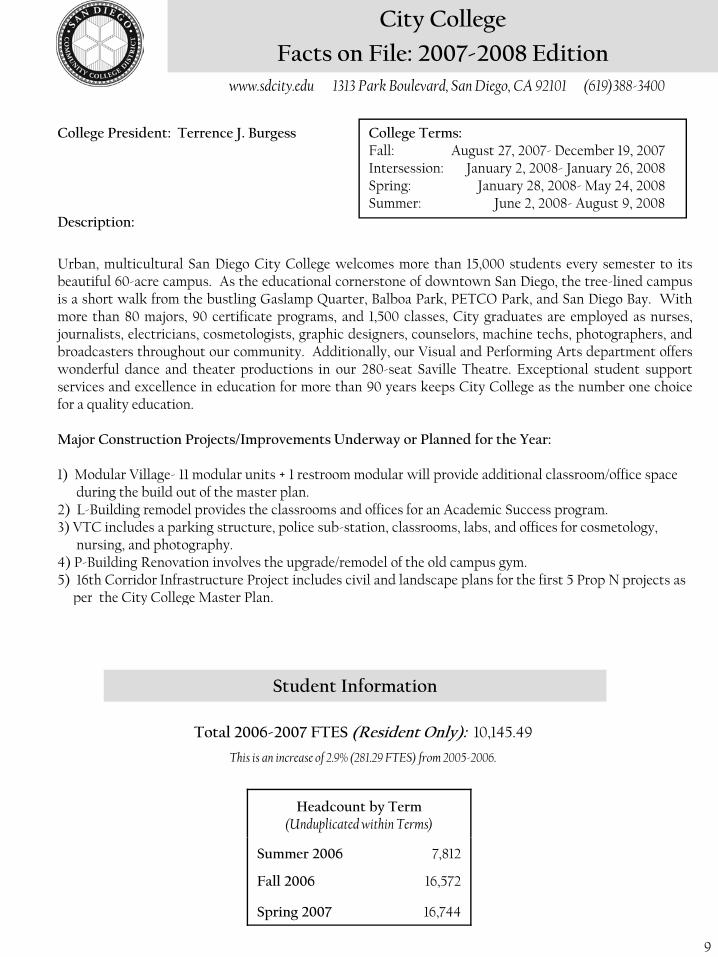
www.sdcity.edu 1313 Park Boulevard, San Diego, CA 92101 (619)388-3400
City College
Facts on File: 2007-2008 Edition
Description:
College President: Terrence J. Burgess College Terms:Fall: August 27, 2007- December 19, 2007Intersession: January 2, 2008- January 26, 2008Spring: January 28, 2008- May 24, 2008Summer: June 2, 2008- August 9, 2008
Urban, multicultural San Diego City College welcomes more than 15,000 students every semester to itsbeautiful 60-acre campus. As the educational cornerstone of downtown San Diego, the tree-lined campusis a short walk from the bustling Gaslamp Quarter, Balboa Park, PETCO Park, and San Diego Bay. Withmore than 80 majors, 90 certificate programs, and 1,500 classes, City graduates are employed as nurses,journalists, electricians, cosmetologists, graphic designers, counselors, machine techs, photographers, andbroadcasters throughout our community. Additionally, our Visual and Performing Arts department offersg y y g pwonderful dance and theater productions in our 280-seat Saville Theatre. Exceptional student supportservices and excellence in education for more than 90 years keeps City College as the number one choicefor a quality education.
Major Construction Projects/Improvements Underway or Planned for the Year:
1) Modular Village- 11 modular units + 1 restroom modular will provide additional classroom/office space1) Modular Village 11 modular units 1 restroom modular will provide additional classroom/office spaceduring the build out of the master plan.
2) L-Building remodel provides the classrooms and offices for an Academic Success program.3) VTC includes a parking structure, police sub-station, classrooms, labs, and offices for cosmetology,
nursing, and photography.4) P-Building Renovation involves the upgrade/remodel of the old campus gym.5) 16th Corridor Infrastructure Project includes civil and landscape plans for the first 5 Prop N projects as
per the City College Master Planper the City College Master Plan.
Student Information
Headcount by Term (Unduplicated within Terms)
Total 2006-2007 FTES (Resident Only): 10,145.49
This is an increase of 2.9% (281.29 FTES) from 2005-2006.
Summer 2006 7,812
Fall 2006 16,572
Spring 2007 16,744
9

Student InformationFall 2006 End of Term
City College
Age Group
Under 18 147 (0.9%)
18-24 8,143 (49.1%)
25-29 3,055 (18.4%)
Race/Ethnicity
American Indian 181 (1.1%)
Asian/Pacific Islander 1,173 (7.1%)
Af i A i 2 184 (13 2%) 25 29 3,055 (18.4%)
30-34 1,614 (9.7%)
35-39 1,137 (6.9%)
40-49 1,486 (9.0%)
50 & over 945 (5.7%)
African American 2,184 (13.2%)
White 5,177 (31.3%)
Latino 5,139 (31.0%)
Filipino 752 (4.5%)
Other 619 (3.7%)
Unknown 45 (0.3%)
Total 16,572 (100%)
Number of students who are the first in their family to attend college 5,153 (31.1%)
Unknown 1,347 (8.1%)
Total 16,572 (100%)
Employment Status at Time of Application
Employed Less than 40 hours 7,875 (47.5%)
Number of students receiving financial aid 5,396 (32.6%)
Employed 40 hours or more 4,470 (27.0%)
Not Working 4,207 (25.4%)
Unknown 20 (0.1%)
Total 16,572 (100%)
Student Course Load
Full-Time (12 or more credits) 3,495 (21.1%)
Part-Time
Gender
Female 9,146 (55.2%)
Male 7,422 (44.8%)
(Fewer than 12 credits) 13,077 (78.9%)
Total 16,572 (100%)
Unknown 4 (0.0%)
Total 16,572 (100%)
10
b f ll b
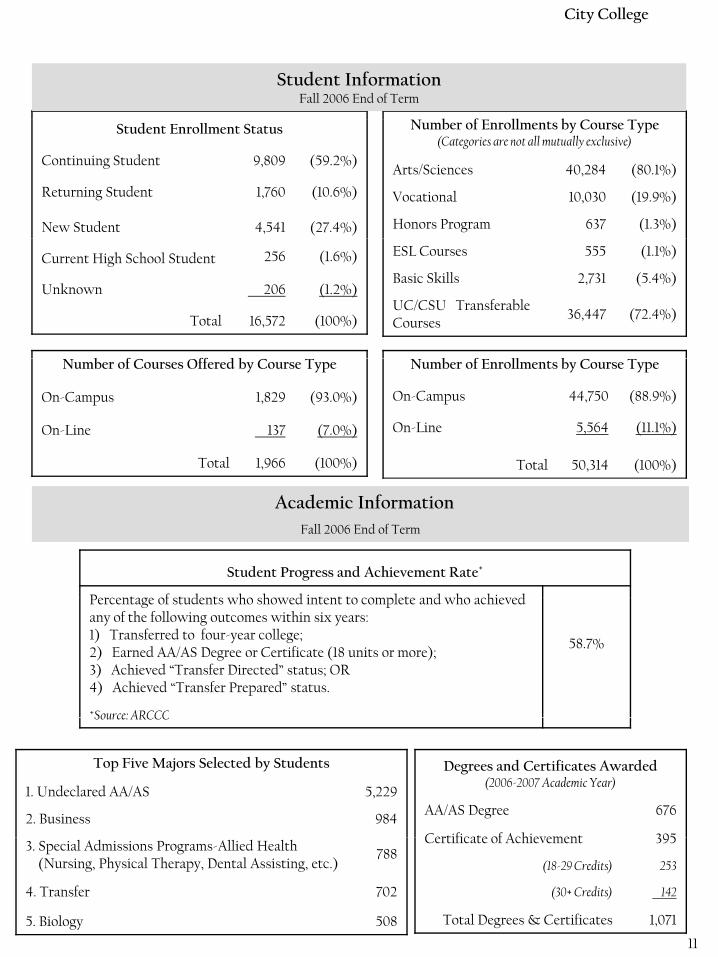
Student Information Fall 2006 End of Term
City College
Number of Enrollments by Course Type(Categories are not all mutually exclusive)
Arts/Sciences 40,284 (80.1%)
Vocational 10,030 (19.9%)
Honors Program 637 (1.3%)
Student Enrollment Status
Continuing Student 9,809 (59.2%)
Returning Student 1,760 (10.6%)
New Student 4,541 (27.4%)
b f ll b
ESL Courses 555 (1.1%)
Basic Skills 2,731 (5.4%)
UC/CSU Transferable Courses
36,447 (72.4%)
b f ff d b
Current High School Student 256 (1.6%)
Unknown 206 (1.2%)
Total 16,572 (100%)
Number of Enrollments by Course Type
On-Campus 44,750 (88.9%)
On-Line 5,564 (11.1%)
Total 50,314 (100%)
Number of Courses Offered by Course Type
On-Campus 1,829 (93.0%)
On-Line 137 (7.0%)
Total 1,966 (100%)
Academic InformationFall 2006 End of Term
Student Progress and Achievement Rate+
Percentage of students who showed intent to complete and who achieved Percentage of students who showed intent to complete and who achieved any of the following outcomes within six years: 1) Transferred to four-year college;2) Earned AA/AS Degree or Certificate (18 units or more);3) Achieved “Transfer Directed” status; OR4) Achieved “Transfer Prepared” status.
58.7%
+Source: ARCCC
Top Five Majors Selected by Students
1. Undeclared AA/AS 5,229
2. Business 984
Source: ARCCC
Degrees and Certificates Awarded (2006-2007 Academic Year)
AA/AS Degree 676
Certificate of Achievement 3953. Special Admissions Programs-Allied Health (Nursing, Physical Therapy, Dental Assisting, etc.)
788
4. Transfer 702
5. Biology 508
Certificate of Achievement 395
(18-29 Credits) 253
(30+ Credits) 142
Total Degrees & Certificates 1,071
11
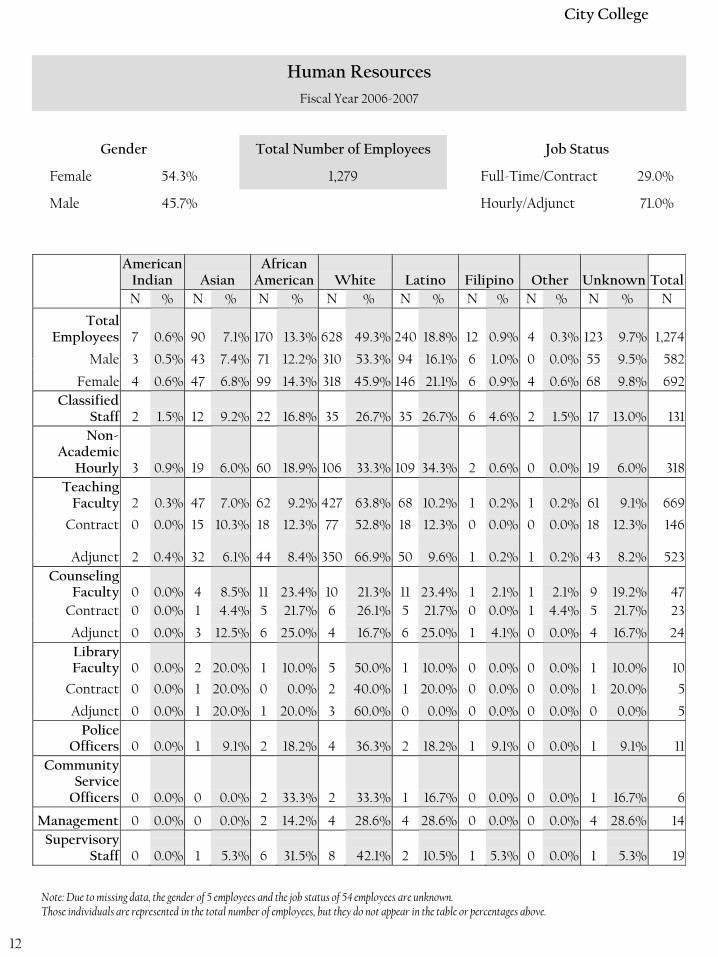
Human ResourcesFiscal Year 2006-2007
City College
Total Number of Employees
1,279
Gender
Female 54.3%
Male 45.7%
Job Status
Full-Time/Contract 29.0%
Hourly/Adjunct 71.0%
American
Indian Asian African
American White Latino Filipino Other Unknown Total N % N % N % N % N % N % N % N % N
Total Employees 7 0.6% 90 7.1% 170 13.3% 628 49.3% 240 18.8% 12 0.9% 4 0.3% 123 9.7% 1,274
Male 3 0 5% 43 7 4% 71 12 2% 310 53 3% 94 16 1% 6 1 0% 0 0 0% 55 9 5% 582 Male 3 0.5% 43 7.4% 71 12.2% 310 53.3% 94 16.1% 6 1.0% 0 0.0% 55 9.5% 582
Female 4 0.6% 47 6.8% 99 14.3% 318 45.9% 146 21.1% 6 0.9% 4 0.6% 68 9.8% 692Classified
Staff 2 1.5% 12 9.2% 22 16.8% 35 26.7% 35 26.7% 6 4.6% 2 1.5% 17 13.0% 131Non-
Academic Hourly 3 0.9% 19 6.0% 60 18.9% 106 33.3% 109 34.3% 2 0.6% 0 0.0% 19 6.0% 318
Teaching Faculty 2 0.3% 47 7.0% 62 9.2% 427 63.8% 68 10.2% 1 0.2% 1 0.2% 61 9.1% 669
Contract 0 0.0% 15 10.3% 18 12.3% 77 52.8% 18 12.3% 0 0.0% 0 0.0% 18 12.3% 146
Adjunct 2 0.4% 32 6.1% 44 8.4% 350 66.9% 50 9.6% 1 0.2% 1 0.2% 43 8.2% 523Counseling
Faculty 0 0.0% 4 8.5% 11 23.4% 10 21.3% 11 23.4% 1 2.1% 1 2.1% 9 19.2% 47y % % % % % % % % Contract 0 0.0% 1 4.4% 5 21.7% 6 26.1% 5 21.7% 0 0.0% 1 4.4% 5 21.7% 23
Adjunct 0 0.0% 3 12.5% 6 25.0% 4 16.7% 6 25.0% 1 4.1% 0 0.0% 4 16.7% 24 Library Faculty 0 0.0% 2 20.0% 1 10.0% 5 50.0% 1 10.0% 0 0.0% 0 0.0% 1 10.0% 10
Contract 0 0.0% 1 20.0% 0 0.0% 2 40.0% 1 20.0% 0 0.0% 0 0.0% 1 20.0% 5
Adjunct 0 0.0% 1 20.0% 1 20.0% 3 60.0% 0 0.0% 0 0.0% 0 0.0% 0 0.0% 5j Police
Officers 0 0.0% 1 9.1% 2 18.2% 4 36.3% 2 18.2% 1 9.1% 0 0.0% 1 9.1% 11 Community
Service Officers 0 0.0% 0 0.0% 2 33.3% 2 33.3% 1 16.7% 0 0.0% 0 0.0% 1 16.7% 6
Management 0 0.0% 0 0.0% 2 14.2% 4 28.6% 4 28.6% 0 0.0% 0 0.0% 4 28.6% 14 S i Supervisory
Staff 0 0.0% 1 5.3% 6 31.5% 8 42.1% 2 10.5% 1 5.3% 0 0.0% 1 5.3% 19
Note: Due to missing data, the gender of 5 employees and the job status of 54 employees are unknown. Those individuals are represented in the total number of employees, but they do not appear in the table or percentages above.
12
City College
Definition of Terms
l d l d d h f d d f d d l ll dAnnual Unduplicated Headcount: This information is not provided for individual colleges dueto the high level of cross-enrollment from term to term (i.e., students whose primary college ofenrollment changes from term to term).
Headcount by Term (Unduplicated within Terms): This is based on students actively enrolledin a specific term (Summer, Fall, Winter, or Spring terms). This headcount includes both creditand noncredit students. A student is counted only once in each term in which the student isactively enrolled. However, if the student is enrolled in more than one term during the periodbeing discussed, the student will be counted for each term.
Example: A student enrolled in Fall 2006 and Spring 2007. For the Annual UnduplicatedHeadcount, the student will be counted once. For the Student Headcount by Term, the studentwill be counted once in each term.
Full-Time Equivalent Students (FTES): FTES is the major student workload measure, one ofseveral, used in determining the eligibility for state funding of community colleges. The FTESdoes not reflect “headcount enrollment”. It is the equivalent of 525 hours of student instructionper each FTES FTES is derived by considering that one student could be enrolled in courses forper each FTES. FTES is derived by considering that one student could be enrolled in courses for3 hours a day, 5 days a week, for an academic year of 35 weeks- a total of 525 hours per one FTES.
13

14

www.sdmesa.edu 7250 Mesa College Drive, San Diego, CA 92111 (619)388-2600
Mesa College
Facts on File: 2007-2008 Edition
College President: Rita Cepeda, Ed. D. College Terms:Fall: August 27, 2007- December 19, 2007Intersession: January 2, 2008- January 26, 2008Spring: January 28, 2008- May 24, 2008Summer: June 2, 2008- August 9, 2008
Description:
Among the largest community colleges in California and the nation, San Diego Mesa College is a fullyaccredited, two-year college offering 160 Associate Degree and certificate programs. The college’sexcellent academic and career preparation programs cover a wide range of disciplines, making Mesa animportant economic development catalyst and the number one transfer institution in San Diego.
Mesa’s premier programs include seven courses of study in allied health fields, fashion design,architecture, multimedia, hospitality and event management, animal health technology, American SignLanguage, and interior design. Situated on a sprawling, 104-acre suburban campus in the geographiccenter of San Diego, the college is renowned for its small classes, outstanding faculty, and reputation forquality.
/ d l d f hMajor Construction Projects/Improvements Underway or Planned for the Year:
1) Mesa College Drive East Entry Road Realignment, Parking Structure and Police Sub-station 2)Temporary Parking at Football Stadium-Prepare site for temporary parking during the construction of
item one.
Student Information
Headcount by Term (Unduplicated within Terms)
Total 2006-2007 FTES (Resident Only): 14,189.52
This is a decrease of 2.6% (381.32) FTES from 2005-2006.
Summer 2006 11,115
Fall 2006 21,077
Spring 2007 21,178
15
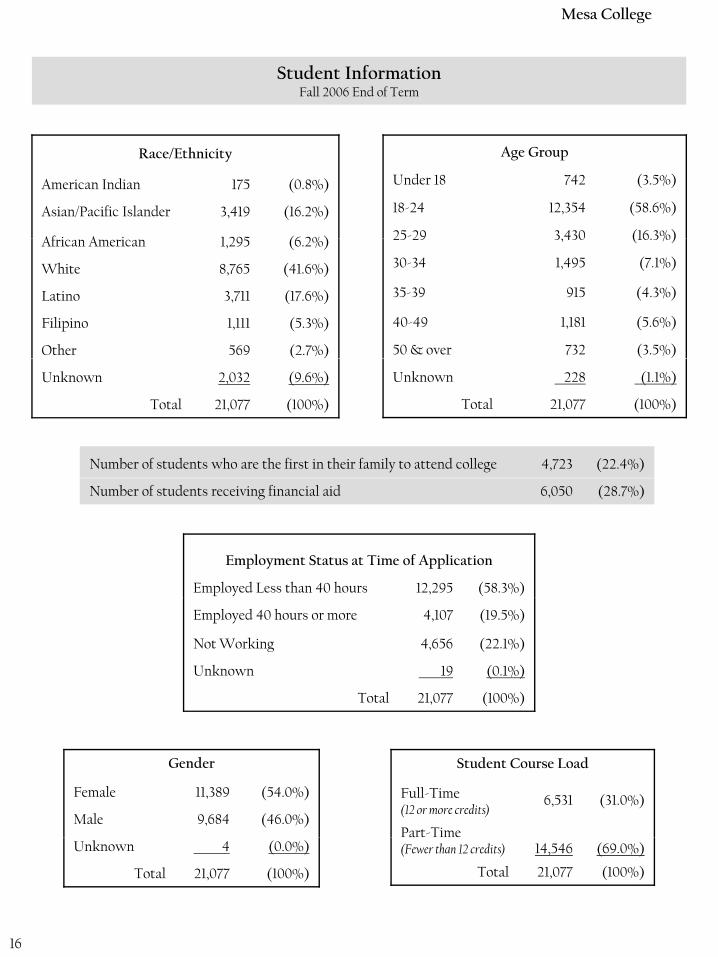
Student InformationFall 2006 End of Term
Mesa College
Age Group
Under 18 742 (3.5%)
18-24 12,354 (58.6%)
25-29 3,430 (16.3%)
Race/Ethnicity
American Indian 175 (0.8%)
Asian/Pacific Islander 3,419 (16.2%)
Af i A i 1 295 (6 2%) 25 29 3,430 (16.3%)
30-34 1,495 (7.1%)
35-39 915 (4.3%)
40-49 1,181 (5.6%)
50 & over 732 (3.5%)
African American 1,295 (6.2%)
White 8,765 (41.6%)
Latino 3,711 (17.6%)
Filipino 1,111 (5.3%)
Other 569 (2.7%)
Unknown 228 (1.1%)
Total 21,077 (100%)
Number of students who are the first in their family to attend college 4,723 (22.4%)
Unknown 2,032 (9.6%)
Total 21,077 (100%)
Employment Status at Time of Application
Employed Less than 40 hours 12,295 (58.3%)
Number of students receiving financial aid 6,050 (28.7%)
Employed 40 hours or more 4,107 (19.5%)
Not Working 4,656 (22.1%)
Unknown 19 (0.1%)
Total 21,077 (100%)
Student Course Load
Full-Time (12 or more credits)
6,531 (31.0%)
Part-Time
Gender
Female 11,389 (54.0%)
Male 9,684 (46.0%)a
(Fewer than 12 credits) 14,546 (69.0%)
Total 21,077 (100%)
Unknown 4 (0.0%)
Total 21,077 (100%)
16
d ll b
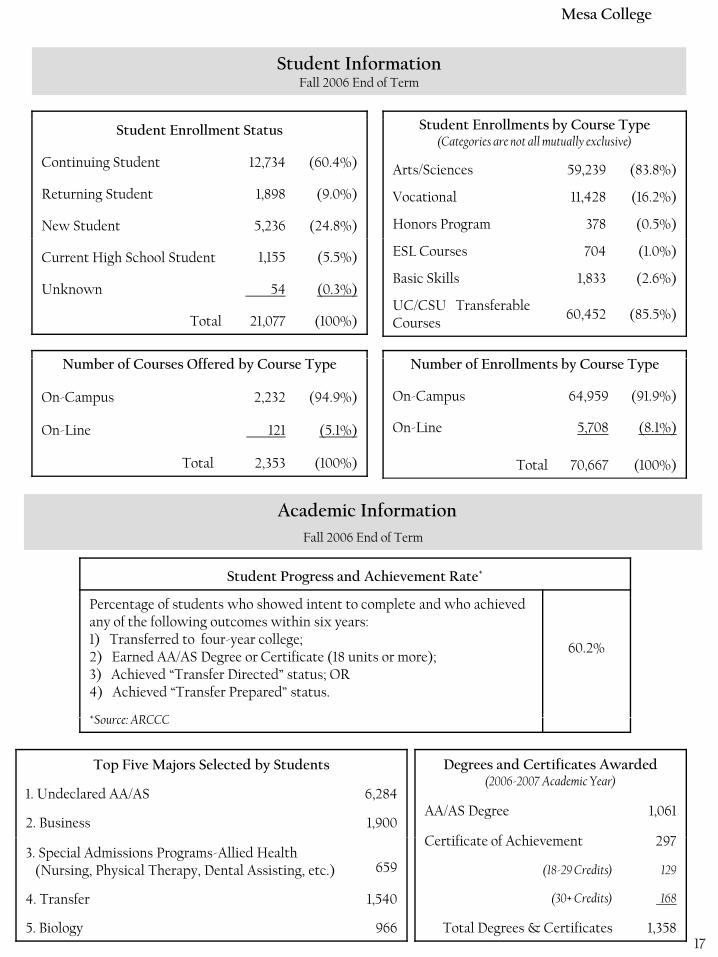
Student Information Fall 2006 End of Term
Mesa College
Student Enrollments by Course Type(Categories are not all mutually exclusive)
Arts/Sciences 59,239 (83.8%)
Vocational 11,428 (16.2%)
Honors Program 378 (0.5%)
Student Enrollment Status
Continuing Student 12,734 (60.4%)
Returning Student 1,898 (9.0%)
New Student 5,236 (24.8%)
b f ll b
ESL Courses 704 (1.0%)
Basic Skills 1,833 (2.6%)
UC/CSU Transferable Courses
60,452 (85.5%)
b f ff d b
Current High School Student 1,155 (5.5%)
Unknown 54 (0.3%)
Total 21,077 (100%)
Number of Enrollments by Course Type
On-Campus 64,959 (91.9%)
On-Line 5,708 (8.1%)
Total 70,667 (100%)
Number of Courses Offered by Course Type
On-Campus 2,232 (94.9%)
On-Line 121 (5.1%)
Total 2,353 (100%)
Academic InformationFall 2006 End of Term
Student Progress and Achievement Rate+
fPercentage of students who showed intent to complete and who achieved any of the following outcomes within six years: 1) Transferred to four-year college;2) Earned AA/AS Degree or Certificate (18 units or more);3) Achieved “Transfer Directed” status; OR4) Achieved “Transfer Prepared” status.
60.2%
+S ARCCC
Top Five Majors Selected by Students
1. Undeclared AA/AS 6,284
2. Business 1,900
+Source: ARCCC
Degrees and Certificates Awarded (2006-2007 Academic Year)
AA/AS Degree 1,061
C ifi f A hi 2973. Special Admissions Programs-Allied Health
(Nursing, Physical Therapy, Dental Assisting, etc.) 659
4. Transfer 1,540
5. Biology 966
Certificate of Achievement 297
(18-29 Credits) 129
(30+ Credits) 168
Total Degrees & Certificates 1,35817

Human ResourcesFiscal Year 2006-2007
Mesa College
Total Number of Employees
1,436
Gender
Female 54.5%
Male 45.5%
Job Status
Full-Time/Contract 33.6%
Hourly/Adjunct 66.4%
American
Indian Asian African
American White Latino Filipino Other Unknown Total N % N % N % N % N % N % N % N % N
Total Employees 8 0.6% 177 12.3% 103 7.2% 839 58.4% 177 12.3% 6 0.4% 4 0.3% 122 8.5% 1,436
Male 5 0.8% 63 9.6% 48 7.3% 395 60.5% 81 12.4% 1 0.2% 2 0.3% 58 8.9% 653
Female 3 0.4% 114 14.6% 55 7.0% 444 56.7% 96 12.3% 5 0.6% 2 0.2% 64 8.2% 783Classified
Staff 0 0.0% 17 9.9% 21 12.2% 85 49.4% 32 18.6% 3 1.7% 2 1.2% 12 7.0% 172Non-
Academic Hourly 2 0.9% 77 33.6% 16 7.0% 81 35.4% 25 10.9% 0 0.0% 0 0.0% 28 12.2% 229
T hi Teaching Faculty 5 0.6% 72 8.1% 47 5.3% 590 66.7% 96 10.9% 1 0.1% 2 0.2% 72 8.1% 885
Contract 2 0.9% 16 7.5% 13 6.1% 137 64.3% 24 11.3% 0 0.0% 1 0.5% 20 9.4% 213
Adjunct 3 0.4% 56 8.3% 34 5.1% 453 67.4% 72 10.7% 1 0.2% 1 0.2% 52 7.7% 672Counseling
Faculty 1 1.7% 8 13.5% 7 11.9% 26 44.1% 14 23.7% 1 1.7% 0 0.0% 2 3.4% 59 Contract 0 0.0% 4 12.9% 5 16.1% 13 42.0% 7 22.6% 1 3.2% 0 0.0% 1 3.2% 31
Adjunct 1 3.6% 4 14.3% 2 7.1% 13 46.4% 7 25.0% 0 0.0% 0 0.0% 1 3.6% 28 Library Faculty 0 0.0% 0 0.0% 1 7.7% 11 84.6% 0 0.0% 0 0.0% 0 0.0% 1 7.7% 13
Contract 0 0.0% 0 0.0% 1 11.1% 7 77.8% 0 0.0% 0 0.0% 0 0.0% 1 11.1% 9
Adjunct 0 0.0% 0 0.0% 0 0.0% 4 100.0% 0 0.0% 0 0.0% 0 0.0% 0 0.0% 4 Police
Officers 0 0.0% 0 0.0% 2 25.0% 5 62.5% 1 12.5% 0 0.0% 0 0.0% 0 0.0% 8 Community
Service Officers 0 0.0% 0 0.0% 1 20.0% 3 60.0% 1 20.0% 0 0.0% 0 0.0% 0 0.0% 5
Management 0 0.0% 0 0.0% 2 14.3% 6 42.9% 3 21.4% 0 0.0% 0 0.0% 3 21.4% 14 Supervisory
Note: Due to missing data, the job status of 30 employees is unknown. Those individuals are represented in the total number of employees, but they do not appear in the table or percentages above.
Supervisory Staff 0 0.0% 1 4.8% 4 19.0% 9 42.9% 4 19.0% 1 4.8% 0 0.0% 2 9.5% 21
18
Definition of Terms
Mesa College
l d l d d h f d d f d d l ll dAnnual Unduplicated Headcount: This information is not provided for individual colleges dueto the high level of cross-enrollment from term to term (i.e., students whose primary college ofenrollment changes from term to term).
Headcount by Term (Unduplicated within Terms): This is based on students actively enrolledin a specific term (Summer, Fall, Winter, or Spring terms). This headcount includes both creditand noncredit students. A student is counted only once in each term in which the student isactively enrolled. However, if the student is enrolled in more than one term during the periodbeing discussed, the student will be counted for each term.
Example: A student enrolled in Fall 2006 and Spring 2007. For the Annual UnduplicatedHeadcount, the student will be counted once. For the Student Headcount by Term, the studentwill be counted once in each term.
Full-Time Equivalent Students (FTES): FTES is the major student workload measure, one ofseveral, used in determining the eligibility for state funding of community colleges. The FTESdoes not reflect “headcount enrollment”. It is the equivalent of 525 hours of student instructionper each FTES FTES is derived by considering that one student could be enrolled in courses forper each FTES. FTES is derived by considering that one student could be enrolled in courses for3 hours a day, 5 days a week, for an academic year of 35 weeks- a total of 525 hours per one FTES.
19

20

www.sdmiramar.edu 10440 Black Mountain Road, San Diego, CA 92126 (858)536-7800
Miramar College
Facts on File: 2007-2008 Edition
College President: Patricia Hsieh, Ed. D. College Terms:Fall: August 27, 2007- December 19, 2007Intersession: January 2, 2008- January 26, 2008Spring: January 28, 2008- May 24, 2008Summer: June 2, 2008- August 9, 2008
Description:
San Diego Miramar College, located in the fast-growing Mira Mesa/Scripps Ranch suburban area of SanDiego along the I-15 corridor, offers 66 certificates, associate degrees, and comprehensive transferprograms to students transferring to UC, CSU and private institutions. Partnerships with local industryand the City and County of San Diego help San Diego Miramar College prepare students for high demandand well-paying careers in the highly competitive labor market including biotechnology aviationand well-paying careers in the highly competitive labor market, including biotechnology, aviation,automotive, diesel, and alternative fuels technologies. San Diego Miramar College is home to theSouthern California Biotechnology Center, Advanced Transportation and Energy Center, and San DiegoRegional Public Safety Institute. Since 1969, the college has provided training for nearly all lawenforcement officers and firefighters within San Diego County. The Institute also trains EMTs and offersthe only open water lifeguard degree program in the world.
M j C t ti P j t /I t d l d f th Major Construction Projects/Improvements underway or planned for the year:
1) Hourglass Park Fieldhouse- Joint use buildings with City of San Diego to house two gymnasiums,a dance studio, general purpose classrooms, a community room, and a fitness center.
2) Infrastructure- Installing underground utilities (water, sewer, electrical, etc.) in preparation for futureprojects.
3) Mailroom/Reprographics relocation- Remodel some areas of A Building to house the mailroom andhreprographics.
Student Information
Headcount by Term (Unduplicated within Terms)
Total 2006-2007 FTES (Resident Only): 7,038.75
This is an increase of 6.1% (402.51 FTES) from 2005-2006.
( p )
Summer 2006 5,897
Fall 2006 9,471
Spring 2007 11,618
21
Student InformationFall 2006 End of Term
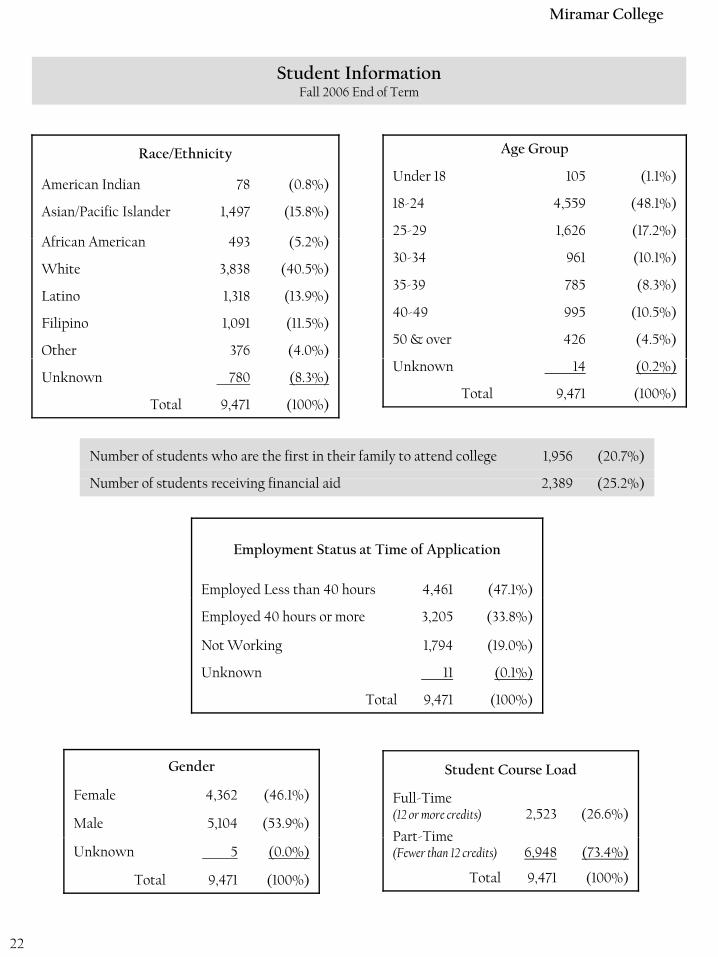
Miramar College
Age Group
Under 18 105 (1.1%)
18-24 4,559 (48.1%)
25-29 1,626 (17.2%)
Race/Ethnicity
American Indian 78 (0.8%)
Asian/Pacific Islander 1,497 (15.8%)
Af i A i 493 (5 2%)30-34 961 (10.1%)
35-39 785 (8.3%)
40-49 995 (10.5%)
50 & over 426 (4.5%)
African American 493 (5.2%)
White 3,838 (40.5%)
Latino 1,318 (13.9%)
Filipino 1,091 (11.5%)
Other 376 (4.0%)Unknown 14 (0.2%)
Total 9,471 (100%)
Number of students who are the first in their family to attend college 1,956 (20.7%)
N b f d f l d 2 389 (25 2%)
Unknown 780 (8.3%)
Total 9,471 (100%)
Employment Status at Time of Application
Employed Less than 40 hours 4,461 (47.1%)
Number of students receiving financial aid 2,389 (25.2%)
Employed 40 hours or more 3,205 (33.8%)
Not Working 1,794 (19.0%)
Unknown 11 (0.1%)
Total 9,471 (100%)
Student Course Load
Full-Time (12 or more credits) 2,523 (26.6%)
Part-Time
Gender
Female 4,362 (46.1%)
Male 5,104 (53.9%)Part-Time(Fewer than 12 credits) 6,948 (73.4%)
Total 9,471 (100%)
Unknown 5 (0.0%)
Total 9,471 (100%)
22

b f ll b
Student InformationFall 2006 End of Term
Miramar College
Number of Enrollments by Course Type(Categories are not all mutually exclusive)
Arts/Sciences 19,727 (70.9%)
Vocational 8,101 (29.1%)
Honors Program 241 (0.9%)
Student Enrollment Status
Continuing Student 5,855 (61.8%)
Returning Student 1,383 (14.6%)
New Student 2,053 (21.7%)
b f ll b
ESL Courses 527 (1.9%)
Basic Skills 697 (2.5%)
UC/CSU Transferable Courses
21,688 (77.9%)
b f ff d b
Current High School Student 153 (1.6%)
Unknown 27 (0.3%)
Total 9,471 (100%)
Number of Enrollments by Course Type
On-Campus 23,794 (85.5%)
On-Line 4,034 (14.5%)
Total 27,828 (100%)
Number of Courses Offered by Course Type
On-Campus 834 (89.6%)
On-Line 97 (10.4%)
Total 931 (100%)
Academic InformationFall 2006 End of Term
Student Progress and Achievement Rate+
fPercentage of students who showed intent to complete and who achieved any of the following outcomes within six years: 1) Transferred to four-year college;2) Earned AA/AS Degree or Certificate (18 units or more);3) Achieved “Transfer Directed” status; OR4) Achieved “Transfer Prepared” status.
55.6%
+S ARCCC
Top Five Majors Selected by Students
1. Undeclared AA/AS 2,442
2. Transfer 1,238
+Source: ARCCC
Degrees and Certificates Awarded (2006-2007 Academic Year)
AA/AS Degree 470
Certificate of Achievement 3443. Administration of Justice 770
4. Business 476
5. Fire Protection Technology 448
Certificate of Achievement 344
(18-29 Credits) 230
(30+ Credits) 114
Total Degrees & Certificates 814
23
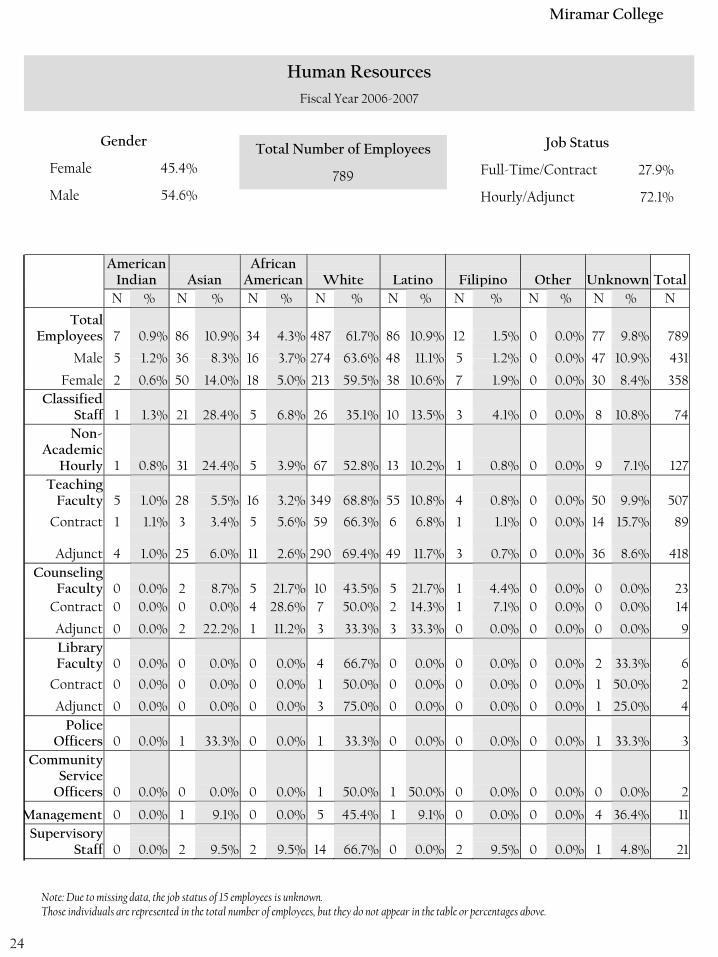
Human ResourcesFiscal Year 2006-2007
Miramar College
Total Number of Employees
789
Gender
Female 45.4%
Male 54.6%
Job Status
Full-Time/Contract 27.9%
Hourly/Adjunct 72.1%
American Indian Asian
African American White Latino Filipino Other Unknown Total
N % N % N % N % N % N % N % N % N
Total Employees 7 0.9% 86 10.9% 34 4.3% 487 61.7% 86 10.9% 12 1.5% 0 0.0% 77 9.8% 789
Male 5 1 2% 36 8 3% 16 3 7% 274 63 6% 48 11 1% 5 1 2% 0 0 0% 47 10 9% 431 Male 5 1.2% 36 8.3% 16 3.7% 274 63.6% 48 11.1% 5 1.2% 0 0.0% 47 10.9% 431
Female 2 0.6% 50 14.0% 18 5.0% 213 59.5% 38 10.6% 7 1.9% 0 0.0% 30 8.4% 358Classified
Staff 1 1.3% 21 28.4% 5 6.8% 26 35.1% 10 13.5% 3 4.1% 0 0.0% 8 10.8% 74Non-
Academic Hourly 1 0.8% 31 24.4% 5 3.9% 67 52.8% 13 10.2% 1 0.8% 0 0.0% 9 7.1% 127
Teaching Faculty 5 1.0% 28 5.5% 16 3.2% 349 68.8% 55 10.8% 4 0.8% 0 0.0% 50 9.9% 507
Contract 1 1.1% 3 3.4% 5 5.6% 59 66.3% 6 6.8% 1 1.1% 0 0.0% 14 15.7% 89
Adjunct 4 1.0% 25 6.0% 11 2.6% 290 69.4% 49 11.7% 3 0.7% 0 0.0% 36 8.6% 418Counseling
Faculty 0 0.0% 2 8.7% 5 21.7% 10 43.5% 5 21.7% 1 4.4% 0 0.0% 0 0.0% 23 Contract 0 0.0% 0 0.0% 4 28.6% 7 50.0% 2 14.3% 1 7.1% 0 0.0% 0 0.0% 14
Adjunct 0 0.0% 2 22.2% 1 11.2% 3 33.3% 3 33.3% 0 0.0% 0 0.0% 0 0.0% 9 Library Faculty 0 0.0% 0 0.0% 0 0.0% 4 66.7% 0 0.0% 0 0.0% 0 0.0% 2 33.3% 6
Contract 0 0.0% 0 0.0% 0 0.0% 1 50.0% 0 0.0% 0 0.0% 0 0.0% 1 50.0% 2
Adjunct 0 0.0% 0 0.0% 0 0.0% 3 75.0% 0 0.0% 0 0.0% 0 0.0% 1 25.0% 4 Police
Officers 0 0.0% 1 33.3% 0 0.0% 1 33.3% 0 0.0% 0 0.0% 0 0.0% 1 33.3% 3 Community
Service Officers 0 0.0% 0 0.0% 0 0.0% 1 50.0% 1 50.0% 0 0.0% 0 0.0% 0 0.0% 2
Management 0 0.0% 1 9.1% 0 0.0% 5 45.4% 1 9.1% 0 0.0% 0 0.0% 4 36.4% 11 Supervisory Supervisory
Staff 0 0.0% 2 9.5% 2 9.5% 14 66.7% 0 0.0% 2 9.5% 0 0.0% 1 4.8% 21
Note: Due to missing data, the job status of 15 employees is unknown. Those individuals are represented in the total number of employees, but they do not appear in the table or percentages above.
24

Definition of Terms
Miramar College
l d l d d h f d d f d d l ll dAnnual Unduplicated Headcount: This information is not provided for individual colleges dueto the high level of cross-enrollment from term to term (i.e., students whose primary college ofenrollment changes from term to term).
Headcount by Term (Unduplicated within Terms): This is based on students actively enrolledin a specific term (Summer, Fall, Winter, or Spring terms). This headcount includes both creditand noncredit students. A student is counted only once in each term in which the student isactively enrolled. However, if the student is enrolled in more than one term during the periodbeing discussed, the student will be counted for each term.
Example: A student enrolled in Fall 2006 and Spring 2007. For the Annual UnduplicatedHeadcount, the student will be counted once. For the Student Headcount by Term, the studentwill be counted once in each term.
Full-Time Equivalent Students (FTES): FTES is the major student workload measure, one ofseveral, used in determining the eligibility for state funding of community colleges. The FTESdoes not reflect “headcount enrollment”. It is the equivalent of 525 hours of student instructionper each FTES FTES is derived by considering that one student could be enrolled in courses forper each FTES. FTES is derived by considering that one student could be enrolled in courses for3 hours a day, 5 days a week, for an academic year of 35 weeks- a total of 525 hours per one FTES.
25

26

www.sdce.edu 4343 Ocean View Blvd., San Diego, CA 92113 (619)388-4990
Continuing Education
Facts on File: 2007-2008 Edition
College President: Anthony E. Beebe, Ed. D. Continuing Education Terms:Fall: September 5, 2007- January 26, 2008Spring: January 27, 2008- June 7, 2008Summer: June 8, 2008- August 30, 2008
Description:
San Diego Continuing Education is one of the oldest and largest noncredit institutions in the nation. It isalso the only California community college continuing education entity separately accredited to the highstandard of the Western Association of Schools and Colleges. Continuing Education serves approximately100,000 students each year with more than 2,500 classes offered through 6 campuses and 300 communitysites and offers Certificates of Competencies, which enhance income and employment potential. Becauseof higher education system reimbursement, Continuing Education is able to offer classes free of charge tostudents.
Major Construction Projects/Improvements Underway or Planned for the Year:
1) ECC Skills Center- Building a series of buildings at ECC to expand the facility. 2) West City Center- Demolition and rebuilding of a new facility to house culinary arts, older adult ) y g y y ,
education, ESL, sewing, and other programs.3) North City Center- Remodeling a building to house computer programs and a distance learning hub.
Student Information
Total 2006-2007 FTES (Resident Only): 9,931.15
This is an increase of 2.8% (265.84 FTES) from 2005-2006.
Annual Unduplicated Headcount 2006-2007: 69,929
This is an increase of 7 0% (4 583 individuals) from 2005-2006
Headcount by Term (Unduplicated within Terms)
Summer 2006 24,826
F ll 2006 36 528
This is an increase of 7.0% (4,583 individuals) from 2005-2006.
FTES by Campus Location
Centre City/Skills 1,429.96
Cesar Chavez 709.57Fall 2006 36,528
Spring 2007 39,124
ECC 1,448.77
Mid-City 2,459.73
North City 2,095.59
West City 1,787.5327
d
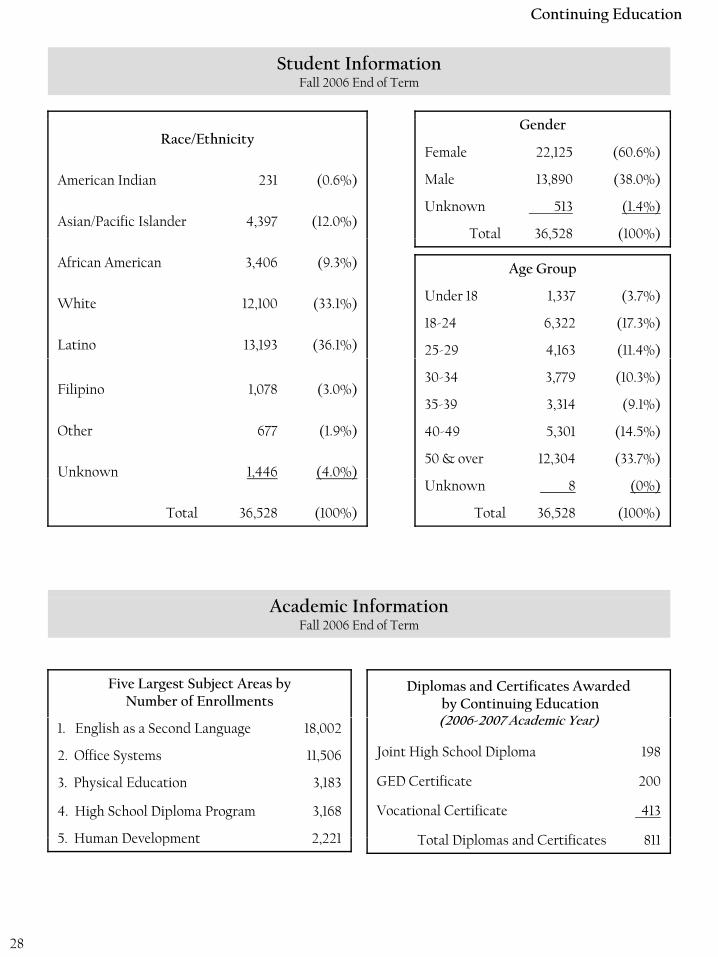
Student InformationFall 2006 End of Term
Continuing Education
Race/Ethnicity
American Indian 231 (0.6%)
Asian/Pacific Islander 4,397 (12.0%)
Gender
Female 22,125 (60.6%)
Male 13,890 (38.0%)
Unknown 513 (1.4%)
Total 36,528 (100%)
African American 3,406 (9.3%)
White 12,100 (33.1%)
Latino 13,193 (36.1%)
, ( %)
Age Group
Under 18 1,337 (3.7%)
18-24 6,322 (17.3%)
25-29 4,163 (11.4%)
Filipino 1,078 (3.0%)
Other 677 (1.9%)
Unknown 1,446 (4.0%)
30-34 3,779 (10.3%)
35-39 3,314 (9.1%)
40-49 5,301 (14.5%)
50 & over 12,304 (33.7%), ( )
Total 36,528 (100%)
Unknown 8 (0%)
Total 36,528 (100%)
Five Largest Subject Areas by Number of Enrollments
Diplomas and Certificates Awardedby Continuing Education(2006 2007 A d i Y )
Academic InformationFall 2006 End of Term
1. English as a Second Language 18,002
2. Office Systems 11,506
3. Physical Education 3,183
4. High School Diploma Program 3,168
5 Human Development 2 221
(2006-2007 Academic Year)
Joint High School Diploma 198
GED Certificate 200
Vocational Certificate 413
T t l Di l d C tifi t 8115. Human Development 2,221
28
Total Diplomas and Certificates 811
Non-Credit to Credit Migration
Continuing Education
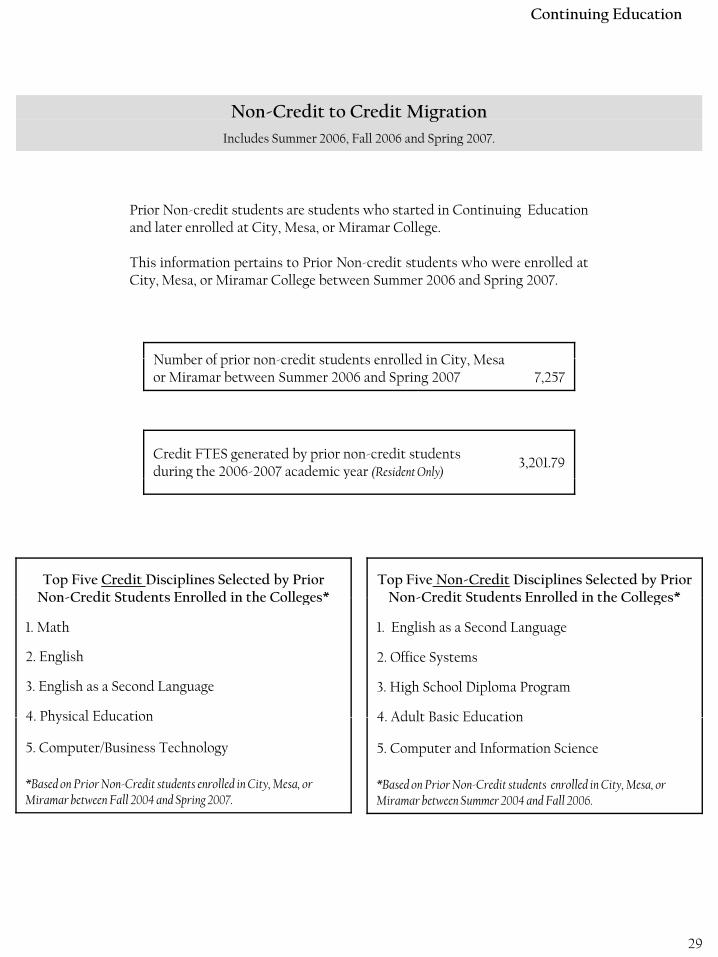
gIncludes Summer 2006, Fall 2006 and Spring 2007.
Prior Non-credit students are students who started in Continuing Educationand later enrolled at City, Mesa, or Miramar College.
This information pertains to Prior Non-credit students who were enrolled atCity, Mesa, or Miramar College between Summer 2006 and Spring 2007.
Number of prior non credit students enrolled in City Mesa Number of prior non-credit students enrolled in City, Mesa or Miramar between Summer 2006 and Spring 2007 7,257
Credit FTES generated by prior non-credit students during the 2006-2007 academic year (Resident Only)
3,201.79g y ( y)
Top Five Credit Disciplines Selected by Prior Non-Credit Students Enrolled in the Colleges*
Top Five Non-Credit Disciplines Selected by Prior Non-Credit Students Enrolled in the Colleges*Non-Credit Students Enrolled in the Colleges
1. Math
2. English
3. English as a Second Language
4 Physical Education
Non-Credit Students Enrolled in the Colleges
1. English as a Second Language
2. Office Systems
3. High School Diploma Program
4 Adult Basic Education4. Physical Education
5. Computer/Business Technology
*Based on Prior Non-Credit students enrolled in City, Mesa, or Miramar between Fall 2004 and Spring 2007.
4. Adult Basic Education
5. Computer and Information Science
*Based on Prior Non-Credit students enrolled in City, Mesa, or Miramar between Summer 2004 and Fall 2006.
29

Continuing Education
Human ResourcesFiscal Year 2006-2007
Gender
Female 70.6%
Male 29.4%
Job Status
Full-Time/Contract 31.6%
Hourly/Adjunct 68.4%
Total Number of Employees
835
American
Indian Asian African
American White Latino Filipino Other Unknown Total N % N % N % N % N % N % N % N % N
Total Employees 5 0.6% 55 6.6% 77 9.2% 487 58.4% 147 17.6% 4 0.5% 2 0.2% 57 6.9% 834
Male 0 0.0% 16 6.5% 24 9.8% 135 55.1% 48 19.6% 2 0.8% 1 0.4% 19 7.8% 245
Female 5 0.8% 39 6.6% 53 9.0% 352 59.8% 99 16.8% 2 0.3% 1 0.2% 38 6.5% 589Classified
Staff 0 0.0% 13 11.2% 20 17.2% 35 30.2% 34 29.3% 1 0.9% 0 0.0% 13 11.2% 116Non-
Academic Hourly 1 1.6% 6 9.5% 10 15.9% 19 30.2% 23 36.5% 0 0.0% 0 0.0% 4 6.3% 63
Teaching Faculty 2 0.3% 32 5.7% 36 6.4% 389 69.1% 69 12.3% 2 0.3% 1 0.2% 32 5.7% 563
Contract 0 0.0% 2 2.2% 5 5.4% 65 70.7% 12 13.0% 1 1.1% 0 0.0% 7 7.6% 92
Adjunct 2 0 4% 30 6 4% 31 6 6% 324 68 8% 57 12 1% 1 0 2% 1 0 2% 25 5 3% 471 Adjunct 2 0.4% 30 6.4% 31 6.6% 324 68.8% 57 12.1% 1 0.2% 1 0.2% 25 5.3% 471Counseling
Faculty 1 2.6% 1 2.6% 4 10.2% 16 41.1% 13 33.3% 0 0.0% 0 0.0% 4 10.2% 39 Contract 1 5.6% 1 5.6% 1 5.6% 9 50.0% 6 33.2% 0 0.0% 0 0.0% 0 0.0% 18
Adjunct 0 0.0% 0 0.0% 3 14.3% 7 33.3% 7 33.3% 0 0.0% 0 0.0% 4 19.1% 21 Police
Officers 0 0 0% 1 50 0% 0 0 0% 1 50 0% 0 0 0% 0 0 0% 0 0 0% 0 0 0% 2Officers 0 0.0% 1 50.0% 0 0.0% 1 50.0% 0 0.0% 0 0.0% 0 0.0% 0 0.0% 2 Community
Service Officers 0 0.0% 0 0.0% 0 0.0% 0 0.0% 0 0.0% 1 50.0% 1 50.0% 0 0.0% 2
Management 1 6.7% 0 0.0% 2 13.4% 5 33.3% 5 33.3% 0 0.0% 0 0.0% 2 13.3% 15 Supervisory
Staff 0 0.0% 0 0.0% 1 9.1% 8 72.7% 1 9.1% 0 0.0% 0 0.0% 1 9.1% 11
Note: Due to missing data, the gender of 1 employee and the job status of 24 employees are unknown.
Those individuals are represented in the total number of employees, but they do not appear in table or percentages above.
30

Definition of Terms
Continuing Education
l d l d d h b d d l ll d llAnnual Unduplicated Headcount: This is based on students actively enrolled in Summer, Fall,Winter, and/or Spring terms. A student enrolled in multiple terms is counted only once for theyear (i.e., not counted separately for each term).
Headcount by Term (Unduplicated within Terms): This is based on students actively enrolledin a specific term (Summer, Fall, Winter, or Spring terms). This headcount includes both creditand noncredit students. A student is counted only once in each term in which the student isactively enrolled. However, if the student is enrolled in more than one term during the periodbeing discussed, the student will be counted for each term.
Example: A student enrolled in Fall 2006 and Spring 2007. For the Annual UnduplicatedHeadcount, the student will be counted once. For the Student Headcount by Term, the studentwill be counted once in each term.
Full-Time Equivalent Students (FTES): FTES is the major student workload measure, one ofseveral, used in determining the eligibility for state funding of community colleges. The FTESdoes not reflect “headcount enrollment”. It is the equivalent of 525 hours of student instructionper each FTES FTES is derived by considering that one student could be enrolled in courses forper each FTES. FTES is derived by considering that one student could be enrolled in courses for3 hours a day, 5 days a week, for an academic year of 35 weeks- a total of 525 hours per one FTES.
31

08/15/07