Embed Size (px)
Citation preview

Facts about Stockholm’s tourism industryStatistics for 2016

Content
Where visitors come from
How visitors travel to Stockholm
Where visitors stay
Length of stay
Why people travel to Stockholm
International meetings and conventions
Major attractions in Stockholm
How much visitors spend
Cover page photo: Henrik Trygg

Where Visitors Come From
Stockholm is at the center of the tourism industry with close to
13.5 million overnight stays in commercial establishments in
2016. Three out of ten foreign visitors to Sweden choose to
locate their nights here.

Steady Growth for Swedish and Foreign Visitors
Swedish and foreign commercial overnight stays at
hotels, hostels and vacation villages,
Stockholm County 2016
Source: Swedish Agency for Economic and Regional Growth / Statistics Sweden
Swedish and foreign commercial overnight stays at hotels,
hostels and vacation villages in Stockholm County.
2003-2016 (Index 100=2003)
A large part of all commercial overnight stays in Stockholm
County can be accounted for by domestic demand, but the
foreign demand has had a stronger increase. Most foreign
visitors come from European countries.
In 2016 compared to 2015 guest nights from domestic visitors
increased by 3 per cent and by 4 per cent from foreign
visitors.
100
110
120
130
140
150
160
170
180
190
200
210
220
2003 2004 2005 2006 2007 2008 2009 2010 2011 2012 2013 2014 2015 2016
Swedish visitors Foreign visitors Total
64%5%
16%
14% Swedish visitors
Nordic countries (notincl. Sweden)
Europe excl. Nordiccountries
Non-European

In 2016 close to 13.5 million guest nights were made in all forms of
commercial accommodation in the Stockholm County, an increase of
almost 500,000 since 2015 and 3 million more than five years ago.
Stockholm County accounts for more than every fifth commercial
overnight stay in Sweden and 30 per cent of all foreign guest nights.
The fastest increase in recent years is generated by guests from non-
European countries.
Close to 13.5 Million Commercial Overnight Stays
All forms of commercial overnight stays by nationality 2016, Stockholm County
Source: Swedish Agency for Economic and Regional Growth / Statistics Sweden
2016 Distribution Share in
Sweden% change
since
2011
% change
since
2015
Total 13,438,009 100% 22% 29% 4%Sweden 8,708,632 65% 19% 25% 3%Totals from abroad 4,729,377 35% 30% 36% 4%Totals for Nordic countries (excl. Sweden) 687,204 5% 13% 17% -10%Totals for Europe excl. Nordic countries 2,230,989 17% 32% 19% 4%Totals for non-European 1,811,184 13% 53% 78% 12%
Germany 537,010 4% 18% 18% 2%Great Britain 441,557 3% 51% 50% 12%Norway 286,069 2% 8% 12% -8%Finland 219,775 2% 38% 27% 3%Denmark 167,530 1% 15% 9% -23%France 152,603 1% 51% 2% -3%Switzerland 137,522 1% 37% 42% 4%Italy 133,735 1% 54% -22% -1%The Netherlands 119,326 1% 18% 1% 0%Spain 117,211 1% 63% -1% 7%Poland 95,904 1% 31% 39% -16%Austria 58,764 0% 45% 14% -2%Belgium 58,449 0% 38% 9% 2%Russia 58,092 0% 45% -45% -25%Ireland 36,270 0% 69% 66% 49%Lithuania 33,668 0% 49% 165% 52%Turkey 33,492 0% 70% 153% 29%Estonia 19,498 0% 27% 28% 13%Romania 19,055 0% 46% 116% 2%
2016 Distribution Share in
Sweden% change
since
2011
% change
since
2015
Latvia 17,218 0% 42% 79% 27%Greece 15,010 0% 63% 2% -15%Chech Republic 14,895 0% 22% 31% -8%Iceland 13,830 0% 53% 82% -33%Portugal 12,948 0% 43% -1% -22%Hungary 12,842 0% 41% 30% 14%Ukraine 12,026 0% 58% 45% 49%The rest of Europe 93,894 1% 44% 84% 22%
USA 367,897 3% 67% 40% 6%Canada 37,855 0% 65% 18% 0%
Brazil 25,296 0% 63% 31% -19%The rest of Central & South America 34,337 0% 63% 26% 5%
India 103,389 1% 59% 167% -19%China 117,476 1% 36% 74% 34%Japan 56,948 0% 61% 1% 6%South Korea 17,719 0% 32% 53% 21%The rest of Asia 144,501 1% 63% 10% 9%
Australia 50,528 0% 65% 54% 5%New Zealand 6,028 0% 62% 100% 17%
The rest of the world 236,801 0% 3% 268% 36%Not indicated 612,409 5% 49% 87% 15%

Germany is the dominant foreign market in
Stockholm, followed by Great Britain, the US
and Norway. Most major nationalities among
the visitors to Stockholm are European. 19 of
the 25 countries with the highest number of
guest nights are European.
Visitors from the United States account for 80
per cent of all overnight stays from North and
South America. Brazil, however, increases in
importance.
In Asia, two target groups are fairly equal in
number of guest nights – India and China.
India is the market in Asia that has developed
the most in recent years, especially between
2011 and 2015. Japan has lost market share
in a longer perspective.
Foreign Visitors
All forms of commercial overnight stays by nationality 2016, Stockholm County (in thousands)
Source: Swedish Agency for Economic
and Regional Growth / Statistics Sweden
537442
286220
168153
138134
119117
96595858
363433
191917151514
132368
382534
103117
5718
14551
6237
612
0 100 200 300 400 500 600 700
GermanyGreat Britain
NorwayFinland
DenmarkFrance
SwitzerlandItaly
NetherlandsSpain
PolandAustria
BelgiumRussia
IrelandLithuania
TurkeyEstonia
RomaniaLatvia
GreeceCzech Republic
IcelandThe rest of Europe
USACanada
BrazilThe rest of Central & South America
IndiaChinaJapan
South KoreaThe rest of Asia
AustraliaNew Zeeland
The rest of the worldNot indicated

The Nordic Countries
All forms of commercial overnight stays in Stockholm County 2008-2016.
Nordic markets (Index 100=2008)
Source: Swedish Agency for Economic and Regional Growth / Statistics Sweden
Norwegian, Finnish and Danish visitors belong to the
ten major foreign target groups in Stockholm.
For all target groups in Scandinavia, with the exception
of Finland, the sharp increase between 2014 and 2015
has been followed by a decline
0
50
100
150
200
250
2008 2009 2010 2011 2012 2013 2014 2015 2016
Norway
Finland
Iceland
Denmark

The European Markets
All forms of commercial overnight stays in Stockholm County 2008-2016. Major European markets (Index 100=2008)
Source: Swedish Agency for Economic and Regional Growth / Statistics Sweden
European markets with the most positive trend in the past years are
Belgium, Austria, Poland and Switzerland. The Polish market
fluctuates significantly over the years
0
50
100
150
200
250
300
350
2008 2009 2010 2011 2012 2013 2014 2015 2016
PolandAustriaBelgiumThe netherlandsSpainRest of Europe
0
50
100
150
200
250
300
350
2008 2009 2010 2011 2012 2013 2014 2015 2016
SwitzerlandRussiaFranceGermanyGreat BritainItaly
*The rest of Europe contain commercial overnight stays for all European countries not individually specified in the graphs above.
Markets that have had a less favorable trend are mainly Russia, but
a decline is noted for Italy as well, while the Spanish market to a
large extent has recovered since 2013.

The United States is the third largest foreign target
group in Stockholm. Due to the financial crises, the
number of visitors from the USA and Canada
decreased in 2009. Since 2009 the number of
overnight stays have increased again, in particular
for visitors from USA.
Guest nights by visitors from Brazil did increase at a
rapid pace until 2013, but have since decreased.
Other countries increase their share of all guest
nights from the American continent.
North and South America
All forms of commercial overnight stays in Stockholm County 2008-2016.
North and South America (Index 100=2008)
Source: Swedish Agency for Economic and Regional Growth / Statistics Sweden
0
50
100
150
200
250
300
350
400
2008 2009 2010 2011 2012 2013 2 014 2 015 2 016
Brazil
Canada
USA
Rest of North and South America
*The rest of North and South America contain commercial overnight stays for all North and South American countries not individually specified in the graphs above.

With the exception of Japan, the development for
visitors from Asia have been very positive.
Since 2010 the number of overnight stays from
visitors from India have increased significantly.
However in the last year we have seen a decline to
the level of 2014.
Guest nights from visitors from China have risen
steadily year by year, with the exception of 2014.
Since 2014, the number of guest nights has risen by
almost 50 percent
The Asian Markets
All forms of commercial overnight stays in Stockholm County 2008-2016.
Asian markets (Index 100=2008)
Source: Swedish Agency for Economic and Regional Growth / Statistics Sweden
0
50
100
150
200
250
300
350
400
450
500
2008 2009 2010 2011 2012 2013 2014 2015 2016
India
China
Japan
South Korea
Rest of Asia
*The rest of Asia contain commercial overnight stays for all Asian countries not individually specified in the graphs above.

Australia and New Zealand were among the
countries that were affected negatively in 2009 but
since 2010 the number of overnight stays have
increased at a steady pace.
Australia, New Zealand and the rest of the world
All forms of commercial overnight stays in Stockholm County 2008-2016.
Australia, New Zealand and the rest of the world (Index 100=2008)
Source: Swedish Agency for Economic and Regional Growth / Statistics Sweden
0
50
100
150
200
250
300
350
400
450
2008 2009 2010 2011 2012 2013 2014 2015 2016
Australia
New Zeeland
Rest of the world
Not indicated
*The rest of the world contain commercial overnight stays for countries not assigned to a specific continent, Africa in total and the rest of Oceania.
How Visitors Travel to Stockholm
Stockholm is the natural center of Scandinavia. Every year
millions of visitors travel to Stockholm.
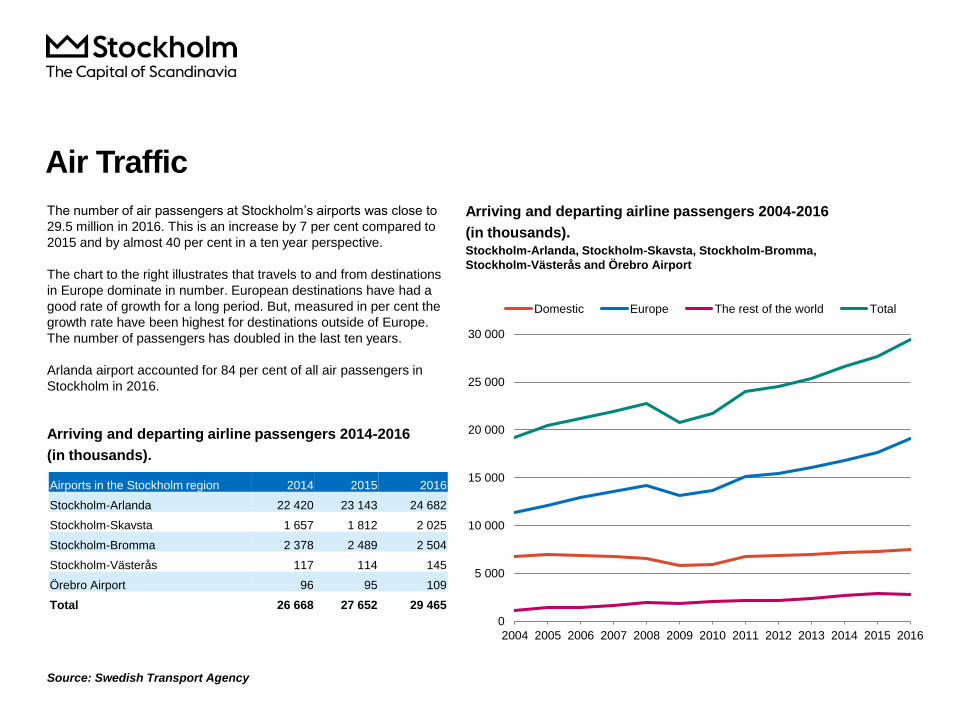
Air Traffic
Arriving and departing airline passengers 2014-2016
(in thousands).
Source: Swedish Transport Agency
Arriving and departing airline passengers 2004-2016
(in thousands).Stockholm-Arlanda, Stockholm-Skavsta, Stockholm-Bromma,
Stockholm-Västerås and Örebro Airport
The number of air passengers at Stockholm’s airports was close to
29.5 million in 2016. This is an increase by 7 per cent compared to
2015 and by almost 40 per cent in a ten year perspective.
The chart to the right illustrates that travels to and from destinations
in Europe dominate in number. European destinations have had a
good rate of growth for a long period. But, measured in per cent the
growth rate have been highest for destinations outside of Europe.
The number of passengers has doubled in the last ten years.
Arlanda airport accounted for 84 per cent of all air passengers in
Stockholm in 2016.
0
5 000
10 000
15 000
20 000
25 000
30 000
2004 2005 2006 2007 2008 2009 2010 2011 2012 2013 2014 2015 2016
Domestic Europe The rest of the world Total
Airports in the Stockholm region 2014 2015 2016
Stockholm-Arlanda 22 420 23 143 24 682
Stockholm-Skavsta 1 657 1 812 2 025
Stockholm-Bromma 2 378 2 489 2 504
Stockholm-Västerås 117 114 145
Örebro Airport 96 95 109
Total 26 668 27 652 29 465

More than 10 million ferry passengers were passing through the ports of Stockholm in 2016, a minor increase
compared to 2015. In a five year perspective the number of passengers have decreased by 7 per cent. In a ten year
perspective we find approximately the same volume as today.
Arriving and departing passengers from and to Finland dominate. Today three out of four trips have a destination in
Finland. Ten years ago, the proportion was nine out of ten. During the last year destinations in Poland and Russia has
become more important in terms of passenger volume.
Ferry Connections
Arriving and departing ferry passengers 2000, 2005 and 2010-2016. Stockholm port (in thousands)
*Cruise passengers are only counted once (arriving vessel), but in so-called turnarounds both arriving and departing passengers are included.
Source: Port of Stockholm
2000 2005 2010 2011 2012 2013 2014 2015 2016
Finland 8,042 8,829 8,446 8,286 8,089 7,819 7,581 7,635 7,584
Baltic countries 507 863 1,601 1,755 1,809 184 1,796 1,598 1,704
Poland 132 163 153 147 146 125 123 108 105
Russia n/a n/a n/a 137 170 187 151 119 154
Cruise visitors* 157 228 412 452 469 486 467 530 492
Total 8,838 10,083 10,612 10,777 10,683 10,458 10,118 9,990 10,039

Where Visitors Stay
More then 35 million overnight stays were made in various
forms of accommodation in Stockholm. Most nights was spent
at friends and relatives.

All type of Accommodation and Day tripsOvernight stays in all type of accommodations and day trips
2003, 2008, 2012-2016, Stockholm County (in thousands)
More than 35 million overnight stays were made in
various forms of accommodation in Stockholm County.
This is a new record for overnight stays in Stockholm.
Both overnight stays in commercial and non-commercial
forms of accommodation are increasing.
Close to 13.5 million overnight stays were registered in
commercial accommodations like hotels, hostels,
vacation villages and camping sites.
Two out of three commercial overnight stays in the
county are located in the city of Stockholm. In other
types of accommodation, the proportion is significantly
lower, just over one in three. But the percentage of
overnight stays that are being made in the city is
gradually growing.
The number of day trips (over 100 km) increased by just
over 3 per cent since 2015, but still does not reach the
level from 13 years ago.
Source: Resurs AB The data is based on tourist database
interviews for 2013 as well as updates based on existing statistics.
2003 2008 2012 2013 2014 2015 2016
City of
Stockholm
2016
Hotel 5,939 7,884 9,214 9,536 10,324 11,281 11,868 8,206
Vacation village 105 90 121 107 76 73 64 (n/a)
Camping 806 912 646 587 617 709 654 198
Hostel 470 716 771 745 784 856 800 667
Commercial
accommodation7,320 9,602 10,752 10,975 11,801 12,919 13,386 9,071
City of Stockholm's
share4,602 6,241 7,412 7,511 7,949 8,626 9,071
Weekend cottage 5,968 3,330 4,146 5,936 5,793 5,561 5,701 684
Friends and relatives 14,055 10,362 12,166 13,480 13,533 14,210 14,707 7,107
Pleasure boat 702 337 407 470 514 463 506 58
Other overnight stays 1,986 159 491 246 889 862 782 36
Other
accommodation22,711 14,704 17,210 20,132 20,729 21,096 21,696 7,885
City of Stockholm's
share6,825 4,551 4,896 6,566 7,585 7,608 7,885
Total overnight
stays30,031 24,182 27,962 31,107 32,530 34,015 35,082 16,956
City of Stockholm's
share11,427 10,792 12,308 14,077 15,534 16,234 16,956
Day trips 7,457 5,225 5,832 5,880 5,867 6,043 6,255 4,378
City of Stockholm's
share5,852 4,234 4,682 4,121 4,151 4,230 4,378

Commercial Accommodations
Overnight stays in all type of commercial accommodation 2016, Stockholm County
Source: Swedish Agency for Economic and Regional Growth / Statistics Sweden
Nine out of ten guest nights at commercial accommodations
in Stockholm County is made at hotels. The increase in
number of commercial guest nights compared to 2015 is
entirely due to a positive trend for hotels.
Hotels Hostels Vacation
villages
Camping Commercially
arranged private
apartments and
cottages
Total
Total 11,867,701 800,051 63,630 654,491 52,136 13,438,009
Sweden 7,705,569 430,608 58,942 505,937 7,576 8,708,632
Abroad 4,162,132 369,443 4,688 148,554 44,560 4,729,377
Nordic countries (not incl. Sweden) 631,911 31,017 832 20,487 2,957 687,204
Europe excl. Nordic countries 1,849,866 212,520 3,815 124,913 39,875 2,230,989
Rest of world (excl. Europe) 1,680,355 125,906 41 3,154 1,728 1,811,184
All other types of accommodation have decreased compared
with the previous year. For foreign visitors this trend is
somewhat different. Overnight stays are increasing in all
forms, except for camping

Commercial AccommodationsEuropean visitors. Commercial overnight stays in all type of accommodation 2016, Stockholm County
Source: Swedish Agency for Economic
and Regional Growth / Statistics Sweden
. . = Data not available
Visitors from Germany and the UK account
for more than one out of five foreign
commercial overnight stay in Stockholm
County. Most foreign guest nights at hotels
are made by visitors from Great Britain.
British guests are less frequent at hostels,
camping sites and private apartments and
cottages.
Visitors from Germany dominate among
foreign guests at hostels. Guests from France
and Poland relatively often choose to stay at
hostels.
Visitors from Germany accounts for close to
half of all overnight stays by foreign visitors at
camping sites in the county. Visitors from The
Netherlands frequently choose this form of
accommodation.
Hotels Hostels Vacation
villages
Camping Commercially
arranged private
apartments and
cottages
Total
Germany 381,981 54,715 668 69,507 30,139 537,010
Great Britain 412,568 22,861 1,061 4,335 732 441,557
Norway 263,348 11,173 243 10,817 488 286,069
Finland 202,972 11,367 439 4,969 28 219,775
Denmark 152,296 7,950 150 4,693 2,441 167,530
France 120,689 22,838 576 7,925 575 152,603
Switzerland 114,388 10,782 427 8,629 3,296 137,522
Italy 114,424 15,275 171 3,735 130 133,735
The Netherlands 91,798 10,410 514 14,553 2,051 119,326
Spain 103,783 12,678 199 432 119 117,211
Poland 76,269 17,678 99 1,300 558 95,904
Austria 51,855 5,203 1 494 1,211 58,764
Belgium 50,723 7,049 1 315 361 58,449
Russia 51,991 5,723 2 188 188 58,092
Ireland 34,844 1,199 . . 178 49 36,270
Litauania 31,908 1,198 5 557 . . 33,668
Turkey 29,941 3,547 . . 4 . . 33,492
Estonia 16,245 3,027 72 154 . . 19,498
Romania 15,309 3,713 . . 33 . . 19,055
Latvia 15,341 1,225 8 644 . . 17,218
Greece 13,886 1,124 . . - . . 15,010
Czech Republic 12,606 1,721 3 194 371 14,895
Iceland 13,295 527 . . 8 . . 13,830
Portugal 11,118 1,795 . . 35 . . 12,948
Hungary 9,715 3,085 . . 42 . . 12,842
Luxembourg 8,746 382 1 42 67 9,238
The rest of Europe 79,738 5,292 7 11,617 28 96,682

Visitors from the United States is by far the
largest Non-European market.
More than nine out of ten commercial
overnight stays by Non-European visitors are
made in hotels.
Commercial Accommodations
Non-European visitors. Commercial overnight stays in all type of
accommodation 2016, Stockholm County
Source: Swedish Agency for Economic and Regional Growth / Statistics Sweden
. . = Data not available
Hotels Hostels Vacation
villages
Camping Commercially
arranged private
apartments and
cottages
Total
USA 344,556 22,972 23 73 273 367,897
Canada 32,730 5,086 . . 39 . . 37,855
Brazil 22,886 2,410 . . . . . . 25,296
The rest of Central &
South Amerika 30,116 4,185 . . 36 . . 34,337
China 110,025 7,392 1 47 11 117,476
India 100,710 2,679 . . . . . . 103,389
Japan 53,885 3,063 . . . . . . 56,948
South Korea 13,777 3,940 . . 2 . . 17,719
The rest of Asia 138,360 6,076 . . 83 . . 144,519
Australia 41,956 8,484 1 83 4 50,528
New Zealand 4,895 1,133 . . . . . . 6,028
The rest of the world 185,968 46,688 . . 2,791 1,336 236,783
Not indicated 600,491 11,798 16 . . 104 612,409

Commercial Accommodations – Hotels
Capacity, occupancy and lodging revenues in hotels 2003-2016, Stockholm County
Source: Swedish Agency for Economic and Regional Growth / Statistics Sweden
The hotel capacity in Stockholm is
steadily increasing, both in terms of
number of hotels and in available
rooms. In 2016, there were 304 hotels
in Stockholm County, of which 154
were located in the City of Stockholm.
Hotel revenues for the rooms sold were
close to SEK 8.9 billion – an increase
of 10 per cent compared to 2015. More
than 70 per cent of revenues from
rooms sold came from hotels in the city
of Stockholm.
The hotel's revenues suffered from the
recession in 2009, but has since then
risen by almost 60 percent.
The occupancy rate has increased
noticeably over the last two years.0
1 000
2 000
3 000
4 000
5 000
6 000
7 000
8 000
9 000
0
5 000
10 000
15 000
20 000
25 000
30 000
35 000
2003 2004 2005 2006 2007 2008 2009 2010 2011 2012 2013 2014 2015 2016
Number
Room capacity per day Occupied room per day (oocupancy rate, %) Revenues, MSEK
53% 55% 58% 61% 63% 62% 59% 61% 61% 59% 59% 61% 65% 66%
MSEK

Commercial Accommodations – Hotels
Hotels. Key figures 2009-2016, Stockholm County and City of Stockholm
Source: Swedish Agency for Economic and Regional Growth / Statistics Sweden
On average, there were 32,100 hotel rooms available in the Stockholm County – an increase of 3 per cent compared to 2015 and
28 per cent since 2009.
The number of occupied rooms per day increased to 21,300. This is an increase of almost 5 per cent and equals an occupancy
rate of 66 per cent in Stockholm County. The occupancy rate is notably higher during the working week days than during the
weekend.
Stockholm County City of Stockholm
2009 2010 2011 2012 2013 2014 2015 2016 2009 2010 2011 2012 2013 2014 2015 2016
Number of hotels 263 285 293 297 298 301 301 304 132 139 148 149 148 150 149 154
Room capacity (in thousands)
per day25.0 26.1 27.7 29.2 30.0 30.9 31.2 32.1 15 16 17 18 18 19 19 20
Occupied rooms (in
thousands) per day14.7 16.0 16.9 17.3 17.8 18.8 20.3 21.3 10.4 11.1 11.8 12.2 12.4 12.9 13.7 14.4
Occupancy rate, % 59 61 61 59 59 61 65 66 67 69 68 66 67 65 72 73
Mon-Thurs, % 65 68 69 67 66 68 71 73 73 75 75 73 73 72 77 79
Fri-Sun, % 50 52 51 49 50 52 57 58 60 62 60 58 60 57 64 66
Revenues (MSEK) 5,582 6,327 6,877 6,847 7,014 7,341 8,035 8,867 4,060 4,538 4,957 4,981 5,079 5,151 5,754 6,394
Revenues per occupied
room, SEK1,040 1,085 1,112 1,086 1,082 1,070 1,084 1,143 1,071 1,117 1,148 1,116 1,122 1,095 1,147 1,215
Revenues per available
room, SEK611 663 679 642 641 651 706 757 722 775 783 739 755 749 824 890

Commercial Accommodations – Hotels
Capacity, occupancy and lodging revenues by month 2016, Stockholm County
Source: Swedish Agency for Economic and Regional Growth / Statistics Sweden
During August and September, the
utilization rate for hotels reaches its
peak. During May and September the
average price paid for a hotel room is at
it highest, along with revenues for the
hotels. During the holydays in July
prices are considerable lower, and so
are revenues.
-
100
200
300
400
500
600
700
800
900
1 000
1 100
1 200
0
5 000
10 000
15 000
20 000
25 000
30 000
35 000
40 000
Jan Feb Mar Apr May Jun Jul Aug Sep Oct Nov Dec
MSEKNumber
Room capacity per day Occupied rooms per day Revenues (MSEK)
51% 59% 56% 68% 71% 71% 71% 74% 77% 71% 68% 55%

2016 was a weak year for hostels in the
County of Stockholm. The increase in
capacity that we have seen over a number
of years was reversed during last year and
revenues dropped from SEK 289 million to
SEK 246 million.
On average there are 4,800 beds
available at hostels in the county.
Capacity, as well as the occupancy rate,
are highest during the summer months.
Over the entire year, 45 per cent of hostel
beds are occupied.
Commercial Accommodations – Hostels
Capacity, occupancy and lodging revenues in hostels 2003-2016, Stockholm County
Source: Swedish Agency for Economic and Regional Growth / Statistics Sweden
0
50
100
150
200
250
300
0
500
1 000
1 500
2 000
2 500
3 000
3 500
4 000
4 500
5 000
5 500
6 000
2003 2004 2005 2006 2007 2008 2009 2010 2011 2012 2013 2014 2015 2016
Number
Bed capacity per day Occupied beds per day Revenues (MSEK)
45% 42% 43% 43% 47% 52% 48% 47% 45% 45% 41% 42% 44% 45%
MSEK

Most vacation villages are located in the
Stockholm Archipelago and they almost
exclusively attract Swedish visitors.
The capacity, in terms of the average
number of available cottages per day, has
gradually decreased since 2013. The
capacity utilization have developed in the
same direction in the last year.
There has been a significant variation in
revenues during the last years. Revenues
for 2016 stopped at SEK 15.4 million.
Commercial Accommodations – Vacation Villages
Capacity, occupancy and lodging revenues in vacation villages 2003-2016,
Stockholm County
Source: Swedish Agency for Economic and Regional Growth / Statistics Sweden
0
5
10
15
20
25
0
50
100
150
200
250
2003 2004 2005 2006 2007 2008 2009 2010 2011 2012 2013 2014 2015 2016
MSEKNumber
Cottage capacity per day Occupied cottages per day Revenues (MSEK)
38% 38% 37% 34% 40% 45% 44% 48% 45% 40% 36% 38% 39% 35%

Length of stay
Visitors who stay overnight in Stockholm spend an average of
2.4 nights. Camping guests stay significantly longer, 4.0 nights
on average. Also visitors who stay in their own cottage or
pleasure boat during their visit in the Stockholm region stay
relatively longer, on average 3.6 and 4.1 nights respectively.
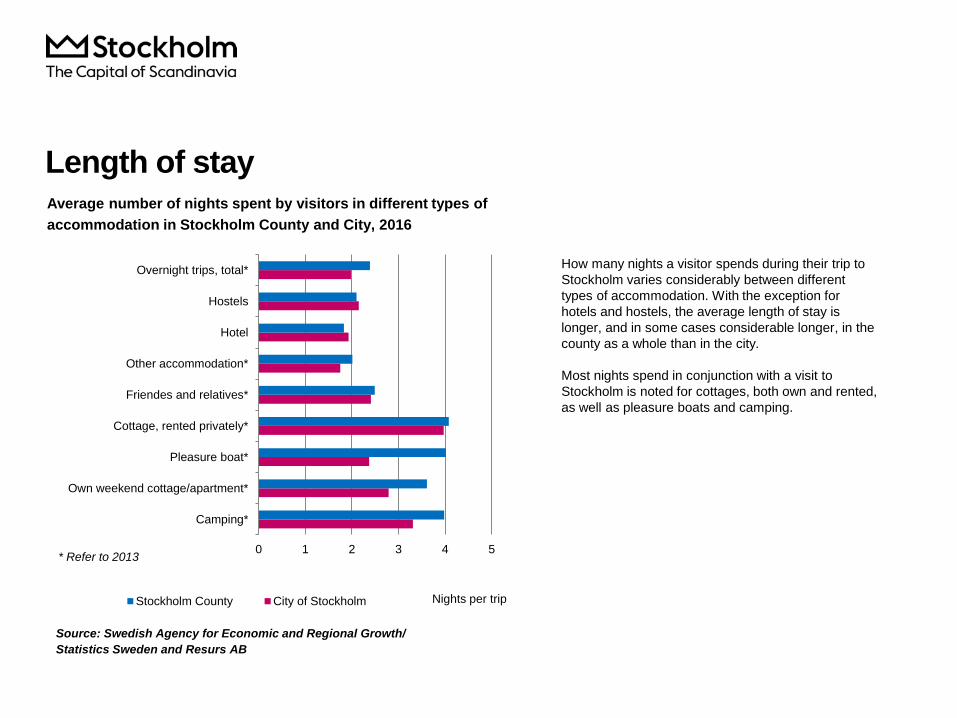
Length of stayAverage number of nights spent by visitors in different types of
accommodation in Stockholm County and City, 2016
Source: Swedish Agency for Economic and Regional Growth/
Statistics Sweden and Resurs AB
0 1 2 3 4 5
Camping*
Own weekend cottage/apartment*
Pleasure boat*
Cottage, rented privately*
Friendes and relatives*
Other accommodation*
Hotel
Hostels
Overnight trips, total*
Nights per tripStockholm County City of Stockholm
* Refer to 2013
How many nights a visitor spends during their trip to
Stockholm varies considerably between different
types of accommodation. With the exception for
hotels and hostels, the average length of stay is
longer, and in some cases considerable longer, in the
county as a whole than in the city.
Most nights spend in conjunction with a visit to
Stockholm is noted for cottages, both own and rented,
as well as pleasure boats and camping.

Length of stay – hotel, hostel and vacation villages
Source: Swedish Agency for Economic and Regional Growth/
Statistics Sweden
0,01,02,03,04,05,06,07,08,09,0
10,0
Domestic Foreign Total
County
0,0
0,5
1,0
1,5
2,0
2,5
3,0
Domestic Foreign Total Domestic Foreign Total
County City
2012
2013
2014
2015
2016
Average number of nights spent by visitors in hostels
in Stockholm County and City 2012-2016
Average number of nights spent by visitors in vacation
villages in Stockholm County 2012-2016Average number of nights spent by visitors in hotels
in Stockholm County and City 2012-2016
0,0
0,5
1,0
1,5
2,0
2,5
3,0
Domestic Foreign Total Domestic Foreign Total
County City
2012
2013
2014
2015
2016
Foreign visitors stay longer than domestic guests while visiting
Stockholm. This applies to both hotels, hostels and holiday
villages. For hotels, the result is stable year by year. Hotel
guests also have the shortest length of stay.
Hostels had a weaker year in 2016. This is also illustrated in
the average length of stay. In vacation villages guests stayed
longer than in hotels and hostels.

Length of stay 2016 – hotel, hostel and vacation villages
Source: Swedish Agency for Economic and Regional Growth/
Statistics Sweden
Average number of nights spent by visitors in hostels
in Stockholm County and City 2016
Average number of nights spent by visitors in vacation
villages in Stockholm County 2016Average number of nights spent by visitors in hotels
in Stockholm County and City 2016
1,7
2,2
1,81,8
2,21,9
0,0
0,5
1,0
1,5
2,0
2,5
3,0
Domestic Foreign Total
County
City
2,0
2,32,12,1
2,32,2
0,0
0,5
1,0
1,5
2,0
2,5
3,0
Domestic Foreign Total
County
City
3,4
1,8
3,2
0,0
0,5
1,0
1,5
2,0
2,5
3,0
3,5
4,0
Domestic Foreign Total
Why People Travel to Stockholm - Leisure and Business Visitors
Stockholm is home to a rich culture life and a great variety of
national and international events, restaurants and shopping
experiences. Stockholm is also Scandinavia’s leading city for
business, with many internationally competitive industries.

Leisure and Business Visitors
Overnight stays at hotels by business and leisure visitors 2003-2016,
Stockholm County and City (in thousands)
Source: Resurs AB The data is based on tourist database interviews for 2013 as well as updates based on existing statistics.
Stockholm is attractive both as a tourist
destination and as a city for business.
Together they create an exciting, dynamic and
progressive city that attracts millions of leisure
and business visitors every year.
The number of guest nights from leisure
visitors have increased significantly in recent
years. Also for business travelers, the number
of guest nights increases, but at a lower rate.
In the city, leisure travelers have been in
majority for a long time, since 2012 this is also
the case for the whole county.
0
1 000
2 000
3 000
4 000
5 000
6 000
7 000
8 000
2003 2004 2005 2006 2007 2008 2009 2010 2011 2012 2013 2014 2015 2016
Stockholm County, business Stockholm County, leisure
Stockholm City, business Stockholm City, leisure
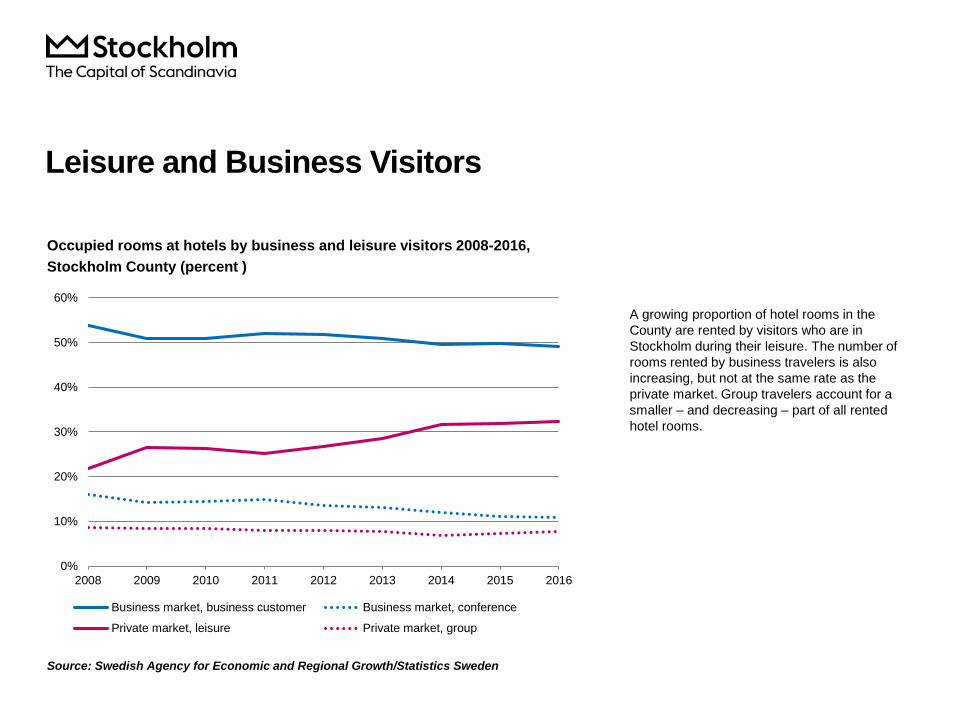
Leisure and Business Visitors
Occupied rooms at hotels by business and leisure visitors 2008-2016,
Stockholm County (percent )
Source: Swedish Agency for Economic and Regional Growth/Statistics Sweden
A growing proportion of hotel rooms in the
County are rented by visitors who are in
Stockholm during their leisure. The number of
rooms rented by business travelers is also
increasing, but not at the same rate as the
private market. Group travelers account for a
smaller – and decreasing – part of all rented
hotel rooms.
0%
10%
20%
30%
40%
50%
60%
2008 2009 2010 2011 2012 2013 2014 2015 2016
Business market, business customer Business market, conference
Private market, leisure Private market, group

International Meetings and Conventions
Stockholm is one of the world’s most popular international
convention destinations.
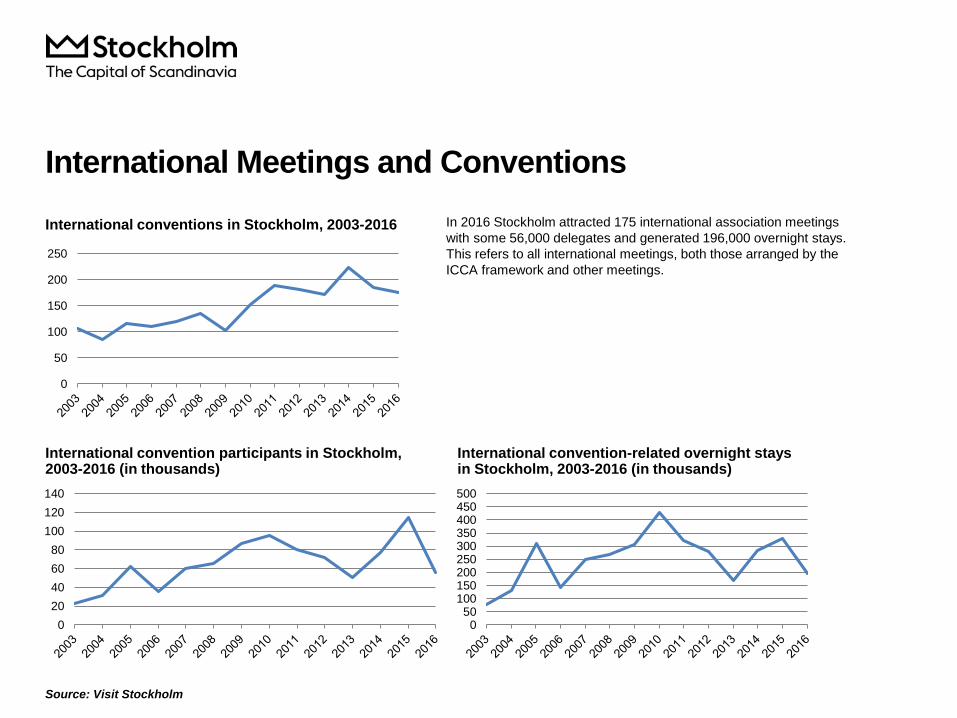
International Meetings and Conventions
International conventions in Stockholm, 2003-2016
Source: Visit Stockholm
International convention-related overnight stays in Stockholm, 2003-2016 (in thousands)
International convention participants in Stockholm, 2003-2016 (in thousands)
In 2016 Stockholm attracted 175 international association meetings
with some 56,000 delegates and generated 196,000 overnight stays.
This refers to all international meetings, both those arranged by the
ICCA framework and other meetings.
0
50
100
150
200
250
0
20
40
60
80
100
120
140
050
100150200250300350400450500

International Meetings and Conventions
Source: Visit Stockholm
International convention participants by subject area in Stockholm
The subject for the International Meetings and Conventions
have varied between the years. Medicine and psychology
accounted for a significantly larger proportion of participants in
2008 and 2011. Technology has gradually increased.27%
24%15%
8%
26%
2016 2015
33%
10%
4%4%
49%
2011 2008
55%
9%2%
12%
22%
58%
6%
7%
7%
22%
Medicine/Psychology
Technology/Statistics/Chemistry
National
and municipal
government
Industry/business
Other

International Meetings and ConventionsNumber of international conventions. Top 25 cities, 2014-2016
Source: International Congress and convention Association, ICCA
2016 2015 2014
Rank Meetings Rank Meetings Rank Meetings
Paris 1 196 2 186 1 214
Vienna 2 186 4 178 2 202
Barcelona 3 181 3 180 5 182
Berlin 4 176 1 195 4 193
London 5 153 5 171 6 166
Singapore 6 151 7 156 7 142
Amsterdam 7 144 12 120 8 133
Madrid 7 144 5 171 3 200
Lisbon 9 138 9 145 12 109
Seol 10 137 13 117 15 99
Prague 11 126 11 123 10 118
Bangkok 12 121 16 103 29 73
Dublin 13 118 18 95 24 83
Copenhagen 14 115 10 138 13 105
Bejing 15 113 19 95 14 104
Budapest 16 108 19 95 17 97
Buenos Aires 17 103 26 82 21 91
Stockholm 18 101 23 89 19 95
Hong Kong 19 99 15 112 16 98
Rome 20 96 17 99 17 97
Tokyo 21 95 28 80 22 90
Helsinki 22 92 33 71 23 84
Brussels 23 91 13 117 11 112
Taipei 24 83 22 90 20 92
Athens 25 79 24 87 27 80
Shanghai 25 79 ? ? 29 73
The statistics on this page is based on ICCA Statistics, i.e
meetings organized by international associations, with at
least 50 participants, which take place on a regular basis
and which rotate between a minimum of three
destinations.
Stockholm defends its position among the more significant
cities for meetings and conventions in the world. In 2016,
Stockholm climbed from 23rd to 18th globally, and from
17th to 13th in Europe, in the ICCA rankings measuring
international meetings. These are the city's best positions
for a number of years. Stockholm held 101 ICCA-approved
meetings in 2016, compared to 89 the year before.
Stockholm has now gone above cities such as Istanbul,
Brussels, Rome and Milan in the world rankings.

Major Attractions in Stockholm
There are a large number of events and exhibitions organized
every day, and they attract millions of visitors to Stockholm
every year.

Major Attractions in StockholmMajor attractions in Stockholm County, 2016
Source: Visit Stockholm
. . = Data not available
Events and exhibitions attract millions of visitors to
Stockholm. Together with the city’s various sights, regular
events create an attractive destination for both visitors and
Stockholmers alike.
Kulturhuset Stadsteatern keeps being the cultural attraction
with the most visitors. However, 2016 meant a decrease
compared with 2015.
The Vasa Museum and Skansen – the world's first open-air
museum – are the two museums that attract the most
visitors. But a number of other museums can be found high
on the list of popular attractions in Stockholm.
Rank Attraction Number of
visitors
(in
thousands)
Change
compared
to 2015
1 Kulturhuset Stadsteatern (Incl. Theatre in the Parks and
Theatre Skärholmen)
2,900 -9%
2 Stockholm Globe Arenas (incl. Skyview) 2,015 +1%
3 Gröna Lund 1,570 +5%
4 Skansen 1,369 -1%
5 Sightseeing, Stromma 1,352 -8%
6 The Vasa Museum 1,342 +2%
7 Eriksdalsbadet, Swimming Center 1,207 -2%
8 Redsightseeing,Touristry AB 1,116 . .
9 Stockholmsmässan 1,015 -8%
10 Friends Arena 900 . .
11 Swedish Museum of natural History (inkl Cosmonova) 718 +35%
12 Moderna Museet 652 +27%
13 Fotografiska 530 +74%
14 City Hall 458 +6%
15 The Royal Armoury 450 +4%
16 Casino Cosmopol 392 +67%
17 Solvalla 388 -7%
18 Royal Palace, The Royal Apartments 384 +47%
19 The Royal Chapel 360 +4%
20 The Museum of Mediterranean and near east antiquities 337 -11%
21 Junibacken 318 +41%
22 The Butterfly House Haga Ocean 305 -2%
23 Museum of Science and Technology 300 -13%
24 The Royal Opera 286 -13%
25 Historiska 279 -4%
How Much Visitors Spend
Tourism is of great importance for the economy in Stockholm.
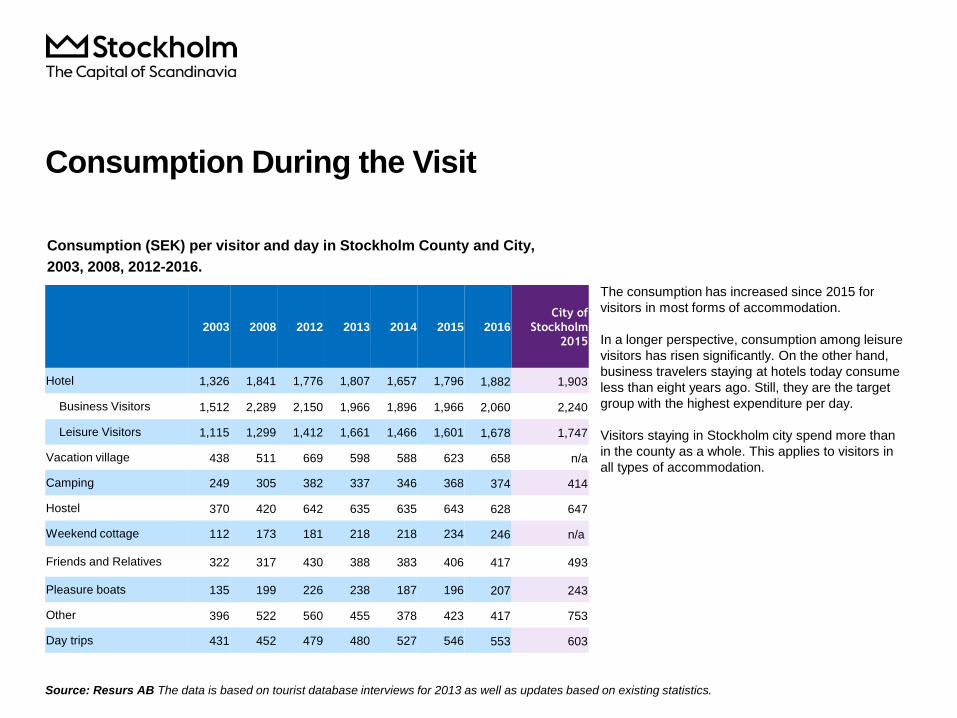
Consumption During the Visit
Consumption (SEK) per visitor and day in Stockholm County and City,
2003, 2008, 2012-2016.
Source: Resurs AB The data is based on tourist database interviews for 2013 as well as updates based on existing statistics.
The consumption has increased since 2015 for
visitors in most forms of accommodation.
In a longer perspective, consumption among leisure
visitors has risen significantly. On the other hand,
business travelers staying at hotels today consume
less than eight years ago. Still, they are the target
group with the highest expenditure per day.
Visitors staying in Stockholm city spend more than
in the county as a whole. This applies to visitors in
all types of accommodation.
2003 2008 2012 2013 2014 2015 2016
City of
Stockholm
2015
Hotel 1,326 1,841 1,776 1,807 1,657 1,796 1,882 1,903
Business Visitors 1,512 2,289 2,150 1,966 1,896 1,966 2,060 2,240
Leisure Visitors 1,115 1,299 1,412 1,661 1,466 1,601 1,678 1,747
Vacation village 438 511 669 598 588 623 658 n/a
Camping 249 305 382 337 346 368 374 414
Hostel 370 420 642 635 635 643 628 647
Weekend cottage 112 173 181 218 218 234 246 n/a
Friends and Relatives 322 317 430 388 383 406 417 493
Pleasure boats 135 199 226 238 187 196 207 243
Other 396 522 560 455 378 423 417 753
Day trips 431 452 479 480 527 546 553 603

Facts about Stockholm’s tourism industry
is published by Visit Stockholm.
The report can be downloaded from:https://www.stockholmbusinessregion.com/facts-figures/
Visit Stockholm AB
City of Stockholm
Drottninggatan 33, Po. Box 16282, SE-103 25 Stockholm
visitstockholm.com / stockholmbusinessregion.com