Embed Size (px)
Citation preview

Contract No.: ED-01-CO-0039 (0001) MPR Reference No.: 8879-400
Factors That Influence Participation in Secondary Vocational Education
August 2004
Roberto Agodini Stacey Uhl Timothy Novak
Submitted to: U.S. Department of Education Planning and Evaluation Service 400 Maryland Avenue, SW Room 6W306 Washington, DC 20202
Project Officer: David Goodwin
Submitted by:
Mathematica Policy Research, Inc. P.O. Box 2393 Princeton, NJ 08543-2393 Telephone: (609) 799-3535
Facsimile: (609) 799-0005 Project Director:
Roberto Agodini

iii
CONTENTS
Section Page
ACKNOWLEDGMENTS.............................................................................................. v
EXECUTIVE SUMMARY..........................................................................................vii
INTRODUCTION.......................................................................................................... 1
FOCUS OF THIS STUDY............................................................................................. 2 SUMMARY OF OUR FINDINGS ................................................................................ 3
REFERENCES .......................................................................................................... 9
APPENDIX A: THE NATIONAL EDUCATION LONGITUDINAL STUDY AND OUR ANALYSIS FILE ........................................................ 11 APPENDIX B: TABLES OF RESULTS................................................................. 15


v
ACKNOWLEDGMENTS
We would like to thank the many individuals who contributed to the preparation of this report. At the U.S. Department of Education, we thank David Goodwin and Marsha Silverberg for their guidance and helpful comments. At Mathematica Policy Research Inc., we thank Mark Dynarski, Joshua Haimson, Alan Hershey, and Peter Schochet for their expertise and critical reviews. Finally, we thank Roy Grisham for editing the report, and Marjorie Mitchell, Jill Miller, and William Garrett for overseeing its production.

vii
EXECUTIVE SUMMARY
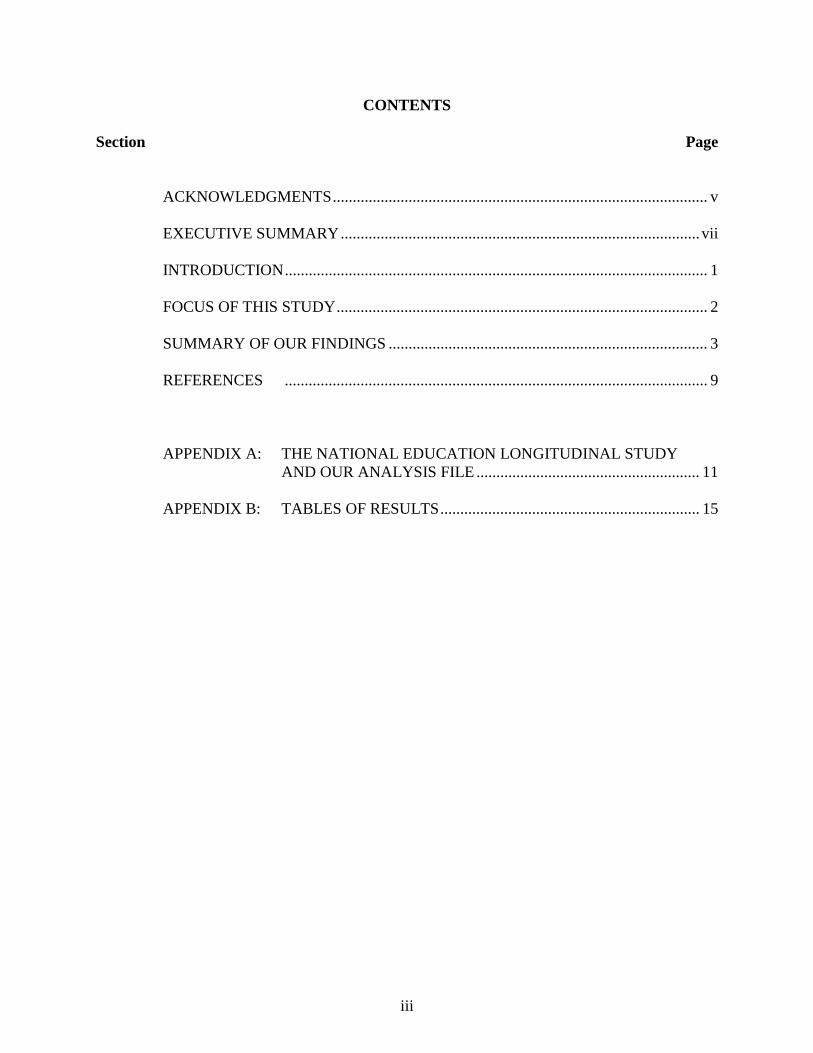
Since the early 1990s, federal legislation has encouraged secondary vocational education to go beyond its traditional focus of providing narrowly-defined workplace skills to a broader goal of providing career preparation. These reforms also have encouraged vocational education to strengthen the academic skills of participants. In short, the objective was to encourage vocational education to change in ways that better prepare participants with the skills needed to pursue whatever path – work or college – they choose after high school.
When making this change, the vocational education community needs to understand who
participates in vocational education, because the way in which vocational education is changed should be tailored to meet the needs of participants. Recent research shows that vocational education attracts the same segments of the student population that it has attracted for decades: students with low academic achievement, students with low educational aspirations, students with disabilities, and students with behavioral problems (Levesque et al., 2000). Though informative, these findings do not necessarily indicate the factors that influence vocational education participation. For example, they do not indicate whether students with a disability participate at a higher rate than those without one because of their disability, or whether other differences between these two groups are responsible.
We examine the factors that influence participation in vocational education. The analysis is
based on a nationally representative sample of students who graduated high school in 1992 – that is, around the time when the focus of federal vocational education policy began to change. The factors we examine include three types of characteristics of students, their parents, and their high schools: demographics, behaviors, and expectations. The influence of each characteristic is assessed by examining the difference in vocational education participation rates among students who do and do not possess the characteristic, adjusted for other differences between students that may affect participation. For example, to understand how sex affects vocational education participation, we examine the difference in the percent of males and females who participated in vocational education, adjusted for other important differences between these two groups, such as prior academic achievement.
We find that:
• Three different types of students are more likely to participate in vocational education: (1) those with low academic achievement, (2) those with low educational aspirations, and (3) those from low socioeconomic backgrounds.
• Students with disabilities or behavior problems have higher participation rates; however, these higher rates are related to their low academic achievement, low educational aspirations, and low socioeconomic backgrounds – not to their disabilities or behavior problems.
• After adjusting for other characteristics, black students are just as likely as white students to participate in vocational education, whereas Hispanic students are slightly less likely to participate.
viii
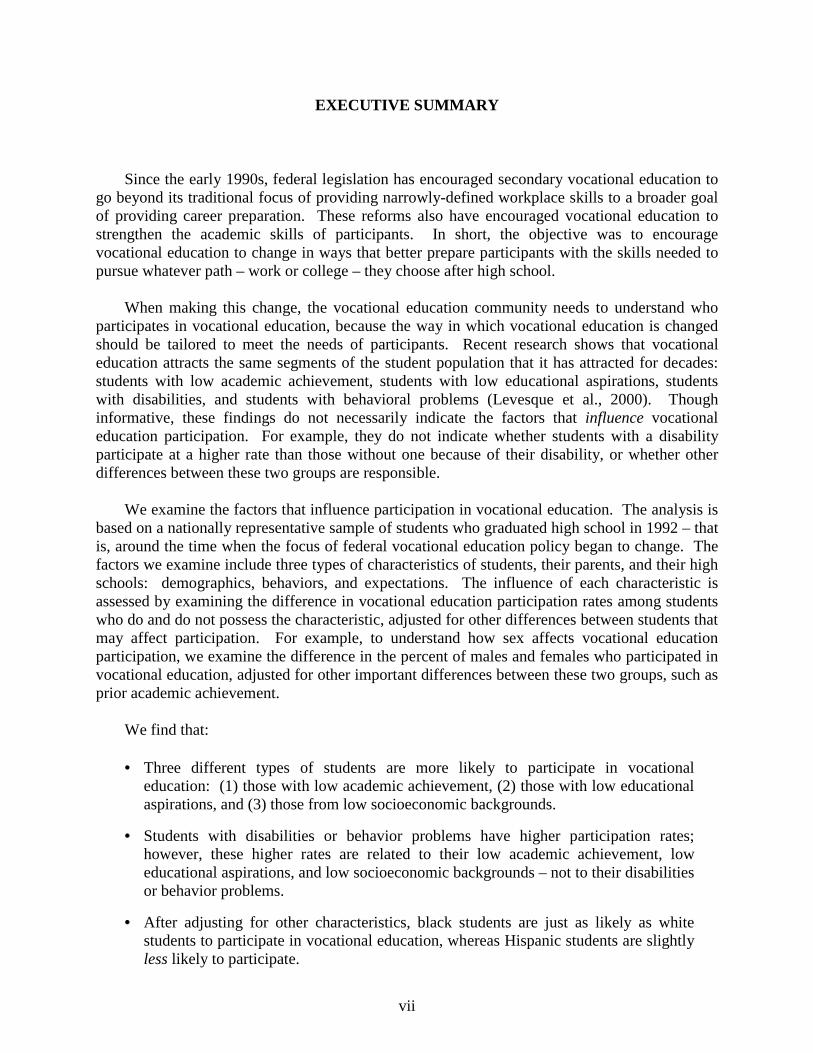
Our findings indicate that fewer characteristics influence participation in vocational education than what previous research has found. For example, a study of a few select high schools found that, among 1988 seniors with similar academic achievement and college plans, those from minority racial and ethnic groups – particularly Hispanic students – were more likely to participate in vocational education than white students (Oakes et al., 1992). In contrast, our findings indicate that, on a national level, race and ethnicity have little, if any, independent influence on participation. In fact, we find that Hispanic students are slightly less likely to participate than white students. Consistent with previous research, however, we do find that students from poor families are more likely to participate in vocational education, regardless of their prior achievement or college aspirations. Additional research is needed to understand this participation pattern because the possible reasons – which range from unfair tracking practices to student choice – have very different policy implications.
Our findings also highlight several challenges facing vocational education. One particularly
important challenge is how to meet the objectives of recent education reforms, which aim to increase academic achievement and college enrollment of all students. Previous research indicates that, during the early 1990s, participating in vocational education had no effect on students’ academic achievement (Rasinski and Pedlow, 1994; and Agodini, 2001) or college enrollment (Plank, 2001). This suggests that the vocational experiences of the students we studied would not likely contribute to the objectives of recent education reforms. Several initiatives that started in the early 1990s, such as Tech-Prep and career academies, are trying to address this challenge, in part, by integrating vocational education with academic instruction. In light of the objectives of recent education reforms, the success of these initiatives is likely to be important in the ongoing debate about the role of vocational education in the educational system.
1
INTRODUCTION
Vocational education was originally designed to provide high school students with the skills needed to enter and succeed in the workplace after graduation. The specific strategy for meeting this goal was to provide vocational education students with occupation-specific skills. Little, if any, emphasis was placed on providing academic skills.
Since the early 1990s, federal legislation has sought to change vocational education in
fundamental ways. Specifically, legislation has encouraged vocational education to go beyond its traditional focus of providing narrowly-defined workplace skills to a broader goal of providing career preparation. These reforms also have encouraged vocational education to strengthen the academic skills of participants. In short, the objective was to encourage vocational education to change in ways that better prepare participants with the skills needed to pursue whatever path – work or college – they choose after high school. Several initiatives of the early 1990s, such as Tech-Prep education and career academies, are based on this objective.
When making this change, the vocational education community needs to understand who
participates in vocational education, because the way in which it is changed should be tailored to meet the needs of participants. For decades, vocational education has attracted struggling academic learners and students who are uncertain about attending college. Other segments of the population that have been attracted to vocational education include students with disabilities and students with behavioral problems. Recent research shows that vocational education continues to attract the same segments of the student population. Though informative, these findings do not necessarily indicate the factors that influence vocational education participation. For example, they do not indicate whether students with a disability participate at a higher rate than those without one because of their disability, or whether other differences between these two groups are responsible.
Most previous research on participation in curricular programs focused on the factors that
influence participation in academic rather than vocational education, but we can infer from these studies what factors influence participation in vocational education. For example, earlier studies have found that students with high levels of prior achievement are more likely to pursue an academic program (Heyns, 1974; Alexander and Cook, 1982; Garet and DeLany, 1988; Gamoran, 1992). This suggests that students with low prior achievement are more likely to pursue vocational education. Another study suggests that, among students with similar prior achievement, students from minority racial and ethnic groups, students from poor families, and students with behavioral problems also are more likely to pursue vocational education (DeLany, 1991). A study that specifically examined the factors that drive vocational education participation confirms these findings (Oakes et al., 1992).
Aside from the fact that we need to make inferences from previous research about the
factors that influence participation in vocational education, this issue is not well understood, for two other reasons. First, previous research was based either on a nationally-representative sample of students who attended high school years before recent vocational education reforms, or a sample from a more recent cohort that attended only a few select high schools. Second, previous research did not examine the influence that all potentially important factors have on vocational education participation.

2
FOCUS OF THIS STUDY This study examines the factors that influence participation in vocational education among
students who attended high school during the early 1990s – that is, when the focus of federal vocational education policy began to change. We assess the influence of various factors by examining the difference in vocational education participation rates among students who do and do not possess a particular characteristic, adjusted for other differences between students that may affect participation. For example, to understand how sex affects vocational education participation, we examine the difference in the percent of males and females who participated in vocational education, adjusted for other differences between these two groups, such as prior achievement, that may affect participation. The analysis is based on the National Education Longitudinal Study (NELS) – a nationally-representative sample of students who attended high school during the early 1990s. More details about the NELS and our analysis file are provided in Appendix A.
The factors we examine include three types of characteristics of students, their parents, and
their schools: demographics, behaviors, and expectations. The demographics include academic achievement, sex, race and ethnicity, and so on. The behaviors include measures that indicate problem student behaviors; measures that indicate the extent to which students and parents are engaged in the educational process; as well as measures that indicate the extent to which administrators report that various factors, such as test scores, influence the curricular program students pursue. Last, the expectations include such measures as a student’s college plans.
The characteristics of students and their parents were measured just before students entered
high school, whereas the school characteristics were measured when students were halfway through high school. We measured student and parent characteristics just before students entered high school, to understand how these characteristics influence vocational education participation during high school. In contrast, we measured school characteristics when students were halfway through high school, to understand how the characteristics of the high schools students actually attend influence vocational education participation.
We focus on the relationship between these characteristics and whether or not a student
became a vocational concentrator – that is, whether or not a student earned at least three credits in a single occupational area during high school. We also examine how these characteristics are related to two alternative definitions of vocational education. The first alternative definition – vocational explorer – includes students who earned at least three credits in vocational courses but not in the same occupational area. This definition may be of particular interest to those who believe that schools should prepare students with broader occupational training. The second definition – vocational investor – includes both vocational concentrators and vocational explorers. This is one of the broadest definitions of vocational education participation.
Results were examined for overall 1992 high school graduates and for three subgroups: (1)
students in the lowest third of eighth-grade math and reading achievement, (2) students who attended a high school where more than half of the students received a free or reduced-priced lunch, and (3) students who, before starting high school, were not planning to pursue any type of postsecondary education. For ease of exposition, we refer to the first subgroup as “low achievers”; the second subgroup as “students who attended poor schools”; and the third subgroup

3
as the “non-college-bound.” We examined results for low achievers and students who attended poor schools to understand the factors that influence vocational education participation among students with barriers to educational achievement and students from economically-disadvantaged families, respectively – two special populations named in the Carl Perkins Vocational Technology Education Act, hereafter referred to as the Perkins Act.1 We examined results for the non-college-bound to understand the factors that influence vocational education participation among a segment of the student population that has historically been attracted to vocational education.
SUMMARY OF OUR FINDINGS
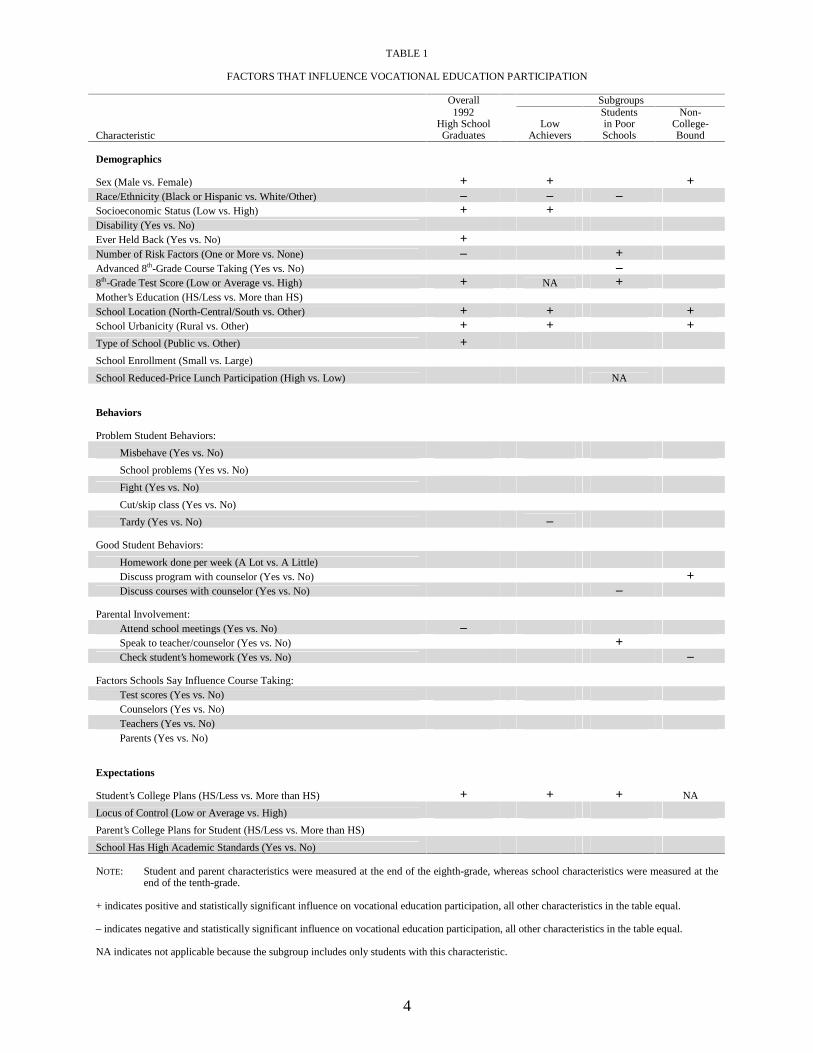
Table 1 summarizes our results for overall 1992 high school graduates and the three subgroups we described above. The rows indicate the characteristics we examined; the columns indicate the relationship between each characteristic and whether or not a student became a vocational concentrator. For example, the “+” in the row labeled “sex” and the column labeled “overall 1992 high school graduates” indicates that males were more likely than females to become a vocational concentrator, all other characteristics in the table held equal. Tables in Appendix B present these results in greater detail, as well as results when the two alternative definitions of vocational education – vocational explorer and vocational investor – are used instead of the concentrator definition. All these results are based on students who attended all types of high schools – that is, public and other types of high schools. The results are similar for students who attended only public high schools, which are not presented.
Consistent with historical participation patterns, students with low academic achievement or low educational aspirations are more likely to participate in vocational education.
Vocational education has historically attracted several special populations, including students with low academic achievement and students who do not plan to go to college.2 Other types of students that have been attracted to vocational education include students with disabilities and students with behavioral problems. These special populations have been attracted to vocational education partly because it has been considered a viable option for them, and partly because federal policymakers took steps during the 1960s and 1970s to improve access to vocational education among these populations.
1Other special populations named in the Perkins Act that we can identify in our analysis file
include students with disabilities. We did not examine results for these students because the number of students with a disability in our analysis file is too small to support the analysis.
2Included in “students who do not plan to go to college” are those who, before entering high
school, do not plan to pursue any type of postsecondary education.
4
TABLE 1
FACTORS THAT INFLUENCE VOCATIONAL EDUCATION PARTICIPATION
Overall Subgroups
Characteristic
1992 High School Graduates
Low
Achievers
Students in Poor Schools
Non- College- Bound
Demographics
Sex (Male vs. Female) +
+ +
Race/Ethnicity (Black or Hispanic vs. White/Other) – – – Socioeconomic Status (Low vs. High) + + Disability (Yes vs. No) Ever Held Back (Yes vs. No) + Number of Risk Factors (One or More vs. None) – + Advanced 8th-Grade Course Taking (Yes vs. No) – 8th-Grade Test Score (Low or Average vs. High) + NA + Mother’s Education (HS/Less vs. More than HS) School Location (North-Central/South vs. Other) + + + School Urbanicity (Rural vs. Other) + + + Type of School (Public vs. Other) + School Enrollment (Small vs. Large) School Reduced-Price Lunch Participation (High vs. Low) NA Behaviors
Problem Student Behaviors:
Misbehave (Yes vs. No) School problems (Yes vs. No) Fight (Yes vs. No) Cut/skip class (Yes vs. No) Tardy (Yes vs. No) –
Good Student Behaviors:
Homework done per week (A Lot vs. A Little) Discuss program with counselor (Yes vs. No) + Discuss courses with counselor (Yes vs. No) –
Parental Involvement:
Attend school meetings (Yes vs. No) – Speak to teacher/counselor (Yes vs. No) + Check student’s homework (Yes vs. No) –
Factors Schools Say Influence Course Taking:
Test scores (Yes vs. No) Counselors (Yes vs. No) Teachers (Yes vs. No) Parents (Yes vs. No)
Expectations
Student’s College Plans (HS/Less vs. More than HS) +
+ + NA
Locus of Control (Low or Average vs. High) Parent’s College Plans for Student (HS/Less vs. More than HS) School Has High Academic Standards (Yes vs. No) NOTE: Student and parent characteristics were measured at the end of the eighth-grade, whereas school characteristics were measured at the
end of the tenth-grade. + indicates positive and statistically significant influence on vocational education participation, all other characteristics in the table equal. – indicates negative and statistically significant influence on vocational education participation, all other characteristics in the table equal. NA indicates not applicable because the subgroup includes only students with this characteristic.
5
Currently, federal policymakers are debating whether these special populations are well served by vocational education. Some believe that vocational education has come to be known as a “track” for students who are difficult to teach, that these students do not develop any useful skills by participating in vocational education. Others believe that vocational education serves an important purpose, but that the effectiveness of vocational education will reach its full potential only if participation is expanded to a broader group of students, such as high achievers. The idea is that, by attracting high achievers, the effectiveness of vocational education will improve, either because of peer effects or because having more high achievers participate will cause vocational teachers to improve the instruction. Whatever the case, this debate suggests that understanding who participates in vocational education is an important issue for federal policymakers.
We find that, among 1992 high school graduates, those who started high school with low
academic achievement, or those who did not expect to go to college, were more likely to participate in vocational education than were otherwise identical students. For example, students in the lowest third of eighth-grade reading achievement were about 7 percentage points more likely to become a vocational concentrator than students in the highest third who are otherwise identical, as seen in Table B.1. Similarly, students who did not plan to go to college were about 15 percentage points more likely to become a vocational concentrator than otherwise identical students who planned to get at least a bachelor’s degree.
Although these findings are based on 1992 high school graduates, and therefore do not
necessarily indicate the factors that influence vocational education participation among today’s students, they highlight several challenges facing vocational education. One particularly important challenge is how to meet the objectives of recent education reforms, which aim to increase academic achievement and college enrollment of all students. The pressure to increase academic achievement is exemplified by the fact that most of today’s students need to satisfy rigorous academic requirements in order to graduate from high school. However, previous research indicates that, during the early 1990s, participation in vocational education had no effect on students’ academic achievement (Rasinski and Pedlow, 1994; and Agodini, 2001) or college enrollment (Plank, 2001). Taken together, these findings suggest that many students who participated in vocational education during this time period probably would not have met the objectives of recent education reforms.
Several federal and state initiatives that started in the early 1990s, such as Tech-Prep
education and career academies, are changing vocational education in ways that, some hope, will meet the challenges facing vocational education. Included in these changes is the integration of vocational education with academic instruction, in an effort to increase both the appeal of vocational education and its effectiveness. By targeting a broader group of students than were historically attracted to vocational education, these initiatives also expect to change the patterns of participation. In light of the objectives of recent education reforms, the success of these initiatives is likely to be important in the debate about the role of vocational education in the educational system.

6
Regardless of their academic achievement and educational aspirations, students from poor families are more likely to participate in vocational education.
Many educators have been concerned about the reasons why students pursue a particular curriculum program – that is, academic, general, or vocational. Ideally, school staff would work with students to help them select a program that matches their academic abilities, expressed interests, and career goals. However, some prior research suggests that other factors also influence this process. For example, Oakes et al. (1992) interviewed school staff in three California high schools and analyzed transcripts of students who attended those schools. They found that, even after controlling for academic achievement and college plans, minority students and students from poor families were more likely to participate in vocational education. These findings led the authors to conclude that minority students and students from poor families at these schools were being encouraged to pursue vocational education based on social stereotyping, not on student achievement or future educational plans.
Like earlier research, we find that students from poor families are more likely to pursue
vocational education than are otherwise identical students. In particular, we find that students from families in the lowest socioeconomic quartile were 14 percentage points more likely to participate in vocational education than students from families in the highest socioeconomic quartile, even after controlling for prior achievement, educational aspirations, and other important characteristics.
Our findings, as well as those of Oakes et al. (1992), raise the question of whether poor
students are more likely to pursue vocational education because of unfair tracking practices or for other reasons. One possible explanation is that students from poor backgrounds choose to participate in vocational education because they realize that they will need to work if they want to go on to college. Another possible reason is that these students choose to participate in vocational education because they are encouraged to do so by peers and family.
Additional research is needed to help us better understand whether this pattern of
participation is the result of unfair tracking practices or student choice. It is important to understand which of these possibilities explains this pattern because the answers have very different policy implications. On the one hand, if school staff based their judgment about which program a student should pursue on characteristics other than student achievement, expressed interest, and educational plans, then schools need to work with staff to ensure that staff exercise fair and equal judgment. On the other hand, if the need to earn money for college – which students from poor families plan to pursue, either immediately after high school or at some time in the future – is what motivates them to pursue vocational education, then schools need to make sure that these students are aware of scholarships and grants that may be available.
After adjusting for other characteristics, disability status and behavior problems do not influence vocational education participation.
Students with a disability, as well as those with behavior problems, have higher rates of vocational education participation; however, these higher rates appear to be related to low academic achievement, low educational expectations, and low socioeconomic status – not to
7
disability status or behavior problems. For example, the percentage of students with and without a disability who became vocational concentrators differs by 11 percentage points. When we adjust for other characteristics, however, we find that students with a disability are only 2 percentage points more likely to become vocational concentrators than are students without a disability. Moreover, this adjusted difference is not statistically significant.
Nevertheless, the fact that students with a disability and students with behavior problems
have high participation rates means that vocational educators need to be prepared to address the needs of these students. This may require structural changes to the physical environment. It may also require flexibility and creativity in carrying out the curriculum.
Black students are just as likely as white students to participate in vocational education, whereas Hispanic students are slightly less likely to participate.
As mentioned earlier, the findings of previous studies suggest that minority students – and students from poor families – are encouraged to participate in vocational education on the basis of social stereotyping (Oakes et al., 1992). These findings were especially true for Hispanic students.
Our findings about the relationship between race and ethnicity on the one hand and
vocational education participation on the other differ from those of previous studies. In particular, we find that the participation rates of black students and white students were similar. This is true even when we adjust for other differences between these two groups. In contrast, we find that Hispanic students were 5 percentage points less likely than otherwise identical white students to become vocational concentrators.
One possible explanation why Hispanic students participate at lower rates than do otherwise
identical white students could be differences in the extent to which students in the two groups are classified as limited English proficient (LEP). If Hispanic students are more likely to be classified as LEP, and to have to spend part of their school day taking courses to improve their English proficiency, they may have less opportunity to take vocational courses. We considered this possibility by examining participation rates among non-LEP students, and found that Hispanic students in this subgroup also are slightly less likely to participate in vocational education than are white students in this subgroup. These findings suggest that LEP status does not, by itself, explain why Hispanic students participate at lower rates.
Another possibility – which we could not explore – is that Hispanic students participate at
lower rates because they do not want to be separated from their peers. This possibility might suggest that Hispanic students need to be encouraged to explore the opportunities vocational education may provide them. Of course, there may be other important reasons that could explain why Hispanic students participate at lower rates. Therefore, understanding the reasons why Hispanic students participate in vocational education at lower rates should be further explored.

9
REFERENCES
Agodini, R. (2001). Achievement Effects of Vocational and Integrated Studies. Draft report submitted to the U.S. Department of Education, Planning and Evaluation Service. Princeton, NJ: Mathematica Policy Research.
Alexander, K.L., and Cook, M.A. (1982). Curricula and Coursework: A Surprise Ending to a Familiar Story. American Sociological Review, 47, pp. 626-640.
Bishop, J.H. (1995). Vocational Education and At-Risk Youth in the United States. Cornell University Working Paper 95-19. Ithaca, NY: Center for Advanced Human Resource Studies, Cornell University.
DeLany, B. (1991). Allocation, Choice, and Stratification within High Schools: How the Sorting Machine Copes. American Journal of Education, 99, pp. 181-207.
Garet, M.S., and DeLany, B. (1988). Students, Courses, and Stratification. Sociology of Education, 61, pp. 61-77.
Gamoran, A. (1992). Access to Excellence: Assignment to Honors English Classes in the Transition from Middle to High School. Educational Evaluation and Policy Analysis, 14, pp. 185-204.
Heyns, B. (1974). Social Selection and Stratification within Schools. American Journal of Sociology, 79, pp. 434-451.
Levesque, K., Lauen, D., Teitlebaum, P., Alt, M., and Librera, S. (2000). Vocational Education in the United States: Toward the Year 2000. Report submitted to the U.S. Department of Education, National Center for Education Statistics. Berkeley, CA: MPR Associates.
Mane, F. (1999). Trends in the Payoff to Academic and Occupation-Specific Skills: The Short and Medium Run Returns to Academic and Vocational High School Courses for Non-College-Bound Students. Economics of Education Review, 18, pp. 417-437.
Oakes, J., Selvin, M., Karoly, L., and Guiton, G. (1992). Educational Matchmaking: Academic and Vocational Tracking in Comprehensive High Schools. National Center for Research in Vocational Education, University of California at Berkeley. Berkeley, CA: RAND.
Plank, S. (2001). Career and Technical Education in the Balance: An Analysis of High School Persistence, Academic Achievement, and Postsecondary Destinations. St. Paul, MN: National Research Center for Career and Technical Education, University of Minnesota.
Rasinski, K.A., and Pedlow S. (1994). Using Transcripts to Study the Effectiveness of Vocational Education. Journal of Vocational Education Research, 19, pp. 23-43.

APPENDIX A
THE NATIONAL EDUCATION LONGITUDINAL STUDY AND OUR ANALYSIS FILE

13
The National Education Longitudinal Study
Our analysis is based on the National Education Longitudinal Study (NELS). The base-year survey of the NELS, conducted in 1988, contained a nationally-representative sample of about 25,000 eighth-graders. Follow-up surveys were conducted in 1990, 1992, 1994, and 2000. While respondents were of school age – which includes the 1988, 1990, and 1992 surveys – information was collected from students, one of their parents, two of their teachers, and their school’s administrator. Some students, though of school age, were not in school during the 1990 and 1992 surveys because they dropped out. To understand why these students dropped out, information related to dropping out was collected from them. After respondents should have graduated from high school – which includes the 1994 survey and the yet-to-be-released 2000 survey – information was collected only from respondents, not from others who were previously surveyed, such as parents. High school transcripts of respondents also were collected.
Our Analysis File
Our analysis file contains students who responded to all four NELS surveys that are currently available, who had transcript information, and who graduated from high school. A student was considered a high school graduate if he or she took at least 16 credits, took at least one English course, and received a regular or honors diploma by June 1992. Excluding students who graduated after June 1992 does not significantly reduce the size of this sample, as only a few students graduated after June 1992. The analysis was limited to high school graduates, to ensure that students completed enough coursework to allow them to meet the requirements of an academic or vocational curricular program.
Weights
All statistics were computed using weights. A weight provided by the NELS (F3PNLWT) applies to students who responded to all four surveys – one of the criteria that students had to meet in order to be included in our analysis file. However, students also had to have transcript information to be included in our analysis file. If students who did not have transcript information were completely random, the weight provided by the NELS would have been adequate. However, students who were missing transcript data were not completely random. Instead, various characteristics of students – age, sex, race, socioeconomic status, achievement, educational expectations, and risk of dropping out – and the schools they attended – type, region, and level of urbanicity – affected the likelihood of having transcript data. We used these characteristics and the weight provided by the NELS to produce a weight that applies to students in our analysis file. In particular, using students who responded to all four NELS surveys, we estimated a weighted logistic regression to determine each student’s predicted probability of having transcript information. The inverse of this predicted probability was multiplied by the weight provided by the NELS to produce a weight that applies to students in our analysis file.
14
Determining Who Participated in Vocational Education
We used transcript information from the second follow-up of the NELS to determine whether or not a student participated in vocational education. We processed these data according to the framework described in the 1998 Revision of the Secondary School Taxonomy. In particular, using the Classification of Secondary School Courses codes provided by the NELS, we grouped courses into the categories of the revised Secondary School Taxonomy (SST). For each student, we then determined the number of credits taken in each SST category.
Defining Characteristics
Many of the characteristics we examined were created directly from NELS variables. For example, “Took Advanced Math During 8th-Grade” was created from the NELS variable BYS66D (Are you enrolled in advanced, enriched, or accelerated courses in mathematics?).
For several of the other characteristics we examined, we combined some of the response
categories of the NELS variables. The “Enrollment” variable provides an example. The NELS variable F1SCENRL, which categorizes the entire school enrollment as reported by the school, has nine categories. We combined several of these categories for our analysis.
For some of the remaining characteristics, we combined two or more NELS variables, to
produce a single variable. For example, we combined the NELS variables BYS51AA (Since the beginning of this school year, have you talked to a counselor at your school to get information about high schools or high school programs?) and BYS51AB (Since the beginning of this school year, have you talked to a teacher at your school to get information about high schools or high school programs?), to create the characteristic “Talked to Teacher/Counselor About Curricular Program Since Beginning of School Year.”
Finally, we created categorical variables from the NELS variables that indicate
socioeconomic status, math test score, and reading test score. For socioeconomic status, we created a categorical variable that indicates the quartile to which each student belongs. For test scores, we created categorical variables that indicate the third of the test score distribution to which each student belongs.

APPENDIX B
TABLES OF RESULTS


17
TABLE B.1
PERCENT OF VOCATIONAL CONCENTRATORS AMONG 1992 HIGH SCHOOL GRADUATES
Difference Between Categories
(Percentage Points) Characteristics
Vocational Concentrator
(Percent) Simple Differencea Adjusted Differenceb
Total 22.2
Demographics
Student Sex
Male 26.2 7.8* 5.8* Female 18.4 — —
Race/Ethnicity
White/Other 22.2 — — Black 23.8 1.6 -2.7 Hispanic 20.2 -2.0 -5.4*
Socioeconomic Status
1st quartile (lowest) 33.4 24.4* 14.3* 2nd quartile 26.8 17.8* 11.9* 3rd quartile 19.4 10.4* 8.1* 4th quartile (highest) 9.0 — —
Student has a Disability According to Parent/Teacherc
Yes 33.1 11.4* 2.2 No 21.7 — —
Ever Held Backc
Yes 34.5 14.5* 4.3* No 20.0 — —
Number of Risk Factorsd
0 19.5 — — 1 26.1 6.6* 1.0 2 or more 27.5 8.0* -3.1*
Took Advanced Math During 8th-Gradec
Yes 19.7 -4.2* 1.0 No 23.9 — —
Took Advanced English During 8th- Gradec
Yes 19.6 -3.6* -1.9 No 23.2 — —
8th-Grade Math Test Scorec
Lowest third 30.0 16.9* 3.3 Middle third 23.5 10.4* 4.1* Highest third 13.1 — —

TABLE B.1 (continued)
18
Difference Between Categories (Percentage Points)
Characteristics
Vocational Concentrator
(Percent) Simple Differencea Adjusted Differenceb 8th-Grade Reading Test Scorec
Lowest third 31.9 19.1* 7.1* Middle third 22.0 9.2* 3.3* Highest third 12.8 — —
Parent Mother’s Educationc
High school diploma or less 28.1 15.1* -0.7 Some postsecondary 18.9 5.9* -1.3 Bachelor’s degree or more 13.0 — —
School Geographic Locationc
Northeast 19.7 1.9 2.7 North Central 25.1 7.3* 5.2* South 23.8 6.0* 4.2* West 17.8 — —
Level of Urbanicityc
Urban 15.3 — — Suburban 20.5 5.2* 2.2 Rural 30.4 15.1* 7.2*
Typec
Public 24.2 19.5* 14.2* Other 4.7 — —
Enrollmentc
1 to 599 24.5 — — 600 to 999 21.9 -2.6 -1.5 1,000 to 1,599 22.3 -2.2 0.0 1,600 or more 20.0 -4.5* 1.3
Percent Receiving Free/Reduced-Price Lunchc
0 7.5 — — 1 to 10 20.5 13.0* 2.8 11 to 50 27.2 19.7* 3.3 51 to 100 26.2 18.7* 2.2
Behaviors
Student Sent to Office for Misbehaving During Past Semesterc
Yes 28.8 8.8* 1.3 No 20.0 — —
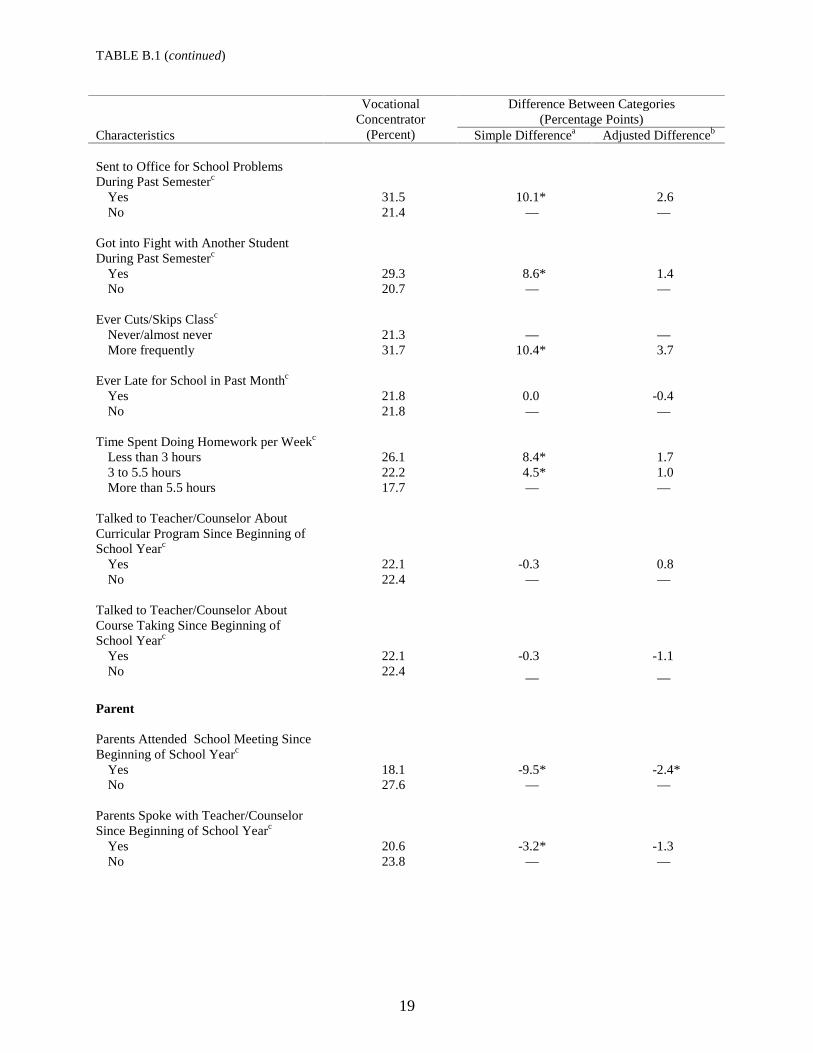
TABLE B.1 (continued)
19
Difference Between Categories (Percentage Points)
Characteristics
Vocational Concentrator
(Percent) Simple Differencea Adjusted Differenceb Sent to Office for School Problems During Past Semesterc
Yes 31.5 10.1* 2.6 No 21.4 — —
Got into Fight with Another Student During Past Semesterc
Yes 29.3 8.6* 1.4 No 20.7 — —
Ever Cuts/Skips Classc
Never/almost never 21.3 — — More frequently 31.7 10.4* 3.7
Ever Late for School in Past Monthc
Yes 21.8 0.0 -0.4 No 21.8 — —
Time Spent Doing Homework per Weekc
Less than 3 hours 26.1 8.4* 1.7 3 to 5.5 hours 22.2 4.5* 1.0 More than 5.5 hours 17.7 — —
Talked to Teacher/Counselor About Curricular Program Since Beginning of School Yearc
Yes 22.1 -0.3 0.8 No 22.4 — —
Talked to Teacher/Counselor About Course Taking Since Beginning of School Yearc
Yes 22.1 -0.3 -1.1 No 22.4 — —
Parent Parents Attended School Meeting Since Beginning of School Yearc
Yes 18.1 -9.5* -2.4* No 27.6 — —
Parents Spoke with Teacher/Counselor Since Beginning of School Yearc
Yes 20.6 -3.2* -1.3 No 23.8 — —

TABLE B.1 (continued)
20
Difference Between Categories (Percentage Points)
Characteristics
Vocational Concentrator
(Percent) Simple Differencea Adjusted Differenceb Parents Checked Homework Sometimes or Oftenc
Yes 21.9 -0.8 -0.4 No 22.7 — —
School Test Scores Influence High School Programc
A little or none 24.0 — — Moderate 22.3 -1.7 0.4 A lot 21.3 -2.7 2.0
Counselors Influence High School Programc
A little or none 19.3 — — Moderate 24.0 4.7* 0.9 A lot 22.3 3.0 -1.5
Teachers Influence High School Programc
A little or none 24.3 — — Moderate 23.2 -1.1 -0.3 A lot 21.1 -3.2 -1.4
Parents Influence High School Programc
A little or none 21.1 — — Moderate 22.4 1.3 -0.4 A lot 22.8 1.7 1.5
Expectations
Student Student’s Educational Expectationsc
High school diploma or less 48.2 32.2* 14.5* Some postsecondary education 34.5 18.5* 8.4* Bachelor’s degree or more 16.0 — —
Locus of Controlc
Lowest third 28.2 9.5* 0.3 Middle third 21.2 2.5 -0.4 Highest third 18.7 — —
Parent Parents’ Educational Expectationsc
High school diploma or less 42.3 24.2* -0.6 Some postsecondary education 36.5 18.4* 2.2 Bachelor’s degree or more 18.1 — —
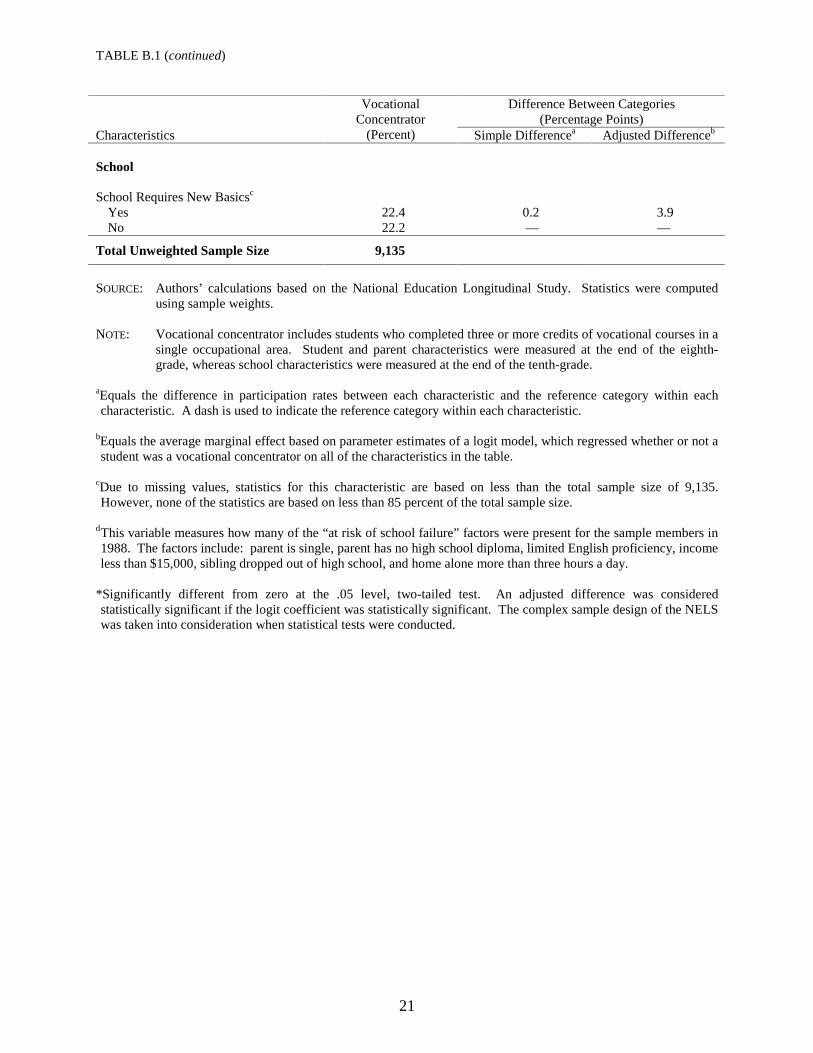
TABLE B.1 (continued)
21
Difference Between Categories (Percentage Points)
Characteristics
Vocational Concentrator
(Percent) Simple Differencea Adjusted Differenceb School School Requires New Basicsc
Yes 22.4 0.2 3.9 No 22.2 — —
Total Unweighted Sample Size 9,135
SOURCE: Authors’ calculations based on the National Education Longitudinal Study. Statistics were computed
using sample weights. NOTE: Vocational concentrator includes students who completed three or more credits of vocational courses in a
single occupational area. Student and parent characteristics were measured at the end of the eighth- grade, whereas school characteristics were measured at the end of the tenth-grade.
aEquals the difference in participation rates between each characteristic and the reference category within each characteristic. A dash is used to indicate the reference category within each characteristic.
bEquals the average marginal effect based on parameter estimates of a logit model, which regressed whether or not a student was a vocational concentrator on all of the characteristics in the table.
cDue to missing values, statistics for this characteristic are based on less than the total sample size of 9,135. However, none of the statistics are based on less than 85 percent of the total sample size.
d This variable measures how many of the “at risk of school failure” factors were present for the sample members in 1988. The factors include: parent is single, parent has no high school diploma, limited English proficiency, income less than $15,000, sibling dropped out of high school, and home alone more than three hours a day.
*Significantly different from zero at the .05 level, two-tailed test. An adjusted difference was considered statistically significant if the logit coefficient was statistically significant. The complex sample design of the NELS was taken into consideration when statistical tests were conducted.

22
TABLE B.2
PERCENT OF VOCATIONAL CONCENTRATORS AMONG STUDENTS WITH LOW PRIOR ACHIEVEMENT
Difference Between Categories
(Percentage Points) Characteristics
Vocational Concentrator
(Percent) Simple Differencea Adjusted Differenceb
Total 32.5 — —
Demographics
Student Sex
Male 37.3 10.2* 10.5* Female 27.1 — —
Race/Ethnicity
White/Other 36.5 — — Black 27.9 -8.6* -9.6* Hispanic 23.4 -13.1* -9.3*
Socioeconomic Status
1st quartile (lowest) 36.5 20.0* 17.1* 2nd quartile 34.8 18.3* 14.0* 3rd quartile 29.5 13.0* 10.6 4th quartile (highest) 16.5 — —
Student has a Disability According to Parent/Teacherc
Yes 35.3 1.2 -3.5 No 34.1 — —
Ever Held Backc
Yes 36.3 5.6 4.9 No 30.7 — —
Number of Risk Factorsd
0 32.5 — — 1 34.2 1.7 0.4 2 or more 30.7 -1.8 -4.2
Took Advanced Math During 8th-Gradec
Yes 34.2 2.2 0.2 No 32.0 — —
Took Advanced English During 8th- Gradec
Yes 33.0 0.6 1.5 No 32.4 — —
8th-Grade Math Test Scorec
Lowest third NA NA NA Middle third NA NA NA Highest third NA NA NA
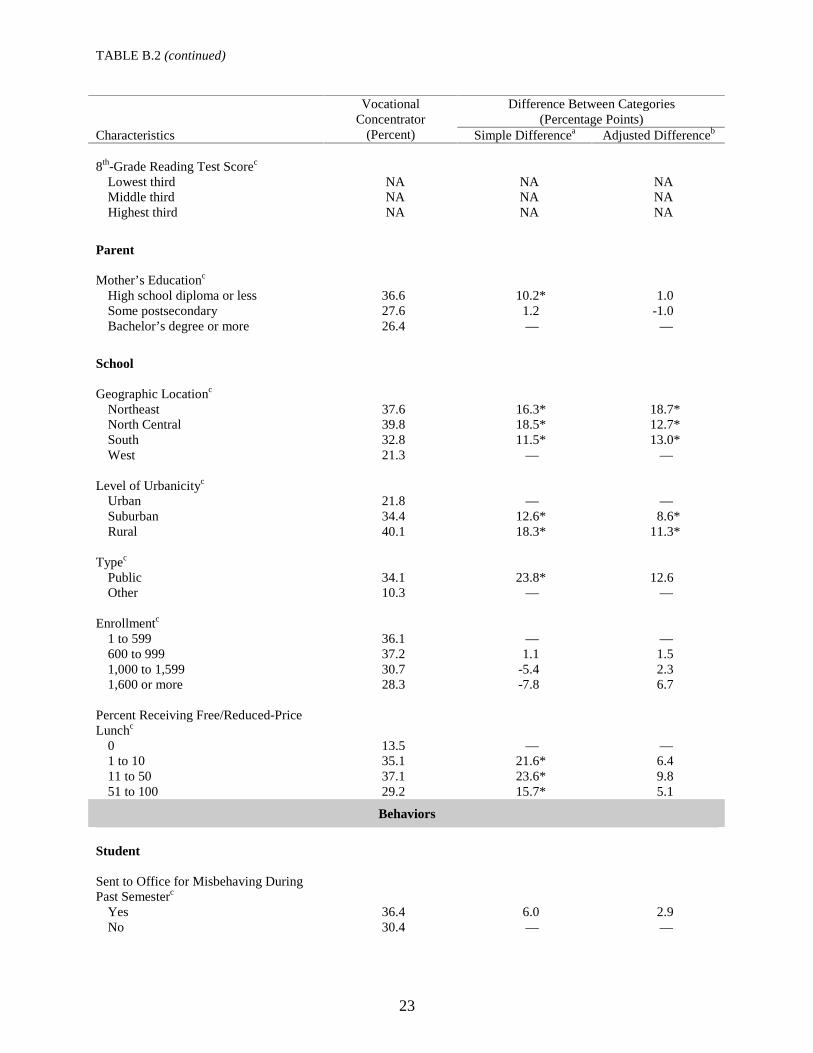
TABLE B.2 (continued)
23
Difference Between Categories (Percentage Points)
Characteristics
Vocational Concentrator
(Percent) Simple Differencea Adjusted Differenceb 8th-Grade Reading Test Scorec
Lowest third NA NA NA Middle third NA NA NA Highest third NA NA NA
Parent Mother’s Educationc
High school diploma or less 36.6 10.2* 1.0 Some postsecondary 27.6 1.2 -1.0 Bachelor’s degree or more 26.4 — —
School Geographic Locationc
Northeast 37.6 16.3* 18.7* North Central 39.8 18.5* 12.7* South 32.8 11.5* 13.0* West 21.3 — —
Level of Urbanicityc
Urban 21.8 — — Suburban 34.4 12.6* 8.6* Rural 40.1 18.3* 11.3*
Typec
Public 34.1 23.8* 12.6 Other 10.3 — —
Enrollmentc
1 to 599 36.1 — — 600 to 999 37.2 1.1 1.5 1,000 to 1,599 30.7 -5.4 2.3 1,600 or more 28.3 -7.8 6.7
Percent Receiving Free/Reduced-Price Lunchc
0 13.5 — — 1 to 10 35.1 21.6* 6.4 11 to 50 37.1 23.6* 9.8 51 to 100 29.2 15.7* 5.1
Behaviors
Student Sent to Office for Misbehaving During Past Semesterc
Yes 36.4 6.0 2.9 No 30.4 — —
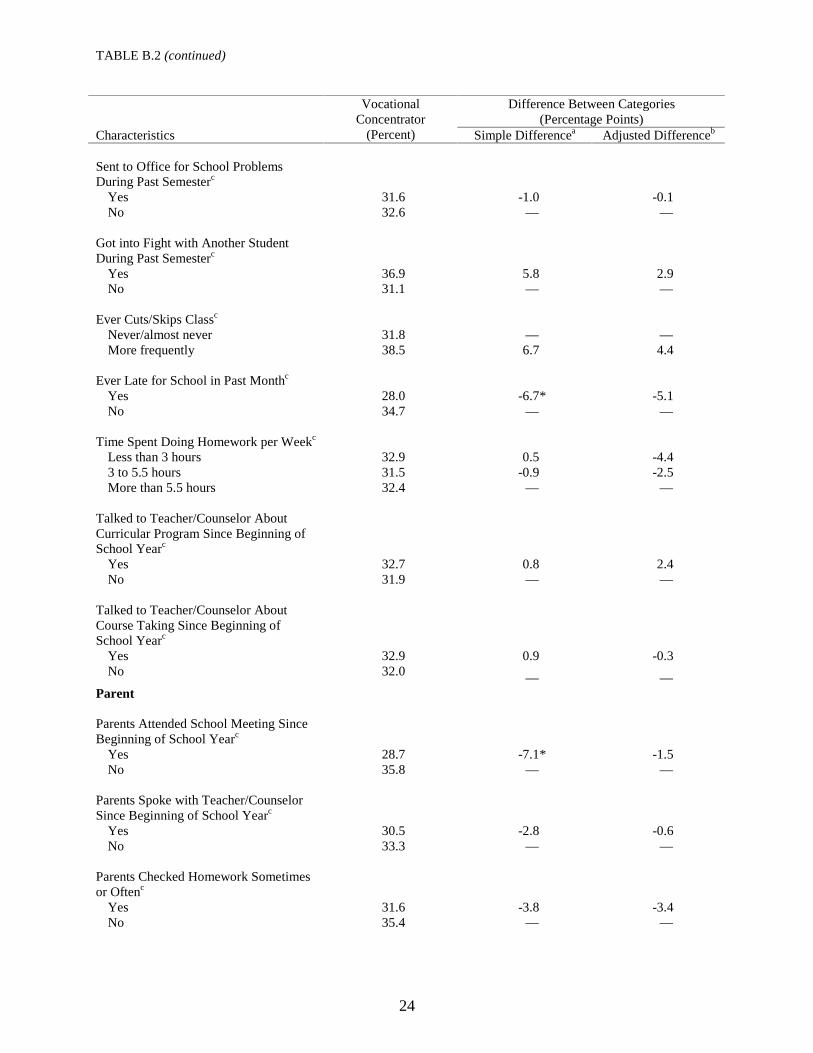
TABLE B.2 (continued)
24
Difference Between Categories (Percentage Points)
Characteristics
Vocational Concentrator
(Percent) Simple Differencea Adjusted Differenceb Sent to Office for School Problems During Past Semesterc
Yes 31.6 -1.0 -0.1 No 32.6 — —
Got into Fight with Another Student During Past Semesterc
Yes 36.9 5.8 2.9 No 31.1 — —
Ever Cuts/Skips Classc
Never/almost never 31.8 — — More frequently 38.5 6.7 4.4
Ever Late for School in Past Monthc
Yes 28.0 -6.7* -5.1 No 34.7 — —
Time Spent Doing Homework per Weekc
Less than 3 hours 32.9 0.5 -4.4 3 to 5.5 hours 31.5 -0.9 -2.5 More than 5.5 hours 32.4 — —
Talked to Teacher/Counselor About Curricular Program Since Beginning of School Yearc
Yes 32.7 0.8 2.4 No 31.9 — —
Talked to Teacher/Counselor About Course Taking Since Beginning of School Yearc
Yes 32.9 0.9 -0.3 No 32.0 — —
Parent Parents Attended School Meeting Since Beginning of School Yearc
Yes 28.7 -7.1* -1.5 No 35.8 — —
Parents Spoke with Teacher/Counselor Since Beginning of School Yearc
Yes 30.5 -2.8 -0.6 No 33.3 — —
Parents Checked Homework Sometimes or Oftenc
Yes 31.6 -3.8 -3.4 No 35.4 — —
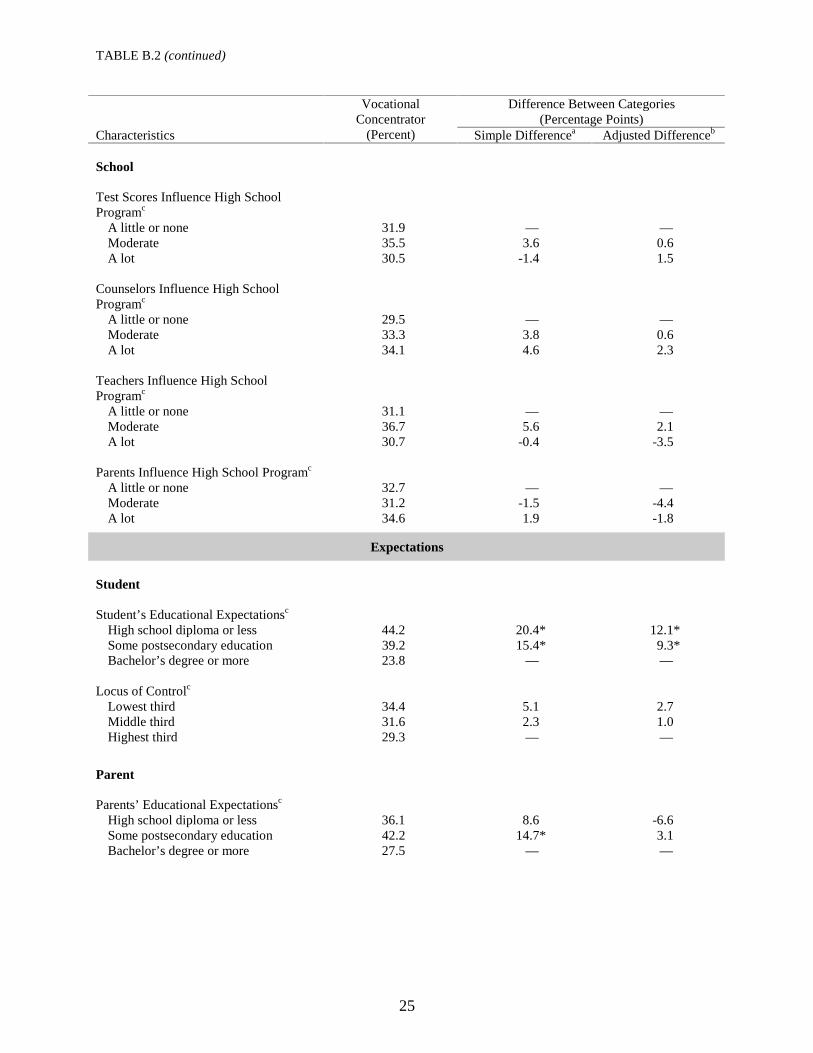
TABLE B.2 (continued)
25
Difference Between Categories (Percentage Points)
Characteristics
Vocational Concentrator
(Percent) Simple Differencea Adjusted Differenceb School Test Scores Influence High School Programc
A little or none 31.9 — — Moderate 35.5 3.6 0.6 A lot 30.5 -1.4 1.5
Counselors Influence High School Programc
A little or none 29.5 — — Moderate 33.3 3.8 0.6 A lot 34.1 4.6 2.3
Teachers Influence High School Programc
A little or none 31.1 — — Moderate 36.7 5.6 2.1 A lot 30.7 -0.4 -3.5
Parents Influence High School Programc
A little or none 32.7 — — Moderate 31.2 -1.5 -4.4 A lot 34.6 1.9 -1.8
Expectations
Student Student’s Educational Expectationsc
High school diploma or less 44.2 20.4* 12.1* Some postsecondary education 39.2 15.4* 9.3* Bachelor’s degree or more 23.8 — —
Locus of Controlc
Lowest third 34.4 5.1 2.7 Middle third 31.6 2.3 1.0 Highest third 29.3 — —
Parent Parents’ Educational Expectationsc
High school diploma or less 36.1 8.6 -6.6 Some postsecondary education 42.2 14.7* 3.1 Bachelor’s degree or more 27.5 — —

TABLE B.2 (continued)
26
Difference Between Categories (Percentage Points)
Characteristics
Vocational Concentrator
(Percent) Simple Differencea Adjusted Differenceb School School Requires New Basicsc
Yes 33.2 1.1 -3.2 No 32.1 — —
Total Unweighted Sample Size 1,848
SOURCE: Authors’ calculations based on the National Education Longitudinal Study. Statistics were computed
using sample weights. NOTE: Vocational concentrator includes students who completed three or more credits of vocational courses in a
single occupational area. Student and parent characteristics were measured at the end of the eighth-grade, whereas school characteristics were measured at the end of the tenth-grade.
aEquals the difference in participation rates between each characteristic and the reference category within each characteristic. A dash is used to indicate the reference category within each characteristic.
bEquals the average marginal effect based on parameter estimates of a logit model, which regressed whether or not a student was a vocational concentrator on all of the characteristics in the table.
cDue to missing values, statistics for this characteristic are based on less than the total sample size of 9,135. However, none of the statistics are based on less than 85 percent of the total sample size.
d This variable measures how many of the “at risk of school failure” factors were present for the sample members in 1988. The factors include: parent is single, parent has no high school diploma, limited English proficiency, income less than $15,000, sibling dropped out of high school, and home alone more than three hours a day.
*Significantly different from zero at the .05 level, two-tailed test. An adjusted difference was considered statistically significant if the logit coefficient was statistically significant. The complex sample design of the NELS was taken into consideration when statistical tests were conducted.
NA indicates not applicable because the subgroup only contains students with this characteristic.
27
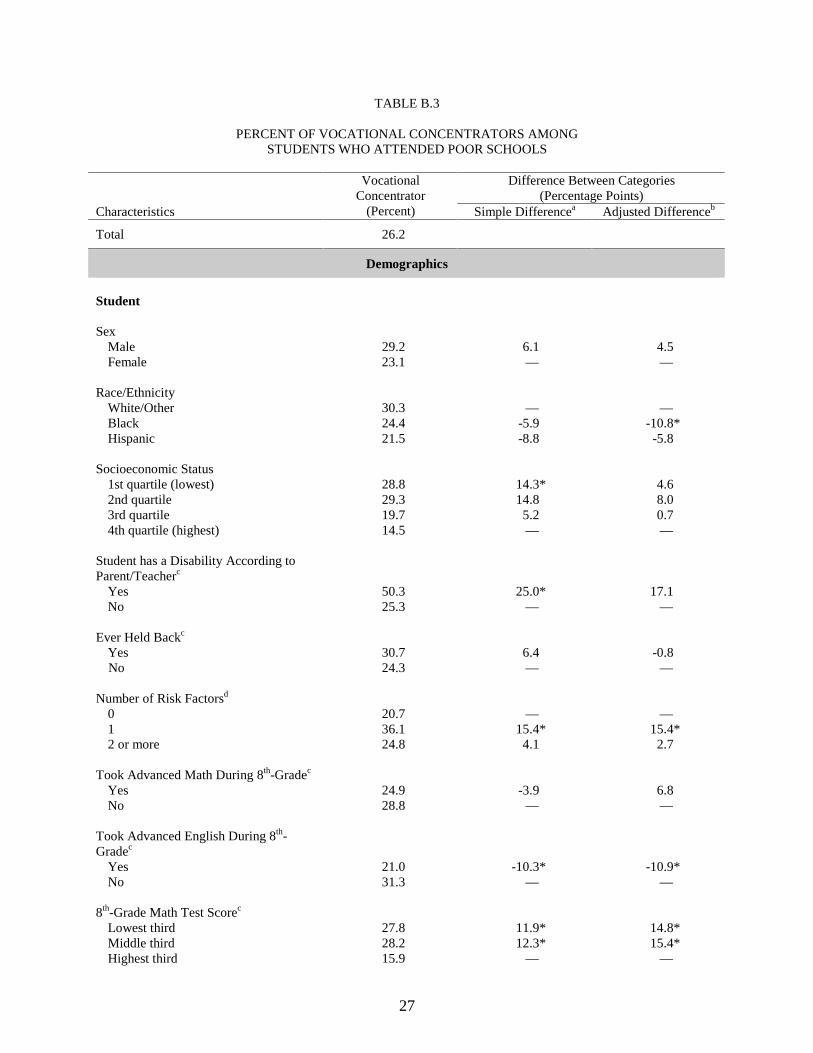
TABLE B.3
PERCENT OF VOCATIONAL CONCENTRATORS AMONG STUDENTS WHO ATTENDED POOR SCHOOLS
Difference Between Categories
(Percentage Points) Characteristics
Vocational Concentrator
(Percent) Simple Differencea Adjusted Differenceb
Total 26.2
Demographics
Student Sex
Male 29.2 6.1 4.5 Female 23.1 — —
Race/Ethnicity
White/Other 30.3 — — Black 24.4 -5.9 -10.8* Hispanic 21.5 -8.8 -5.8
Socioeconomic Status
1st quartile (lowest) 28.8 14.3* 4.6 2nd quartile 29.3 14.8 8.0 3rd quartile 19.7 5.2 0.7 4th quartile (highest) 14.5 — —
Student has a Disability According to Parent/Teacherc
Yes 50.3 25.0* 17.1 No 25.3 — —
Ever Held Backc
Yes 30.7 6.4 -0.8 No 24.3 — —
Number of Risk Factorsd
0 20.7 — — 1 36.1 15.4* 15.4* 2 or more 24.8 4.1 2.7
Took Advanced Math During 8th-Gradec
Yes 24.9 -3.9 6.8 No 28.8 — —
Took Advanced English During 8th- Gradec
Yes 21.0 -10.3* -10.9* No 31.3 — —
8th-Grade Math Test Scorec
Lowest third 27.8 11.9* 14.8* Middle third 28.2 12.3* 15.4* Highest third 15.9 — —

TABLE B.3 (continued)
28
Difference Between Categories (Percentage Points)
Characteristics
Vocational Concentrator
(Percent) Simple Differencea Adjusted Differenceb 8th-Grade Reading Test Scorec
Lowest third 28.6 2.4 -5.9 Middle third 22.7 -3.5 -10.5 Highest third 26.2 — —
Parent Mother’s Educationc
High school diploma or less 30.0 16.3* 5.6 Some postsecondary 15.8 2.1 -4.1 Bachelor’s degree or more 13.7 — —
School Geographic Locationc
Northeast 33.5 14.5* 14.6 North Central 29.3 10.3 13.3 South 27.3 8.3 7.6 West 19.0 — —
Level of Urbanicityc
Urban 23.6 — — Suburban 28.2 4.6 5.5 Rural 27.1 3.5 1.0
Typec
Public 26.9 14.9* 13.2 Other 12.0e — —
Enrollmentc
1 to 599 24.6 — — 600 to 999 32.6 8.0 8.7 1,000 to 1,599 29.1 4.5 6.2 1,600 or more 20.2 -4.4 1.2
Percent Receiving Free/Reduced-Price Lunchc
0 NA NA NA 1 to 10 NA NA NA 11 to 50 NA NA NA 51 to 100
Behaviors
Student Sent to Office for Misbehaving During Past Semesterc
Yes 28.6 3.5 -0.7 No 25.1 — —

TABLE B.3 (continued)
29
Difference Between Categories (Percentage Points)
Characteristics
Vocational Concentrator
(Percent) Simple Differencea Adjusted Differenceb Sent to Office for School Problems During Past Semesterc
Yes 34.3 8.7 0.6 No 25.6 — —
Got into Fight with Another Student During Past Semesterc
Yes 31.2 6.4 4.3 No 24.8 — —
Ever Cuts/Skips Classc
Never/almost never 26.2 — — More frequently 21.4 -4.8 -11.4
Ever Late for School in Past Monthc
Yes 23.0 -4.2 -4.4 No 27.2 — —
Time Spent Doing Homework per Weekc
Less than 3 hours 25.2 -2.0 -2.5 3 to 5.5 hours 26.6 -0.6 -1.5 More than 5.5 hours 27.2 — —
Talked to Teacher/Counselor About Curricular Program Since Beginning of School Yearc
Yes 25.4 -3.1 -0.4 No 28.5 — —
Talked to Teacher/Counselor About Course Taking Since Beginning of School Yearc
Yes 23.2 -8.6 -9.5* No 31.8 — —
Parent Parents Attended School Meeting Since Beginning of School Yearc
Yes 21.2 -8.2 -3.8 No 29.4 — —
Parents Spoke with Teacher/Counselor Since Beginning of School Yearc
Yes 26.9 4.7 11.1* No 22.2 — —
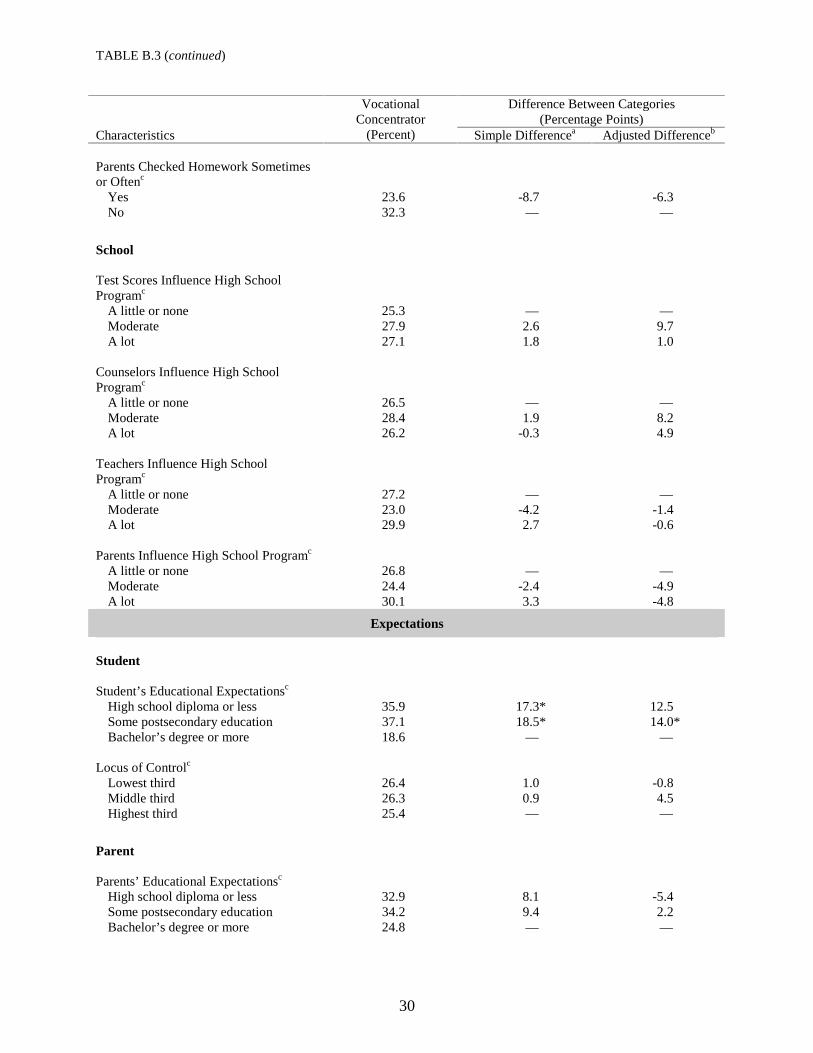
TABLE B.3 (continued)
30
Difference Between Categories (Percentage Points)
Characteristics
Vocational Concentrator
(Percent) Simple Differencea Adjusted Differenceb Parents Checked Homework Sometimes or Oftenc
Yes 23.6 -8.7 -6.3 No 32.3 — —
School Test Scores Influence High School Programc
A little or none 25.3 — — Moderate 27.9 2.6 9.7 A lot 27.1 1.8 1.0
Counselors Influence High School Programc
A little or none 26.5 — — Moderate 28.4 1.9 8.2 A lot 26.2 -0.3 4.9
Teachers Influence High School Programc
A little or none 27.2 — — Moderate 23.0 -4.2 -1.4 A lot 29.9 2.7 -0.6
Parents Influence High School Programc
A little or none 26.8 — — Moderate 24.4 -2.4 -4.9 A lot 30.1 3.3 -4.8
Expectations
Student Student’s Educational Expectationsc
High school diploma or less 35.9 17.3* 12.5 Some postsecondary education 37.1 18.5* 14.0* Bachelor’s degree or more 18.6 — —
Locus of Controlc
Lowest third 26.4 1.0 -0.8 Middle third 26.3 0.9 4.5 Highest third 25.4 — —
Parent Parents’ Educational Expectationsc
High school diploma or less 32.9 8.1 -5.4 Some postsecondary education 34.2 9.4 2.2 Bachelor’s degree or more 24.8 — —
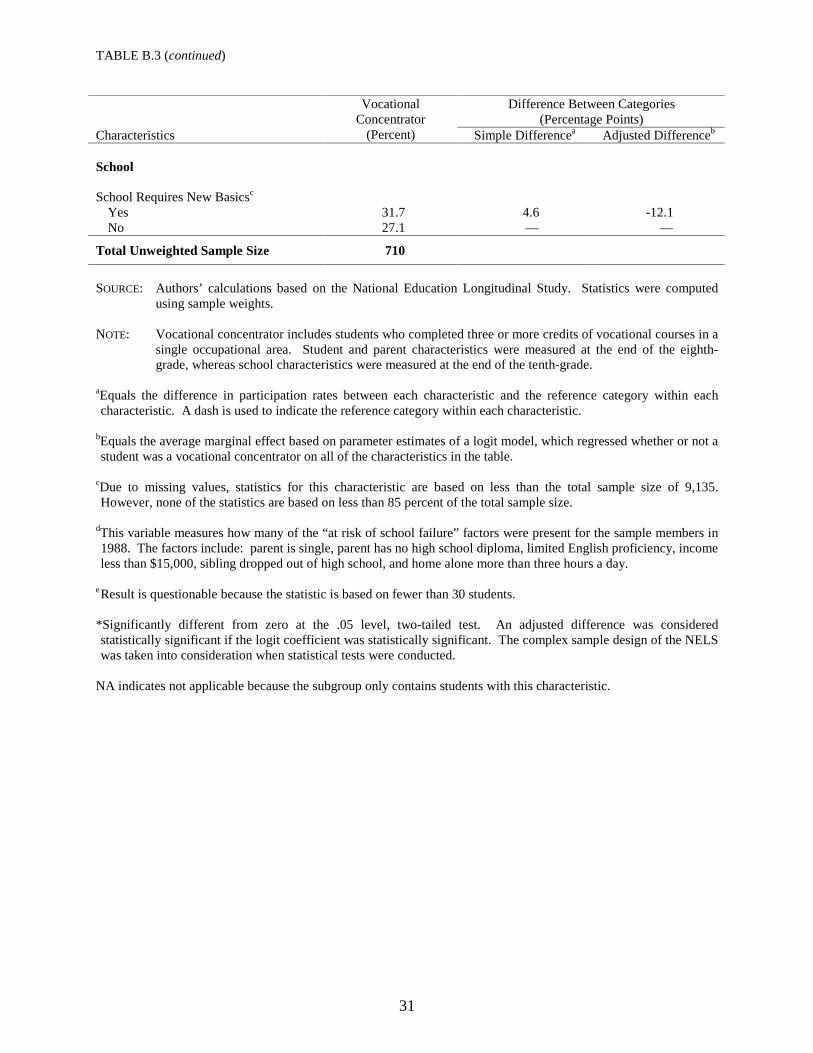
TABLE B.3 (continued)
31
Difference Between Categories (Percentage Points)
Characteristics
Vocational Concentrator
(Percent) Simple Differencea Adjusted Differenceb School School Requires New Basicsc
Yes 31.7 4.6 -12.1 No 27.1 — —
Total Unweighted Sample Size 710
SOURCE: Authors’ calculations based on the National Education Longitudinal Study. Statistics were computed
using sample weights. NOTE: Vocational concentrator includes students who completed three or more credits of vocational courses in a
single occupational area. Student and parent characteristics were measured at the end of the eighth-grade, whereas school characteristics were measured at the end of the tenth-grade.
aEquals the difference in participation rates between each characteristic and the reference category within each characteristic. A dash is used to indicate the reference category within each characteristic.
bEquals the average marginal effect based on parameter estimates of a logit model, which regressed whether or not a student was a vocational concentrator on all of the characteristics in the table.
cDue to missing values, statistics for this characteristic are based on less than the total sample size of 9,135. However, none of the statistics are based on less than 85 percent of the total sample size.
dThis variable measures how many of the “at risk of school failure” factors were present for the sample members in 1988. The factors include: parent is single, parent has no high school diploma, limited English proficiency, income less than $15,000, sibling dropped out of high school, and home alone more than three hours a day.
e Result is questionable because the statistic is based on fewer than 30 students. *Significantly different from zero at the .05 level, two-tailed test. An adjusted difference was considered statistically significant if the logit coefficient was statistically significant. The complex sample design of the NELS was taken into consideration when statistical tests were conducted.
NA indicates not applicable because the subgroup only contains students with this characteristic.

32
TABLE B.4
PERCENT OF VOCATIONAL CONCENTRATORS AMONG NON-COLLEGE-BOUND STUDENTS
Difference Between Categories
(Percentage Points) Characteristics
Vocational Concentrator
(Percent) Simple Differencea Adjusted Differenceb
Total 48.2
Demographics
Student Sex
Male 52.6 11.5* 11.7* Female 41.1 — —
Race/Ethnicity
White/Other 49.7 — — Black 53.4 3.7 1.6 Hispanic 34.9 -14.8* -10.9
Socioeconomic Status
1st quartile (lowest) 51.4 3.0 5.7 2nd quartile 44.5 -3.9 1.3 3rd quartile 42.1 -6.3 6.0 4th quartile (highest) 48.4e — —
Student has a Disability According to Parent/Teacherc
Yes 40.7 -10.0 -8.2 No 50.7 — —
Ever Held Backc
Yes 43.2 -5.5 -6.7 No 48.7 — —
Number of Risk Factorsd
0 47.4 — — 1 53.6 6.2 0.3 2 or more 43.6 -3.8 -5.8
Took Advanced Math During 8th-Gradec
Yes 48.2 -2.1 -2.6 No 50.3 — —
Took Advanced English During 8th- Gradec
Yes 50.0 0.9 4.6 No 49.1 — —
8th-Grade Math Test Scorec
Lowest third 47.1 6.0 8.2 Middle third 54.4 13.3 8.7 Highest third 41.1 — —

TABLE B.4 (continued)
33
Difference Between Categories (Percentage Points)
Characteristics
Vocational Concentrator
(Percent) Simple Differencea Adjusted Differenceb 8th-Grade Reading Test Scorec
Lowest third 46.2 0.9 4.9 Middle third 55.0 9.7 11.6 Highest third 45.3 — —
Parent Mother’s Educationc
High school diploma or less 51.8 7.0 7.5 Some postsecondary 42.2 -2.6 4.4 Bachelor’s degree or more 44.8 — —
School Geographic Locationc
Northeast 63.3 35.4* 30.5* North Central 50.5 22.6* 19.0* South 49.7 21.8* 21.5* West 27.9 — —
Level of Urbanicityc
Urban 33.8 — — Suburban 48.7 14.9* 5.1 Rural 55.1 21.3* 14.0*
Typec
Public 49.5 34.1* 33.3 Other 15.4e — —
Enrollmentc
1 to 599 47.7 — — 600 to 999 56.7 9.0 2.2 1,000 to 1,599 42.4 -5.3 -4.4 1,600 or more 45.6 -2.1 8.3
Percent Receiving Free/Reduced-Price Lunchc
0 47.4e — — 1 to 10 52.8 5.4 -10.3 11 to 50 48.0 0.6 -20.5 51 to 100 35.9 -11.5 -25.8
Behaviors
Student Sent to Office for Misbehaving During Past Semesterc
Yes 49.4 1.6 -4.9 No 47.8 — —

TABLE B.4 (continued)
34
Difference Between Categories (Percentage Points)
Characteristics
Vocational Concentrator
(Percent) Simple Differencea Adjusted Differenceb Sent to Office for School Problems During Past Semesterc
Yes 45.0 -4.1 -2.1 No 49.1 — —
Got into Fight with Another Student During Past Semesterc
Yes 49.4 1.3 7.8 No 48.1 — —
Ever Cuts/Skips Classc
Never/almost never 49.1 — — More frequently 40.4 -8.7 -0.8
Ever Late for School in Past Monthc
Yes 45.2 -2.8 2.9 No 48.0 — —
Time Spent Doing Homework per Weekc
Less than 3 hours 44.9 -3.7 -4.4 3 to 5.5 hours 48.9 0.3 -0.7 More than 5.5 hours 48.6 — —
Talked to Teacher/Counselor About Curricular Program Since Beginning of School Yearc
Yes 53.9 11.7* 10.1* No 42.2 — —
Talked to Teacher/Counselor About Course Taking Since Beginning of School Yearc
Yes 50.2 3.5 -2.7 No 46.7 — —
Parent Parents Attended School Meeting Since Beginning of School Yearc
Yes 47.6 -1.5 4.1 No 49.1 — —
Parents Spoke with Teacher/Counselor Since Beginning of School Yearc
Yes 48.1 -2.3 -2.2 No 50.4 — —
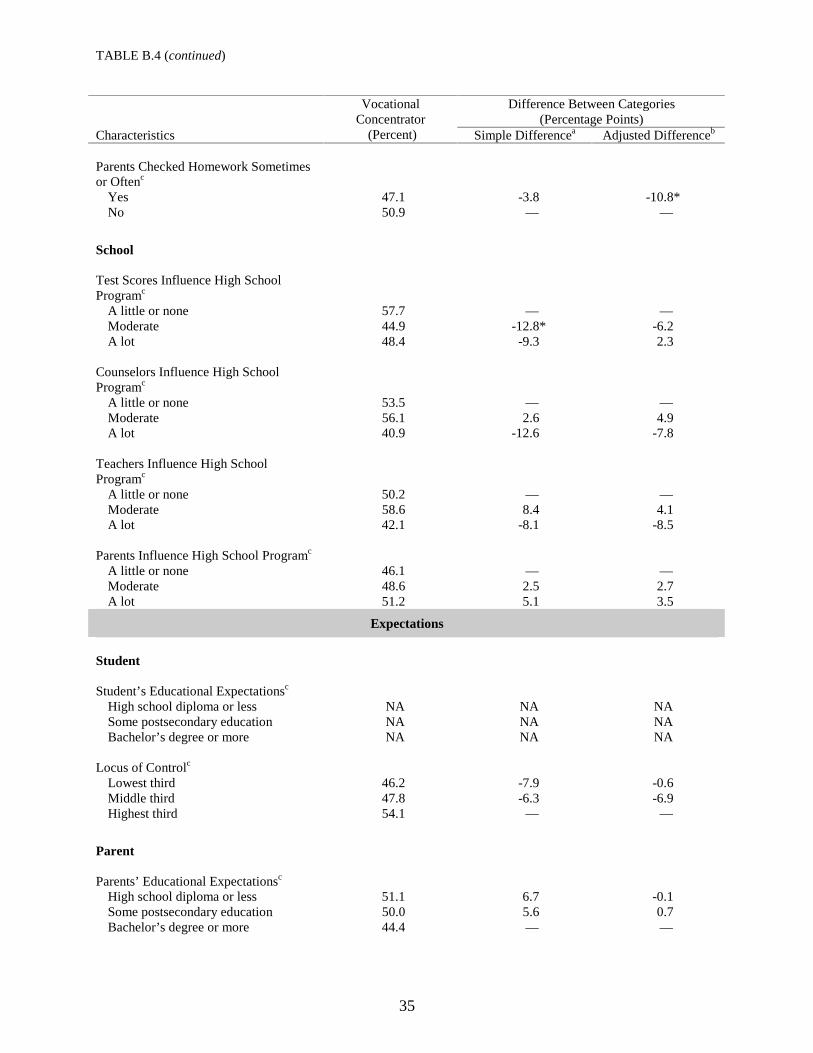
TABLE B.4 (continued)
35
Difference Between Categories (Percentage Points)
Characteristics
Vocational Concentrator
(Percent) Simple Differencea Adjusted Differenceb Parents Checked Homework Sometimes or Oftenc
Yes 47.1 -3.8 -10.8* No 50.9 — —
School Test Scores Influence High School Programc
A little or none 57.7 — — Moderate 44.9 -12.8* -6.2 A lot 48.4 -9.3 2.3
Counselors Influence High School Programc
A little or none 53.5 — — Moderate 56.1 2.6 4.9 A lot 40.9 -12.6 -7.8
Teachers Influence High School Programc
A little or none 50.2 — — Moderate 58.6 8.4 4.1 A lot 42.1 -8.1 -8.5
Parents Influence High School Programc
A little or none 46.1 — — Moderate 48.6 2.5 2.7 A lot 51.2 5.1 3.5
Expectations
Student Student’s Educational Expectationsc
High school diploma or less NA NA NA Some postsecondary education NA NA NA Bachelor’s degree or more NA NA NA
Locus of Controlc
Lowest third 46.2 -7.9 -0.6 Middle third 47.8 -6.3 -6.9 Highest third 54.1 — —
Parent Parents’ Educational Expectationsc
High school diploma or less 51.1 6.7 -0.1 Some postsecondary education 50.0 5.6 0.7 Bachelor’s degree or more 44.4 — —

TABLE B.4 (continued)
36
Difference Between Categories (Percentage Points)
Characteristics
Vocational Concentrator
(Percent) Simple Differencea Adjusted Differenceb School School Requires New Basicsc
Yes 65.7 20.1 7.0 No 45.6 — —
Total Unweighted Sample Size 659
SOURCE: Authors’ calculations based on the National Education Longitudinal Study. Statistics were computed
using sample weights. NOTE: Vocational concentrator includes students who completed three or more credits of vocational courses in a
single occupational area. Student and parent characteristics were measured at the end of the eighth-grade, whereas school characteristics were measured at the end of the tenth-grade.
aEquals the difference in participation rates between each characteristic and the reference category within each characteristic. A dash is used to indicate the reference category within each characteristic.
bEquals the average marginal effect based on parameter estimates of a logit model, which regressed whether or not a student was a vocational concentrator on all of the characteristics in the table.
cDue to missing values, statistics for this characteristic are based on less than the total sample size of 9,135. However, none of the statistics are based on less than 85 percent of the total sample size.
d This variable measures how many of the “at risk of school failure” factors were present for the sample members in 1988. The factors include: parent is single, parent has no high school diploma, limited English proficiency, income less than $15,000, sibling dropped out of high school, and home alone more than three hours a day.
e Result is questionable because the statistic is based on fewer than 30 students. *Significantly different from zero at the .05 level, two-tailed test. An adjusted difference was considered statistically significant if the logit coefficient was statistically significant. The complex sample design of the NELS was taken into consideration when statistical tests were conducted.
NA indicates not applicable because the subgroup only contains students with this characteristic.

37
TABLE B.5
PERCENT OF VOCATIONAL INVESTORS AMONG 1992 HIGH SCHOOL GRADUATES
Difference Between Categories
(Percentage Points) Characteristics
Vocational Investor
(Percent) Simple Differencea Adjusted Differenceb
Total 38.8
Demographics
Student Sex
Male 43.6 9.5* 7.4* Female 34.1 — —
Race/Ethnicity
White/Other 38.1 — — Black 41.7 3.6 -2.0 Hispanic 41.4 3.3 -3.4
Socioeconomic Status
1st quartile (lowest) 55.2 34.9* 16.2* 2nd quartile 43.7 23.4* 10.8* 3rd quartile 35.8 15.5* 9.0* 4th quartile (highest) 20.3 — —
Student has a Disability According to Parent/Teacherc
Yes 51.8 13.9* 3.3 No 37.9 — —
Ever Held Backc
Yes 51.6 15.2* 1.8 No 36.4 — —
Number of Risk Factorsd
0 34.9 — — 1 43.2 8.3* 0.5 2 or more 48.9 14.0* -3.0
Took Advanced Math During 8th-Gradec
Yes 34.6 -7.0* 0.3 No 41.6 — —
Took Advanced English During 8th- Gradec
Yes 34.6 -5.9* -2.9 No 40.5 — —
8th-Grade Math Test Scorec
Lowest third 49.8 24.2* 4.3* Middle third 41.0 15.4* 4.9* Highest third 25.6 — —

TABLE B.5 (continued)
38
Difference Between Categories (Percentage Points)
Characteristics
Vocational Investor
(Percent) Simple Differencea Adjusted Differenceb 8th-Grade Reading Test Scorec
Lowest third 51.4 27.2* 9.7* Middle third 41.0 16.8* 7.5* Highest third 24.2 — —
Parent Mother’s Educationc
High school diploma or less 47.4 21.8* 0.4 Some postsecondary 33.9 8.3* -1.5 Bachelor’s degree or more 25.6 — —
School Geographic Locationc
Northeast 32.7 -2.8 -2.2 North Central 45.1 9.6* 6.0* South 39.3 3.8 1.1 West 35.5 — —
Level of Urbanicityc
Urban 30.7 — — Suburban 35.9 5.2* -0.6 Rural 49.7 19.0* 3.6
Typec
Public 42.1 31.9* 25.4* Other 10.2 — —
Enrollmentc
1 to 599 44.6 — — 600 to 999 37.6 -7.0* -5.0* 1,000 to 1,599 37.2 -7.4* -6.7* 1,600 or more 36.1 -8.5* -6.1*
Percent Receiving Free/Reduced-Price Lunchc
0 15.0 — — 1 to 10 36.1 21.1* 5.2 11 to 50 47.4 32.4* 6.7 51 to 100 47.8 32.8* 5.8
Behaviors
Student Sent to Office for Misbehaving During Past Semesterc
Yes 46.8 10.6* 0.8 No 36.2 — —

TABLE B.5 (continued)
39
Difference Between Categories (Percentage Points)
Characteristics
Vocational Investor
(Percent) Simple Differencea Adjusted Differenceb Sent to Office for School Problems During Past Semesterc
Yes 49.8 11.8* 2.6 No 38.0 — —
Got into Fight with Another Student During Past Semesterc
Yes 47.6 10.6* 2.2 No 37.0 — —
Ever Cuts/Skips Classc
Never/almost never 37.7 — — More frequently 49.6 11.9* 2.4
Ever Late for School in Past Monthc
Yes 38.8 0.6 0.4 No 38.2 — —
Time Spent Doing Homework per Weekc
Less than 3 hours 44.4 11.7* 2.2 3 to 5.5 hours 38.7 6.0* 0.6 More than 5.5 hours 32.7 — —
Talked to Teacher/Counselor About Curricular Program Since Beginning of School Yearc
Yes 39.0 0.5 3.2* No 38.5 — —
Talked to Teacher/Counselor About Course Taking Since Beginning of School Yearc
Yes 38.3 -1.3 -3.6* No 39.6 — —
Parent Parents Attended School Meeting Since Beginning of School Yearc
Yes 33.4 -12.4* -2.6 No 45.8 — —
Parents Spoke with Teacher/Counselor Since Beginning of School Yearc
Yes 37.0 -3.0 0.2 No 40.0 — —
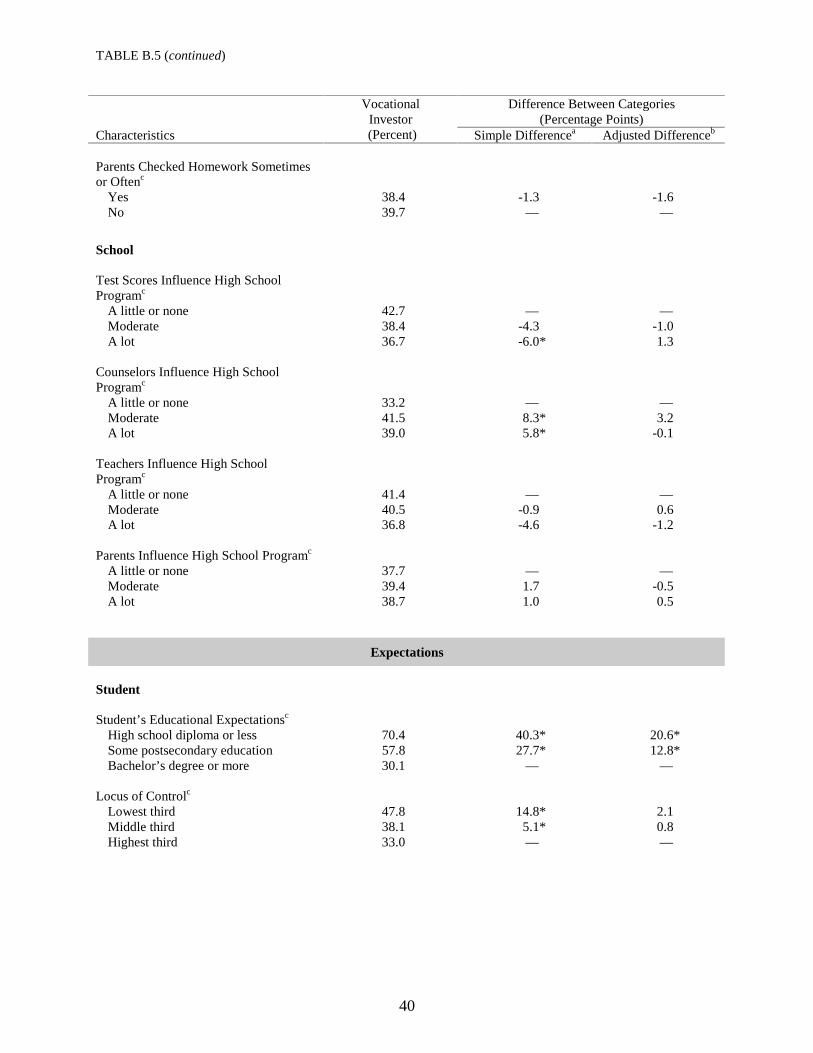
TABLE B.5 (continued)
40
Difference Between Categories (Percentage Points)
Characteristics
Vocational Investor
(Percent) Simple Differencea Adjusted Differenceb Parents Checked Homework Sometimes or Oftenc
Yes 38.4 -1.3 -1.6 No 39.7 — —
School Test Scores Influence High School Programc
A little or none 42.7 — — Moderate 38.4 -4.3 -1.0 A lot 36.7 -6.0* 1.3
Counselors Influence High School Programc
A little or none 33.2 — — Moderate 41.5 8.3* 3.2 A lot 39.0 5.8* -0.1
Teachers Influence High School Programc
A little or none 41.4 — — Moderate 40.5 -0.9 0.6 A lot 36.8 -4.6 -1.2
Parents Influence High School Programc
A little or none 37.7 — — Moderate 39.4 1.7 -0.5 A lot 38.7 1.0 0.5
Expectations
Student Student’s Educational Expectationsc
High school diploma or less 70.4 40.3* 20.6* Some postsecondary education 57.8 27.7* 12.8* Bachelor’s degree or more 30.1 — —
Locus of Controlc
Lowest third 47.8 14.8* 2.1 Middle third 38.1 5.1* 0.8 Highest third 33.0 — —
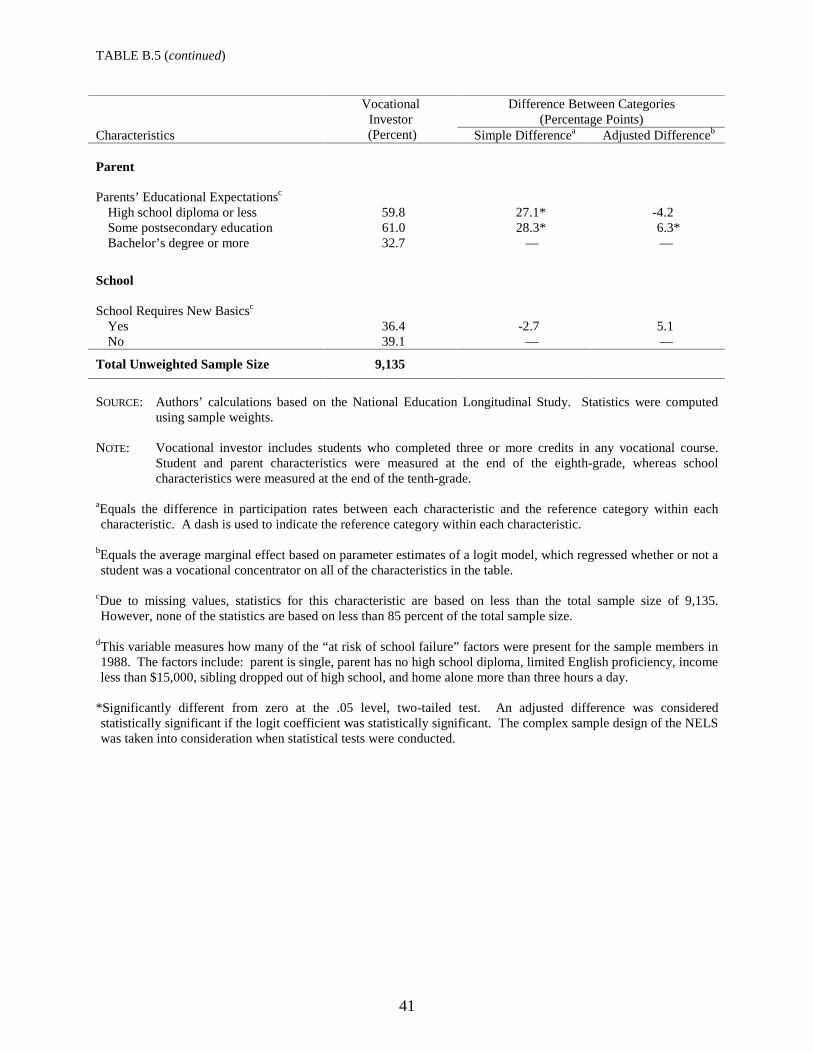
TABLE B.5 (continued)
41
Difference Between Categories (Percentage Points)
Characteristics
Vocational Investor
(Percent) Simple Differencea Adjusted Differenceb Parent Parents’ Educational Expectationsc
High school diploma or less 59.8 27.1* -4.2 Some postsecondary education 61.0 28.3* 6.3* Bachelor’s degree or more 32.7 — —
School School Requires New Basicsc
Yes 36.4 -2.7 5.1 No 39.1 — —
Total Unweighted Sample Size 9,135
SOURCE: Authors’ calculations based on the National Education Longitudinal Study. Statistics were computed
using sample weights. NOTE: Vocational investor includes students who completed three or more credits in any vocational course.
Student and parent characteristics were measured at the end of the eighth-grade, whereas school characteristics were measured at the end of the tenth-grade.
aEquals the difference in participation rates between each characteristic and the reference category within each characteristic. A dash is used to indicate the reference category within each characteristic.
bEquals the average marginal effect based on parameter estimates of a logit model, which regressed whether or not a student was a vocational concentrator on all of the characteristics in the table.
cDue to missing values, statistics for this characteristic are based on less than the total sample size of 9,135. However, none of the statistics are based on less than 85 percent of the total sample size.
d This variable measures how many of the “at risk of school failure” factors were present for the sample members in 1988. The factors include: parent is single, parent has no high school diploma, limited English proficiency, income less than $15,000, sibling dropped out of high school, and home alone more than three hours a day.
*Significantly different from zero at the .05 level, two-tailed test. An adjusted difference was considered statistically significant if the logit coefficient was statistically significant. The complex sample design of the NELS was taken into consideration when statistical tests were conducted.
42
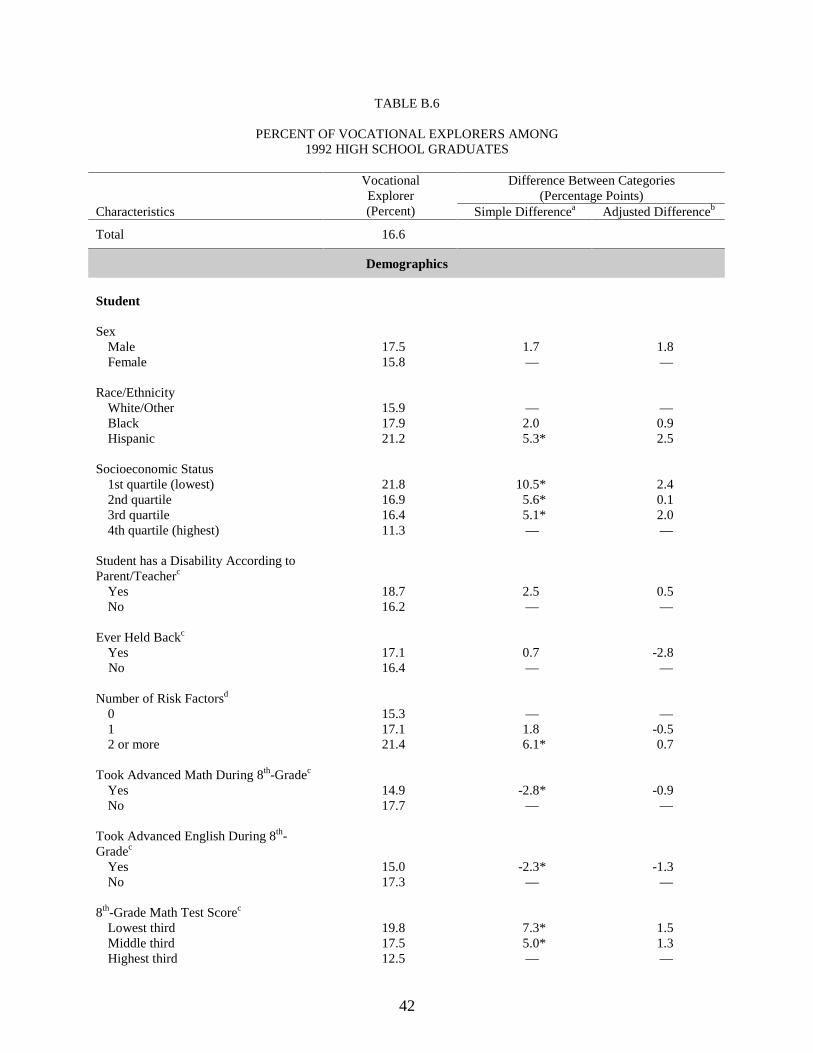
TABLE B.6
PERCENT OF VOCATIONAL EXPLORERS AMONG 1992 HIGH SCHOOL GRADUATES
Difference Between Categories
(Percentage Points) Characteristics
Vocational Explorer (Percent) Simple Differencea Adjusted Differenceb
Total 16.6
Demographics
Student Sex
Male 17.5 1.7 1.8 Female 15.8 — —
Race/Ethnicity
White/Other 15.9 — — Black 17.9 2.0 0.9 Hispanic 21.2 5.3* 2.5
Socioeconomic Status
1st quartile (lowest) 21.8 10.5* 2.4 2nd quartile 16.9 5.6* 0.1 3rd quartile 16.4 5.1* 2.0 4th quartile (highest) 11.3 — —
Student has a Disability According to Parent/Teacherc
Yes 18.7 2.5 0.5 No 16.2 — —
Ever Held Backc
Yes 17.1 0.7 -2.8 No 16.4 — —
Number of Risk Factorsd
0 15.3 — — 1 17.1 1.8 -0.5 2 or more 21.4 6.1* 0.7
Took Advanced Math During 8th-Gradec
Yes 14.9 -2.8* -0.9 No 17.7 — —
Took Advanced English During 8th- Gradec
Yes 15.0 -2.3* -1.3 No 17.3 — —
8th-Grade Math Test Scorec
Lowest third 19.8 7.3* 1.5 Middle third 17.5 5.0* 1.3 Highest third 12.5 — —
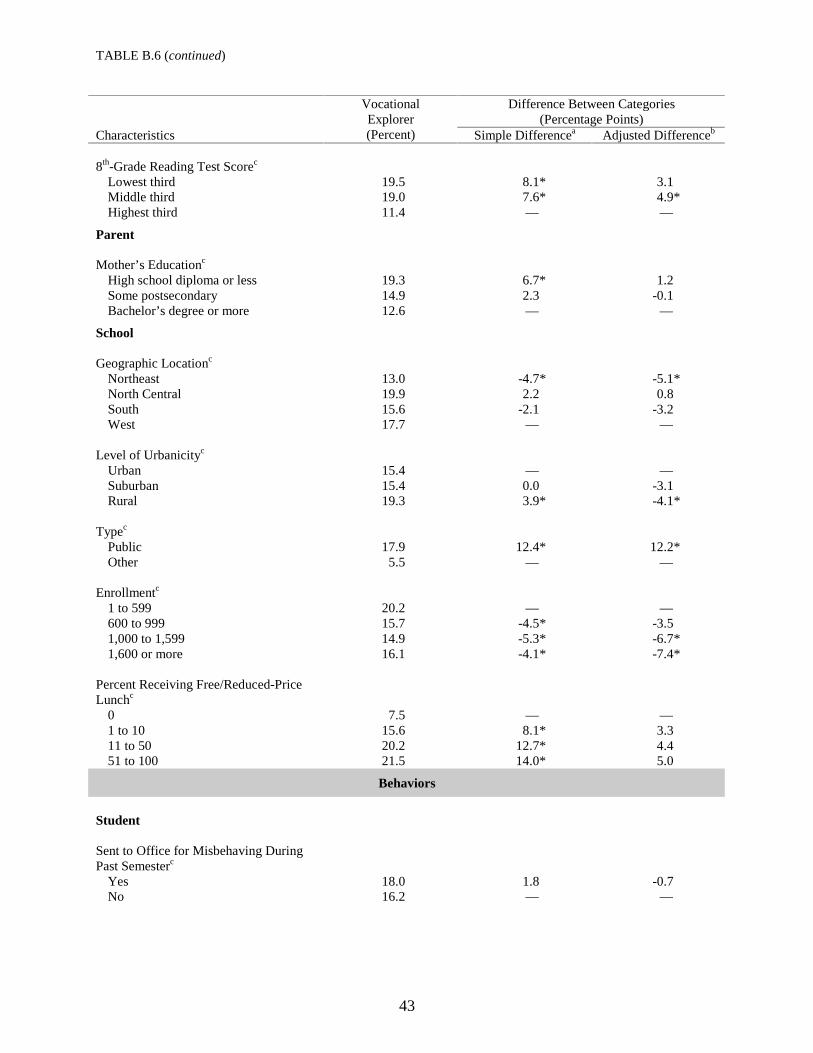
TABLE B.6 (continued)
43
Difference Between Categories (Percentage Points)
Characteristics
Vocational Explorer (Percent) Simple Differencea Adjusted Differenceb
8th-Grade Reading Test Scorec
Lowest third 19.5 8.1* 3.1 Middle third 19.0 7.6* 4.9* Highest third 11.4 — —
Parent Mother’s Educationc
High school diploma or less 19.3 6.7* 1.2 Some postsecondary 14.9 2.3 -0.1 Bachelor’s degree or more 12.6 — —
School Geographic Locationc
Northeast 13.0 -4.7* -5.1* North Central 19.9 2.2 0.8 South 15.6 -2.1 -3.2 West 17.7 — —
Level of Urbanicityc
Urban 15.4 — — Suburban 15.4 0.0 -3.1 Rural 19.3 3.9* -4.1*
Typec
Public 17.9 12.4* 12.2* Other 5.5 — —
Enrollmentc
1 to 599 20.2 — — 600 to 999 15.7 -4.5* -3.5 1,000 to 1,599 14.9 -5.3* -6.7* 1,600 or more 16.1 -4.1* -7.4*
Percent Receiving Free/Reduced-Price Lunchc
0 7.5 — — 1 to 10 15.6 8.1* 3.3 11 to 50 20.2 12.7* 4.4 51 to 100 21.5 14.0* 5.0
Behaviors
Student Sent to Office for Misbehaving During Past Semesterc
Yes 18.0 1.8 -0.7 No 16.2 — —

TABLE B.6 (continued)
44
Difference Between Categories (Percentage Points)
Characteristics
Vocational Explorer (Percent) Simple Differencea Adjusted Differenceb
Sent to Office for School Problems During Past Semesterc
Yes 18.3 1.8 -0.5 No 16.5 — —
Got into Fight with Another Student During Past Semesterc
Yes 18.2 1.9 0.6 No 16.3 — —
Ever Cuts/Skips Classc
Never/almost never 16.4 — — More frequently 17.9 1.5 -1.3
Ever Late for School in Past Monthc
Yes 17.0 0.6 0.9 No 16.4 — —
Time Spent Doing Homework per Weekc
Less than 3 hours 18.3 3.2* 0.8 3 to 5.5 hours 16.5 1.4 -0.1 More than 5.5 hours 15.1 — —
Talked to Teacher/Counselor About Curricular Program Since Beginning of School Yearc
Yes 16.9 0.8 2.3* No 16.1 — —
Talked to Teacher/Counselor About Course Taking Since Beginning of School Yearc
Yes 16.2 -1.0 -2.3* No 17.2 — —
Parent Parents Attended School Meeting Since Beginning of School Yearc
Yes 15.3 -2.9* -0.1 No 18.2 — —
Parents Spoke with Teacher/Counselor Since Beginning of School Yearc
Yes 16.4 0.3 1.4 No 16.1 — —

TABLE B.6 (continued)
45
Difference Between Categories (Percentage Points)
Characteristics
Vocational Explorer (Percent) Simple Differencea Adjusted Differenceb
Parents Checked Homework Sometimes or Oftenc
Yes 16.4 -0.6 -1.2 No 17.0 — —
School Test Scores Influence High School Programc
A little or none 18.7 — — Moderate 16.1 -2.6 -1.6 A lot 15.5 -3.2 -0.6
Counselors Influence High School Programc
A little or none 13.9 — — Moderate 17.6 3.7* 2.3 A lot 16.7 2.8 1.4
Teachers Influence High School Programc
A little or none 17.1 — — Moderate 17.3 0.2 0.8 A lot 15.7 -1.4 0.1
Parents Influence High School Programc
A little or none 16.6 — — Moderate 17.0 0.4 -0.3 A lot 15.9 -0.7 -1.2
Expectations
Student Student’s Educational Expectationsc
High school diploma or less 22.2 8.1* 3.0 Some postsecondary education 23.3 9.2* 3.9* Bachelor’s degree or more 14.1 — —
Locus of Controlc
Lowest third 19.6 5.3* 2.1 Middle third 16.8 2.5* 1.3 Highest third 14.3 — —
Parent Parents’ Educational Expectationsc
High school diploma or less 17.5 2.9 -3.4 Some postsecondary education 24.6 10.0* 3.3 Bachelor’s degree or more 14.6 — —

TABLE B.6 (continued)
46
Difference Between Categories (Percentage Points)
Characteristics
Vocational Explorer (Percent) Simple Differencea Adjusted Differenceb
School School Requires New Basicsc
Yes 14.1 -2.8 1.2 No 16.9 — —
Total Unweighted Sample Size 9,135
SOURCE: Authors’ calculations based on the National Education Longitudinal Study. Statistics were computed
using sample weights. NOTE: Vocational explorer includes students who completed three or more credits of vocational courses, but not in a single occupational area. Student and parent characteristics were measured at the end of the eighth-grade, whereas school characteristics were measured at the end of the tenth-grade. aEquals the difference in participation rates between each characteristic and the reference category within each characteristic. A dash is used to indicate the reference category within each characteristic.
bEquals the average marginal effect based on parameter estimates of a logit model, which regressed whether or not a student was a vocational concentrator on all of the characteristics in the table.
cDue to missing values, statistics for this characteristic are based on less than the total sample size of 9,135. However, none of the statistics are based on less than 85 percent of the total sample size.
d This variable measures how many of the “at risk of school failure” factors were present for the sample members in 1988. The factors include: parent is single, parent has no high school diploma, limited English proficiency, income less than $15,000, sibling dropped out of high school, and home alone more than three hours a day.
*Significantly different from zero at the .05 level, two-tailed test. An adjusted difference was considered statistically significant if the logit coefficient was statistically significant. The complex sample design of the NELS was taken into consideration when statistical tests were conducted.