Embed Size (px)
Citation preview

Factors that influence
post-16 participation in
mathematics and
physicsTamjid Mujtaba, Celia Hoyles, Michael Reiss,
Bijan Riazi-Farzad, Melissa Rodd, Shirley
Simon & Fani Stylianidou.
Funded by ESRC

Aims and Objectives
To identify range of factors (individual, school
and out-of-school, including home) that
influence post-16 participation in mathematics
& physics
To assess the relative importance of such
factors among different student populations
• What attracts some students?
• Why do some students reject these subjects even if
they are good at them?
• How might we engage more students in these
subjects?2
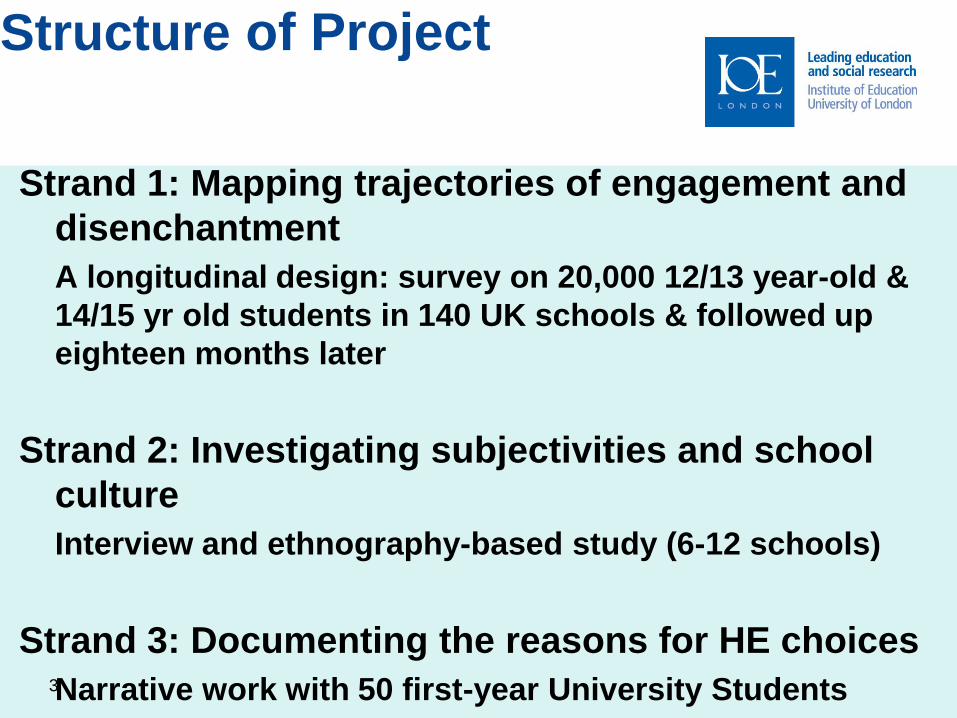
Structure of Project
Strand 1: Mapping trajectories of engagement and
disenchantment
A longitudinal design: survey on 20,000 12/13 year-old &
14/15 yr old students in 140 UK schools & followed up
eighteen months later
Strand 2: Investigating subjectivities and school
culture
Interview and ethnography-based study (6-12 schools)
Strand 3: Documenting the reasons for HE choices
Narrative work with 50 first-year University Students3

STRAND 1 SAMPLE
Sample of approximately 20,000 students in two year
groups (aged 12-13 & 14-15) for whom we have
collected data in England, Wales, Scotland and Ireland
For this presentation, two core datasets from England
• survey responses (student & school) year 10 students
(aged 14-15)
one mathematics, one physics
Current multi-level models
• 1881 students in 63 schools (physics)
• 2384 students in 75 schools (mathematics) 4

UPMAP instruments
The student questionnaire
5

Core Content Items (Mathematics)
Understanding Participation rates in post-16
Mathematics And Physics (UPMAP)
Strand 1
Mapping trajectories of
engagement and
disenchantment

Core Content Items (Mathematics)
Understanding Participation rates in post-16
Mathematics And Physics (UPMAP)
Strand 1
Mapping trajectories of
engagement and
disenchantment

Core Content Items (Physics – Y8)
Understanding Participation rates in post-16
Mathematics And Physics (UPMAP)
Strand 1
Mapping trajectories of
engagement and
disenchantment

Core Content Items (Physics – Y10)
Understanding Participation rates in post-16
Mathematics And Physics (UPMAP)
Strand 1
Mapping trajectories of
engagement and
disenchantment

10
Construct N of items
Self concept Physics .821 12
Maths
Advice pressure to study Physics .853 5
Maths .839
Intrinsic value Physics .801 7
Maths .758
Extrinsic value Physics .863 9 Maths .776
Attitude to and perceptions of math/physics lessons Physics .592 5
Maths .582
Perception of teachers Physics .858 14
Maths .845
Sense of school belonging Physics .828 6
Maths .840 Emotional stability Physics .700 6
Maths .708
Competitiveness Physics .707 9
Maths .727
Introversion Physics .604 4
Maths .618
Home support for achievement Physics .621 8 Maths .602
Home support for achievement in general Physics .852 3
Maths .892
Relationship with parents Physics .743 4
Maths .783
Engagement with ICT Physics .575 6
Maths .609 Social support Physics .637 6
Maths .611
Global Motivation & aspiration Physics .733 4
Maths .710
UPMAP instruments – the school
questionnaire
11

12
Description of item/ CORE CONSTRUCT From questionnaire
Extent of informal & formal internal collaboration Item F19 (QUAL) Item G1 (SA) Item G4(SA)
Number of students taking post 16 maths & physics courses Item F 23 (SA) Item 24 (SA)
Awareness of the issues of post-16 engagement Item E 1- 3, 5 (QUAL) Item 6 (QUANT) Item F 20 (SA)
Engaged in enrichment activities to promote post-16 engagement Item B2 (QUANT) Item E 4 (QUANT & QUAL) Item B 1a (SA) Item B 1b (QUAL)
Schools with policies that promote continuation Item F 21(SA) Item 22 (QUAL) Item 26,29,28, 27, 30,31a (QUAL) Item C30, C31 (QUANT) Item G2- G3 (QUANT)
Schools that value mathematics & physics teachers (CPD) Item C 10 (SA) **Item F 6,7 (QUANT) Item I 1- 9 (QUANT) Item G5 (SA)
Schools that ensure good careers advice are in place Item H 1-3 (QUANT)
Schools with adequate and stable mathematics & physics staffing Item C 1-3, 11, (QUANT) **Item F 8, 9(QUANT) Item F 17 (SA)
Priorities of maths & physics department Item F 14 (SA) Item F 14 (QUAL) Item F 15, Item 16 (SA) Item 18 (QUAL)
How schools deploy maths & physics staffing Item F 1 (SA) Item F2 (QUAL) Item F3-5 (QUANT) **Item F8-9 (QUANT) Item F10 (QUAL) Item F11 (QUAL) Item F12 (QUAL)
Explore whether schools have adequate mathematics & physics resource Item C 4-9. 11. 12
Qualitative approach of schools with adequate mathematics & physics resource Item D (QUAL) Item F 13 (SA)
Background information on the teacher who filled in the questionnaire Item A1-A9

Current dataset
Student survey data is matched to the
– National Student Database (NPD)
– Student Level Annual School Census (PLASC)
– school survey responses.
PLASC & NPD datasets hold information on
• students’ attainment records at age 7 and 11
• background details on students such as gender,
eligibility for free school meals, ethnicity. 13

Student characteristics
14
Mathematics Year 10
Physics Year 10
% %
Year the students expect to take GCSE
9 0.5 0.9
10 24.8 36.8
11 74.7 62.2
Whether the student intends to continue studies after age 16
Yes 94.3 93.7
No 5.7 6.3
Ethnicity
White UK heritage 63.1 83.4
Any Black 1.4 2.2
Any Asian, Bangladeshi, group 2.8 4.0
Chinese 0.0 0.0
Indian 3.0 2.8
Black and White mixed 0.4 0.7 White and Asian mixed 0.7 0.8
Other 0.0 6.1
Gender
Female 54.0 44.7
Male 46.0 55.3
FSM
No FSM 94.5 94.8
FSM 5.5 5.2
No. of Siblings
1 50.9 49.3
2 31.3 29.2
3 12.9 11.9
4+ 5.0 9.3
Fathers SES
Professional 33.3 33.2
Clerical and skilled non-manual 10.5 11.0
Senior official 4.4 6.2
Store worker 3.4 2.9
Skilled manual worker 27.2 28.2 Semi-skilled manual 2.7 2.3
Unskilled worker 4.9 4.3
Homemaker 0.7 0.8
Don’t know 9.5 8.1
Unemployed 3.4 3.1
Mothers SES
Professional 31.3 33.6
Clerical and skilled non-manual 22.6 22.6
Senior official 1.4 1.5
Store worker 6.4 5.6
Skilled manual worker 3.4 3.8
Semi-skilled manual 8.9 8.7
Unskilled worker 3.6 3.5
Homemaker 11.3 11.2
Don’t know 6.1 5.6
Unemployed 5.0 3.8

Characteristics of schools
15
Year 10 sample
%
Segmentation by attainment & participation rate of school
High attainment, high staying-on 44.9
High attainment, average staying-on 15.8
High attainment, low staying-on 5.8
Low attainment, high staying-on 5.9
Low attainment, average staying-on 13.0
Low attainment, low staying-on 14.6
Segmentation by mathematics & physics participation rate of school
High maths, low physics 4.1
Low maths, high physics 2.1
Low maths, low physics 19.8
Average maths, average physics 22.4
High maths, high physics 51.7
Admission policy of the school
Comprehensive 82.0
Selective 14.8
Modern 3.2
Gender of the school
Boys 9.8
Girls 21.0
Mixed 69.2

Intention to Participate in
mathematics and physics
• More students reported that they were not intending to
study physics post-16 compared to those that were.
• More students reported that they were intending to study
mathematics post-16 compared to those that reported
they were not.
• In physics strong agreement in intention to participate is
just over three times as likely amongst boys than girls.
• For mathematics the gender bias in intention to
participate was not as large as the differences seen in
physics.
16
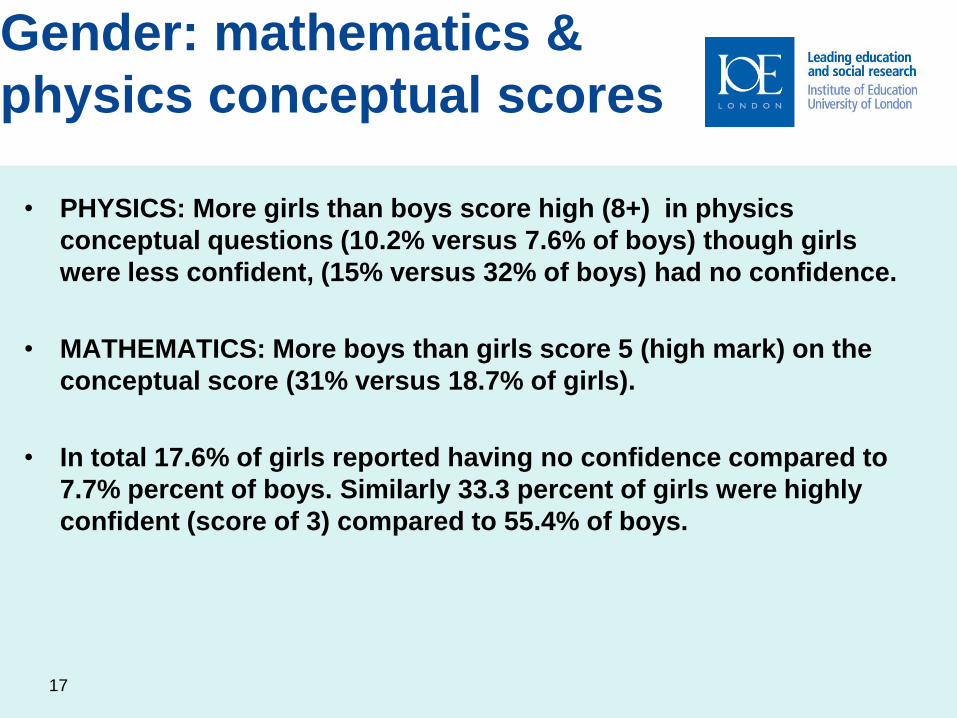
Gender: mathematics &
physics conceptual scores
• PHYSICS: More girls than boys score high (8+) in physics
conceptual questions (10.2% versus 7.6% of boys) though girls
were less confident, (15% versus 32% of boys) had no confidence.
• MATHEMATICS: More boys than girls score 5 (high mark) on the
conceptual score (31% versus 18.7% of girls).
• In total 17.6% of girls reported having no confidence compared to
7.7% percent of boys. Similarly 33.3 percent of girls were highly
confident (score of 3) compared to 55.4% of boys.
17

Bi-Variate analysis
Positive statistically significant (p<0.01) correlations with
intentions to participate post-16 in mathematics &
physics
• students’ self concept in mathematics & physics
• family, teacher and peer pressure to study
• students’ global motivations and aspirations
• student organizational skills
• attainment at age 11 in mathematics & science
• home support of study in general & subject specific
• intrinsic reasons
• extrinsic reasons
18

Multi-level analysis
School variables
• Engagement in external projects (for mathematics not physics)
• Specialist teachers (for physics not mathematics) & only at KS3
(age 13/14)
Student variables
• Males were on average more likely to express an intention to
participate in both subjects post-16, though in the physics model
gender lost significance after controlling for some key school
level influences.
• Attainment (for mathematics not physics).
• Indian heritage (for mathematics not physics).
• Perception of mathematics (for mathematics not physics).19
Core differences between mathematics and
physics multilevel participation models

Multi-level analysis
• Students’ extrinsic motivation
• Confidence in conceptual tasks
• Subject-specific self concept
20
Core similarities between mathematics and
physics multilevel participation models
Multi-level analysis
21
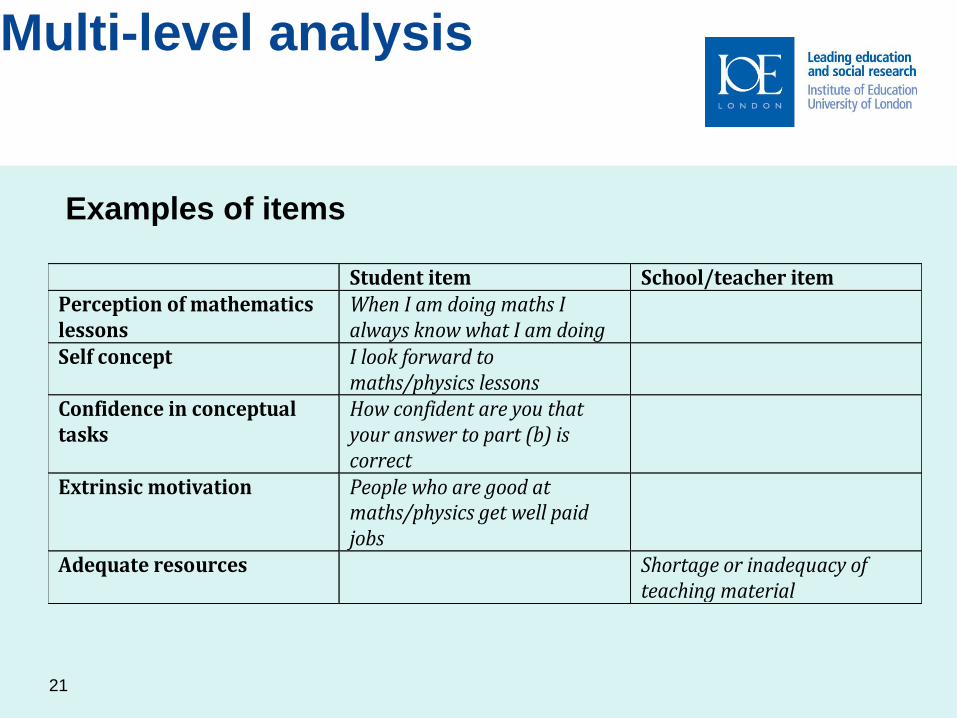
Student item School/teacher item Perception of mathematics lessons
When I am doing maths I always know what I am doing
Self concept I look forward to maths/physics lessons
Confidence in conceptual tasks
How confident are you that your answer to part (b) is correct
Extrinsic motivation People who are good at maths/physics get well paid jobs
Adequate resources Shortage or inadequacy of teaching material
Examples of items

Multi-level analysis
• The physics model without explanatory variables: 90% of all
variation in the outcome is at the student level & 10% at the
school level.
• The mathematics model without explanatory variables: 92.56% of
all variation in the outcome is at the student level & 7.43% at the
school level.
• The Physics final model to date: The final model explains 91% of
all variance at the school level & 35% of all variance at the student
level.
• The Mathematics final model to date: The final model explains
77% of all variance at the school level & 30% of all variance at the
student level22
Variance at student and school level.

Multi-level analysis
• Students socio-economic status (FSM & IDACI)
• Black heritage less likely to state an intention to participate in
physics. For attainment we found those of Asian heritage, Black
heritage, other heritage and Indian heritage were less likely to do
well.
• Competitiveness predictor of attainment (physics only) not
participation (either subject).
• Score in conceptual tasks (attainment not participation).
• Confidence in conceptual tasks (both attainment & participation).
• The self concept (both attainment & participation).
23
exploring the outcome variable attainment at age 11

Multi-level analysis
• Perhaps conceptual ability is confounded in some way with
school level measures and thus cause the non significant result
between conceptual tasks and intention to participate.
• Research to tease out differing relationships in explaining
intention and attainment & their inter-relationship – in strand 2 &
next survey (in one year)
• Why is having specialist teachers more important at KS3 than at
KS4?
• Perhaps schools are better at eradicating differences in intention
to study between different SES groups:- school influences need
to be tailored more towards bridging the gap between intention to
participate and actual ability.
• Differential effects between schools?24
Implications

Multi-level analysis
25
Schools’ residual classification
Physics n %
Mathematics n %
Significant positive * 1 1.58 1 1.33
Positive/not significant but within the expected range 30 47.61 43 57.33
Negative/not significant but within the expected range 32 50.79 27 36.00
Significant negative* 0 0.00 4 5.33
* p<0.05
Variation between Schools
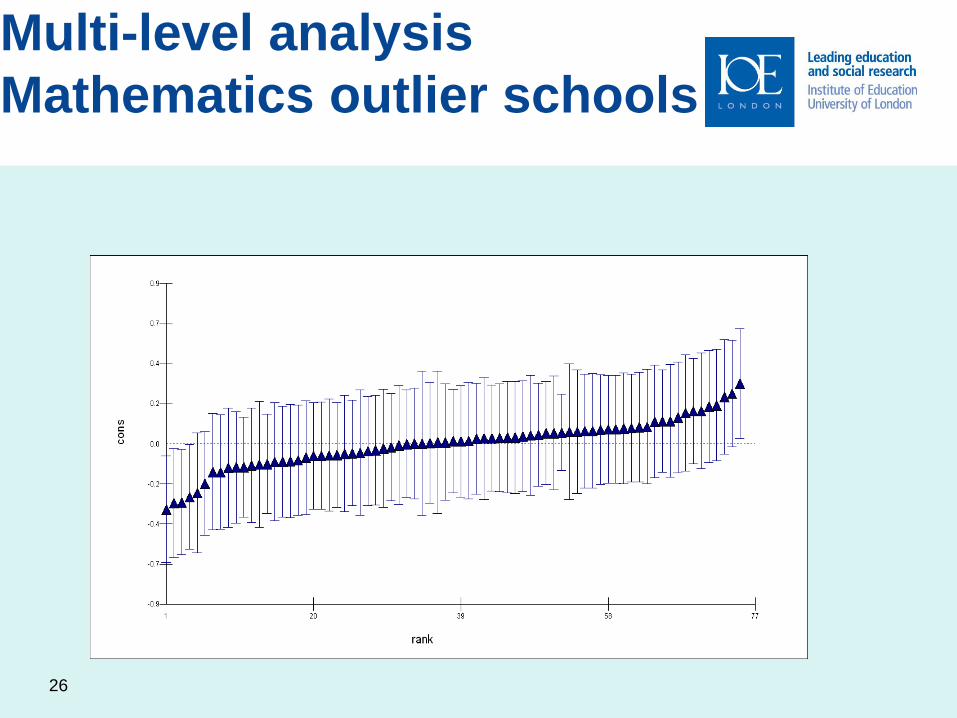
Multi-level analysis
Mathematics outlier schools
26

Multi-level analysis
Physics outlier school
27

Multi-level analysis
Mathematics outlier school
28
•75-100% classes contain specialist mathematics
teachers at KS3 & KS4
•Non selective, mixed above post-16 progression
rate
•Engages in external collaboration
•Teachers had good opportunities for CPD
•The school was good at ensuring career advice
•Fair amount of enrichment activities for students
•Stable staffing
•Good resources to teach mathematics

Qualitative work
beginnings of triangulation
• A shy, introvert 15 yr girl, loves physics, wants to study post 16
mathematics & physics
• The school was a mixed gender, high ability, high physics
participation school in an affluent area, that selects on ability
tests at age 10-11.
• Not typical examples of why physics practicals interesting.
• Needed to study mathematics for access to career path
• Studying physics because she liked it & was engaged.
• Family influences to study physics (early age).
29
Jane

30
For further information on
UPMAP
http://www.ioe.ac.uk/study/departments/gems/4814.html
Or email: [email protected]
Institute of EducationUniversity of London20 Bedford WayLondon WC1H 0AL
Tel +44 (0)20 7612 6000Fax +44 (0)20 7612 6126Email [email protected] www.ioe.ac.uk


![Post 2015 participation guide [EN]](https://img.dokumen.tips/doc/110x75/579057ba1a28ab900c9e7a1c/post-2015-participation-guide-en.jpg)


