Embed Size (px)
Citation preview

Clemson UniversityTigerPrints
All Theses Theses
12-2017
Factors Influencing Consumer Preferences forTangible and Intangible Seafood Characteristicsand Community Supported Fishery MarketingOutletsEnglish Lane RatliffClemson University
Follow this and additional works at: https://tigerprints.clemson.edu/all_theses
This Thesis is brought to you for free and open access by the Theses at TigerPrints. It has been accepted for inclusion in All Theses by an authorizedadministrator of TigerPrints. For more information, please contact [email protected].
Recommended CitationRatliff, English Lane, "Factors Influencing Consumer Preferences for Tangible and Intangible Seafood Characteristics and CommunitySupported Fishery Marketing Outlets" (2017). All Theses. 2772.https://tigerprints.clemson.edu/all_theses/2772

FACTORS INFLUENCING CONSUMER PREFERENCES FOR TANGIBLE AND INTANGIBLE SEAFOOD CHARACTERISTICS AND COMMUNITY SUPPORTED
FISHERY MARKETING OUTLETS
A Thesis Presented to
the Graduate School of Clemson University
In Partial Fulfillment of the Requirements for the Degree
Master of Science Plant and Environmental Sciences
by English Lane Ratliff
December 2017
Accepted by: Dr. Michael Vassalos, Committee Chair
Dr. Marzieh Motallebi Committee Co-Chair Dr. Charles Privette

ii
ABSTRACT
This study utilized an online survey administered to Kentucky and South Carolina in
conjunction with discrete choice modeling to examine: i) the impact of several factors
including demographic characteristics, purchasing behaviors, and frequency of seafood
consumption on consumer’s preferences for specific seafood attributes (e.g. fresh over frozen,
wild-caught over farm-raised), ii) the impact of the aforementioned consumer characteristics,
on the probability that an individual will be interested in joining a CSF arrangement in the
future.
The results indicate that demographic characteristics, and lifestyle preferences have a
statistically significant effect on consumer’s preferences for both tangible and intangible
seafood characteristics. However, divergences remain. For example, findings indicate that
female consumers are more likely to have their purchasing decisions entirely influenced by
sustainability but it is not a statistically significant parameter for fresh vs. frozen preferences.
Similarly, respondents who attended graduate school are more likely to let seafood
characteristics other than price affect their purchasing decisions but education has no
statistically significant effect on fresh vs frozen preferences. Furthermore, respondents who
grew up within 50 miles from the coast, or are reside in South Carolina are more likely to
prefer fresh seafood products. These findings have important marketing implications as
competition in the seafood industry increases. It can assist the industry to better target their
marketing endeavors and better understand the factors influencing consumer preferences.
Regarding CSF membership, the findings indicate consumers who have children under
18 in the household are more likely to join a CSF. Likewise, consumers who shop at farmer’s
markets for groceries are more likely to join a CSF. However, most of the other factors

iii
examined did not have a statistically significant effect on the probability that a consumer will
join a CSF. These results may indicate that despite the recent growth in the CSF industry,
attracting new members is a very challenging endeavor. Thus, fishermen should not focus all
their marketing attention on CSFs.
Keywords: Seafood, Tangible and Intangible Seafood Characteristics, Community Supported
Fisheries, Ordered Probit Model, Multinomial Logit Model

iv
ACKNOWLEDGEMENTS
I would like to extend my sincerest thanks to those who have supported me as I
have strived to fulfil my dreams of completing my masters at Clemson University. Without
their unwavering support, helpful guidance, and personal wisdom, this thesis would not be
complete.
First and foremost, I would like to thank my graduate advisor and committee chair
Dr. Michael Vassalos for supporting and believing in me at every step of the way through
my masters and through this thesis. If it were not for him, I would not have the knowledge
and drive to focus on consumer demand, especially in the seafood market or the passion to
do research. I would also like to thank Dr. Charles Privette and Dr. Marzieh Motallebi, my
co-chair, for their continual help and guidance. As the other members of my thesis
committee, they offered me continual patient support throughout this process. I would also
like to extend my gratitude to Dr. Wuyang Hu from the University of Kentucky for his
insightful feedback and support throughout the process.
Lastly, I want to say thanks my parents for all of their support and unconditional
love. Without their encouraging words and wisdom, I could not have accomplished any of
this.

v
TABLE OF CONTENTS Page
TITLE PAGE………………………………………………………………………….....i
ABSTRACT……………………………………………………………………………...ii
ACKNOWLEDGEMENTS………………………………………………………….....iii
TABLE OF CONTENTS………………………………………………………….........iv
LIST OF TABLES………………………………………………………………………vi
LIST OF FIGURES…………………………………………………………………….vii
CHAPTER
I. INTRODUCTION……………………………………………………………1
II. BACKGROUND INFORMATION………………………………………….4
a. BACKGROUND INFORMATION FOR COMMUNITY SUPPORTED
FISHERIES…………………………………………………………...5
III. METHODS
a. DATA COLLECTION………………………………………………10
b. ECONOMETRIC FORMULATION AND HYPOTHESIS………...13
i. ORDERED PROBIT MODEL……………………………....13
ii. MULTINOMIAL LOGIT MODEL…………………….……17
IV. RESULTS AND CONCLUSION……………………………………………19
a. CONSUMER PREFERENCES FOR SEAFOOD CHARACTERISTICS
……………………………………………………………………….19
b. ORDERED PROBIT RESULTS…………………………………….21
i. MARGINAL EFFECTS……………………………………..27

vi
c. MULTINOMIAL LOGIT RESULTS………………………………38
i. MARGINAL EFFECTS……………………………………41
d. CONCLUSION…………………………………………………….45
V. APPENDIX………………………………………………………………...47
a. SURVEY……………………………………………………………47
VI. REFERENCES……………………………………………………………..56

vii
This study utilized an online survey administered to Kentucky and South Carolina in
conjunction with discrete choice modeling to examine: i) the impact of several factors
including demographic characteristics, purchasing behaviors, and frequency of seafood
consumption on consumer’s preferences for specific seafood attributes (e.g. fresh over frozen,
wild-caught over farm-raised), ii) the impact of the aforementioned consumer characteristics,
on the probability that an individual will be interested in joining a CSF arrangement in the
future.
The results indicate that demographic characteristics, and lifestyle preferences have a
statistically significant effect on consumer’s preferences for both tangible and intangible
seafood characteristics. However, divergences remain. For example, findings indicate that
female consumers are more likely to have their purchasing decisions entirely influenced by
sustainability but it is not a statistically significant parameter for fresh vs. frozen preferences.
Similarly, respondents who attended graduate school are more likely to let seafood
characteristics other than price affect their purchasing decisions but education has no
statistically significant effect on fresh vs frozen preferences. Furthermore, respondents who
grew up within 50 miles from the coast, or are reside in South Carolina are more likely to
prefer fresh seafood products. These findings have important marketing implications as
competition in the seafood industry increases. It can assist the industry to better target their
marketing endeavors and better understand the factors influencing consumer preferences.
Regarding CSF membership, the findings indicate consumers who have children under
18 in the household are more likely to join a CSF. Likewise, consumers who shop at farmer’s
markets for groceries are more likely to join a CSF. However, most of the other factors
examined did not have a statistically significant effect on the probability that a consumer will

viii
join a CSF. These results may indicate that despite the recent growth in the CSF industry,
attracting new members is a very challenging endeavor. Thus, fishermen should not focus all
their marketing attention on CSFs.

ix
LIST OF TABLES
• TABLE 1 SUMMARY STATISTICS ……………………………12
• TABLE 2 SUMMARY STATISTICS FOR VARIABLE…………15
• TABLE 3 ORDERED PROBIT RESULTS……………………...24
• TABLE 4 MARGINAL EFFECTS REGARDING PREFERENCES FOR
SUSTAINABILITY AND ENVIRONMENTAL EFFECTS…….29
• TABLE 5 MARGINAL EFFECTS REGARDING PREFERENCES FOR
SEAFOOD CHARACTERISTICS OTHER THAN PRICE.……31
• TABLE 6 MARGINAL EFFECTS REGARDING PREFERENCES FOR
FRESH VERSUS FROZEN…………………………………..…33
• TABLE 7 MARGINAL EFFECTS REGARDING PREFERENCES FOR
WILD-CAUGHT VS. FARM RAISED……………………….…33
• TABLE 8 MULTINOMIAL LOGIT…………………….………40
• TABLE 9 MULTINOMIAL LOGIT Marginal Effects of “Yes interested in
joining a Community Supported Fishery…………………………42
• TABLE 10 MULTINOMIAL LOGIT Marginal Effects of “No, not interested
in joining a Community Supported Fishery……………….……...43
• TABLE 11 MULTINOMIAL LOGIT Marginal Effects of “Maybe interested in
joining a Community Supported Fishery……………….……..…44

x
LIST OF FIGURES
• FIGURE 1 NUMBER OF CSA FARMS …………………………………..7
• FIGURE 2 NUMBER OF FARMERS MARKETS …………………….…8
• FIGURE 3 HOW OFTEN DO YOU OR YOUR HOUSEHOLD CONSUMESEAFOOD……………………………………………………………….11
• FIGURE 4 WOULD YOU BE INTERESTED IN JOINING A COMMUNITYSUPPORTED FISHERY…………………………………………………11
• FIGURE 5 CONSUMERS PREFERENCES FOR CERTAIN TANGIBLE ANDINTANGIBLE ATTRIBUTES…………………………………………...20

1
Introduction
After a period of decline, seafood consumption in the U.S. increased between 2013
and 2015 (NOAA, 2015). According to NOAA (2015), per capita seafood consumption
increased to more than 15 pounds in 2015 compared to 11.5 pounds in 2013. This trend is
expected to continue in the future for various reasons. First, as supply increases, due mostly
to imports and aquaculture, seafood becomes a more affordable diet alternative (Asche et al.,
2015). Second, consumers increasingly recognize the purported health benefits of seafood
consumption (Lund, 2013; Carlucci et al., 2015). At the same time, despite the increased
demand, the proportion of seafood in the average U.S. diet still falls short of the
recommendations. Specifically, the U.S. population consumes only 33 percent of the
recommended amount (Kantor, 2016)1. However, as some of the constraints (e.g. price;
difficulty cooking seafood products) are reduced, consumption is expected to increase.
Concurrently, consumers increasingly care about a range of seafood characteristics
beyond tangible attributes such as packaging and form of products and marketing method.
For example, the growth of the aquaculture industry, in conjunction with increased consumer
interest in seafood production practices, regulatory requirements and food contamination
events, has generated considerable consumer interest in the sustainability of production
practices (Christian et al., 2013; Ortega et al., 2014; Fonner and Sylvia, 2015; and Stoll and
Johnson, 2015). Under these circumstances of increasing competition and volatile consumer
preferences for seafood products, understanding which attributes consumers prefer can
provide valuable insights for the U.S. seafood industry.
1 According to the 2015-2020 Dietary Guidelines, seafood should comprise approximately 20% of the protein intake for a 2000 calorie per day diet.

2
Furthermore, as seafood consumers become more aware of the negative impacts of
overfishing on the environment, they start seeking alternative marketing options that may
reduce the adverse effects (McClenachan et al., 2014). A marketing outlet that can decrease
the adverse effects of industrialized fishing is Community Supported Fisheries. CSF’s are a
type of direct marketing mechanism similar to Community Supported Agriculture (CSA).
Under this arrangement, consumer pay a certain amount at the beginning of the season, and
they get products locally from the fishermen throughout the season. There are some challenges
for CSF’s which include high startup costs and finding both consumers and fisherman who
want to join.
The present thesis has two primary objectives. First, the thesis investigates how
consumer characteristics (such as demographics, lifestyle preferences, trust in institutions, etc.)
influence their preference for tangible and intangible seafood attributes (packaging form,
storage technique, and sustainable/environmentally friendly production practices). The
second objective is to identify the factors that can increase CSF membership.
An online survey instrument administered to primary shoppers in Kentucky and
South Carolina was used as the main data source for the thesis. Consumer preferences for
various seafood characteristics were measured using a series of Likert scale questions.
Considering the ordered nature of the data, an ordered Probit formulation was utilized to
analyze the responses. The decision to join a CSF arrangement was analyzed with multi-level
responses (yes, no, maybe) and a multinomial Logit model2 to capture the uncertainty of
consumer preferences.
2 The multinomial logit model is preferred in this scenario because of the lack of natural order of consumer’s responses.

3
The contribution of the thesis to the literature is threefold. First, although a couple of
studies have identified that U.S. consumer preference for seafood varies based on location
(e.g., Carlucci et al., 2015; Pérez-Ramírez et al., 2015), to the best of my knowledge few studies
have examined attributes that impact consumer preferences in multiple Southeastern states
simultaneously.
Second, the thesis includes a number of variables following emerging seafood
production practices (such as consumers’ trust in institutions, notice of eco-labels, interest in
CSF or CSA membership, and frequency of consumption), the impacts of which have not
been extensively investigated in the seafood preference literature. Lastly, although a couple of
studies indicate that CSF’s promote environmental sustainability, (e.g., Witter, 2012;
McClenachan et al., 2014) to the best of my knowledge, there is limited research regarding the
factors that influence future consumers’ participation in CSF arrangements. The present thesis
is an effort to cover this gap in the literature.

4
Background Information
Numerous studies have examined the influence of demographic characteristics on
consumers’ seafood consumption and purchasing behavior. However, limited consensus
exists. For instance, the findings of Wessells et al., (1999), Myrland et al., (2000), and Verbeke
et al., (2005) indicated that women are more likely than men to consume seafood products.
However, He (2003), Wan (2012), and Jahns et al., (2014) illustrated that gender does not have
a statistically significant effect on seafood consumption.
Similarly, the empirical evidence regarding the importance of consumer’s age and
residence location on seafood consumption is mixed. Myrland et al. (2000), Olsen (2003), and
Jahns et al. (2014) highlighted that age has a statistically significant impact on seafood
consumption, with older consumers demanding more seafood. On the other hand, Wessels et
al. (1999), Kumar et al. (2008), and Hall and Amberg (2013) indicated that age had no
significant impact on seafood consumption. Wang et al. (2013)’s findings illustrated that
although age is not a significant determinant of seafood consumption for some, older
consumers care more about the origin of food products.
Although a number of scholars (i.e., He et al., 2003; Hall and Amberg, 2013; Jahns et
al., 2014) found that higher education translates to higher seafood consumption, divergences
still exist. For example, Burger et al. (1999) indicated that Savannah River fishermen, with
lower levels of education, consume more seafood products while Trondsen et al. (2004)
illustrated that higher education did not have a significant effect on seafood consumption.
Previous studies have also indicated that geographical parameters may have a statically
significant effect on consumers’ seafood preferences (Dey et al., 2017). To illustrate, Wessells
et al. (1999) and Trondsen et al. (2004)’s findings indicated that consumers who grew up in a

5
coastal region would prefer certified seafood. Similarly, Zhou et al. (2016) indicate that location
of residence has a statistically significant effect on seafood consumption. Likewise, according
to Wan and Hu (2012), individuals who grow up in a 50-mile radius of the coast are less likely
to spend more money on seafood. These findings validate Dey et al.’s (2017) hypothesis that
consumers’ purchasing behavior is different across the U.S. Internationally, Cardoso et al.
(2013) identified that people who live inland are less attracted to wild-caught fish than are
those living in coastal regions.
Furthermore, consumers’ preferences for seafood attributes such as production
methods and storage techniques vary. In a review of recent studies, Carlucci et al. (2015)
indicated that the majority of consumers prefer wild-caught seafood products over farm-
raised. This finding further supported the results of Cardoso et al. (2013), Davidson et al.
(2012), and Nguyen et al. (2015). However, in recent years, due to the growth of the
aquaculture industry, consumers’ preference for farm-raised seafood has become more
prevalent. For example, Honkanen and Olsen (2009), Vanhonacker et al. (2011), Claret et al.
(2012), Cardoso et al. (2013), and Zhou et al. (2016) documented consumers’ positive
perceptions of farm-raised seafood due to consumers’ income constraints, environmental
concerns, or prioritizing of other seafood characteristics over production methods.
Additionally, storage technique (i.e. fresh vs. frozen) and the production method of
seafood are equally important to consumers (e.g., Claret et al., 2012; Carlucci et al., 2015). For
example, Cardoso et al. (2013) in Portugal and Nguyen et al. (2015) in France found that the
majority of seafood consumers prefer chilled (fresh) fish and the preference for frozen seafood
is on the decline. Seafood consumers in Australia prefer, and normally purchase, seafood that
is unpackaged because to them this guarantees freshness and origin while lowering price (Birch

6
et al., 2012). A consensus among these studies is that consumers prefer fresh seafood products
because they are considered safer and they believe they taste better (Arvanitoyannis et al.,
2004; Carlucci et al., 2015).
In addition to price, production method, and storage technique, consumers increasingly care
about the sustainability and environmental impact of seafood production. One concern for
seafood consumers are heavy metals in the seafood they eat. Heavy metals accumulate in fish
from the environment around them (Bosch et al., 2016). For example, the FDA
recommends that top level predatory fish should be avoided due to the higher concentration
of mercury (FDA, 2017). Ecolabels are an example of an intangible attribute that seafood
producers utilize to display sustainability. Fonner (2014) found that consumers are willing to
pay a price premium for ecolabels. Similarly, Johnston et al. (2001) found that Norwegian
consumers are more likely to change their purchasing behavior based on environmental
characteristics. On the other hand, Hanson and Rose (2011), using a sample of U.S. college
students, found that the environmental impacts of seafood were only a concern to a small
percentage of the sample.
This thesis is not intended to offer a normative conclusion on the factors that may be
important in consumer seafood preference and consumption. Instead, my goal is to add to the
current discussion by providing another case where we also consider consumer preference for
new features about seafood production.

7
Background Information for Community Supported Fisheries
Community supported fisheries (CSFs) emerged due to consumers increased interest
for local seafood products (Chase and Otts, 2016). The local food movement in the U.S.
started in the early 1990’s (Delind, 2010; Coit, 2008). Ever since, there has been a growing
trend in local food consumption in the U.S. beginning with produce (Nie and Zepeda, 2011
and Meas et al., 2014). For instance, in 2015, there were approximately 7,400 farms marketing
through a CSA arrangement, and approximately 8,268 farmer’s markets. A 13.8% and 5.3%
respectively increase since 2012 (Figures 1&2). This trend of purchasing local is expanding
with the consumption of seafood (Brinson et al., 2011; Bolton et al., 2016; Stoll et al. 2015).
Figure 1. Number of CSA Farms in the U.S. Source: Source: USDA Agricultural Marketing Services
0
1000
2000
3000
4000
5000
6000
7000
8000
2000 2009 2012 2015
NumberofCSAFarmsintheU.S.

8
Figure 2.Number of Farmer's Markets in the U.S. Source: USDA AMS Marketing Services
A number of reasons explain why consumers prefer local foods. For example,
consumers choose local foods because of environmental concerns, the sense of connection to
the community that it provides them, and the higher quality they get out of local foods (Coit,
2008).
A recent marketing outlet that consumers utilize to purchase local seafood are the
CSFs. CSFs started in 2007 in Port Clyde, Maine (Bolton et al., 2016). Today there has been
an increase in CSFs to at least 40 in the U.S. (Stoll et al., 2015). CSFs sell seafood directly to
the consumer with a use of payments at the beginning of the season. Prepayments are used
because they cover potential risks, costs, and they are used without brokers or middlemen so
the fishermen get the proceeds directly (Godwin et al., 2017). Each CSF sells its own local
catch so no CSF has the same output (Local Catch, 2017). There are three different types of
CSFs: i) harvester focused, ii) consumer focused, and iii) species focused (Bolton et al., 2016).
0
1,000
2,000
3,000
4,000
5,000
6,000
7,000
8,000
9,000
2000 2009 2012 2014
NumberofFarmer'sMarketsintheU.S.

9
Harvester focused CSFs are owned and operated by the fisherman. Their primary
objective is to support the local economy. Consumer focused CSFs are mainly oriented
towards educating consumers. Lastly, species focused CSFs sell only specific high value
species. Their main aim is to link consumers who are interested in buying these high value
species with a fisherman (Bolton et al., 2016).
The main benefit of CSFs is supporting community strength by supporting the local
producers and making them feel valued (Godwin et al., 2017; Bolton et al., 2016). Another
benefit that CSFs demonstrate is that they reduce the carbon footprint, compared to
industrialized fishing distributions, as the travel distance is shorter than for industrial fishing
(McClenachan et al., 2014). As a program, CSFs vary the weekly catch and therefore decrease
pressure for one higher value species (McClenachan et al., 2014).
Despite these benefits, it is difficult for CSFs to compete with industrialized fishing.
It is complicated to deliver the entire fish because CSFs then have to focus on finding fish
that are small enough for that weekly share (Brinson et al., 2011). Additional challenges that
CSFs face deal with i) start-up costs, ii) time, iii) supply issues, and iv) consumer competition
in the market. Moreover, CSFs have a hard time finding shareholders to participate.
Furthermore, it is important to find out who will be a potential CSF member from the
beginning.
Data Collection
An online survey distributed by Qualtrics (a software for data collection and analysis)
to primary grocery shoppers, residing in Kentucky (KY) and South Carolina (SC), was the
main data collection tool for the present thesis. Two reasons justified the selection of the

10
aforementioned states. First, although commercial fishing and aquaculture production have
substantial impacts on the economy of SC and KY, respectively (Willis and Straka, 2017; Soley,
2016), limited research has focused on consumers’ seafood preferences for these states3.
Second, comparing a coastal state (SC) with an inland state (KY) was expected to provide
further insights on factors influencing consumers’ preferences. For example, it was expected
that SC residents may be more sensitive than KY residents regarding water conservation and
seafood production practices (Zhou et al., 2016).
The survey instrument was designed following Dillman’s (2007) guidelines. The
wording, ordering of questions, and overall format of the survey instrument was pilot-tested
with a number of focus groups including consumer and industry representatives from both
states. The survey was implemented in spring 2016 online. There were 895 effective responses
in the sample.
Table 1 reports summary statistics for the demographic variables by state. The sample
overrepresented female with approximately 65% female from KY and 70% from SC. Middle-
aged was overrepresented as well with both states having over 40% in the 35-54-year-old
range. However, this is not uncommon among online surveys that focus on primary grocery
shoppers.
Results indicate that 28% of respondents consume seafood more than once a week
(Figure 3). Moreover, 25% of respondents are interested in joining a CSF (Figure 4).
3 Notable exceptions include Burger, (2002), Perkinson et al., (2016), and Zhou et al., (2016). However, these studies were limited either to a specific group of consumers (Burger, 2002; Perkinson et al., 2016); or a specific seafood product (Zhou et al., 2016).

11
Figure 3. How often do you or your household consume seafood?
Figure 4. Would you be interested in joining a Community Supported Fishery?
18%
36% 28%
13%
4% 1%
Howoftendoyouoryourhouseholdconsumeseafood?
Morethanonceaweek(1) Everyweek(2)
Everyotherweek(3) Onceamonth(4)
Onceortwiceeverysixmonths(5) seasonal
25%
42%
33%
WouldyoubeinterestedinjoiningaCommunitySupportedFishery?
Yes
No
Maybe

12
Table 1. Summary Statistics
Variable
Kentucky South Carolina
SAMPLE n = 431
POPULATION SAMPLE n = 464
POPULATION
Age (%)
18-25 Years Old12.76%
7.00% 16.38%
7.30%
26-34 Years Old 25.52% 12.90% 22.63% 12.80% 35-54 Years Old 45.71% 27.30% 42.03% 26.40% 55-64 Years Old 11.37% 12.90% 11.85% 13.00% Above 65 Years Old 4.64% 14.00% 7.11% 14.70%
Education (%)
8th Grade or Less 0.70% 16.50% 0.65% 15.00% Some High School
4.87% 16.50%
3.45% 15.00%
High School Grad 31.09% 33.70% 20.47% 30.00% Some College, No Degree 35.96% 20.70% 38.79% 21.00% Bachelor’s or 4 Year Degree
17.87%
12.90%
22.63%
16.20%
Graduate or Professional Degree
9.51%
8.90%
14.01%
9.20%
Gender (%)
Female 65.20% 50.80% 70.69% 51.40% Household Income (%) Less than $14,999 16.71% 16.90% 15.30% 15.50%
$15,000-$24,999 12.76% 13.00% 9.05% 12.70% $25,000-$49,000 32.02% 26.00% 26.94% 26.40% $50,000-$74,999
17.87% 17.60%
18.32% 18.00%
$75,000-$99,999 8.12% 10.90% 12.93% 11.20% $100,000-$149,000
6.73% 10.10%
6.68% 10.40%
Above $150,000 2.56%
5.30% 5.60%
6.00%
Choose Not to Answer 3.25% 5.17%

13
Econometric Formulation and Hypotheses
Ordered Probit Model
To evaluate consumers’ preferences for seafood characteristics, the survey participants
were asked the following questions: i) To what extent does the sustainability and
environmental effects of the seafood you consume (e.g., by-catch and health of fish stocks;
environmental effects of aquaculture) affect your purchasing decision? ii) To what extent do
seafood characteristics other than price influence your purchasing decision? iii) To what extent
do you prefer the seafood products to be fresh vs. frozen? iv) To what extent do you prefer
the seafood products to be wild-caught vs. farm-raised?
Respondents’ preferences were measured using a Likert-scale rating that included two
negative (not at all, and rarely), two positive (mostly, and entirely) statements and one neutral.
Considering the ordinal and categorical nature of the responses, an ordered Probit formulation
was utilized to estimate the statistical significance, the marginal effects, and the direction of
the relationship each explanatory variable had to each level of seafood preferences examined
(Train, 2009; Cameron and Trivedi, 2005).
Following Cameron and Trivedi (2005), the general specification of the ordered Probit
model is:
1 #$∗ = '′($ + *$
where y* is an unobserved latent measuring the preferences of the ith respondent, b denotes
the vector of the coefficients to be estimated, ($ is the vector the observed explanatory
variables, and e is the error term, assumed to be normally distributed. The observed variable
yi is given by:

14
#$ =
1. ,-././0012#$∗ < 45
2. 7/890#1245 ≤ #$∗ < 4;
3. ,9=.8/0124; ≤ #$∗ < 4>
[email protected]#124> ≤ #$∗ < 4B
5. DE.1890#12#$∗ ≥ 4B
where, 45-4B are unknown cutoff values to be estimated with b. The probability that #5 falls
into the jth category is given by:
(2) Prob(#5=j)= Φ 4G − '′( -Φ 4GI5 − '
′( , j=0,1,…..J,
where 4G and 4GI5 signify the upper and lower threshold values for category J (Abdel-Aty,
2001). The marginal effects for the maximum likelihood estimation (MLE) were calculated
following Cameron and Trivedi (2005) as:
(3) JK(MNO|QRJQST
= [V WOX5 − Y$' − V WO − Y$' ]'G
where function j (.) is the pdf of the standard normal distribution.
Based on previous studies (i.e., Carlucci et al., 2015; Wang et al., 2013; Hicks et al.,
2008; Fonner, 2014), the following six groups of explanatory variables were included in the
analysis: demographic characteristics (i.e., education level, gender, income, age, etc.), seafood
consumption frequency, consumers’ trust in different agencies certifying environmental
effects (third-party agency, federal agency state agency, private sector), respondents’
motivation for purchasing local food products (i.e., supporting local fisheries/farmers, local
products are of higher quality and fresher, etc.), whether or not they notice labels such as farm-
raised or local labeling, and whether or not they were members of local food communities.
Table 2 reports summary statistics and description for the explanatory variables included in
the analysis.

15
My a priori hypothesis was that respondents who reside in SC, or grew up within 50
miles of the coast, would have stronger preferences for fresh, wild-caught seafood, and
environmentally sustainable seafood production practices, compared to respondents who
reside in KY or grew up more than 50 miles from the coast (Cardoso et al., 2013; Wang et al.,
2013; Zhou et al., 2016; Dey et al., 2017).
Similarly, it was hypothesized that the purchasing decisions of respondents who were
members of or had considered joining a CSA group or a CSF, respectively, would be positively
influenced by seafood characteristics other than price, compared to consumers who do not
consider local seafood to be of higher quality in general (Campbell et al., 2012; Fonner et al.,
2015). Furthermore, following Johnston et al. (2001), Hicks et al. (2008), and Fonner et al.
(2014), we expected that certifying agencies would influence consumers’ purchasing decisions.
However, considering the discrepancies in the results, either a positive or negative relationship
could exist.
Likewise, demographic characteristics were expected to have a statistically significant
impact on consumers’ seafood purchases. Nevertheless, considering the limited consensus in
the literature, we did not have any initial expectations whether or not specific responder
characteristics would have a positive or negative impact on seafood preferences.
Multinomial Logit Model
To evaluate what consumer characteristics increases the likelihood of joining a CSF,
consumers were asked “would you be interested in joining a community supported fishery”.
Three possible responses were provided to the survey participants: i) yes, ii) no, and iii) maybe.

16
This approach was preferred compared to a traditional binary answer (yes/no), since it provide
the opportunity to account for the uncertainty in consumer preferences. When the discrete
choice has more than two alternatives that are not ordered such as in this scenario, a
multinomial Logit can be utilized. Under the multinomial Logit model, the probability that an
individual i will select alternative j is given by (Cameron and Trivedi, 2009):
(4) [$G =\]^(]R
′_T)
\]^(]R′_T)′
abcd
j=1,…,m
where eG is the vector of the estimated paremeters, ($ is the vector the observed explanatory
variables, and e is the error term, assumed to be normally distributed. The base category for
my thesis is not interested in joining a CSF. The dependent variable, interest in joining a
community supported fishery, is [$G .
The marginal effects are calculated as
(5) J^RTJ]R
= [$G(eG − ef)
The set of explanatory variables used in the second part of the thesis are as follows:
demographic characteristics (i.e., education level, gender, income, age, etc.), seafood
consumption frequency, respondents’ motivation for purchasing local food products (i.e.,
supporting local fisheries/farmers, local products are of higher quality and fresher, etc.),
whether or not they notice labels such as farm-raised or local labeling,

17
Table 2. Summary Statistics for Variables (n = 895) Variables Description Mean Standard
Deviation Demographics Associates Dummy Variable; 1 = some college 0.374 0.484 Bachelor’s Degree Dummy Variable; 1 = bachelor 0.203 0.403 Graduate School Dummy Variable; 1 = graduate 0.118 0.323
High School Dummy Variable; 1 = graduated high school
0.256 0.437
Less than High School Grad
Dummy Variable; 1 = did not graduate high school
0.0480 0.214
Female Dummy Variable; 1 = female 0.680 0.467
Married Dummy Variable; 1 = married 0.613 0.487
Children Dummy Variable; 1 = have children under 18 living in the household
0.476 0.500
Income Annual household income before taxes; original question was in intervals and midpoints were taken while coding the data; 1 if 10,000; 2 if 12,500; 3 if 20,000; 4 if 30,000; 5 if 42,500; 6 if 62,500; 7 if 87,500; 8 if 125,000;9 if 175,000; 10 if 200,000
51.34 42.13
Age Age in years 40.90 13.41 50 Miles from Coast Dummy Variable; 1 = grew up within 50
miles of coast 0.247 0.431
Full-Time Dummy Variable; 1 = full-time employee 0.446 0.497
Motives for Buying Local Supporting Local Fisheries/Farmers
Dummy Variable; 1 = Support local farmers/fisheries
0.286 0.452
Local Products are of Higher Quality and Fresher
Dummy Variable; 1 = local products are of Higher Quality and Fresher
0.345 0.476
Local Products are Good for the Environment
Dummy Variable; 1 =Local Products are Good for the Environment
0.0480 0.214
Support for a Local Economy
Dummy Variable; 1 = Support for a Local Economy
0.264 0.441
Don’t Care Dummy Variable; 1 = Don’t care for local seafood products
0.0458 0.209
Other Dummy Variable; 1 = Other 0.0112 0.105 Trust in Institutions

18
Federal Ag Dummy Variable; 1 = Trust Federal Ag 0.457 0.498 State Dummy Variable; 1 = Trust State Ag 0.231 0.422 Private Dummy Variable; 1 = Trust Private
Sector 0.101 0.301
Third Party Dummy Variable; 1 = Trust Third Party Certifiers
0.0425 0.202
Not Sure Dummy Variable; 1 = Not Sure who to Trust
0.169 0.375
Consumption Frequency Regularly Dummy Variable; 1 = Consume Seafood
Regularly 0.525 0.500
Occasionally Dummy Variable; 1 = Consume Seafood Occasionally
0.475 0.500
Labeling Yes, Local/Regional Labeling
Dummy Variable; 1 = Yes Notice Local/Regional Labeling
0.382 0.486
Yes, Noticed Farm-Raised/ Wild-Caught Labeling
Dummy Variable; 1 = Yes Notice Farm-Raised/Wild-Caught Labeling
0.603 0.489
Membership Yes, interested in Joining a Community Supported Fishery
Dummy Variable; 1 = Yes interested in joining a CSF
0.248 0.432
Yes, Member of Community Supported Agriculture
Dummy Variable; 1 = Yes member of CSA
0.0771 0.267
South Carolina Dummy Variable; 1 = SC resident 0.518 0.500

19
Results
Consumers’ Preferences for Seafood Characteristics
The relative importance of the examined seafood attributes on respondents’
purchasing decisions is reported in Figure 5. More than 50% of the survey participants
indicated that their seafood purchasing decisions are influenced by seafood characteristics
other than price. This result is in line with that of Hall and Amberg (2013), who highlighted
that, for Pacific Northwest consumers, price is an important factor, but not the only important
determinant in seafood choices.
Consistent with previous studies, either for the U.S. (i.e., Peavy et al., 1994; Davidson
et al., 2012; Hall and Amberg, 2013; Gutierez et al., 2014), or Europe (i.e., Arvanitoyannis et
al., 2004; Cardoso et al., 2013), my findings indicate that approximately 65% of respondents
prefer fresh seafood compared to previously frozen seafood. Two reasons may explain this
preference. First, fresh fish is considered to be of higher quality by the majority of consumers
(Carlucci et al., 2015; Brunso et al., 2009). Second, a number of consumers consider fresh
seafood as safer and of higher nutritional value (Carlucci et al., 2015).
Lastly, in line with Verbeke et al., (2007), my findings indicate that 45% of the
respondents prefer wild-caught seafood products, while 39% are indifferent about
production methods (Figure 5). This finding may indicate that, as aquaculture develops,
consumers may become more familiar with negative effects of farm-raised products such as
heavy metals (Mendiguchía et al., 2006).

20
Figure 5. Consumer's Preferences for Certain Tangible and Intangible Attributes
SustainabilitySeafood
Characteristicsotherthanprice
Freshvs.Frozen Wildcaughtvsfarmraised
Entirely 17% 16% 25% 17% Mostly 33% 42% 40% 28% Neutral 33% 28% 24% 39% Rarely 11% 11% 7% 9% Notatall 7% 4% 4% 7%
0%
5%
10%
15%
20%
25%
30%
35%
40%
45%
Consumer'sPreferencesforCertainTangibleandIntangibleAttributes

21
Ordered Probit Results
The results of the ordered Probit formulation for the four dependent variables i) To
what extent does the sustainability and environmental effects of the seafood you consume
(e.g., by-catch and health of fish stocks; environmental effects of aquaculture) affect your
purchasing decision? ii) To what extent do seafood characteristics other than price influence
your purchasing decision? iii) To what extent do you prefer the seafood products to be fresh
vs. frozen? iv) To what extent do you prefer the seafood products to be wild-caught vs. farm-
raised?) examined are reported in Table 3.
My findings indicate that the factors impacting purchasing decisions vary substantially
across the four questions. With the exception of gender and age, none of the examined
demographics had a statistically significant effect on the likelihood that sustainability would
affect seafood-purchasing decisions. On the other hand, demographic characteristics had a
significant impact on consumers’ preferences for production method and storage technique
(Table 3). For example, compared to consumers who do not have a high school degree,
respondents who have a bachelor’s degree or higher are more likely to prefer wild-caught
seafood products as well as have other factors besides price influence their purchasing
decision. Consumers who have higher than an associate’s degree and are married are more
likely to have other factors besides price influence their purchasing decision.
Furthermore, in line with my a priori hypothesis and with Cardoso et al. (2013),
respondents who grew up within 50 miles from the coast, or are residents of South Carolina
are more likely to prefer fresh seafood products (Table 3). A potential explanation is that these
consumers are more familiar with the preparation of fresh seafood products (Verbeke and
Vackier, 2005; Carlucci et al., 2015).

22
Unexpectedly, my findings indicate that consuming fish regularly did not have a
statistical impact on any dependent variables examined. However, this finding is consistent
with the results of Johnston et al. (2001), who illustrate that seafood consumption frequency
does not affect consumers’ selection of certified seafood products in USA or Norway.
Similarly, employment did not have a significant effect on any dependent variables examined
as well.
Respondents’ intent to join a CSF had a statistically significant impact on their
preferences except for fresh vs. frozen. For example, this group of consumers is more likely
to prefer wild-caught seafood products as well as care about sustainability and has seafood
characteristics other than price affect purchasing decisions. Two reasons may explain this
finding. First, CSF members generally put a higher value on the quality of seafood products.
Fresh seafood is considered of higher quality and higher quality is often closely tied to
freshness (Campbell et al., 2014). Second, CSF members have a preference for sustainable
practices and local food products (Campbell et al., 2014).
Contrary to Quagrainie et al. (2008), my findings indicate that consumers who notice
local labeling are influenced by their seafood preferences. Furthermore, responders who notice
labels specifying whether seafood is farm-raised are more likely to prefer fresh, wild-caught,
and sustainable seafood products, as well as focus on seafood characteristics other than price.
Consistent with Johnston et al. (2001) and Hicks et al. (2008), my findings indicate that
the trust in certification agencies has no statistically significant impact on consumers’
preferences for production method and storage technique. However, the results indicate that
consumers who trust the federal agencies for certification are more likely to have their
purchasing decisions influenced by sustainability and environmentally friendly seafood

23
products (Table 3). This finding contradicts the results of Smith et al., (2015), who illustrated
that “indifferent fish consumers”, which were the majority of his study, had substantially lower
mean scores regarding environmental attitudes.

24
Table 3. Ordered Probit Results
To what extent does the sustainability and environmental effects
of the seafood you consume affect your purchasing decision?
To what extent do seafood
characteristics other than price influence
your purchasing decision?
To what extent do you prefer the seafood products
to be fresh vs. frozen?
To what extent do you prefer the
seafood products to be wild-caught vs.
farm-raised?
Coeff. Std. Error
Coeff. Std. Error
Coeff. Std. Error
Coeff. Std. Error
VARIABLES
Demographics
Higher Educationa 0.247 0.205 0.547*** 0.204 0.311 0.205 0.465** 0.206 Bachelor’s Degreea 0.084 0.189 0.407** 0.188 0.189 0.188 0.328* 0.189 Associate’s Degreea -0.010 0.175 0.419** 0.174 0.279 0.174 0.256 0.176 High School Graduatea 0.024 0.179 0.558*** 0.178 0.254 0.178 0.230 0.179 Female 0.255*** 0.079 0.147* 0.080 -0.004 0.080 0.040 0.080 Married 0.080 0.081 0.151* 0.082 0.149* 0.082 0.087 0.082 Income 0.000 0.001 0.002 0.001 0.000 0.001 0.001 0.001 Age 0.006** 0.003 0.009*** 0.003 0.008** 0.003 0.006** 0.003 Full-timeb -0.015 0.080 -0.076 0.081 0.102 0.081 -0.099 0.081 Children 0.055 0.076 0.013 0.076 -0.022 0.077 -0.062 0.077 Coast 0.054 0.088 -0.029 0.089 0.189** 0.090 0.143 0.089 South Carolina 0.070 0.078 0.020 0.078 0.194** 0.078 0.082 0.078 Motives for Buying Local Supporting Local Farmer/Fisherman 0.249 0.186 0.055 0.186 0.117 0.185 0.158 0.186 Local Products are of Higher Quality and More Fresh
-0.024 0.183 0.169 0.183 0.145 0.183 0.160 0.184
Good for the Environment 0.252 0.236 0.157 0.236 0.054 0.236 0.381 0.238 Support for a Local Economy 0.145 0.186 0.210 0.186 0.095 0.186 0.107 0.186 Other 0.238 0.383 -0.240 0.381 0.416 0.387 0.093 0.387 Trust in Institutions Third-party 0.249 0.201 0.040 0.202 -0.175 0.202 0.062 0.204 State 0.128 0.119 -0.050 0.119 0.026 0.120 -0.102 0.120
Feds 0.190* 0.106 0.075 0.106 0.025 0.106 -0.091 0.107

25
*** p<0.01, ** p<0.05, * p<0.1 a: base category is less than high school, b: base category is not full time, c: base category is don’t care for local food, d: base category is do not know, e: base category is occasionally
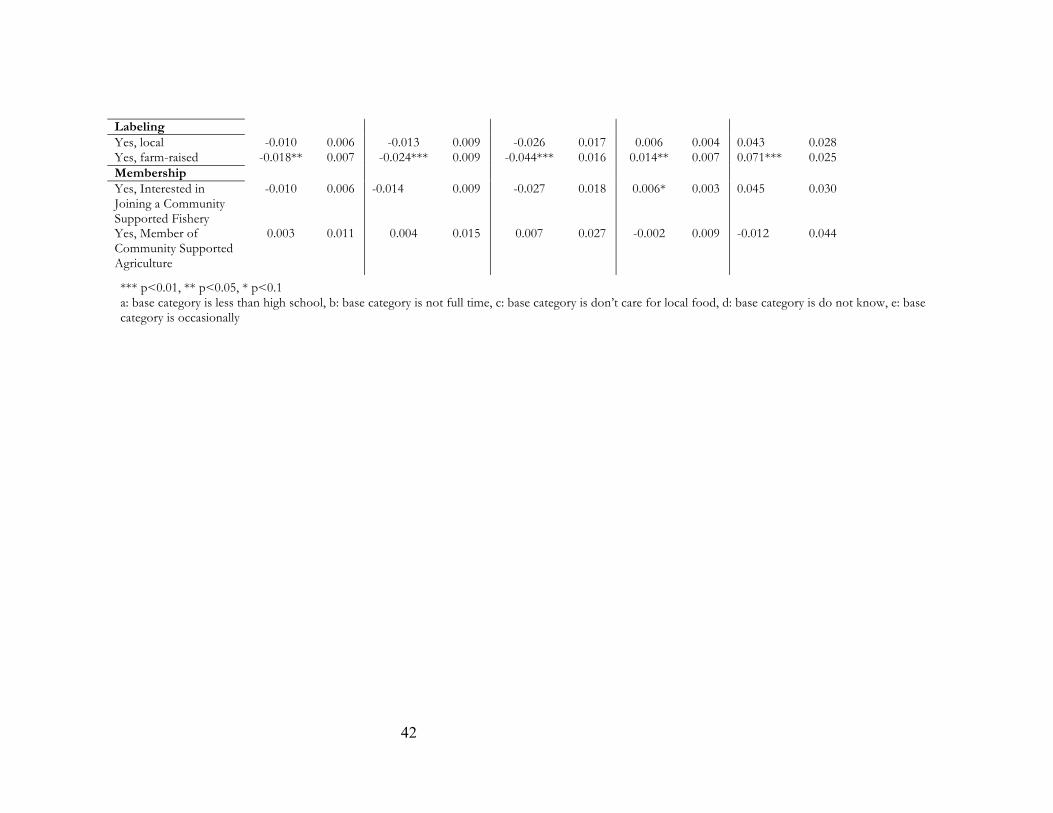
Private 0.143 0.145 0.100 0.146 -0.049 0.147 -0.159 0.146 Consumption Frequencye regularly -0.043 0.074 0.113 0.075 0.090 0.075 -0.038 0.074 Labeling
Yes, local 0.173** 0.085 0.152* 0.086 0.136 0.086 0.053 0.086 Yes, farm-raised 0.383*** 0.081 0.316*** 0.082 0.231*** 0.082 0.526*** 0.082 Membership Yes, Interested in Joining a Community Supported Fishery
0.301*** 0.092 0.256*** 0.092 0.140 0.093 0.182** 0.092
Yes, Member of Community Supported Agriculture
0.277* 0.144 -0.096 0.143 -0.039 0.144 0.181 0.144
Constant cut1 -0.389 0.284 -0.241 0.285 -0.593** 0.285 -0.504* 0.285 Constant cut2 0.211 0.283 0.498* 0.283 -0.045 0.283 0.013 0.283 Constant cut3 1.248*** 0.285 1.410*** 0.285 0.830*** 0.284 1.231*** 0.286 Constant cut4 2.291*** 0.289 2.690*** 0.291 1.934*** 0.287 2.106*** 0.289

26
Marginal Effects
The estimated marginal effects for the four models examined are reported in Tables
(4 -7). The findings indicate that female consumers are 5.6 percentage points more likely to
have their purchasing decisions entirely influenced by sustainability (Table 4). Similarly,
respondents who attended graduate school are 14.9 percentage points more likely to let
seafood characteristics other than price affect their purchasing decisions (Table 5). Married
seafood consumers are 3.3 percentage points less likely to have price influence their purchasing
decisions (Table 5).
In line with my initial hypothesis, seafood purchases of SC residents are more likely to
be influenced by seafood characteristics other than price. Consumers who reside in SC are 6.1
percentage points more likely to prefer fresh over frozen seafood completely (Table 6).
Moreover, those who grew up within 50 miles of a coast are 6.1 percentage points more likely
to prefer fresh seafood products completely (Table 6) and about 2.1 percentage points more
likely to prefer wild-caught over farm-raised seafood mostly (Table 7).
Contrary to the previous variables, trust in different institutions had a limited impact
in consumers’ seafood purchasing decisions. To illustrate, those responders who trust the
federal agencies are 4.4 percentage points more likely to have their purchasing decisions
completely influenced by environmental statements, compared to respondents who do not
know who to trust to certify seafood products (Table 4). This could be because they feel they
are better informed by trusting these agencies.
Consumers who notice farm-raised labels entirely were 8.4 percentage points more
likely to have their purchasing decisions completely influenced by environmental statements
while responders who notice local labeling were 4 percentage points more likely to be

27
completely influenced by environmental statements. Likewise, responders who notice farm-
raised labels were 6.8 percentage points more likely to be completely influenced by
characteristics other than price. Similarly, consumers who notice farm-raised labels are 11.9
percentage points more likely to prefer wild-caught seafood products entirely.
Last, consumers who are interested in joining a CSF are 7.4 percentage points more
likely to be completely influenced by sustainability concerns as well as 6.1 percentage points
more likely to be completely influenced by characteristics other than price. Likewise, those
responders who are interested in joining a CSF are 4.6 percentage points more likely to prefer
wild-caught over farm-raised seafood entirely.

37
Table 4: Marginal Effects Regarding Preferences for Sustainability and Environmental Effects Not at All Rarely/A Little Neutral Mostly/A Lot Entirely
Coeff. Std. Error
Coeff. Std. Error
Coeff. Std. Error
Coeff. Std. Error
Coeff. Std. Error
VARIABLES Demographics Higher Educationa -0.023 0.016 -0.030 0.023 -0.045 0.041 0.036 0.024 0.062 0.056 Bachelor’s Degreea -0.009 0.019 -0.011 0.024 -0.014 0.033 0.014 0.030 0.020 0.045 Associate’s Degreea 0.001 0.019 0.001 0.023 0.002 0.028 -0.002 0.030 -0.002 0.040 High School Graduatea -0.003 0.019 -0.003 0.023 -0.004 0.030 0.004 0.030 0.006 0.041 Female -0.029*** 0.010 -0.034*** 0.011 -0.038*** 0.011 0.046*** 0.015 0.056*** 0.017 Married -0.009 0.009 -0.010 0.011 -0.013 0.013 0.014 0.014 0.018 0.018 Income -0.000 0.000 -0.000 0.000 -0.000 0.000 0.000 0.000 0.000 0.000 Age -0.001** 0.000 -0.001** 0.000 -0.001** 0.000 0.001** 0.001 0.001** 0.001 Full-timeb 0.002 0.009 0.002 0.010 0.002 0.013 -0.003 0.014 -0.003 0.018 Children -0.006 0.008 -0.007 0.010 -0.009 0.012 0.009 0.013 0.013 0.017 Coast -0.006 0.009 -0.007 0.011 -0.009 0.015 0.009 0.015 0.012 0.021 South Carolina -0.007 0.008 -0.009 0.010 -0.011 0.013 0.012 0.013 0.016 0.018 Motives for Buying Localc Supporting Local Farmer/Fisherman
-0.025 0.017 -0.031 0.023 -0.043 0.034 0.039 0.026 0.060 0.047
Local Products are of Higher Quality and More Fresh
0.003 0.020 0.003 0.024 0.004 0.029 -0.004 0.032 -0.005 0.042
Good for the Environment
-0.022 0.017 -0.030 0.026 -0.047 0.049 0.035 0.025 0.065 0.067
Support for a Local Economy
-0.015 0.018 -0.018 0.023 -0.025 0.033 0.024 0.028 0.034 0.046
Other -0.021 0.027 -0.035 0.023 -0.045 0.080 0.033 0.040 0.061 0.109 Trust in Institutionsd Third-party -0.022 0.015 -0.030 0.022 -0.046 0.042 0.035 0.022 0.064 0.057 State -0.013 0.011 -0.016 0.015 -0.022 0.021 0.021 0.018 0.030 0.029
Feds -0.020* 0.011 -0.024* 0.014 -0.031* 0.018 0.032* 0.018 0.044* 0.025
Private -0.014 0.013 -0.018 0.018 -0.025 0.027 0.022 0.020 0.035 0.037 Consumption Frequencye regularly 0.005 0.008 0.006 0.010 0.007 0.012 -0.007 0.013 -0.010 0.017

38
*** p<0.01, ** p<0.05, * p<0.1 a: base category is less than high school, b: base category is not full time, c: base category is don’t care for local food, d: base category is do not know, e: base category is occasionally
Labeling
Yes, local -0.018** 0.009 -0.022** 0.011 -0.029* 0.015 0.029** 0.014 0.040** 0.020 Yes, farm-raised -0.044*** 0.011 -0.050*** 0.012 -0.058*** 0.012 0.068*** 0.016 0.084*** 0.017 Membership Yes, Interested in Joining a Community Supported Fishery
-0.029*** 0.008 -0.037*** 0.011 -0.054*** 0.018 0.045*** 0.012 0.074*** 0.024
Yes, Member of Community Supported Agriculture
-0.024** 0.011 -0.033** 0.016 -0.052* 0.030 0.039** 0.015 0.071* 0.041

39
Table 5: Marginal Effects Regarding Preferences for Seafood Characteristics Other than Price Not at All Rarely/A Little Neutral Mostly/A Lot Entirely
Coeff. Std. Error
Coeff. Std. Error
Coeff. Std. Error
Coeff. Std. Error
Coeff. Std. Error
VARIABLES Demographics
Higher Educationa -0.027***
0.008 -0.065*** 0.020 -0.107** 0.041 0.050*** 0.009 0.149** 0.065
Bachelor’s Degreea -0.024** 0.009 -0.052** 0.022 -0.077** 0.037 0.051*** 0.016 0.102* 0.053 Associate’s Degreea -0.028** 0.011 -0.057** 0.023 -0.076** 0.032 0.062*** 0.023 0.099** 0.043 High School Graduatea -
0.032*** 0.009 -0.071*** 0.020 -
0.105*** 0.035 0.066*** 0.014 0.142*** 0.051
Female -0.011* 0.006 -0.021* 0.012 -0.025* 0.013 0.026* 0.015 0.032* 0.017 Married -0.011* 0.006 -0.022* 0.012 -0.026* 0.014 0.026* 0.015 0.033* 0.018 Income -0.000 0.000 -0.000 0.000 -0.000 0.000 0.000 0.000 0.000 0.000 Age -
0.001*** 0.000 -0.001*** 0.000 -
0.002*** 0.001 0.002*** 0.001 0.002*** 0.001
Full-timeb 0.005 0.006 0.011 0.012 0.013 0.014 -0.013 0.014 -0.017 0.018 Children -0.001 0.005 -0.002 0.011 -0.002 0.013 0.002 0.013 0.003 0.017 Coast 0.002 0.007 0.004 0.013 0.005 0.015 -0.005 0.015 -0.006 0.019 South Carolina -0.001 0.006 -0.003 0.011 -0.003 0.014 0.003 0.013 0.004 0.017 Motives for Buying Localc Supporting Local Farmer/Fisherman
-0.004 0.013 -0.008 0.026 -0.010 0.033 0.009 0.030 0.012 0.042
Local Products are of Higher Quality and More Fresh
-0.012 0.012 -0.024 0.025 -0.030 0.034 0.027 0.028 0.039 0.043
Good for the Environment
-0.010 0.013 -0.021 0.030 -0.029 0.046 0.023 0.028 0.038 0.061
Support for a Local Economy
-0.014 0.011 -0.029 0.025 -0.038 0.035 0.032 0.025 0.049 0.046
Other 0.021 0.041 0.037 0.062 0.037 0.049 -0.048 0.088 -0.047 0.064 Trust in Institutionsd Third-party -0.003 0.014 -0.006 0.028 -0.007 0.037 0.006 0.032 0.009 0.047 State 0.004 0.009 0.007 0.017 0.009 0.020 -0.009 0.021 -0.011 0.026 Feds -0.005 0.008 -0.011 0.015 -0.013 0.019 0.013 0.018 0.017 0.024

40
*** p<0.01, ** p<0.05, * p<0.1 a: base category is less than high school, b: base category is not full time, c: base category is don’t care for local food, d: base category is do not know, e: base category is occasionally
Private -0.007 0.009 -0.014 0.020 -0.018 0.027 0.016 0.021 0.023 0.035 Consumption Frequencye regularly -0.008 0.006 -0.016 0.011 -0.020 0.013 0.019 0.013 0.025 0.017 Labeling Yes, local -0.011* 0.006 -0.021* 0.012 -0.027* 0.016 0.025* 0.014 0.035* 0.020 Yes, farm-raised -
0.024*** 0.007 -0.046*** 0.013 -
0.053*** 0.014 0.056*** 0.016 0.068*** 0.017
Membership Yes, Interested in Joining a Community Supported Fishery
-0.016***
0.006 -0.035*** 0.012 -0.047***
0.018 0.037*** 0.012 0.061*** 0.024
Yes, Member of Community Supported Agriculture
0.007 0.012 0.014 0.022 0.016 0.023 -0.017 0.028 -0.020 0.029

41
Table 6: Marginal Effects Regarding Preferences for Fresh vs. Frozen Not at All Rarely/A Little Neutral Mostly/A Lot Entirely
Coeff. Std. Error
Coeff. Std. Error
Coeff. Std. Error
Coeff. Std. Error
Coeff. Std. Error
VARIABLES Demographics
Higher Educationa -0.019* 0.010 -0.028* 0.016 -0.061 0.041 0.003 0.008 0.105 0.073 Bachelor’s Degreea -0.013 0.012 -0.018 0.017 -0.037 0.037 0.006* 0.003 0.061 0.063 Associate’s Degreea -0.020* 0.012 -0.027 0.017 -0.054 0.034 0.011* 0.006 0.089 0.057 High School Graduatea -0.017 0.011 -0.024 0.016 -0.050 0.035 0.008** 0.004 0.083 0.060 Female 0.000 0.006 0.000 0.008 0.001 0.015 -0.000 0.004 -0.001 0.025 Married -0.011* 0.007 -0.015* 0.009 -0.028* 0.016 0.009 0.006 0.046* 0.025 Income -0.000 0.000 -0.000 0.000 -0.000 0.000 0.000 0.000 0.000 0.000 Age -0.001** 0.000 -0.001** 0.000 -0.001** 0.001 0.000** 0.000 0.002** 0.001 Full-timeb -0.008 0.006 -0.010 0.008 -0.020 0.016 0.005 0.004 0.032 0.026 Children 0.002 0.006 0.002 0.008 0.004 0.015 -0.001 0.004 -0.007 0.024 Coast -0.013** 0.006 -0.018** 0.008 -0.037** 0.018 0.007** 0.003 0.061** 0.030 South Carolina -0.015** 0.006 -0.020** 0.008 -0.037** 0.015 0.011** 0.005 0.061** 0.024 Motives for Buying Localc Supporting Local Farmer/Fisherman
-0.008 0.013 -0.011 0.018 -0.023 0.036 0.005 0.007 0.037 0.060
Local Products are of Higher Quality and More Fresh
-0.010 0.013 -0.014 0.018 -0.028 0.036 0.007 0.007 0.046 0.059
Good for the Environment
-0.004 0.016 -0.005 0.023 -0.010 0.046 0.002 0.008 0.017 0.076
Support for a Local Economy
-0.007 0.013 -0.009 0.018 -0.018 0.036 0.004 0.007 0.030 0.060
Other -0.021 0.013 -0.034 0.025 -0.082 0.074 -0.009 0.038 0.157 0.148 Trust in Institutionsd Third-party 0.015 0.020 0.019 0.023 0.032 0.035 -0.014 0.022 -0.052 0.056 State -0.002 0.009 -0.003 0.012 -0.005 0.023 0.001 0.006 0.008 0.038 Feds -0.002 0.008 -0.003 0.011 -0.005 0.020 0.001 0.006 0.008 0.033 Private 0.004 0.012 0.005 0.015 0.009 0.028 -0.003 0.010 -0.015 0.045 Consumption Frequencye regularly -0.007 0.006 -0.009 0.008 -0.017 0.014 0.005 0.004 0.028 0.023
42
*** p<0.01, ** p<0.05, * p<0.1 a: base category is less than high school, b: base category is not full time, c: base category is don’t care for local food, d: base category is do not know, e: base category is occasionally
Labeling Yes, local -0.010 0.006 -0.013 0.009 -0.026 0.017 0.006 0.004 0.043 0.028 Yes, farm-raised -0.018** 0.007 -0.024*** 0.009 -0.044*** 0.016 0.014** 0.007 0.071*** 0.025 Membership Yes, Interested in Joining a Community Supported Fishery
-0.010 0.006 -0.014 0.009 -0.027 0.018 0.006* 0.003 0.045 0.030
Yes, Member of Community Supported Agriculture
0.003 0.011 0.004 0.015 0.007 0.027 -0.002 0.009 -0.012 0.044

43
Table 7: Marginal Effects Regarding Preferences for Wild-Caught vs. Farm-Raised Not at All Rarely/A Little Neutral Mostly/A Lot Entirely
Coeff. Std. Error
Coeff. Std. Error
Coeff. Std. Error
Coeff. Std. Error
Coeff.
Std. Error
VARIABLES Demographics
Higher Educationa -0.039*** 0.013 -0.045*** 0.017 -0.100** 0.050 0.053*** 0.014 0.131**
0.066
Bachelor’s Degreea -0.031** 0.016 -0.034* 0.018 -0.065 0.042 0.044** 0.021 0.086 0.054 Associate’s Degreea -0.027 0.018 -0.028 0.019 -0.046 0.033 0.038 0.025 0.063 0.045 High School Graduatea -0.023 0.017 -0.025 0.019 -0.043 0.036 0.033 0.024 0.058 0.048 Female -0.004 0.009 -0.004 0.009 -0.007 0.013 0.006 0.013 0.009 0.019 Married -0.010 0.009 -0.010 0.009 -0.015 0.014 0.014 0.013 0.021 0.019 Income -0.000 0.000 -0.000 0.000 -0.000 0.000 0.000 0.000 0.000 0.000 Age -0.001** 0.000 -0.001** 0.000 -0.001** 0.001 0.001** 0.000 0.001
** 0.001
Full-timeb 0.011 0.009 0.011 0.009 0.017 0.014 -0.016 0.013 -0.024 0.019Children 0.007 0.009 0.007 0.009 0.011 0.013 -0.010 0.012 -0.015 0.018Coast -0.015* 0.009 -0.016 0.010 -0.026 0.017 0.021* 0.013 0.036 0.023 South Carolina -0.009 0.009 -0.009 0.009 -0.014 0.014 0.013 0.012 0.020 0.019 Motives for Buying Localc Supporting Local Farmer/Fisherman
-0.017 0.019 -0.017 0.020 -0.029 0.036 0.023 0.026 0.039 0.048
Local Products are of Higher Quality and More Fresh
-0.017 0.019 -0.017 0.020 -0.029 0.034 0.024 0.027 0.039 0.046
Good for the Environment
-0.032** 0.015 -0.037* 0.020 -0.082 0.058 0.044** 0.017 0.107 0.076
Support for a Local Economy
-0.011 0.019 -0.012 0.020 -0.019 0.035 0.016 0.027 0.026 0.047
Other -0.010 0.037 -0.010 0.041 -0.017 0.077 0.014 0.053 0.023 0.101 Trust in Institutionsd Third-party -0.007 0.021 -0.007 0.022 -0.011 0.039 0.009 0.029 0.015 0.052 State 0.012 0.014 0.011 0.014 0.017 0.019 -0.016 0.020 -0.024 0.027Feds 0.010 0.012 0.010 0.012 0.016 0.018 -0.014 0.017 -0.022 0.025

44
a: base category is less than high school, b: base category is not full time, c: base category is don’t care for local food, d: base category is do not know, e: base category is occasionally
Private 0.020 0.020 0.018 0.017 0.025 0.020 -0.027 0.026 -0.036 0.031 Consumption Frequencye regularly 0.004 0.008 0.004 0.008 0.007 0.013 -0.006 0.012 -0.009 0.018 Labeling Yes, local -0.006 0.009 -0.006 0.009 -0.009 0.015 0.008 0.013 0.013 0.021
Yes, farm-raised -0.064*** 0.012 -0.059*** 0.011 -0.080***
0.013 0.085*** 0.015 0.119***
0.018
Membership Yes, Interested in Joining a Community Supported Fishery
-0.019** 0.009 -0.020** 0.010 -0.034* 0.018 0.027** 0.013 0.046*
0.024
Yes, Member of Community Supported Agriculture
-0.018 0.013 -0.019 0.015 -0.035 0.031 0.025 0.018 0.047 0.040
*** p<0.01, ** p<0.05, * p<0.1

45
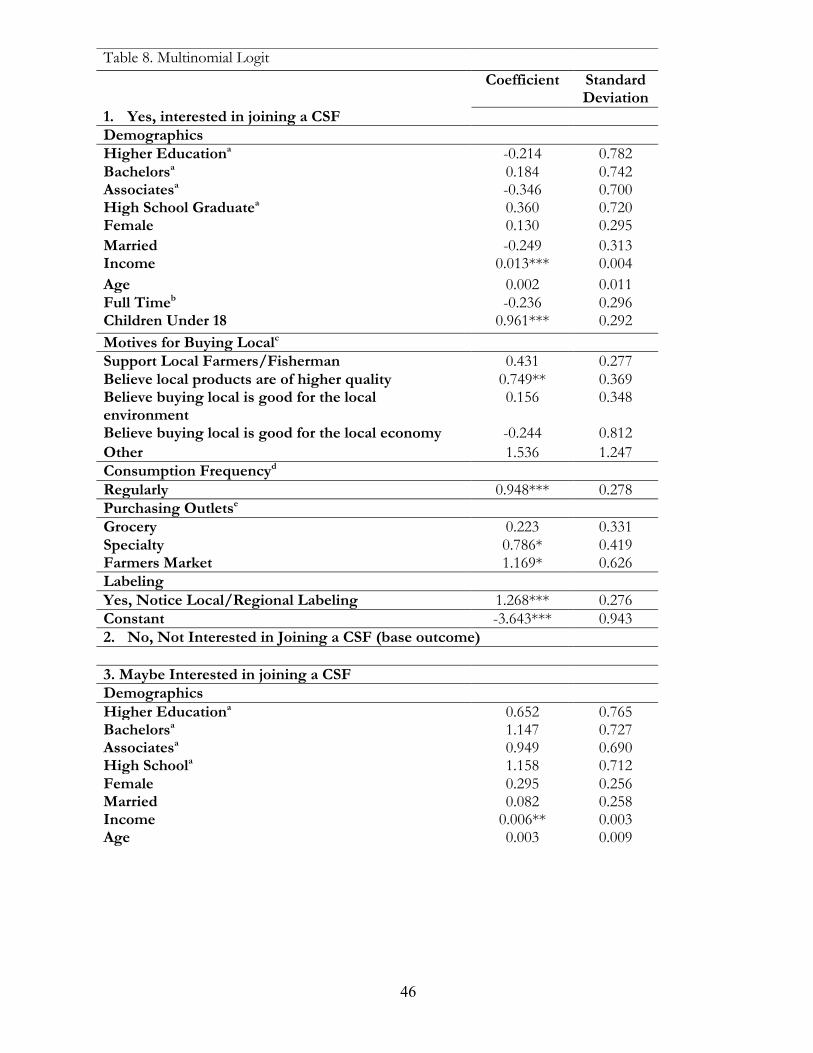
Multinomial Logit Model Results
The results of the multinomial logit formulation are reported in Table 8. My findings
indicate that the factors impacting interest in CSF membership vary. For instance, with the
exception of income and having children under 18, none of the other examined demographics
had a statistically significant effect on the relative probability that a consumer would be
interested in joining a CSF as opposed to the base category, not being interested in joining.
Both of these factors (income and kids) had a positive coefficient. Thus, consumers who have
higher income and/or children under 18 in the household are more likely to join a CSF. This
can be explained because CSF arrangements are costlier compared to regular seafood
purchases (Table 8).
Second, respondents who consume seafood products regularly are more likely to be
interested in joining a CSF as well as those consumers who purchase seafood from specialty
stores and farmer’s markets (Table 8). On the other hand, those that eat seafood regularly are
also more likely to “maybe” be interested in joining a CSF (Table 8). Labeling is also important
for consumers who are interested in joining a CSF (Table 8). Those who notice local/regional
labeling are more likely to be interested in joining a CSF as opposed to those who do not
(Table 8).
In line with Campbell et al. (2014), consumers who believe that local fish are of higher
quality are more likely to join a CSF arrangement in the future.
46
Table 8. Multinomial Logit Coefficient Standard
Deviation 1. Yes, interested in joining a CSFDemographics Higher Educationa -0.214 0.782 Bachelorsa 0.184 0.742 Associatesa -0.346 0.700 High School Graduatea 0.360 0.720 Female 0.130 0.295 Married -0.249 0.313 Income 0.013*** 0.004 Age 0.002 0.011 Full Timeb -0.236 0.296 Children Under 18 0.961*** 0.292 Motives for Buying Localc
Support Local Farmers/Fisherman 0.431 0.277 Believe local products are of higher quality 0.749** 0.369 Believe buying local is good for the local environment
0.156 0.348
Believe buying local is good for the local economy -0.244 0.812 Other 1.536 1.247 Consumption Frequencyd Regularly 0.948*** 0.278 Purchasing Outletse
Grocery 0.223 0.331 Specialty 0.786* 0.419 Farmers Market 1.169* 0.626 Labeling Yes, Notice Local/Regional Labeling 1.268*** 0.276 Constant -3.643*** 0.943 2. No, Not Interested in Joining a CSF (base outcome)
3. Maybe Interested in joining a CSFDemographics Higher Educationa 0.652 0.765 Bachelorsa 1.147 0.727 Associatesa 0.949 0.690 High Schoola 1.158 0.712 Female 0.295 0.256 Married 0.082 0.258 Income 0.006** 0.003 Age 0.003 0.009

47
*** p<0.01, ** p<0.05, * p<0.1 a: base category is less than high school, b: base category is not full time, c: base category is don’t care for local food, d: base category is base category is occasionally, e: base category is box stores
Fulltimeb -0.188 0.253 Children 0.052 0.246 Motives for Buying Localc Support Local Farmers/Fisherman -0.241 0.245 Believe local products are of higher quality 0.073 0.314 Believe buying local is good for the local environment
0.085 0.282
Believe buying local is good for the local economy 0.380 0.588 Other 0.323 0.869 Consumption Frequencyd
Regularly 0.603*** 0.230 Purchasing Outletse Grocery 0.063 0.262 Specialty 0.217 0.371 Farmers Market -0.101 0.675 Labeling Yes, Notice Local/Regional Labeling -0.125 0.238 Constant -2.184*** 0.846

48
Marginal Effects
The estimated marginal effects for the three possible preferences (yes, no, maybe)
examined are presented in Tables (9-11). The results indicate that as income increases,
consumers are .2 percentage points more likely to be interested in joining a CSF (Table 9). For
families with children under the age of 18, are 15.1 percentage points more likely to be
interested in joining a CSF (Table 9). A couple of reasons may explain this outcome. First,
consumers with young children may demand more seafood products for health reasons.
Second, these consumers may want to introduce their children to fishing practices. Consumers
who do not have children under 18 in the household are 9.5 percentage points less likely to
join a CSF (Table 10).
Consumers who shop at a farmer’s market for their groceries are 28.7 percentage
points more likely to be interested in joining a CSF (Table 10). This could be because people
who shop at farmer’s markets for their groceries prefer the interaction with the farmer and
like to know where their produce came from and that translates to seafood. Lastly, responders
who consume seafood regularly are 10.6 percentage points more likely to be interested in
joining a CSF.

49
Table 9. Multinomial Logit Marginal Effects for “Yes, interested in joining a CSF"
Coefficient Standard Deviation
Demographics Higher Educationa -0.019 0.113 Bachelorsa -0.006 0.112 Associatesa -0.068 0.101 High Schoola 0.020 0.117 Female 0.005 0.043 Married -0.053 0.049 Income 0.002*** 0.000 Age 0.000 0.002 Full Timeb -0.028 0.043 Children 0.151*** 0.044 Motives for Buying Localc Support Local Farmers/Fisherman 0.018 0.112 Believe local products are of higher quality -0.081 0.103 Believe buying local is good for the local environment
-0.123 0.078
Believe buying local is good for the local economy -0.101 0.087 Other 0.107 0.274 Consumption Frequencyd Regularly 0.106*** 0.040 Purchasing Outletse Grocery 0.027 0.049 Specialty 0.127 0.077 Farmers Market 0.287** 0.142 Labeling Yes, Notice Local/Regional Labeling 0.223*** 0.042 *** p<0.01, ** p<0.05, * p<0.1 a: base category is less than high school, b: base category is not full time, c: base category is don’t care for local food, d: base category is base category is occasionally, e: base category is box stores

50
*** p<0.01, ** p<0.05, * p<0.1 a: base category is less than high school, b: base category is not full time, c: base category is don’t care for local food, d: base category is base category is occasionally, e: base category is box stores
Table 10. Multinomial Logit Marginal Effects for “No, not interested in joining a CSF"
Coefficient Standard Deviation
No, Not interested in joining a CSF Demographics Higher Educationa -0.095 0.153 Bachelorsa -0.198 0.132 Associatesa -0.125 0.134 High Schoola -0.210* 0.126 Female -0.058 0.056 Married 0.010 0.057 Income -0.002*** 0.001 Age -0.001 0.002 Full Timeb 0.051 0.056 Children -0.095* 0.053 Motives for Buying Localc Support Local Farmers/Fisherman -0.004 0.053 Believe local products are of higher quality -0.083 0.067 Believe buying local is good for the local environment -0.027 0.063 Believe buying local is good for the local economy -0.047 0.131 Other -0.206 0.175 Consumption Frequencyd Regularly -0.178*** 0.049 Purchasing Outletse Grocery -0.030 0.059 Specialty -0.108 0.077 Farmers Market -0.126 0.119 Labeling Yes, Notice Local/Regional Labeling -0.101** 0.050

51
*** p<0.01, ** p<0.05, * p<0.1 a: base category is less than high school, b: base category is not full time, c: base category is don’t care for local food, d: base category is base category is occasionally, e: base category is box stores
Table 11. Multinomial Logit Marginal Effects for “Maybe interested in joining a CSF"
Coefficient Standard Deviation
Maybe interested in joining a CSF Demographics Higher Educationa 0.172 0.181 Bachelorsa 0.260 0.167 Associatesa 0.245 0.153 High Schoola 0.248 0.166 Female 0.057 0.052 Married 0.037 0.054 Income 0.001 0.001 Age 0.001 0.002 Full Timeb -0.026 0.053 Children -0.058 0.051 Motives for Buying Localc Support Local Farmers/Fisherman -0.086* 0.049 Believe local products are of higher quality -0.043 0.065 Believe buying local is good for the local environment 0.008 0.060 Believe buying local is good for the local economy 0.108 0.136 Other -0.092 0.188 Consumption Frequencyd Regularly 0.070 0.048 Purchasing Outletse Grocery -0.002 0.056 Specialty -0.018 0.075 Farmers Market -0.127 0.112 Labeling Yes, Notice Local/Regional Labeling -0.123*** 0.047

52
Conclusion
Over the last few years, a number of important changes have been taking place in the
seafood industry. First, demand for seafood products has been rising since 2013 (NOAA,
2015). Second, the increasing amount of imports and the aquaculture industry are creating a
highly competitive environment. Third, local seafood marketing is gaining popularity (Chase
and Orrs, 2016). These facts create a challenge for the seafood industry and highlight the
importance of good target marketing and in-depth knowledge of the factors that influence
consumer preferences. Moreover, for direct/ local seafood marketing endeavors to be
successful, it is important to identify the group of consumers who will be more
interested/willing to participate in these non-traditional seafood marketing outlets.
The present thesis utilized data collected from KY and SC residents through an online
survey to evaluate how different consumer characteristics ranging from their demographics to
their preferences for local food consumption influence their seafood-purchasing decisions.
Consumer preferences were measured with the use of a series of Likert scale questions. An
ordered Probit and a multinomial Logit model were used to analyze the data.
The findings indicate that a number of demographic characteristics such as education
and residency have significant effect on consumer preferences on package form (fresh vs.
frozen) and production method (wild-caught vs. farm-raised). More educated consumers are
more likely to prefer fresh and wild-caught seafood products. Few of the demographic
characteristics influence the probability that consumer purchasing decisions will be affected
by sustainability or environmental statements. One exception is that female consumers are
more likely to be influence by sustainability and environmental effects so those labels would
be preferred by females. Future research endeavors could include greater emphasis on whether
53
or not sustainability and environmental statements have a significant effect on consumer
purchasing decisions.
Furthermore, the thesis results highlight that consumers who trust state agencies to
certify seafood are more likely to prefer fresh and wild-caught products. In contrast to my
initial expectations, consumers who notice local and regional labels are less likely to prefer
fresh and wild-caught seafood products. A potential explanation for this finding is that these
types of consumers may consider aquaculture environmentally more friendly than traditional
fishing.
Regarding consumer’s intention to join a CSF in the future, the findings indicate that
demographic characteristics had a limited impact on the probability that the consumer will
join a CSF in the future. Consumer purchasing habits have a statistically significant effect on
the decision to join a CSF arrangement. For instance, consumers who notice local labels are
more likely to join a CSF. These results are consistent with findings for community supported
agriculture membership that indicate that demographic characteristics may not be an
important determinant in consumer’s decision to join a CSA. Thus, it is important for CSF
managers to target consumers based on their purchasing habits and not focusing on
demographic characteristics. As a CSF manager looking for consumers who are interested in
joining a CSF, farmer’s markets are the correct location to advertise because these are the
consumers who are going to be the most willing to join. Future research needs to be done on
CSF membership, across all U.S. states, in order to get a better picture for the preferences
among different regions.

54

55
APPENDIX
This is the survey instrument we used for the study.
Please check the boxes that best describe you and your preferences
1. Are you the primary grocery shopper for the household?o Yes ○ No
2. About how much per week does your household spend on groceries?$________/WEEK
3. In the summer months (typically May-September), how often do you visit a farmers’market?
o Less than 1 time a montho 1-2 times a montho 3-4 times a montho 5-6 times a montho 7-8 times a montho More than 8 times a month
4. Please rank the following grocery stores you most frequently visit during the year?o Kroger/Harris Teetero Wal-Marto Whole Foodso Fresh Marketo Grocery Cooperative/Co-opo Specialty (e.g., Ethnic)o Trader Joeso Other (specify_______________________)
5. Have you or your household ever been a member of a community supportedagriculture, known as the CSA?
o Yes ○ No ○ Don’t know / Not Sure
6. Do you consume fish/seafood?o At home onlyo At restaurants onlyo At home and restaurantso Not at all (specify main reasons) __________________________
7. How often do you consume fish/seafood?o More than once a week

56
o Every weeko Every other weeko Once a montho Once or twice every six months
8. What is the most important factor you consider when consuming/purchasingfish/seafood?
o Tasteo Consistent availability in retail/market outletso Priceo Food safety (e.g. Mercury levels)o Health attributes of fish/seafood product (e.g. Omega-3’s)o Ease of preparation (e.g. fish sticks and other microwaveable products)o How fresh the product iso Other (specify)______________________
9. What are the biggest concerns in consuming fish/seafood (choose all that apply)?o Mercury levelso Sustainability of the fish stock I’m consuming (e.g. “Does my consumption
affect the number of fish in the sea?”)o By-catch (e.g. not intending to capture other ocean creatures – example
would be if fishing for salmon and unintentionally caught sea turtles)o Don’t like the flavor or smello Food allergies (e.g. shellfish allergy)o Availability or consistency in retail outletso Preparation at homeo Other (Specify) ____________
10. What are the biggest challenges with consuming fish/seafood products at home?o Mess or smell in the kitcheno Don’t know how to properly prepareo No one in my home prefers to consume fish/seafoodo I would rather eat outside of home instead of preparing myselfo Someone in household has fish/seafood allergy

57
11. Please answer YES, NO, or NOT SURE to whether you have consumed thefollowing categories of FISH/SEAFOOD within the past year.
YES NO NOT SURE
[This logo will be
changed to SC version in South Carolina]
Marine Stewardship Council
Best Aquaculture Practices
Wild-caught
Farm-Raised
Homegrown by Heroes

58
12. When considering the institutions, please rank the agencies (from top to bottom)your most likely to TRUST for certifying a fishery or aquaculture operation asenvironmentally sustainable? [This question will be made into a “drag and rank”format once online.]
o National Marine Fisheries Service (federal agency)o Marine Stewardship Council (third-party agency)o Industry Group (private organization)o United States Department of Agriculture (federal agency)o State Department of Fish & Wildlifeo Place of purchase (business you’re buying from)o State Department of Agriculture
13. What is the single most important aspect of consuming fish/seafood products thatare LOCAL?
o Supporting local fishermen/farmerso Local products are of higher quality and freshero Local products are good for the environmento Support for a local economy &community/businesseso Other (Specify)______
14. Please respond to the following statements on a scale of 1 to 5, where “1” is NOTAT ALL and “5” is ENTIRELY.To what extent does the sustainability and environmental effects of the fish/seafood you consume (e.g., bycatch and health of fish stocks; environmental effects of aquaculture) affect your purchasing decision?
1 2 3 4 5
How difficult is it for you as a consumer to purchase/source local or regional fish/seafood products?
1 2 3 4 5
To what extent does quality labeling influence your decision in purchasing fish/seafood?
1 2 3 4 5
How strongly do you prefer the fish/seafood products to be fresh vs. frozen?
1 2 3 4 5
How strongly do you prefer the fish/seafood products to be wild-caught vs. farm-raised?
1 2 3 4 5

59
Saltwater Shrimp
15. Within the past two months (60 days) which of the following fish/seafood specieshave you purchased for home consumption (please select all that apply)?
o Freshwater shrimpo Saltwater shrimpo Farm-raised salmon (e.g. Atlantic Salmon)o Wild-caught salmon (e.g. Sockeye, King, Coho)o Farm-raised catfisho Wild-caught catfisho Bass ○ Canned Tuna ○ Musselso Crab ○ Clams ○ Oysters

60
o Wild-caught tuna ○ Tilapiao Cod ○ Scallops ○ Trouto Crawfisho Other (Specify) ________
16. Please answer YES, NO, or NOT SURE to the following questions
Yes No Not Sure
Have you noticed Country of Origin labeling on seafood products when making purchasing decisions? Have you noticed Local/Regional labeling on seafood products when making purchasing decisions? Have you noticed labels specifying whether seafood is farm-raised (aquaculture) or wild caught? Do you recognize the MSC (Marine Stewardship Council) label/certification on seafood products?
Do you recognize the BPA (Best Aquaculture Practices) label/certification on fish/seafood products?
Have you heard of a Community Supported Fishery (CSF)? Would you be interested in joining a Community Supported Fishery (resulting definition below)? Have you or any direct family members participated in any military service?

61
Have you ever heard of Homegrown by Heroes? Have you heard of the Monterrey Bay Aquarium’s Seafood Watch?
We would really appreciate to know a bit more about people who complete this survey. Please answer the following questions about yourself.
1. What state do you live in most of the year and what is the closest major city?
State: ________________Major City: ________________Zip Code: ________________
2. What is your gender?
o Femaleo Male
3. What is your age?
o 18-24o 25-34o 35-44o 45-54o 55-64o 65 years and over
4. What is the highest level of education you have completed?
o 8th grade or lesso Some high schoolo High School Graduate or equivalento Some College/Technical School or Associate’s Degreeo Bachelor’s or 4 Year Degreeo Graduate, Professional or other Advanced degree
5. What is your Marital Status?
o Single or living aloneo Single, living with roommateso Married or living with partnero Other (Please Specify): ______________
6. How many people are in your household?

62
________________ individuals
7. What is your household annual income before taxes? Note, this does not includenon-family members such as roommates.
o Less than $10,000o $10,000 to $14,999o $15,000 to $24,999o $25,000 to $34,999o $35,000 to $49,999o $50,000-$74,999o $75,000-$99,999o $100,000-$149,999o $150,000-$199,999o $200,000 or more
8. Do you have any children under the age of 18 who live in your household?o Yeso No
9. Employment Status (Please check all that apply):o Full Timeo Part Timeo Self-employedo Retiredo Currently not employedo Homemakero Studento Other (Please Specify): ______________
10. Did you grow up within 50 miles of a seacoast?
11. In the past year, have you supported any environmental organizations with your timeor a contribution?
o Yeso No
Thank you very much for completing this survey. Please feel free to share comments in the area below.

63

64
References
Abdel-Aty, M. A. 2001. “Using ordered probit modeling to study the effect of ATIS on
transit ridership.” Transportation Research Part C: Emerging Technologies, 9, 265–277.
Arvanitoyannis, I., Krystallis, A., Panagiotaki, P., and Theodorou, A. J. (2004). “A
marketing survey on Greek consumers’ attitudes towards fish.” Aquaculture
International, 12(3), 259–279.
Asche, F., Bellemare, M. F., Roheim, C., Smith, M. D., and Tveteras, S. (2015). “Fair
enough? Food security and the international trade of seafood.” World Development, 67,
151–160.
Birch, D., Lawley, M., and Hamblin, D. (2012). “Drivers and barriers to seafood
consumption in Australia.” Journal of Consumer Marketing, 29(1), 64–73.
Bolton, A. E., Dubik, B. A, Stoll, J.S., Basurto, X., (2016). “Describing the diversity of
community supported fishery programs in North America.” Marine Policy, 66, 21-29
Bosch, A. C., O'Neill, B., Sigge, G. O., Kerwath, S. E. and Hoffman, L. C. (2016), “Heavy
metals in marine fish meat and consumer health: a review” Journal of the Science of
Food and Agriculture., 96, 32–48.
Brinson, A., Lee, M. Y., & Rountree, B. (2011). “Direct marketing strategies: The rise of
community supported fishery programs.” Marine Policy, 35(4), 542-548.
Brunsø, K., Verbeke, W., Olsen, S. O., and Jeppesen, L. F. (2009). “Motives, barriers and
quality evaluation in fish consumption situations: Exploring and comparing heavy
and light users in Spain and Belgium.” British Food Journal, 111(7), 699–716.
Burger J., (2002). “Consumption patterns and why people fish.” Environmental Research,
90:125–135.

65
Burger, J., and Gochfeld, M. (2009). “Perceptions of the risks and benefits of fish
consumption: Individual choices to reduce risk and increase health benefits.”
Environmental Research, 109(3), 343–349.
Burger, J., Stephens, W. L., Boring, C. S., Kuklinski, M., Gibbons, J. W., and Gochfeld, M.
(1999). “Factors in exposure assessment: Ethnic and socioeconomic differences in
fishing and consumption of fish caught along the Savannah River.” Risk Analysis, 19,
427–438.
Cameron, A. C., and Trivedi, P. K. (2009). Microeconometrics using Stata. College Station, TX:
Stata Press.
Campbell, L.M., Boucquey, N., Stoll J., Coppola H., and Smith M. (2014). “From vegetable
box to seafood cooler: Applying the community-supported agriculture model to
fisheries.” Society and Natural Resources, 27, 88–106.
Cardoso, C., Lourenço, H., Costa, S., Gonçalves, S., and Nunes, L. M. (2013). “Survey into
the seafood consumption preferences and patterns in the Portuguese population.
Gender and regional variability.” Appetite, 64, 20–31.
Carlucci, D., Nocella, G., De Devitiis, B., Viscecchia, R., Bimbo, F., and Nardone, G. (2015).
“Consumer purchasing behavior towards fish and seafood products. Patterns and
insights from a sample of international studies.” Appetite, 84, 212–227.
Chase, A., Otts, S. (2016). “Connecting Local Seafood & Consumers: Direct Marketing
101”. National Sea Grant Law Center. https://localcatch.org/wp-
content/uploads/2016/12/CLSC-Direct-Marketing-101.pdf

66
Christian, C., Ainley, D., Bailey, M., Dayton, P., Hocevar, J., LeVine, M., Nikoloyuk, J.,
Nouvian, C., Velarde, E., Werner, R., and Jacquet, J. (2013). “A review of formal
objections to Marine Stewardship Council Fisheries Certifications.” Biological
Conservation, 161, 10–17.
Claret, A., Gerrero, L., Aguirre, E., Rincon, L., Hernandez, M. D., Martinez, I., Peleteiro, J.
B., Grau, A., and Rodriguez-Rodriguez, C. (2012). “Consumer preferences for sea
fish using conjoint analysis. Exploratory study of the importance of country of
origin, obtaining method, storage conditions and purchasing price.” Food Quality and
Preference, 26(2), 259–266.
Coit, M. (2008). Jumping on the next bandwagon: An overview of the policy and legal
aspects of the local food movement. Journal of Food Law Policy 4(1), 45-70.
Davidson, K., Pan, M., Hu, W., and Poerwanto, D. (2012). “Consumers’ willingness to pay
for aquaculture fish products vs. wild-caught seafood – A case study in Hawaii.”
Aquaculture Economics & Management, 16(2), 136–154.
Delind, L. B. (2010). “Are local food and the local food movement taking us where we
want to go? Or are we hitching our wagons to the wrong stars?” Agriculture and
Human Values, 28(2), 273-283.
Dey, M. M., Surathkal, P., Chen, O. L., and Engle, C. R. (2017). “Market trends for seafood
products in the USA: Implication for Southern aquaculture products.” Aquaculture
Economics & Management, 21(1), 25–43.

67
Dillman, D. A., Smyth, J. D., and Christian, L. M. (2009). Internet, mail, and mixed-mode surveys:
The tailored design method (3rd ed.). Hoboken, NJ: Wiley & Sons.
Food and Drug Administration.
https://www.fda.gov/Food/ResourcesForYou/Consumers/ucm393070.htm. Last
accessed Dec. 6. 2017
Fonner, R., and Sylvia, G. (2015). “Willingness to pay for multiple seafood labels in a niche
market.” Marine Resource Economics, 30(1), 51–70.
Godwin, S. C., Francis, F. T., Howard, B. R., Malpica-Cruz, L., & Witter, A. L. (2017).
“Towards the economic viability of local seafood programs: Key features for the
financial performance of community supported fisheries.” Marine Policy, 81, 375-
380.
Gutiérrez, A. T., and Morgan, S. K. (2015). “The influence of the Sustainable Seafood
Movement in the US and UK capture fisheries supply chain and fisheries
governance.” Frontiers in Marine Science, 2, 72.
Hall, E. T., and Amberg, M. S. (2013). “Factors influencing consumption of farmed seafood
products in the Pacific Northwest.” Appetite, 66, 1–9.
Hanson, T. R., and Rose, P. (2011). “College students’ opinions of U.S. farm-raised catfish.”
Journal of Food Distribution Research, 42(1), 67–71.
He, S., Fletcher, S., and Rimal, A. (2003). “Identifying factors influencing beef, poultry, and
seafood consumption.” Journal of Food Distribution Research, 34(1), 50-55.
Hicks, D., Pivarnik, L., and McDermott, R. (2008). “Consumer perceptions about seafood –
An Internet survey.” Journal of Foodservice, 19, 213–226.
68
Honkanen, P., and Olsen, O. S. (2009). “Environmental and animal welfare issues in
food choice: The case of farmed fish.” British Food Journal, 111(3), 293–309.
Jahns, L., Raatz, S., Johnson, L., Kranz, S., Silverstein, J., and Picklo, M. J. (2014). “Intake of
seafood in the US varies by age, income, and education level but not by race-
ethnicity.” Nutrients, 6(12), 6060–6075.
Johnston, R., Wessells, C., Donath, H., and Asche, F. (2001). “Measuring consumer
preferences for ecolabeled seafood: An international comparison.” Journal of
Agricultural and Resource Economics, 26(1), 20–39.
Kantor, L. (2016). “Americans’ seafood consumption below recommendations.” Retrieved
from https://www.ers.usda.gov/amber-waves/2016/october/americans-seafood-
consumption-below-recommendations/
Kumar, G., Quagrainie, K., and Engle, C. (2008). “Factors that influence frequency of
purchase of catfish by U.S. households in selected cities.” Aquaculture Economics &
Management, 12(4), 252–267.
Lund, E. K. (2013). “Health benefits of seafood; Is it just the fatty acids?” Food Chemistry,
140(3), 413–420.
Local Catch. (n.d.). Retrieved November 07, 2017, from https://localcatch.org/
Mendiguchía, C., Moreno, C., Mánuel-Vez, M. P., García-Vargas, M., (2006). “Preliminary
investigation on the enrichment of heavy metals in marine sediments originated from
intensive aquaculture effluents” Aquaculture, 254(1–4), 317-325
McClenachan, L., Neal, B., Al-Abdulrazzak, D., Witkin, T., Fisher, K., and Kittinger, J.
(2014). “Do community supported fisheries (CSFs) improve sustainability?” Fisheries
Research, 157, 62-69.

69
Myrland, Ø., Trondsen, T., Johnston, R. S., and Lund, E. (2000). “Determinants of seafood
consumption in Norway: Lifestyle, revealed preferences, and barriers to
consumption.” Food Quality and Preference, 11(3), 169–188.
NOAA Fisheries National Seafood Consumption Survey (2015). Retrieved from
http://www.st.nmfs.noaa.gov/Assets/commercial/fus/fus15/documents/FUS2015.
Nguyen, T. T., Haider, W., Solgaard, H. S., Ravn-Jonsen, L., and Roth, E. (2015).
“Consumer willingness to pay for quality attributes of fresh seafood: A labeled latent
class model.” Food Quality and Preference, 41, 225–236.
Nie C., Zepeda L., (2011). “Lifestyle segmentation of US food shoppers to examine organic
and local food consumption” Appetite, 57 (1), 28-37.
O’Dierno, L., Govindasam, R., Puduri, V., Myers, J. J., and Islam, S. (2006). “Consumer
perceptions and preferences for organic aquatic products aquatic products: Results
from the telephone survey.” New Brunswick, NJ: New Jersey Agricultural
Experiment Station, Rutgers University Department of Agricultural, Food and
Resource Economics.
Olsen, O. S. (2003). “Understanding the relationship between age and seafood consumption:
The mediating role of attitude, health involvement and convenience.” Food Quality
and Preference, 14(3), 199–209.
Ortega, D. L., Wang, H. H., and Olynk Widmar, N. J. (2014). “Aquaculture imports from
Asia: An analysis of U.S. consumer demand for select food quality attributes.”
Agricultural Economics, 45, 625–634.

70
Peavey, S., Work, T., & Riley, J. (1994). “Consumer attitudes toward fresh and frozen
fish.” Journal of Aquatic Food Product Technology, 3(2), 71–87.
Pérez-Ramírez, M., Almendarez-Hernández, M., Avilés-Polanco, G., & Beltrán-Morales,
L. (2015). “Consumer Acceptance of Eco-Labeled Fish: A Mexican Case
Study.” Sustainability,7(4), 4625-4642.
Perkinson, M. T., Faith, T. D., Vahey, G. M., Vena, J. E., & Williams, E. M. (2016).
“Quantifying the Seafood Consumption Patterns of Recreational Anglers in
Charleston and Berkeley Counties, South Carolina.” Environmental Health Insights,
10, 201–210.
Quagrainie, K., Hart, S., and Brown, P., (2008). “Consumer acceptance of locally grown
food: The case of Indiana aquaculture products.” Aquaculture Economics &
Management, 12(1), 54–70.
Røra, A. M. B., Monfort, M. C., and Espe, M. (2004). “Effects of country of origin on
consumer preference of smoked salmon collected in a French hypermarket.” Journal
of Aquatic Food Product Technology, 13, 69-85.
Smith, S., Varble, S., & Secchi, S. (2015). “Fish Consumers: Environmental Attitudes and
Purchasing Behavior.” Journal of Food Products Marketing, 23(3), 267-282.
Sogn-Grundvag, G., Larsen, T. A., and Young, J. A. (2013). “The value of line-caught and
other attributes: An exploration of price premiums for chilled fish in UK
supermarkets.” Marine Policy, 38, 41–44.

71
Soley, G. T. (2016). Farmed and wild-caught shrimp in Kentucky and South Carolina:
Consumer preference for homegrown by heroes, community supported fishery, and
other quality attributes. Theses and Dissertations--Agricultural Economics. Paper 39.
Stoll, J., B. Dubik, L. Campbell. (2015). “Local seafood: rethinking the direct marketing
paradigm.” Ecology & Society, 20(2), 1-14
Stoll, J. S., and Johnson, T. R. (2015). “Under the banner of sustainability: The politics and
prose of an emerging US federal seafood certification.” Marine Policy, 51, 415–422.
Train, K. (2009). Discrete choice methods with simulation. Cambridge, UK: Cambridge Univ. Press.
Trondsen, T., Braaten, T., Lund, E., and Eggen, A. (2004). “Health and seafood
consumption patterns among women aged 45–69 years. A Norwegian seafood
consumption study.” Food Quality and Preference, 15(2), 117–128.
US Census Bureau. (2011). http://factfinder.census.gov/servlet/DatasetMainPageServlet
US Agricultural Marketing Service. (2017). https://www.ams.usda.gov/
US Dietary Guidelines. (2015-2020). https://health.gov/dietaryguidelines/2015/guidelines/
Vanhonacker, F., Altintzoglou, T., Luten, J. B., and Verbeke, W. (2011). “Does fish origin
matter to European consumers? Insights from a consumer survey in Belgium,
Norway and Spain. British Food Journal, 113(4), 535–549.
Verbeke, W., Sioen, I., Brunsø, K., De Henauw, S., Van Camp, J. (2007) “Consumer
perception versus scientific evidence of farmed and wild fish: exploratory insights
from Belgium” Aquaculture International, 15, 121.

72
Verbeke, W., and Vackier, I. (2005). “Individual determinants of fish consumption.
Application of the theory of planned behavior.” Appetite, 44(1), 67–82.
Wan, W., and Hu, W. (2012). “At-home seafood consumption in Kentucky: A double-hurdle
model approach.” Paper presented at SAEA annual meeting, Birmingham, AL,
February 4–7.
Wang, H. H., Zhang, X., Ortega, D. L., and Olynk Widmar, N. J. (2013). “Information on
food safety, consumer preference and behavior: The case of seafood in the US.” Food
Control, 33(1), 293–300.
Wessells, R. C, Johnston, R. J., and Donath, H. (1999). “Assessing consumer preferences for
ecolabeled seafood: The influence of species, certifier, and household attributes.”
American Journal of Agricultural Economics, 81(5), 1084–1089.
Willis, D. B., and Straka, T. J. (2017). “The economic contribution of natural resources to a
state economy: A South Carolina case study. Natural Resources, 8, 115–129.
Witter, A., 2012. Local seafood movements and seafood sustainability in North America.
In: M.S. Thesis, Environmental Sciences, Policy and Management. University of
the Aegean, Lund University, Lund, Sweden.
Zhou, G., Hu, W., and Huang, W. (2016). “Are consumers willing to pay more for
sustainable products? A study of eco-labeled tuna steak.” Sustainability, 8(5), 49.
2015 Local Food Marketing Practices Survey. (2016, December). Retrieved November
08, 2017,https://www.agcensus.usda.gov/Publications/2012/Online_Resources/Lo
cal_Food/index.php