Embed Size (px)
Citation preview

Factors and Spatial Pattern Analysis of Land Price, (7113) Catur Kuat Purnomo, Wahyu Sari Sabekti and Dian Permana Sari (Indonesia) FIG Congress 2014 Engaging the Challenges - Enhancing the Relevance Kuala Lumpur, Malaysia 16 – 21 June 2014
1/16 Factors
Factors and Spatial Pattern Analysis of Land Price
Catur Kuat PURNOMO, Wahyu Sari SABEKTI and Dian Permana SARI, Indonesia
Key words: land price, spatial pattern, spatial dependence SUMMARY
Based on Presidential Decree Number 63 Year 2013 about National Land Agency Article 25 point d about the implementation of land acquisition for development activities in the public interest needs the fast, reliable, fair and independent land valuation, which the results of the assessment for the land causes a lot of conflict of interest and horizontal conflict due to the aggrieved stakeholders. To get the fast, reliable, fair and independent assessment result, factor analysis and the spatial pattern of land price are required, spatial regression method can be used to showing land price factors spatially, to identify spatial pattern of land price, to identify imaginary land values zones and also to find out the effect of spatial dependence on nearest neighbors. The results are expected to reduce appraiser subjectivity in assessing land price.
This study uses Global Moran's I index, regression maximum likelihood spatial lag and spatial error and Moran's scatterplot to identify factors and spatial pattern that influence land price in accordance with market and land tax value (NJOP). There are five variables used: the distance to the city center, the distance to the nearest university, the distance to the nearest station, the average house size, and the number of buildings.
The results show that the significant spatial factors affecting land price are the distance to city center (51.28%), the distance to the nearest university (18.21%), the distance to the nearest station (24.29%) and the number of buildings factor (24.83%). The average house size factor has no significant effect on land price based on the market. Meanwhile, the significant factor which influence land tax value are the distance to the city center (24.98%), the distance to the nearest university (17.20%), the distance to the nearest station (21.52%) and the number of buildings (27.37%), while the average house size factor has no significant effect on land tax value (NJOP). The spatial pattern of land price in the market is identified having systematic pattern or clustered. Spatial lag models can explain the variation of market based on the value of ρ(rho) 19.62% and variation land tax value with value ρ(rho) 20.31%. The spatial error models can explain the variation of market with λ(lambda) 24.96% and the land tax value of λ(lambda) 25.51%. However, as conclusion, all results are not strong enough to show the effect of spatial dependence on nearest neighbors.

Factors and Spatial Pattern Analysis of Land Price, (7113) Catur Kuat Purnomo, Wahyu Sari Sabekti and Dian Permana Sari (Indonesia) FIG Congress 2014 Engaging the Challenges - Enhancing the Relevance Kuala Lumpur, Malaysia 16 – 21 June 2014
2/16 Factors
Factors and Spatial Pattern Analysis of Land Price
Catur Kuat PURNOMO, Wahyu Sari SABEKTI and Dian Permana SARI, Indonesia
1. INTRODUCTION
The rapid economic development has stimulated the use of lands in urban area. Basically every human activities highly requires spaces on earth. In line with other substantial factors such as, lands become essential parameters to determine appropriate places for particular uses. Due to the rapid development, demands on land are increasingly arisen and these are the indicators of the urban economic movement. The high demands have to be offset by the availability of sufficient land for the development activities which tend to grow.
The location, availability, and price of land are an important consideration in development planning. (Ricardo, 1817) defines explicitly the effects of location on land lease related to distance, potency or the level of soil fertility and the geography of the land, the near to the market or city center, and the transportation cost. With regard to that idea, it is formulated a hypothesis that concentric area from various land uses is based on the level of transportation cost, the relative production rates and the particular factors (Von Thünen, 1926).
Based on Christaller (1933), concentric area containing of various land uses are evolved becoming an urban hierarchy and having a center of urban economic activities. In that model, Christaller develops a hexagonal model deriving from circular area intersecting. Each of hexagonal area has its center and the center’s size depends on the size of the hexagonal area. (Lösch, 1940) expands the Christaller’s center theory, by creating a equilibrium model of spatial area and introduces basic principles of spatial analysis and inteprets spatial economy under the basic form of monopolistic competition.
According toly, (Boudeville, 1961) elaborating an allocated development (considering geographical aspects), defines the poles of area development are a set of developing industries allocating in a urban area and these stimulate the effects of the development of economic region. The theory is inderectly complement the Christaller’s and Lösch’s theory of space center. Moreover (1964), reviews a wider scope by placing the theory of core region. The core region has dominant functions to the development of areas such as service center, commerce and industries. This core region is then surrounded by periphery regions.
In line with Friedman’s theory (1964), the current land use is diverse forming city center, suburb area and buffer zone which have substantial urban economic activities. For providing location, ensuring the availability of land, and land price to support those, Government has to be serious and consistent in adopting policies concerning land consolidation, land redistribution, land reform, also assuring the availability of land in forms of land banking. In accordance with the law of geography that everything is related to everything else, but near things are more related than distant things (Tobler, 1970), land consolidation, land redistribution, land reform, land use and land banking has to consider spatial pattern of the nearest neighborhood. These issues are relevant with the current conditions which are there are still considerably inconsistency of land use and land utilization, many farmers who don’t have arable land due to most of land is commonly controlled and owned by landlords or legal entity who have a lot of capital.

Factors and Spatial Pattern Analysis of Land Price, (7113) Catur Kuat Purnomo, Wahyu Sari Sabekti and Dian Permana Sari (Indonesia) FIG Congress 2014 Engaging the Challenges - Enhancing the Relevance Kuala Lumpur, Malaysia 16 – 21 June 2014
3/16 Factors
Furthermore, with all descriptions given above, spatial pattern analysis of land price and NJOP in urban area is necessary as one of instrumen in taking policy in terms of land reform, land banking and land use pattern; and for organizing competition on land possession e.g. utility, settlement, Central Business District, public space, green and industrial area purposes. Facts happened by the competition generate the imbalance of land supply and land demand level. Supply on lands is relatively permanent while demand on lands increases which causing land price in urban area going up.
2. RESEARCH FORMULATION
With regard to the previous description, the research problems that can be formulated
are: a. How does the spatial pattern of land price based on market and NJOP in urban
area? b. What are the factors that spatially can influence land price based on market and
NJOP? c. Are there any spatial autocorrelation which is positive and spatial dependency
effect on land price based on market and NJOP in urban area?
3. RESEARCH HYPHOTESIS
The research hypothesis shows for land price based on market as defined variable / dependen (𝑌!), and NJOP’s value as defined variable / dependen (𝑌!). In general the research hypotesis can be illustrated as given below:
1. There are spatially significant impacts which are negative between distance variables of rural area to city center / Central Business District, rural area to the nearest university, rural area to the nearest station and moreover there are significant influences which are positive between average variables of space extents, the number of buildings toward land price based on market and NJOP;
2. There are a positive spatial autocorrelation and a systematic spatial pattern or a clustering pattern on land price based on market and NJOP;
3. There are spatial dependency effects of land price based on market and NJOP. The positive relation means that if the defining variable goes up so the defined
variable goes down and vice versa.
4. RESEARCH OBJECTIVES
The objectives of this research are following: 1. To identify spatial patterns of land price based on market and land tax value
(NJOP) using Global Moran’s I index; 2. To identify the factors that influence land price based on market and land tax value
(NJOP) spatially;
5. RESEARCH METHODS
Based on Lembo (2006) in Kartika (2007) spatial autocorrelation is correlation

Factors and Spatial Pattern Analysis of Land Price, (7113) Catur Kuat Purnomo, Wahyu Sari Sabekti and Dian Permana Sari (Indonesia) FIG Congress 2014 Engaging the Challenges - Enhancing the Relevance Kuala Lumpur, Malaysia 16 – 21 June 2014
4/16 Factors
between variables and their-self based on space, or in other words it can be said that is the dimensions of objects in a space (distance, time, and area/region). If there is a systematic pattern of the dissemination of a variable, the spatial correlation is existed. The existence of spatial autocorrelation indicates that attribute values in a certain area are related to attribute values of others area that is adjacent (neighboring). Spatial weighting matrix can be determined by various methods, which are weight matrix using the intersection methods in sides/Rooks Case, intersection methods in angles/Bishops Case and intersection methods of hand corner/Queen’s Case. For this research purposes, the write uses the weight matrix calculation specifically the intersection methods in sides/Rooks Case.
5.1 Global Moran’s I Index
Global Moran's I index measures correlation of one variable such as x is (𝑥! dan 𝑥!) where i ≠ j, i=1,2,...n, j=1,2,...n with the number of n, so Moran’s I formula is showed in 1 equation (Paradis, 2010) 𝑥 in (1) equation is the average of x, 𝑤!" variables which are the elements of weighted matrix, and 𝑆! is the sum of the weighted matrix, where 𝑆! = 𝑤!"!! . The value of I index is in a range of -1 to 1. Pattern identification uses the value criteria of I index, if 𝐼 > 𝐼!, so it has systematic value or cluster, if 𝐼 = 𝐼!, so it has disperse pattern unevenly (no autocorrelation), and 𝐼 < 𝐼!, it has unsystematic pattern or disperse. 𝐼! is the expectation value of I as formulated: E (I)= 𝐼! = −1/(n − 1) (Lee dan Wong, 2001).
The hypothesis examination to I parameter can be done as following: 𝐻!: no spatial autocorrelation 𝐻!: positive autocorrelation (Moran’s I index is positive) 𝐻!: negative autocorrelation (Moran’s I index is negative)
Lee dan Wong (2001) mention that Moran’s Scatterplot is a methode to interpret the statistic of Global Moran’s I Index. Moran’s Scatterplot is a tool to view the relation that has been standardized between the observation value and the average value of the nearest neighbor.
Quadrant I (located in the upper right) known as High-High (HH), indicates areas that have a high observation value surrounded by areas with a high observation value. Quadrant II (located in the upper left) known as Low-High (LH), indicates areas that have a lower observation value but surrounded by areas with a high observation value. Quadrant III (located in the lower left) knows as Low-Low (LL), indicates areas that have a lower observation value and also surrounded by areas with a lower observation value. Quadrant IV (located in the lower right) known as High-Low (HL), indicates areas that have a high observation value bur surrounded by areas with a lower observation value (Kartika, 2007).
Moran’s Scatterplot that mostly locating the observation in Quadrant HH and LL tends to have a positive spatial autocorrelation for its value (cluster). While Moran’s Scatterplot that mostly locating the observation in Quadrant HL and LH tends to have a negative spatial autocorrelation.
∑
∑∑
=
= =
−
−−
= n
1i
2i0
n
1i
n
1jjiij
)x(x
)x)(xx(xw
S
NI

Factors and Spatial Pattern Analysis of Land Price, (7113) Catur Kuat Purnomo, Wahyu Sari Sabekti and Dian Permana Sari (Indonesia) FIG Congress 2014 Engaging the Challenges - Enhancing the Relevance Kuala Lumpur, Malaysia 16 – 21 June 2014
5/16 Factors
5.2 Local Indicator of Spatial Autocorrelation (LISA)
The identification of an autocorrelation coefficient locally in terms of finding the spatial correlation in every area, can use Moran’s I. Diverse from the prior Global Moran’s I, Moran’s I in LISA indicates local autocorrelation. LISA identifies the relation between one location of an observation with others. The index is as follows (Lee and Wong, 2001).
𝐼! = 𝑧! 𝑤!"𝑧!! 𝑧! and 𝑧! in above equation is a deviation from the average value.
𝑧! = (𝑥! − 𝑥)!/𝛿 𝛿 is standard deviation values of 𝑥! The examination of 𝐼! parameter can be done as given below:
𝐻!: no spatial autocorrelation 𝐻!: spatial autocorrelation
Statistical test: 𝑍!"#!$#"%& =
𝐼! − Ɛ(𝐼!)𝑣𝑎𝑟(𝐼!)
with 𝐼! is LISA index, 𝑍!"#!$#"%& is a staistical value of LISA index test, Ɛ(𝐼!) is an expectation value of LISA index, and 𝑉𝑎𝑟(𝐼!) is a variants value of LISA index.
𝐸 𝐼! = −𝑤!/(𝑛 − 1)
𝑉𝑎𝑟 𝐼! = 𝑤!.(!)(𝑛 −𝑚!
𝑚!!)
(𝑛 − 1)− 2𝑤!(!!)
(2𝑚!𝑚!! − 𝑛)
𝑛 − 1 (𝑛 − 2)−
𝑤!.!
(𝑛 − 1)!
Where: 𝑤!.
(!) = 𝑤!"!! , 𝑖 ≠ 𝑗 𝑤!(!!) = 𝑤!"𝑤!!!!!!!! 𝑤!.! = ( 𝑤!"! )!
This test will reject the initial hypothesis if 𝑍!"#!$#"%& value is located in 𝑍!"#!$#"%& >𝑍(!!)
6. EMPIRICAL MODELS AND DATA
Data utilized in this research are secondary data including digital maps of administrative boundary of Depok City contains of Kelurahan unit and others retrieving from government institutions. In terms of data of distances between two different points, those are acquired from Google Maps. The available data used are cross section data of administrative area of 63th Kelurahan of Depok City, West Java, Indonesia.
Data source of land price based on market, NJOP, as well as data of defined variables used are secondary data that are collected from various government institutions which are Badan Pusat Statistik Kota Depok (Central Bureau of Statistics), Dinas Pendapatan Pengelolaan Keuangan dan Aset Kota Depok (Department of Finance and Asset Management Revenue), Kantor Pelayanan Pajak Pratama Kota Depok (Tax Office) and Google Maps.
There are two big reason using spatial regression model. Firstly, the use of Ordinary Least Square (OLS) model to analyze land price is inappropriate because OLS model requires no-correlation between errors while in spatial analysis requires correlation between errors (spatial autocorrelation). Thus the application of OLS model to analyze land price will violate the assumption requested by spatial regression model. Secondly, in accordance with

Factors and Spatial Pattern Analysis of Land Price, (7113) Catur Kuat Purnomo, Wahyu Sari Sabekti and Dian Permana Sari (Indonesia) FIG Congress 2014 Engaging the Challenges - Enhancing the Relevance Kuala Lumpur, Malaysia 16 – 21 June 2014
6/16 Factors
the geographic rules of Tobler's first law (1970), land price in a certain area will be greatly influenced by the price of land in the surrounding area or in other words there is spatial dependence effects.
Partly researches of land price use one of the two models which are spatial lag (Pyykkonen, 2005; Huang et al., 2006) or spatial error (Hardie et al., 2001), whilst others use both of them the similar spesification (Mallios et al., 2009; Breustedt and Habermann, 2011). In this research, the writer also choose to apply both of them, the use of spatial lag model is addressed to identify the spatial dependence effects, while the spatial error model is to identify other factors outside spatial dependence factors.
Before executed spatial regression, the Moran’s I index is executed first to identify the spatial autocorrelation. Both estimatation resulted from spatial lag and spatial error model will be compared to obtain evidences related to whether there is spatial dependence effect or not; also whether there is other factors then spatial dependence effects such as either factors of externalities or land pricing determination performed, by the government. In other words there is a subjectivity of land appraisers in intervening the determination of land price either based on market or NJOP.
To answer the 1st research objective on how spatial pattern of land price based on market and NJOP conducted, the Moran’s I index is applied by previously creating spatial weight matrix using rook contiguity methode (63 line x 63 column) which is considered more appropriate to describe the spatial correlation or the influence of the spatial dependency of neighborhood in the area of Depok City, West Java, Indonesia.
Meanwhile, to answer the 2nd research objective, regression model of Maximum Likelihood Spatial Error Model and Maximum Likelihood Spatial Error Model are applied. Firstly Lagrange Multiplier is done before analysing using spatial regression model to identify which models are precisely applied to explain the variation of land price estimation whether lag spatial or spatial error model, so that empirical model exercised in the research, see below:
a. Spatial lag model of land price based on market and NJOP 𝐿𝑜𝑔𝑃! = 𝜌𝑊𝐿𝑜𝑔𝑃! + 𝛽!𝐿𝑜𝑔𝐶𝐵𝐷! + 𝛽!𝐿𝑜𝑔𝑈𝑛𝑖𝑣! + 𝛽!𝐿𝑜𝑔𝑇𝑟𝑎𝑖𝑛! + 𝛽!𝐿𝑜𝑔𝑊𝑖𝑑𝑒! + 𝛽!𝐿𝑜𝑔𝐵𝑢𝑖𝑙𝑑! + 𝜀!
(Model 1.1) 𝐿𝑜𝑔𝑃! = 𝜌𝑊𝐿𝑜𝑔𝑃! + 𝛽!𝐿𝑜𝑔𝐶𝐵𝐷! + 𝛽!𝐿𝑜𝑔𝑈𝑛𝑖𝑣! + 𝛽!𝐿𝑜𝑔𝑇𝑟𝑎𝑖𝑛! + 𝛽!𝐿𝑜𝑔𝑊𝑖𝑑𝑒! + 𝛽!𝐿𝑜𝑔𝐵𝑢𝑖𝑙𝑑! + 𝜀!
(Model 1.2) Where: 𝐿𝑜𝑔𝑃! : Logarithm of land price based on market 𝐿𝑜𝑔𝑃! : Logarithm of land price based on NJOP 𝜌 : Spatial autoregressive coefficient 𝑊𝐿𝑜𝑔𝑃! : Spatial lag of land price based on market 𝛽!sd 𝛽! : Regression coefficient 𝐿𝑜𝑔𝐶𝐵𝐷! : Logarithm of distance from kelurahan 𝑖 to city center 𝐿𝑜𝑔𝑈𝑛𝑖𝑣! : Logarithm of distance from kelurahan 𝑖 to the nearest university 𝐿𝑜𝑔𝑇𝑟𝑎𝑖𝑛! : Logarithm of distance from kelurahan 𝑖 to the nearest train station 𝐿𝑜𝑔𝑊𝑖𝑑𝑒! : Logarithm of the average size of buildings in a kelurahan 𝑖 𝐿𝑜𝑔𝐵𝑢𝑖𝑙𝑑! : Logarithm of numbers of buildings in a kelurahan 𝑖
𝜀! : Error of i
b. Spatial error model of land price based on market and NJOP 𝐿𝑜𝑔𝑃! = 𝛽!𝐿𝑜𝑔𝐶𝐵𝐷! + 𝛽!𝐿𝑜𝑔𝑈𝑛𝑖𝑣! + 𝛽!𝐿𝑜𝑔𝑇𝑟𝑎𝑖𝑛! + 𝛽!𝐿𝑜𝑔𝑊𝑖𝑑𝑒! + 𝛽!𝐿𝑜𝑔𝐵𝑢𝑖𝑙𝑑! + 𝜀! (Model 2.1)
dimana 𝜀! = 𝜆𝑊𝜀! + 𝜉 𝜀! = (𝐼 − 𝛾𝑊)!!𝜉
𝐿𝑜𝑔𝑃! = 𝛽!𝐿𝑜𝑔𝐶𝐵𝐷! + 𝛽!𝐿𝑜𝑔𝑈𝑛𝑖𝑣! + 𝛽!𝐿𝑜𝑔𝑇𝑟𝑎𝑖𝑛! + 𝛽!𝐿𝑜𝑔𝑊𝑖𝑑𝑒! + 𝛽!𝐿𝑜𝑔𝐵𝑢𝑖𝑙𝑑! + 𝜀! (Model 2.2) dimana 𝜀! = 𝜆𝑊𝜀! + 𝜉 𝜀! = (𝐼 − 𝛾𝑊)!!𝜉

Factors and Spatial Pattern Analysis of Land Price, (7113) Catur Kuat Purnomo, Wahyu Sari Sabekti and Dian Permana Sari (Indonesia) FIG Congress 2014 Engaging the Challenges - Enhancing the Relevance Kuala Lumpur, Malaysia 16 – 21 June 2014
7/16 Factors
Where: 𝐿𝑜𝑔𝑃! : Logarithm of land price based on market 𝐿𝑜𝑔𝑃! : Logarithm of land price based on NJOP 𝜆 : Spatial autoregressive coefficient 𝑊𝜀 : Lag spatial for errors of land price based on market 𝛽!sd 𝛽! : Regression coefficient 𝐿𝑜𝑔𝐶𝐵𝐷! : Logarithm of distance from kelurahan 𝑖 to city center 𝐿𝑜𝑔𝑈𝑛𝑖𝑣! : Logarithm of distance from kelurahan 𝑖 to the nearest university 𝐿𝑜𝑔𝑇𝑟𝑎𝑖𝑛! : Logarithm of distance from kelurahan 𝑖 to the nearest train station 𝐿𝑜𝑔𝑊𝑖𝑑𝑒! : Logarithm of the average size of buildings in a kelurahan 𝑖 𝐿𝑜𝑔𝐵𝑢𝑖𝑙𝑑! : Logarithm of numbers of buildings in a kelurahan 𝑖
𝜀! : Error of i 𝜉 : Normal distribution with mean 0 and varians �2I
Models of 1.1 dan 1.2 are utilized to answer the 2nd research objective which is to identify spatial factors of land price based on market and NJOP. From the results of ml spatial lag regression, Breush-Pagan test is executed to detect the heteroscedasticity and Likelihood Ratio test to find out whether there are spatial correlation or spatial dependent effects of the models.
6.1 Analysis Method
In detail, analysis steps and methods conducted in this research described as following:
1. Data collecting; 2. BuildingWeight Matrix based on rook contiguity method; 3. Calculating values and Moran’s I index test (I and z value); 4. Performing analysis of spatial pattern of land price based on market and NJOP using
the results of Moran’s I index value; 5. Determining spatial model that defining variations of land price estimation using
Lagrange Multiplier with ols regression’s tool; 6. Conducting lag spatial regression and or spatial error of land price based on market
and NJOP; 7. Testing spatial regression model using Breush-Pagan and Likelihood Ratio test; 8. Analyzing factors which affecting land price based on market and NJOP spatially; 9. Performing interpretation, discussion, result analysis and conclusion of the research.
7. RESULTS AND DISCUSSIONS
7.1 Spatial Pattern Analysis of Land Price based on Market
Spatial pattern analysis in this study uses the valuation method of Global Moran 's I index where this method applies the statistic value of z statistic to evaluate the existence of spatial patterns of population and indicate the level of significance. If the counted value of statistic z of more than 1.96 (z-table) then the significance level is 5% and if the counted statistic value of z more than 2.57 (z-table) then the significance level is 1% .
This study uses contiguity weight matrix based on the method of counting rook contiguity in which direct neighboring villages are given a value of 1 and the indirect neighboring villages are given a value of 0. Results of spatial patterns analysis of land price based on market are presented in Table 1. Global index value of Moran 's I is 0.3780, while the expected index value is 𝐸 𝐼 = 𝐼! = − !
!!!= −0,0161. Thus, it can be concluded 0.3780
> -0.0161 or 𝐼 > 𝐼!, spatial pattern of land price based on market has a systematic pattern or

Factors and Spatial Pattern Analysis of Land Price, (7113) Catur Kuat Purnomo, Wahyu Sari Sabekti and Dian Permana Sari (Indonesia) FIG Congress 2014 Engaging the Challenges - Enhancing the Relevance Kuala Lumpur, Malaysia 16 – 21 June 2014
8/16 Factors
clustered. Table 1. Global Moran's I value for land price based on market
Moran’s Value Estimation Moran’s Index 0.3780 Expected Index -0.0161 Variance 0.0066 z-score 4.6768 p-value 0.0000***
Z-score = 4.676851 and p-value = 0.0000 indicate that the estimated spatial pattern of land price based on market is significant at the 1% level. It means that the land price based on market in the study area has a strong spatial autocorrelation .
The spatial pattern of land price based on market is presented in Figure 1.a, crosshairs texture of 8 villages shows that the estimated value of a high price of land is also surrounded by a land which has a high value such as on the Tanah Baru Village, Kukusan, Beji, Beji Timur, Kalimulya, Jatimulya, Cilodong and Kalibaru. This areas have adequate facilities of settlement, educational and transportation.
Figure 1. Spatial patterns of land based on the Market Price
Significance map is presented in Figure 1.b, it depicts that a number of 19 villages is significantly influencing the systematic spatial or clustered pattern of land price based on market; 5 villages are significant at p-value = 0.01 which there are shown by cross lines texture: Bojongsari Baru Village, Sawangan Lama, Kukusan, Beji and Beji Timur; and the last 3 villages are villages with dense residential land use, boarding students, universities and educational facilities such as transport facilities and station. These are evidences that land price is high due to the dynamic spillover effect of economic activity of the land market mechanism.
7.2 Spatial Pattern Analysis of Land Tax Value (NJOP)
Similar to the spatial pattern of land price based on market, this analysis uses contiguity weight matrix based on the method of counting rook contiguity where the direct neighboring villages are given a value of 1 and the indirect neighboring are given a value of 0. Results of spatial pattern analysis based on NJOP are presented in Table 2 .
Global index value of Moran 's I is 0.2971, while the value of 𝐸 𝐼 = 𝐼! = − !!!!
= −0.0161 therefore can be concluded that 0.2971 > -0.0161 or 𝐼 > 𝐼!, the spatial pattern of land price based on NJOP has a systematic pattern or clustered. Z-score = 3.3553 and p-value = 0.0007 indicate that the estimated spatial pattern of land price by NJOP is significant at the 1% level. It means that the price of land in the research area based on NJOP has strong spatial
±0 1 20.5
Miles
±0 1 20.5
Miles
a b

Factors and Spatial Pattern Analysis of Land Price, (7113) Catur Kuat Purnomo, Wahyu Sari Sabekti and Dian Permana Sari (Indonesia) FIG Congress 2014 Engaging the Challenges - Enhancing the Relevance Kuala Lumpur, Malaysia 16 – 21 June 2014
9/16 Factors
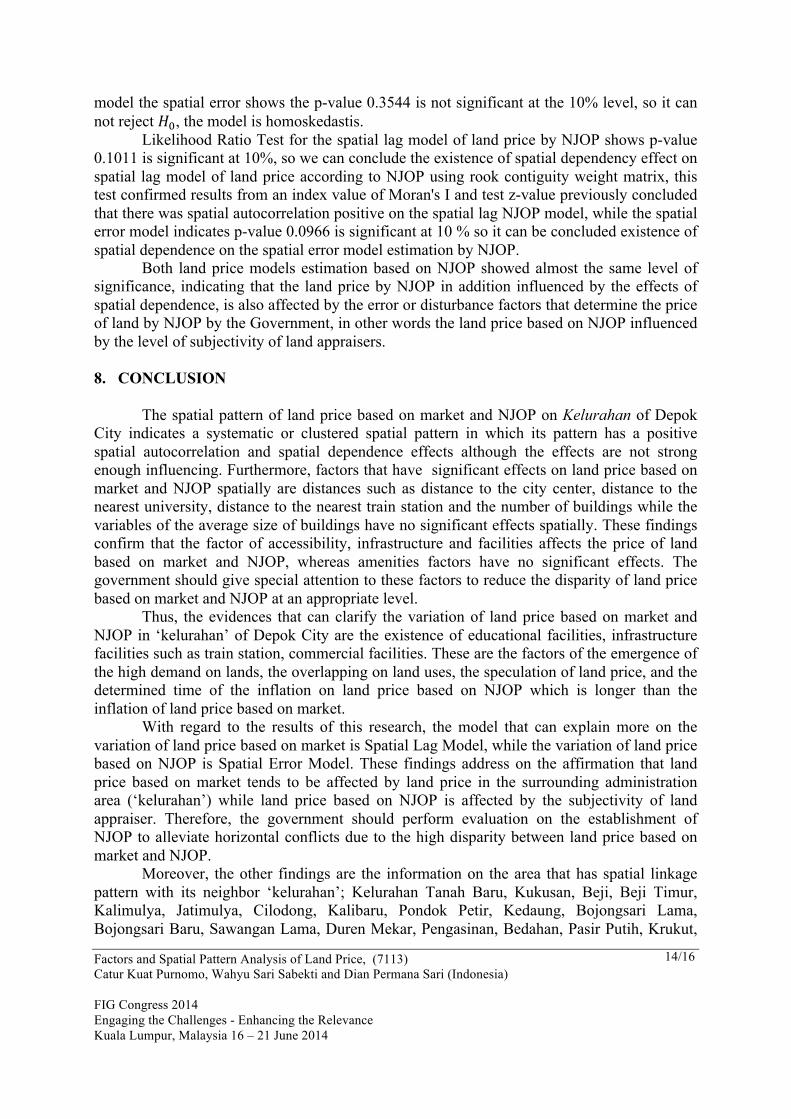
autocorrelation. The spatial pattern of NJOP presented in Figure 2.a, lines cross texture indicate that
the price of land surrounded by high NJOP as well as the 5 villages are the Pangkalanjati Village, Kukusan, Beji Timur, Leuwinanggung and Cimpaeun are in the north, central and the southern city of Depok is dominated residential land use in Pangkalanjati and educational facilities such as universities in Beji Timur and Kukusan.
Table 2. Global Moran's I value for NJOP Morans Value Estimation Moran’s Index 0.2971 Expected Index -0.0161 Variance 0.0065 z-score 3.3553 p-value 0.0007***
Fine texture depicts lower land price based on NJOP surrounded by low land price as much as 11 villages NJOP ie at Pondok Petir Village, Serua, Kedaung, Cinangka, Curug, Bojongsari Lama, Bojongsari Baru, Sawangan Lama, Duren Mekar, Pengasinan and Pasir Putih, this area is still a lot of vacant land, land use is still largely in the form of garden, fields, moor and shrubs .
Slashes indicate low land price based on NJOP surrounded by high land price as much as 2 villages namely Krukut and Depok Village, not textured as many as 45 villages are urban areas that are spatially not significant in showing the spatial pattern of land price by NJOP.
Significancy maps of land price according to to NJOP are presented in Figure 2.b. There are 18 villages which have significant effects in forming (systematic or clustered), spatial patterns 4 villages significant at p-value = 0.01 ie Pondok Petir village, Bojongsari Baru, Sawangan Lama, and Kukusan indicated by crosshairs texture, it is seen that the first 3 villages related to land use and land price are still low by NJOP like grounds, fields and moors, villages namely 1 Kukusan related to land use such as educational facilities, because of the location adjacent to the University of Indonesia in the Beji Timur village has a land price increased significantly according to NJOP
Figure 2. Spatial patterns of land price based on NJOP
7.3 Spatial Factors Analysis of Land Price To perform spatial analysis of land price factor will be used maximum likelihood
model of spatial lag and spatial error, the previous determination will be made where the spatial models that better explain the variation estimated land price, where the data is
±0 1 20.5
Miles
±0 1 20.5
Miles
a b

Factors and Spatial Pattern Analysis of Land Price, (7113) Catur Kuat Purnomo, Wahyu Sari Sabekti and Dian Permana Sari (Indonesia) FIG Congress 2014 Engaging the Challenges - Enhancing the Relevance Kuala Lumpur, Malaysia 16 – 21 June 2014
10/16
processed and collected secondary data that has been transformed into logarithmic form for dependent variable is the price of land based on the market and NJOP, the independent variable is the distance to the city center, the distance to the nearest university, distance to the nearest station, the average house size and number of buildings.
Furthermore, to determine the spatial models to explain variation in land price in the market and used Lagrange Multiplier test, this test is done using software tools Geoda with ols regression. From Table 3. seen that the variation in the market price of land can be explained by the model than the spatial lag and spatial model error due to the level of significance Lagrange Multiplier test for spatial lag by 10 % while the spatial model error is not significant. This test confirmed that land price based on the market in Depok has the effect of spatial correlation and spatial dependence which means land price based on the market is influenced by the market price of the land based on its surrounding areas, if the market price of land in that particular village is high, the market price of land in the villages in the surrounding area will also tend to be high, and vice versa.
Tabel 3. Lagrange Multiplier Test Harga Tanah Pasar Harga Tanah NJOP Test Spatial Lag Spatial Error Spatial Lag Spatial Error Koefisien Koefisien Koefisien Koefisien LM Test (p-value)
3.3299* (0.0680)
2.5221 (0.1122)
3.5138* (0.0608)
3.4592* (0.0629)
Robust LM (p-value)
0.8574 (0.3544)
0.0496 (0.8236)
0.2696 (0.6035)
0.2149 (0.6429)
*)sig 0.1, **)sig 0.05, ***)0.01 Differ with land price based on the market, Lagrange Multiplier test according to to
NJOP and land price show that both spatial models are significant at 10%. The land price based on NJOP in Depok has a spatial dependence effect, while the Robust LM test depicts a slight significant effect thus it not yet gives suitable information. Which models are appropriate test results show effect errors in the price of land is also likely to be influenced by NJOP error, can be interpreted as the level of subjectivity land appraiser in determining the value of land zones that form the basis of a determination NJOP, the greater subjectivity of the assessment of the land then the difference between NJOP and land price based on the market price of the land based on the higher .
7.4 Spatial Factor Analysis of Land Price based on Market
On this analysis will be described spatial factors affecting on the market price of land using spatial regression models. The estimation results of the spatial lag model of land price based on market shows that the distance variables to the city center, to the nearest university, the nearest station and numbers of buildings spatially give significant effects, while the variable of average size of give buildings spatially gives insignificant effects of land price based on market.
Tabel 4. Result of Spatial Lag dan Spatial Error Model Harga Tanah Pasar Harga Tanah NJOP Spatial Lag Spatial Error Spatial Lag Spatial Error Variabel Koefisien
(Std.Error) Koefisien (Std.Error)
Koefisien (Std.Error)
Koefisien (Std.Error)
W_Lag (Rho)
0.1962 (0.1322)
0.2031 (0.1434)
CONSTANT 4.4539 (0.9767)***
5.6200 (0.5390)***
3.8260 (0.9622)***
4.9688 (0.4629)***

Factors and Spatial Pattern Analysis of Land Price, (7113) Catur Kuat Purnomo, Wahyu Sari Sabekti and Dian Permana Sari (Indonesia) FIG Congress 2014 Engaging the Challenges - Enhancing the Relevance Kuala Lumpur, Malaysia 16 – 21 June 2014
11/16
LOGCBD -0.5128 (0.1016)***
-0.5122 (0.0998)***
-0.2498 (0.0871)***
-0.2570 (0.0858)***
LOGUNIV -0.1821 (0.0949)**
-0.1490 (0.0966)
-0.1720 (0.0818)**
-0.1457 (0.0830)*
LOGTRAIN -0.2429 (0.1232)**
-0.3429 (0.1255)***
-0.2152 (0.1017)**
-0.2739 (0.1081)**
LOGWIDE 0.0846 (0.1154)
0.0709 (0.1135)
0.1300 (0.0995)
0.1303 (0.0975)
LOGBUILD 0.2483 (0.1139)**
0.2650 (0.1117)**
0.2737 (0.0981)***
0.2844 (0.0959)***
Error(Lambda)
0.2496 (0.1596)
0.2551 (0.1591)*
R-square 0.5754 0.5758 0.4290 0.4345 *)sig 0.1, **)sig 0.05, ***)sig 0.01 Spatial lag regression model based on the market price of land produce value estimates
are presented in Table 4, it appears that the R-square value 0.5754 , meaning that the variation of the independent variables can explain the spatial variation in land price in the market by 57.54 % while the rest is influenced by other variables outside the model. Factor in the model lag or spatial adjacency lag effect of 19.62 % at a weak level of significance that is only 0.15, the lag factor is lower than the price of the land according to NJOP 20.31 %, with the same level of significance. This suggests that variations in the market price of land in the weaker influence of land price in urban areas than the surrounding land price variation according to NJOP, the factors determining the price of land by the Government according to NJOP indicated as the cause of the strong influence of the spatial lag than a factor of demand and supply of land by the market mechanism.
Coefficient of the variable such as distance to the city center is negative significant -0.5128 at 0.01 means the nearest distance from villages to the city center is 1%, the price of land will increase by 51.28 % and vice versa. This interpretation also applies to other variable is the variable distance from the nearest village to the university -0.1821 , distance from the nearest station to the village -0.2429, and a number of buildings at 0.2483, the variables are spatially significant effect on land price in the market, while the extensive variables the average home with a coefficient 0.0846 spatially no significant effect on land price in the market, so that there are four significant variables and one variable is not significant .
These findings suggest that the factor of distance or accessibility, educational facilities and infrastructure affect land price based on the market while amenities factors not affect land price based on the market. Thus obtained estimation model based on the market price of the land based on the spatial lag models as follows:
𝐿𝑜𝑔𝑃𝑟𝑖𝑐𝑒 = 0.1962𝑊𝐿𝑜𝑔𝑃𝑟𝑖𝑐𝑒 + −0.5128𝐿𝑜𝑔𝐶𝐵𝐷 + −0.1821𝐿𝑜𝑔𝑈𝑛𝑖𝑣 + −0.2429𝐿𝑜𝑔𝑇𝑟𝑎𝑖𝑛+ 0.0846𝐿𝑜𝑔𝑊𝑖𝑑𝑒 + 0.2483𝐿𝑜𝑔𝐵𝑢𝑖𝑙𝑑
Meanwhile, the estimation of the spatial error models for land price based on the market indicates that the variable distance from the village to the city center, the distance from the village to the nearest station and many buildings are spatially significant effect on land price in the market while the distance from the nearest village to the university and the average size of the homes are spatially no significant effect on land price in the market. With values similar to the spatial lag models, the R-square value 0.5758 means that the variation of the independent variables can explain the variation in land price based on market estimates 57.58%, while the rest is influenced by other variables outside the model. Lambda coefficient or the coefficient of spatial neighborhoods with the lambda 0.2496 of land price has a low level of significance. Land price estimation model based spatial error models can be presented

Factors and Spatial Pattern Analysis of Land Price, (7113) Catur Kuat Purnomo, Wahyu Sari Sabekti and Dian Permana Sari (Indonesia) FIG Congress 2014 Engaging the Challenges - Enhancing the Relevance Kuala Lumpur, Malaysia 16 – 21 June 2014
12/16
as follows: 𝐿𝑜𝑔𝑃𝑟𝑖𝑐𝑒 = −0.5122𝐿𝑜𝑔𝐶𝐵𝐷 + −0.1490𝐿𝑜𝑔𝑈𝑛𝑖𝑣 + −0.3429𝐿𝑜𝑔𝑇𝑟𝑎𝑖𝑛 + 0.0709𝐿𝑜𝑔𝑊𝑖𝑑𝑒
+ 0.2650𝐿𝑜𝑔𝐵𝑢𝑖𝑙𝑑 + 0.2496𝑊Ɛ Therefore there are only 3 significant variables, 2 variables were not significant and
the significance lambda coefficient is low then it may confirm Lagrange Multiplier test earlier that the spatial lag models better explain the variation in estimates of land price based on the market rather than spatial error models.
7.5 Spatial Factors Analysis of Land Tax Value (NJOP)
On this analysis will be described spatial factors that affect the price of land according to NJOP using spatial regression models . The estimation results of the spatial lag models for the price of land by NJOP indicates that the variable distance from the village to the city center, distance from the nearest village to the university, the distance from the village to the nearest station and many buildings are spatially significant effect on land price by NJOP while the spatially variable such as average house size variable had no significant effect.
R-square value 0.4290 means that the variation of the independent variables can explain the spatial variation in land price by NJOP 42.90%, while the rest is influenced by other variables outside the model. Weight coefficient matrix of the lag model in land price by NJOP at 0.2031, the effect of neighborhood with methods of spatial lag models rook contiguity effect 20.31%, but not significant in showing the effects of spatial dependence. This is due to there are some villages which land price trend tend to increase according to NJOP but surrounded by higher land price according to NJOP tend to decrease and vice versa as Kelurahan Pasir Gunung Selatan, Harjamukti and Krukut. Thus, based on estimates of NJOP model generated from spatial lag models can be presented as follows :
𝐿𝑜𝑔𝑇𝑎𝑥 = 0.2031𝑊𝐿𝑜𝑔𝑇𝑎𝑥 + −0.2498𝐿𝑜𝑔𝐶𝐵𝐷 + −0.1720𝐿𝑜𝑔𝑈𝑛𝑖𝑣 + −0.2152𝐿𝑜𝑔𝑇𝑟𝑎𝑖𝑛+ 0.1300𝐿𝑜𝑔𝑊𝑖𝑑𝑒 + 0.2737𝐿𝑜𝑔𝐵𝑢𝑖𝑙𝑑
Meanwhile, the estimation of the spatial error models for the NJOP indicates that the variable distance from the village to the city center, distance from the nearest village to the university, the distance from the village to the nearest station and many buildings are spatially significant effect on NJOP while average expansive home variable spatially had no significant effect on the NJOP.
In the spatial error model estimation results for the NJOP, it appears that that the R-square value 0.4345 is higher than the spatial lag models which only 0.4290, meaning that the variation of the independent variables can explain the spatial variation in land price according to NJOP 43.45%, while the rest is influenced by other variables outside the model. Lambda coefficient or the coefficient of the NJOP spatial error model 0.2551 is significant at 10% , meaning that the NJOP quite strongly influenced by the spatial error 25.51%. These findings confirm that the NJOP greatly influenced by the error factor determining land price according to NJOP by the Government, in other words the land assessor subjectivity in determining NJOP, so it can be concluded that for the NJOP, spatial error models tend to be more explained than the spatial lag models.
If we compare the coefficients between the two models of NJOP spatial parameters, then the distance variable from the nearest village to the university on the spatial lag parameter has a higher coefficient than the spatial error, variable distance from the village to the city center, the distance from the village to the nearest station and many buildings in the spatial error higher than the spatial lag, so the distance from the village to the city center, the distance from the village to the nearest station and many buildings are more influential than

Factors and Spatial Pattern Analysis of Land Price, (7113) Catur Kuat Purnomo, Wahyu Sari Sabekti and Dian Permana Sari (Indonesia) FIG Congress 2014 Engaging the Challenges - Enhancing the Relevance Kuala Lumpur, Malaysia 16 – 21 June 2014
13/16
the distance from the nearest village to the university. Spatial error R-square value is higher than the spatial lag, so the NJOP more likely to be influenced by the spatial lag effect for error than the spatial dependence. The NJOP effect can be interpreted as the effect of the determination by the Government.
From these results indicate that the accessibility variable, facilities and infrastructure affect land price according to NJOP while the amenities variable does not affect the NJOP. The government should prioritize the improvement of accessibility programs, facilities and infrastructure to improve land tax value (NJOP), because the process of determining NJOP is one important instrument for increasing state revenue sources.
Results of the spatial error model estimation (NJOP) can be written as follows: 𝐿𝑜𝑔𝑇𝑎𝑥 − 0.2570𝐿𝑜𝑔𝐶𝐵𝐷 + −0.1457𝐿𝑜𝑔𝑈𝑛𝑖𝑣 + −0.2739𝐿𝑜𝑔𝑇𝑟𝑎𝑖𝑛 + 0.1303𝐿𝑜𝑔𝑊𝑖𝑑𝑒 +0.2844𝐿𝑜𝑔𝐵𝑢𝑖𝑙𝑑 + 0.2551𝑊Ɛ
7.6 Spatial Regression Test There are two tests of spatial regression models were used in this study. First, Breush-
Pagan test to determine the homogeneity assumption in the model that used the null hypothesis is not heterokedasticity there (residuals have homoskedasticity pattern). Second, Likelihood Ratio test to determine whether there is influence of the independent variable on the dependent variable, this test is intended to confirm the results of Lagrange Multiplier test earlier in seeing the effects of spatial dependence of the independent variables on land price based on the market and NJOP.
Table 5. Spatial Regression Test Harga Tanah Pasar Harga Tanah NJOP Spatial Lag Spatial Error Spatial Lag Spatial Error Uji model Value
(prob-sig) Value (prob-sig)
Value (prob-sig)
Value (prob-sig)
Breush-Pagan Test
6.0327 (0.3030)
6.1259 (0.2941)
5.2637 (0.3845)
5.5316 0.3544
Likelihood Ratio Test
2.6070 (0.1063)*
2.2953 (0.1297)
2.5372 (0.1011)*
2.7599 (0.0966)*
*)sig 0.1, **)sig 0.05, ***)sig 0.01 In Table 5. seen that from Breush-Pagan test for spatial lag model of land price in the
market shows that the p-value 0.3030 is not significant at the 10% level so it can not be concluded reject 𝐻!, or does not happen heteroskedasticity, as well as for the spatial error model of land price in the market shows the p-value 0.2941 is not significant at the 10% level so it can not be concluded to reject 𝐻!, or does not happen heteroscedasticity (model already homoskedastis) .
Likelihood Ratio Test for the spatial lag model of land price in the market indicates p-value 0.1063 is significant at 10 % , so we can conclude the existence of spatial dependency effect on spatial lag model of land price based on market using rook contiguity weight matrix, this test confirmed results from an index value of Moran's I and z test value previously concluded that there was spatial autocorrelation positive on the model of spatial lag in land price in the market, while the spatial model error in land price in the market indicates p-value 0.1297 is not significant at the 10% level that can not be inferred the existence of spatial dependency effects on the estimates of the spatial model error .
Meanwhile, the model estimates for land price according to NJOP, value Breush-Pagan test for spatial lag models showed that the p-value 0.3845 is not significant at the 10% level so it can not be concluded reject 𝐻!, or does not happen heteroskedasticity, as well as to
Factors and Spatial Pattern Analysis of Land Price, (7113) Catur Kuat Purnomo, Wahyu Sari Sabekti and Dian Permana Sari (Indonesia) FIG Congress 2014 Engaging the Challenges - Enhancing the Relevance Kuala Lumpur, Malaysia 16 – 21 June 2014
14/16
model the spatial error shows the p-value 0.3544 is not significant at the 10% level, so it can not reject 𝐻!, the model is homoskedastis.
Likelihood Ratio Test for the spatial lag model of land price by NJOP shows p-value 0.1011 is significant at 10%, so we can conclude the existence of spatial dependency effect on spatial lag model of land price according to NJOP using rook contiguity weight matrix, this test confirmed results from an index value of Moran's I and test z-value previously concluded that there was spatial autocorrelation positive on the spatial lag NJOP model, while the spatial error model indicates p-value 0.0966 is significant at 10 % so it can be concluded existence of spatial dependence on the spatial error model estimation by NJOP.
Both land price models estimation based on NJOP showed almost the same level of significance, indicating that the land price by NJOP in addition influenced by the effects of spatial dependence, is also affected by the error or disturbance factors that determine the price of land by NJOP by the Government, in other words the land price based on NJOP influenced by the level of subjectivity of land appraisers. 8. CONCLUSION
The spatial pattern of land price based on market and NJOP on Kelurahan of Depok
City indicates a systematic or clustered spatial pattern in which its pattern has a positive spatial autocorrelation and spatial dependence effects although the effects are not strong enough influencing. Furthermore, factors that have significant effects on land price based on market and NJOP spatially are distances such as distance to the city center, distance to the nearest university, distance to the nearest train station and the number of buildings while the variables of the average size of buildings have no significant effects spatially. These findings confirm that the factor of accessibility, infrastructure and facilities affects the price of land based on market and NJOP, whereas amenities factors have no significant effects. The government should give special attention to these factors to reduce the disparity of land price based on market and NJOP at an appropriate level.
Thus, the evidences that can clarify the variation of land price based on market and NJOP in ‘kelurahan’ of Depok City are the existence of educational facilities, infrastructure facilities such as train station, commercial facilities. These are the factors of the emergence of the high demand on lands, the overlapping on land uses, the speculation of land price, and the determined time of the inflation on land price based on NJOP which is longer than the inflation of land price based on market.
With regard to the results of this research, the model that can explain more on the variation of land price based on market is Spatial Lag Model, while the variation of land price based on NJOP is Spatial Error Model. These findings address on the affirmation that land price based on market tends to be affected by land price in the surrounding administration area (‘kelurahan’) while land price based on NJOP is affected by the subjectivity of land appraiser. Therefore, the government should perform evaluation on the establishment of NJOP to alleviate horizontal conflicts due to the high disparity between land price based on market and NJOP.
Moreover, the other findings are the information on the area that has spatial linkage pattern with its neighbor ‘kelurahan’; Kelurahan Tanah Baru, Kukusan, Beji, Beji Timur, Kalimulya, Jatimulya, Cilodong, Kalibaru, Pondok Petir, Kedaung, Bojongsari Lama, Bojongsari Baru, Sawangan Lama, Duren Mekar, Pengasinan, Bedahan, Pasir Putih, Krukut,

Factors and Spatial Pattern Analysis of Land Price, (7113) Catur Kuat Purnomo, Wahyu Sari Sabekti and Dian Permana Sari (Indonesia) FIG Congress 2014 Engaging the Challenges - Enhancing the Relevance Kuala Lumpur, Malaysia 16 – 21 June 2014
15/16
and Bakti Jaya for the area of land price based on market, while Kelurahan Pangkalanjati, Kukusan, Beji Timur, Leuwinanggung, Cimpaeun, Pondok Petir, Serua, Kedaung, Cinangka, Curug, Bojongsari Lama, Bojongsari Baru, Sawangan Lama, Duren Mekar, Pengasinan, Pasir Putih, Krukut and Depok for the area of land price based on NJOP. REFERENCES Boudeville, J. R. (1961). An Operational Model of Regional Trade in France.Paper in Regional Science. Vol 7, Issue 1, pp 177-187 Breustedt, G. and H. Habermann (2011). “The Incidence of EU Per-Hectare Payments on Farmland Rental Rates: A Spatial Econometric Analysis of German Farm-Level Data”, Journal of Agricultural Economics, Vol. 62, No. 1, pp. 225-243. Christaller, Walter (1933). Central Place Theory, Gustav, Jena Curtis J A, Lee A W.(2010). Spatial Pattern of diabetes related health problems for vulneral populations in Los Angeles, USA. Feichtinger, P. and K. Salhofer (2013), “What Do We Know about the Influence of Agricultural Support on Agricultural Land Price?”, German Journal of Agricultural Economics, Vol. 62, No. 2, pp. 71-83. Forthcoming Fingleton, B. and J. Le Gallo (2008). “Estimating spatial models with endogenous variables, a spatial lag and spatially dependent disturbances: Finite sample properties”, Papers in Regional Science, Vol. 87, No. 3, pp. 319-339 Friedmann, John., (1964). Regional planning as a field of study. In John Friedmann and William Goffette-Nagot, Florence, et all (2009). A spatial analysis of residential land price in Belgium: accessibility, linguistic border and environmental amenities. Hall, Peter,ed., (1966) Von Thunen's Isolated State. Oxford: Pergamon, Hardie, I. W., T.A. Narayan and B. L. Gardner (2001), “The Joint Influence of Agricultural and Nonfarm Factors on Real Estate Values: An Application to the Mid-Atlantic Region”, American Journal of Agricultural Economics, Vol. 83, No. 1, pp. 120–132. Huang, H., Miller, G.Y., Sherrick, B.J. and M.I. Gomez (2006), “Factors influencing Illinois farmland values”, American Journal of Agricultural Economics, Vol. 88, No. 2, pp. 458-470. Kartika Yoli, (2007). Pola Penyebaran Spasial Demam Berdarah Dengue di Kota Bogor tahun 2005. [Tugas Akhir] Institut Pertanian Bogor Lee Jay &Wong S W David.(2000). Statistical Analysis with Arcview GIS. John Willey &

Factors and Spatial Pattern Analysis of Land Price, (7113) Catur Kuat Purnomo, Wahyu Sari Sabekti and Dian Permana Sari (Indonesia) FIG Congress 2014 Engaging the Challenges - Enhancing the Relevance Kuala Lumpur, Malaysia 16 – 21 June 2014
16/16
Sons, INC: United Stated of America Lösch, A. (1940), The Economics of Location, Jena, Fischer Mallios, Z., Papageorgiou, A., Latinopoulos, D. and A. Latinopoulos (2009), “SpatialHedonic Pricing Models for the Valuation of Irrigation Water”, Global NEST Journal, Vol. 11, No. 4, pp. 575-582 Paradis, Emanuel. (2010). Moran's Autocorrelation, http://hosho.ees.hokudai.ac.jp/ ~kubo/Rdoc/library/ape/html/MoranI.html [22 September, 2010] Pyykkönen, P. (2005), “Spatial analysis of factors affecting Finnish farmland price”, Paper presented at the XIth Congress of the EAAE, Copenhagen, 22-27.8.2005 Ricardo, David (1817). On The Principles of Political Economy and Taxation. Text Book. London BIOGRAPHICAL NOTES The authors are employees of the National Land Agency of the Republic of Indonesia. CONTACTS Catur Kuat Purnomo National Land Agency Republic of Indonesia Kuningan Barat St, I/1 Jakarta Selatan Jakarta INDONESIA Tel. +6221 5202328 Fax + 6221 5202328 Email: [email protected] Web site: www.bpn.go.id