Embed Size (px)
Citation preview
(EFO - 705) Master Thesis, MIMA – International Marketing
Factors Affecting Consumers for Purchasing Electricity in
Sweden
Supervisor Examiner
Tobias Eltebrandt Ole Liljefors
Authors
Waqas Anis (841112)
Akmal Mehmood Kalair (850302)
Wednesday, June 02, 2010
School of Sustainable Development of Society and Technology (HST) 2010

The Arabic phrase shown above is pronounced as Bismillah ir-Rahman ir-Rahim, and is a
beautifully poetic phrase which offers both deep insight and brilliant inspiration. It has often
been said that the phrase Bismillah ir-Rahman ir-Rahim contains the true essence of the
entire Qur'an, as well as the true essence of all religions.
Muslims often say this phrase when embarking on any significant endeavor and the phrase is
considered by some to be a major pillar of Islam. This expression is so magnificent and so
concise that all but one chapter of the Qur'an begins with the words Bismillah ir-Rahman ir-
Rahim.
The common translation
"In the name of God, most Gracious, most Compassionate"
(Wahiduddin, 2008)
Acknowledgment
It is not less than an honor to show our deepest gratitude to the Mälardalen University to
provide us opportunity to study here and supervisor of our thesis, Mr. Tobias Eltebrandt
whose guidance and on time support proves a helping hand to make this piece of paper
fruitful. We always found him besides us to give better perspective on the topic, suggested
questions and maintaining and organizing meetings and interviews with our selected
company (Eskilstuna Energi & Miljö).
We are grateful to the Eskilstuna Energi & Miljö for their continuous support and providing
us all sort of information about green energy, their consumers and sharing strategies that
they are applying to get the maximum output from that.
We are indebted to my many of our colleagues (Saksakaow, Niramol, Rong, Maite, Linh,
Jokling and Jittranuch) to elaborate the mistakes or problems in our writing through critical
opposition and provide us chance to always up to the mark for our work and should not
deviate from the planned track.
We are feeling proud to say that whatever we are today is due to the prayers, total devotion,
love and all kinds of support from our parents without their encouragement and shore up
we can’t be able to be at this place and that is the main hub of our inspiration for this work
as well.
Last but not least our friends from all around the globe, especially Aamir Raza, Usama Awan,
Sweed Ullah, Muhammad Imtiaz, and Maite Menuet helped a lot in collecting the data and
suggesting articles and books so that turn this dream into reality and due to that we are able
to present in a good manner.
Waqas Anis & Akmal Kalair

Abstract
Title
Factors affecting consumers for purchasing electricity in Sweden.
Purpose
As Sweden is one of the countries who pays a lot of attention towards the sustainability of
the society, eco green businesses and also promotes environmental friendly products. So the
purpose of this study is to analyze the factors which influence consumers before choosing
any electricity supplier, whether it is low price, better services, environmental friendly or
availability. And in this way we can check finally that how much people concern about
environment and environmental friendly products.
Methodology
We have defined the procedure through which we did this research; mainly focus on the
quantitative research which we get from questionnaires from different people belong to
different groups to analyze the different factors that influence the consumer’s choice. We
also included literature review and conceptual frame work of academic work to provide
more depth to the readers about the subject. Besides that the data collection and theory of
research is presented in this part.
Finding and Analysis
Finally, we presented analysis through using the adopted model on consumer decision
process and green marketing strategies for competitive advantage and the findings that we
get through questionnaire.
Conclusion
The factors which affect the consumer choice on choosing electricity supplier in Sweden are
majorly influenced by low prices followed by social responsibility, services and
environmental friendly.
Key word
− Miljö (environment)

General Information
Group Number 2471
Course Name EFO – 705 Master Thesis
Specialization International Marketing
Internal Supervisor Tobias Eltebrandt
External Supervisor Konstantin Lampou
Submission Date 02nd June, 2010
About Authors
Waqas Anis
Textile engineer by profession and having two years experience in marketing and sales;
which made him eager to study international marketing and Mälardalen University turns his
dream into reality.
Email: [email protected] Mobile: +46 700 323 961
Akmal Mahmood Kalair
Textile engineer by profession and having two years experience in garment dyeing at leading
factories of Pakistan.
Email: [email protected] Mobile: +46 760 857 057

Dedication
We believe that it gives immense pleasure and mental satisfaction if we bestow our quality
work to someone who is very close to us in our life.
So we want to dedicate this thesis to our families as no one else is as close as they are and it
is due to their humble and continuous prayers that we reach up to this level in life.
May Allah Almighty gives them reward for their continuous efforts for the betterment of our
career.
Waqas Anis & Akmal Kalair

Table of Contents
1. INTRODUCTION ............................................................................................... 1
1.1. About Eskilstuna Energi & Miljö .............................................................................. 2
2. STRATEGIC QUESTION ...................................................................................... 3
3. RESEARCH QUESTION ....................................................................................... 3
4. CHOICE OF TOPIC ............................................................................................. 3
5. METHODOLOGY ............................................................................................... 5
5.1. Research Methods ................................................................................................... 5
5.2. Data Collection Methods ......................................................................................... 5
5.2.1 Primary Data ....................................................................................................... 5
5.2.2 Secondary Data ................................................................................................... 8
5.3. Reliability ................................................................................................................. 8
5.4. Limitation ................................................................................................................ 8
5.5. Obstacles in Research.............................................................................................. 9
6. LITERATURE REVIEW ...................................................................................... 10
6.1. Carbon Footprint ................................................................................................... 10
7. CONCEPTUAL FRAMEWORK ........................................................................... 12
7.1. Consumer Behaviour ............................................................................................. 12
7.2. Considerable Factors for Consumers .................................................................... 12
8. FINDINGS ....................................................................................................... 15
8.1. Nationalities .......................................................................................................... 15
8.2. Gender ................................................................................................................... 16
8.3. Income ................................................................................................................... 17
8.4. Occupation ............................................................................................................ 18
8.5. Location ................................................................................................................. 19
8.6. Living in ................................................................................................................. 19
8.7. Reason for choosing current electricity provider ................................................. 20
8.8. Receive information about green electricity ........................................................ 21
8.9. Use green electricity .............................................................................................. 22
8.10. Green electricity price ......................................................................................... 23
8.11. Why do not use green electricity ........................................................................ 24
8.12. Considerable factors for switching electricity provider ...................................... 25

8.13. How much extra money you will pay for green electricity ................................. 26
9. ANALYSIS ....................................................................................................... 27
9.1. Analyzing different factors with respect to Occupation ....................................... 27
9.2. Analyzing different factors with respect to Income .............................................. 30
Electricity consumers with income less than 10,000 SEK per month .............................. 30
9.3. Analyzing different factors with respect to Gender .............................................. 32
9.4. Willingness to pay extra, who receive information about renewable energy...... 33
9.5. Analyzing the attitude of consumers with and without children ......................... 35
9.6. Various factors with respect to people living in Apartments and houses ............ 37
10. CONCLUSION ................................................................................................. 39
11. RECOMMENDATIONS ..................................................................................... 42
12. FUTURE RESEARCH ......................................................................................... 44
13. BIBLIOGRAPHY ............................................................................................... 45
14. APPENDIX ...................................................................................................... 48
14.1. Green Energy ...................................................................................................... 48
14.2. Barriers to Green Energy Penetration ................................................................ 53
14.3. Some Definitions ................................................................................................. 54
14.4. Questionnaire ..................................................................................................... 55
Swedish Version ................................................................................................. 55
English Version ................................................................................................... 58
Table of Figures
Figure 1. Percentage share of electricity resources. source: EEM website ............................... 3
Figure 2. Source: Carbon Footprint Website ............................................................................ 11
Figure 3. The Consumer Decision Process Model. Source: Fuller 1999 ................................... 13
Figure 4. Source: Adopted model by authors .......................................................................... 14
Figure 5. Nationalities .............................................................................................................. 15
Figure 6. Gender ....................................................................................................................... 16
Figure 7. Income level of respondants ..................................................................................... 17
Figure 8. Occupation ................................................................................................................ 18
Figure 9. Location of respondants ............................................................................................ 19
Figure 10. Living in apartment or home ................................................................................... 19
Figure 11. Reason of choosing current electricity company .................................................... 20
Figure 12. Information about renewable energy ..................................................................... 21
Figure 13. Use green electricity ................................................................................................ 22
Figure 14. Green electricity price ............................................................................................. 23
Figure 15. Why do not use green electricity ............................................................................ 24
Figure 16. Factors for switching electricity provider................................................................ 25
Figure 17. Extra paying for green energy ................................................................................. 26
Figure 18. Comparison with respect to occupation ................................................................. 28
Figure 19. Comparison between income and factors consideration ....................................... 31
Figure 20. Comparison between gender and factors consideration ....................................... 32
Figure 21. Comparison between receiving information & willingness to pay extra ................ 33
Figure 22. People living with/ without children ....................................................................... 35
Figure 23. People living is apartments & houses ..................................................................... 37

Figure 24. Consumer Decision about electricity supplier, source: authors ............................. 41

International Marketing Mälardalens University
1
1. INTRODUCTION
This chapter begins with the general overview of the research area and it further includes the
problem statement, purpose, research question and structure of the thesis.
Although there are different opinions about the greatest invention but according to a survey
conducted by BBC, UK it has been observed that many people are in favor of electricity.
(www.bbc.co.uk, n.d) so there is no ambiguity if we say that electricity is the biggest
invention on the planet, start looking from the minor things at our home (electric bulb) to
the major things (heavy industrial machines and main frame computers) which make our life
meaningful and convert our dreams into reality as no one can imagine that without the
presence of this useful invention we cannot use all that machines and also all the
development was not possible and we might still spending our life like the stone ages.
With the passage of time development in energy and electricity sector increases and reaches
to a level from where it started effecting the overall environment and becomes hazardous
for the habitants of the society and also a lot of resources have to use to generate electricity.
So government agencies and environmental friendly organizations took the bold step to
emphasize on the importance of energy saving and environmental friendly electric products
and especially developed countries took the initiative to explore certain areas which can
sufficiently produce energy without damaging the society and environment.
According to E. Hetesi it has been pointed out after several studies that it is not only good
quality and customer satisfaction are the factors which lead electricity market towards the
profitability infect there are several other things which have to be considered for it (Hetesi,
2009). It has been said in the annual brochure by Fortum1 that minimum cost, competitive
advantage and services are the factors which can take the Nordic electricity market to a
better place along with the customer satisfaction and concern for environmental (Lilius,
2007).
1 One of the leading electricity provider companies in Sweden.

International Marketing Mälardalens University
2
So we decided to work on the concept of green marketing and our chosen industry for that is
energy sector in Sweden, which is very attractive now a day and we expanded our area of
research by looking at the consumers’ attitude towards deciding about the electricity
supplier and which factors they especially focus before choosing it. And the factors on which
we will emphasis during the whole research are; price, services, environmental friendly and
availability.
1.1. ABOUT ESKILSTUNA ENERGI & MILJÖ
We have collaboration with EEM (Eskilstuna Energi & Miljö)
which is owned by Eskilstuna Municipality. And we got some
beneficial help from them in understanding the electricity
market of Sweden and how electricity companies operate.
It is one the biggest and main service provider of electricity, district heating, water,
sanitation and waste water service to the habitants of Eskilstuna, we worked with them to
evaluate that how much they work according to the demand of sustainability and what
marketing practice they are using currently and how green energy marketing strategies can
influence their sales. (EEM Website, 2010)
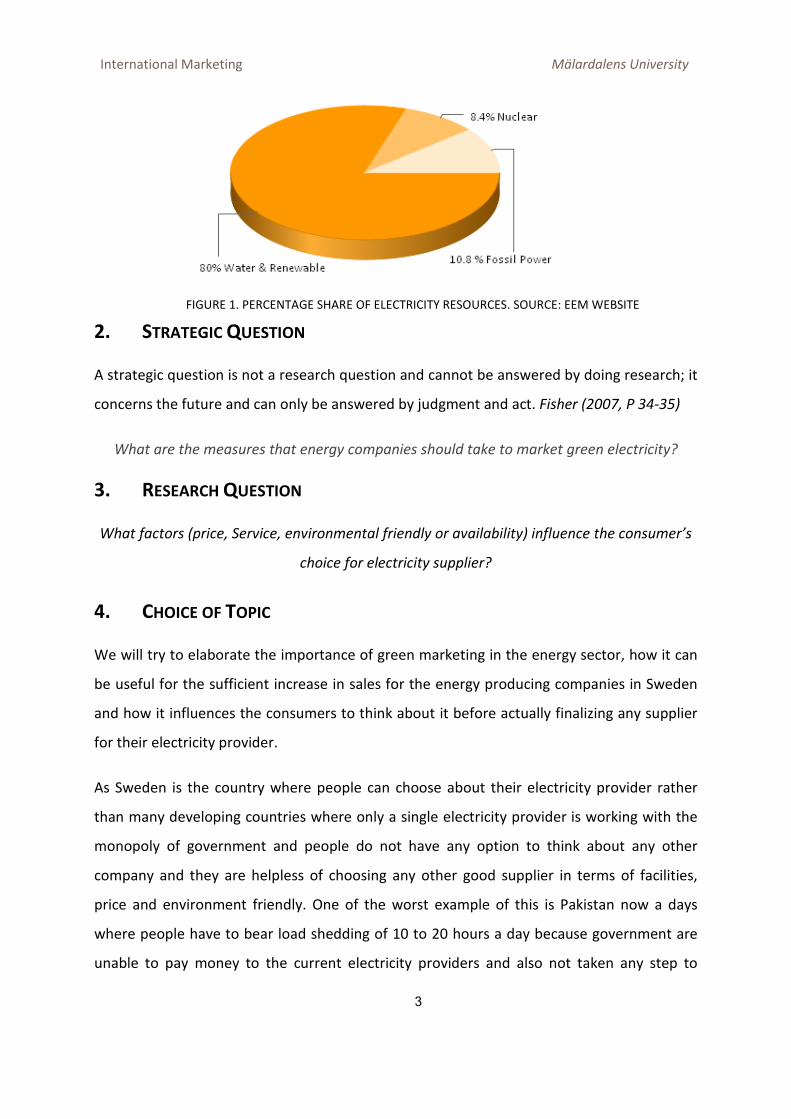
Right now they are providing three different types of electricity, which includes Bio
electricity, Bra miljöval2 and basic electricity, Bio electricity is the one which is being
prepared at EEM and the others they outsource from different companies. But the basic
electricity that they provide is also quite suitable for the sustainability of the environment; it
includes both water and all the renewable energy sources. Below given image can best
explain the percentage share of electricity resources (Lindqvist, 2010)
2 Type of electricity offered by EEM. Exact meaning is, “Good Environmental Choice”
International Marketing Mälardalens University
3
2. STRATEGIC QUESTION
A strategic question is not a research question and cannot be answered by doing research; it
concerns the future and can only be answered by judgment and act. Fisher (2007, P 34-35)
What are the measures that energy companies should take to market green electricity?
3. RESEARCH QUESTION
What factors (price, Service, environmental friendly or availability) influence the consumer’s
choice for electricity supplier?
4. CHOICE OF TOPIC
We will try to elaborate the importance of green marketing in the energy sector, how it can
be useful for the sufficient increase in sales for the energy producing companies in Sweden
and how it influences the consumers to think about it before actually finalizing any supplier
for their electricity provider.
As Sweden is the country where people can choose about their electricity provider rather
than many developing countries where only a single electricity provider is working with the
monopoly of government and people do not have any option to think about any other
company and they are helpless of choosing any other good supplier in terms of facilities,
price and environment friendly. One of the worst example of this is Pakistan now a days
where people have to bear load shedding of 10 to 20 hours a day because government are
unable to pay money to the current electricity providers and also not taken any step to
FIGURE 1. PERCENTAGE SHARE OF ELECTRICITY RESOURCES. SOURCE: EEM WEBSITE

International Marketing Mälardalens University
4
introduce other private suppliers and create a competition among the suppliers of energy
market, which can results in the better product in cheaper price (Info Pakistan, 2010). Even
though we are conducting this research in the Swedish market but it can also be useful for
the developing countries as well to think about it in two ways.
− Different supplier of energy or electricity
− Save the Environment
So it can be a good opportunity to do our thesis on this topic where we can analyze some
companies that how they present their offerings and what measures/ factors they should
adopt to promote green energy marketing, which can has influence over the ratio of their
sales as well. On the other hand we are curious to know that what are the important steps/
factors that people consider before actually choosing any company; is it the matter of price,
better services or they also think about the environment as well. So these are the reasons
which lead us to work on this topic.

International Marketing Mälardalens University
5
5. METHODOLOGY
This part includes the information about how we conducted the research; firstly we have
covered the concept of quantitative research, secondly we have focused on the data
collection methods followed by reliability limitations and obstacles during the tenure of
research.
5.1. RESEARCH METHODS
According to Colin Fisher, there are two different kinds of research methods; quantitative
method deals with numbers and uses statistical tools to get the result while qualitative
research methods emphasis on in depth information to reach the conclusion by focusing on
words (Fisher, P 62, 2007)
In the above research, ratio is approximately 70 - 30% between quantitative and qualitative
research respectively because major portion of our findings are dependent upon
questionnaire which we have circulated among different sort of people and besides that we
have also focused on the quality as well by getting the chance to work with Eskilstuna Energi
& Miljö, who is the major supplier of electricity in Eskilstuna. We had numerous meetings
with the representative of development department and got some useful information about
electricity market, their way of operations and their strategies regarding environmental
friendly products.
5.2. DATA COLLECTION METHODS
Generally there are two types of data collection used for any research; primary and
secondary and in this study majorly we focused on primary data to reach to the maximum
level of satisfaction.
5.2.1 Primary Data
Since the study is mainly composed of quantitative and primary data, which is collected
through questionnaire; which was distributed to those people who pays for their bills and
we deliberately decided to not to involve those students who lived in student apartment

International Marketing Mälardalens University
6
where they don’t have to pay separate bills for their electricity and we have distribute the
questionnaires in Stockholm, Västerås, Eskilstuna and some other areas.
5.2.1.1 Questionnaire
The questionnaire was presented in Swedish only, even though we made it in English but
with the help of our supervisor we have translated it to minimize the confusion among
different answers for same type of questions and also to provide ease to the habitants of
Sweden as we only have to distribute in Sweden.
According to the guidelines in Fisher (2007), regarding the choice of questionnaire format,
we include the following Questionnaire formats.
− Dichotomous Questions
− Multiple Choice Question
− Checklists
− Open Questions
5.2.1.2 Questionnaire Design
There are several methods to design the questionnaire but we have structured our
questionnaire according to the strategic, research question and framework that we have
used to answer these questions.
Questions 1-7 are considered as background questions which were asked to know about the
basic things of respondents which can affect on the choice of electricity supplier. (Go to
Appendix, Page 58)
Questions 8-15 are emphasis on the current electricity supplier, which is being chosen by the
respondents. It gave the idea that why they chosen that specific supplier and which are the
factors that they considered while choosing. (Go to Appendix, Page 58-59)

International Marketing Mälardalens University
7
Questions 16-21 consist on the personal factors of the respondents. It helped in
understanding that whether respondent is willing to change the supplier or not. (Go to
Appendix, Page 59)
Questions 22-28 are totally based on the renewable energy market, which includes the
questions about green energy sector and which things are important for respondents and
how much extra he/ she can spend for green energy promotion and usage. (Go to Appendix,
Page 59-60)
5.2.1.3 Distribution of Questionnaire
We had numerous options in mind in the beginning to circulate the questionnaire among
different regions and to different class of people but finally we used only two methods to
complete this task.
The first option that we used to get the answers from many people at single time is in train,
we planned several trips to go to Stockholm, Västerås and Arboga by train and conducted
that questionnaire because normally people have some ample time so that proved to be
quite feasible because many people work in Stockholm so we got a good idea about the
working class of Sweden as well for electricity and energy problems.
Secondly we visited public places like bus and train stations, center of towns and public
gardens to get the opinion of people about our academic research.
5.2.1.4 Sample Size
Even though our research is purely based on the conventional sampling but with the
understanding of our supervisor, we have decided that our sample size for the questionnaire
should be 400. But to fulfill this task we had to ask around 1000 people because neither
every person is willing to do nor he/ she has the time to solve it.

International Marketing Mälardalens University
8
5.2.1.5 Population
In this research our main population was the habitants of Eskilstuna, Västerås but as we
travelled a lot in trains for the fulfillment of questionnaires that’s why we got a chance know
about the opinion of many other people who lived in other parts of Sweden like Stockholm,
Göteborg, Katrineholm, Strängnäs, Arboga and few other small towns. And we think it was a
good sign for the academic work to include so many places for different opinion.
5.2.2 Secondary Data
Secondary data was gathered through related books, previous thesis, articles, journals and
websites from internet. But our major sources are; Joseph & Kredler, 2009, Peattie & Crane,
2005 which we have used to compare in our analysis and the book on consumer decision
process by Fuller, 1999 through which we have adopted a model and used to find the
answers of our research question.
5.3. RELIABILITY
The First hand data collection for the purpose of reliability is highly subject; several checks
have been included in the questionnaires to insure the reliability but as it is purely
dependent upon the respondent of different backgrounds, time and situation. So one of the
major steps that we had taken; is to ensure the presence of any researcher while conducting
the questionnaire to give appropriate answers to the queries of some people and to make it
interesting for them by telling them a little bit about this work.
5.4. LIMITATION
Although we have time of around 10 weeks to complete this task but the wideness of the
topic and establishing links with the corporate sector time is always being the biggest
challenge to meet our requirements and for that we might have to narrow down our theme
and have to focus on the major part but as we reached to the decision about our topic
earlier and also have sufficient connections with the industry so we tried our level best to
cover it in a good sense and produce a result oriented paper within the given span of time.
But still to complete the task of questionnaire took more than our expected time, which

International Marketing Mälardalens University
9
resulted in difficulty for completing this task and writing findings and analysis in much less
time than expectation that’s why we were hardly able to manage the task in time.
5.5. OBSTACLES IN RESEARCH
Best things to get most response about questionnaire is trains and busses as people have
plenty of time and they can spend few minutes in filling forms but biggest problem that we
have faced during questionnaire distribution is when ticket checker in trains stopped us; that
we are not allowed to do that without the permission of ‘SJ Management’ which wasted a
lot of our time in managing and completing our task of getting 400 response within time.

International Marketing Mälardalens University
10
6. LITERATURE REVIEW
In this section we give an overview of the related theories and researches to give an idea
about our area of research.
We have used various theories and research papers for our research. We used the work of
Phil Shepley (Shepley, 2010), L. Bird (L. Bird, 2002) and Painuly (Painuly, 2000) on green
energy. We also used various research articles of Ryan H. Wiser on green energy marketing.
These research articles and theories gave us a brief introduction and up to dated knowledge
about the green energy marketing. (Wiser R. , 2000) As we are studying only the Swedish
market, there is a very good study about energy usage in Sweden. Schippers has done this
research in which he has shown the energy usage trends in the Swedish market. Although
the research was done in 1990’s, but it still has the potential to guide us and give us some
important information and guideline about the energy usage trends in the Swedish market.
(L. Schipper, 1993)
Jay Zarnikau has done some very good work on consumer’s attitude about green marketing.
We have reviewed his research to understand some important aspects of consumer’s
attitude towards green marketing. (Zarnikau, 2003)
6.1. CARBON FOOTPRINT
“It is a measure of the impact of our activities on the environment and in particular climate
change. It relates to the amount of greenhouse gases produced in our day to day lives
through burning fossil fuels for electricity, heating and transportation etc”.
(CarbonFootprint, 2010)
In other words it is a measurement of all greenhouse gases which we individually and on
industrial level produce.
International Marketing Mälardalens University
11
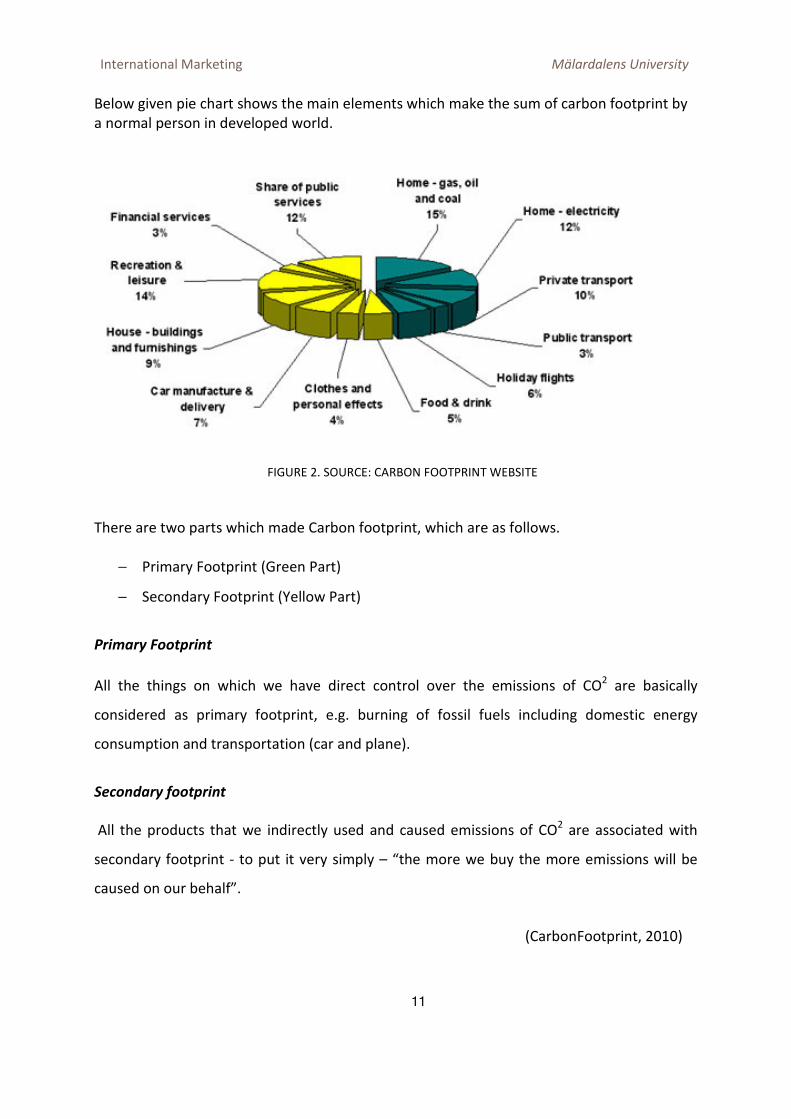
Below given pie chart shows the main elements which make the sum of carbon footprint by
a normal person in developed world.
There are two parts which made Carbon footprint, which are as follows.
− Primary Footprint (Green Part)
− Secondary Footprint (Yellow Part)
Primary Footprint
All the things on which we have direct control over the emissions of CO2 are basically
considered as primary footprint, e.g. burning of fossil fuels including domestic energy
consumption and transportation (car and plane).
Secondary footprint
All the products that we indirectly used and caused emissions of CO2 are associated with
secondary footprint - to put it very simply – “the more we buy the more emissions will be
caused on our behalf”.
(CarbonFootprint, 2010)
FIGURE 2. SOURCE: CARBON FOOTPRINT WEBSITE

International Marketing Mälardalens University
12
7. CONCEPTUAL FRAMEWORK
This section covers the concepts, understanding and theories which are related to academic
work and which we will try to use in different parts of our research.
7.1. CONSUMER BEHAVIOUR
“It is the psychology that how consumer’s think, feel, select and influenced by his or her
environment (culture, family, signs and media)”. (Perner, nd)
Some other researches show that there is a direct and positive impact on the green behavior
if consumer has more income and education. (Joseph & Kredler, 2009) Anderson &
Cunnigham, 1972 cited in Kreidler, N.B and Joseph M.S (2009 P. 232)
According to the surveys reports mostly European consumers are interested in green
products and especially electricity and they are willing to pay extra for green products. And it
is also observed that 92% of European consumers have adopted environmental sustainability
programs (Peattie & Crane, 2005).
7.2. CONSIDERABLE FACTORS FOR CONSUMERS
Although in our research we focused on primary data and analyzed that data to get the
answer of our strategic and research questions, but we also observed couple of models to
guide us throughout the completion of our research. We used Fuller’s “The Consumer’s
Decision Process Model” but we modified that model according to our research. We added
the factors that we want to study in our research, so that we can see their affect on the
consumer’s decision making. (Fuller, 1999)
There are numerous factors which consumer considers before choosing electricity and
besides that it is not only in electricity sector infect it is our normal habit to think before
actually buying or adopting anything and in the electricity this thing becomes more
important because we can’t see the product which we are about to buy other than the
glowing of tube light or using any machinery.

International Marketing Mälardalens University
13
In the late 90s, many European countries changed the way of supplying electricity and
allowed households to choose the supplier of electricity by their own, even though Sweden
has introduced the green energy concept in 1996 but this behavioral change of changing
electricity supplier has been increased during the last two years. (Söderholm, 2008)
Fuller (1999) has suggested that purchase decision of consumer help the marketers to
propose the marketing mix for the achievement of sustainability targets and provide the
criteria that the product system must be “compatible with ecosystems”. Fuller (1999) further
stated that “Customers must learn to base their purchase decision not only on how well
products satisfy individual needs but also on how these products affect the natural
environment”.
So we have decided to take the help from the model suggested by Fuller (1999) about the
purchase decision that what are the steps involved which actually consumers think before
deciding anything.
But as we have some specific factors on which we want to emphasis so we want to change
the model a little bit according to our requirement and need.
We have added few things at the stage of information search or during the information
search and then final purchase process or the final decision has been made and we have
neglected the post purchase behavior as well because our research includes the factors
which influence consumers not what is good or effective in longer run as well. So our final
model is look like;
FIGURE 3. THE CONSUMER DECISION PROCESS MODEL. SOURCE: FULLER 1999

International Marketing Mälardalens University
14
So if we try to elaborate the model that we have made, the first thing that is in the mind of
consumer is the choosing of electricity supplier which we named as ‘Problem Recognition’
according to Fuller 1999 and when any consumer feel him/ herself in that situation the next
step that he/ she is looking for is information regarding possible and available companies
and as far consumer starts searching there are several things that can prompt in the mind of
consumer and that are those factors which we have mentioned in next step, on which
basically our whole academic work is dependent.
So our emphasis on the below given findings is on those factors whose answer we got
through questionnaires.
FIGURE 4. SOURCE: ADOPTED MODEL BY AUTHORS

International Marketing
8. FINDINGS
Our sample group for the thesis was the people living in
electricity. We asked about more than 1000 people to complete the figure of
questioners. And we did this in
and Stockholm. We also circulate
Stockholm. So our findings of the data are described below:
8.1. NATIONALITIES
Out of 400 respondents, 93, 25
people who are currently living in
Swedish nationality.
Mälardalens University
15
Our sample group for the thesis was the people living in Sweden and paying for their
asked about more than 1000 people to complete the figure of
in houses, apartments and public places in Västerås,
Stockholm. We also circulated it in trains and busses between Eskilstuna, Västerås and
ur findings of the data are described below:
Out of 400 respondents, 93, 25% were the Swedish nationals and remaining 6, 75
people who are currently living in Sweden and paying for their electricity, but don’t have a
FIGURE 5. NATIONALITIES
93,25%
6,75%
Nationalities
Swedish
Others
älardalens University
and paying for their
asked about more than 1000 people to complete the figure of 400
Västerås, Eskilstuna
in trains and busses between Eskilstuna, Västerås and
nationals and remaining 6, 75% were
and paying for their electricity, but don’t have a
Swedish
Others
International Marketing
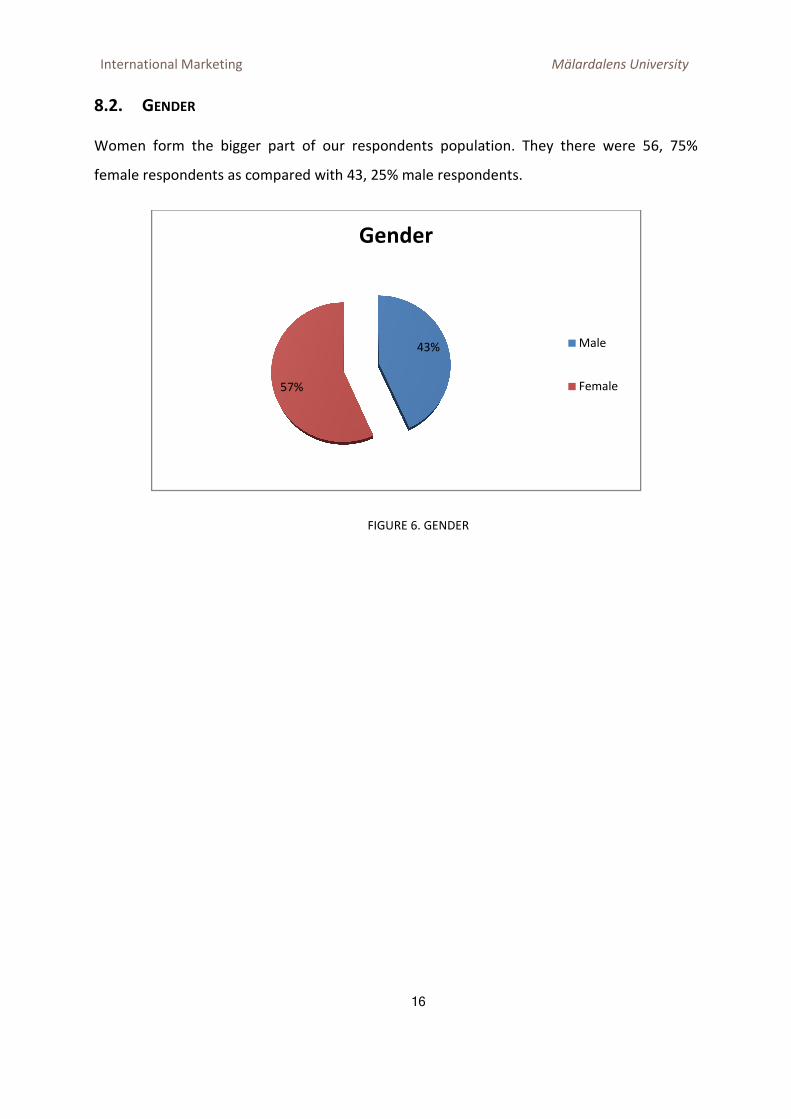
8.2. GENDER
Women form the bigger part of our respondents population. They there were
female respondents as compared with 43,
57%
Mälardalens University
16
Women form the bigger part of our respondents population. They there were
female respondents as compared with 43, 25% male respondents.
FIGURE 6. GENDER
43%
57%
Gender
älardalens University
Women form the bigger part of our respondents population. They there were 56, 75%
Male
Female

International Marketing
8.3. INCOME
21, 50% of our respondents have an incom
between 10,001 - 20,000 SEK. 15
have an income between 30,001
monthly income between 40,001
level between 60,001 - 80,000
80,000 SEK per month.
21,50%18,75%
0,00%
5,00%
10,00%
15,00%
20,00%
25,00%
Mälardalens University
17
of our respondents have an income lower than 10,000 SEK. 18, 75
SEK. 15% lie between 20,001 - 30,000 SEK. 13%
have an income between 30,001 - 40,000 SEK while 13, 50% of the respondents have a
monthly income between 40,001 - 60,000 SEK. 5, 75% of the respondents have an income
80,000 SEK and 4, 75% of the respondents have income more than
FIGURE 7. INCOME LEVEL OF RESPONDANTS
18,75%
15,00%13,00% 13,50%
5,75% 4,75%7,75%
Income
älardalens University
e lower than 10,000 SEK. 18, 75% have income
of the respondents
of the respondents have a
of the respondents have an income
of the respondents have income more than
Income
International Marketing
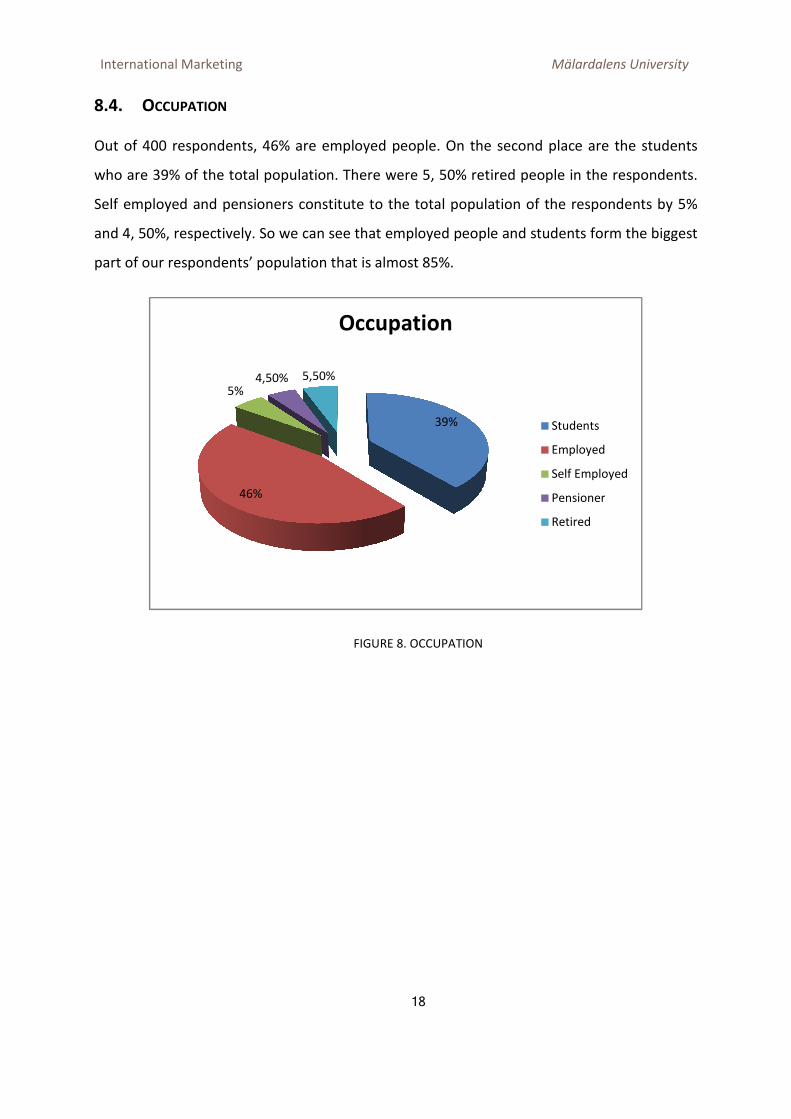
8.4. OCCUPATION
Out of 400 respondents, 46%
who are 39% of the total population. There were 5,
Self employed and pensioners constitute to the total populat
and 4, 50%, respectively. So we can see that employed people and students form the bi
part of our respondents’ population that
46%
5%4,50%
Mälardalens University
18
% are employed people. On the second place are the students
total population. There were 5, 50% retired people in the respondents.
Self employed and pensioners constitute to the total population of the respondents by 5
, respectively. So we can see that employed people and students form the bi
population that is almost 85%.
FIGURE 8. OCCUPATION
39%
4,50% 5,50%
Occupation
Students
Employed
Self Employed
Pensioner
Retired
älardalens University
ace are the students
retired people in the respondents.
ion of the respondents by 5%
, respectively. So we can see that employed people and students form the biggest
Students
Employed
Self Employed
Pensioner
Retired

International Marketing
8.5. LOCATION
27, 25% of the respondents belong to Väste
Eskilstuna and 8, 75% are from Stockholm. 36, 50
Sweden other than these cities. There were 0, 75
their location on the questionnaire.
8.6. LIVING IN
60, 75% of our respondents are living in a
respondents are living in their homes.
8,75%
36,50%
60,75%
Mälardalens University
19
of the respondents belong to Västerås. There are 26, 75%
are from Stockholm. 36, 50% of the respondents are from the areas of
than these cities. There were 0, 75% of the respondents who did not mention
their location on the questionnaire.
FIGURE 9. LOCATION OF RESPONDANTS
of our respondents are living in apartments while remaining 39, 25
respondents are living in their homes.
FIGURE 10. LIVING IN APARTMENT OR HOME
27,25%
26,75%
36,50%
0,75%
Location
Västerås
Eskilstuna
Stockholm
Others
Unspecified
39,25%
60,75%
Living in
Home
Apartment
älardalens University
respondents from
of the respondents are from the areas of
of the respondents who did not mention
partments while remaining 39, 25% of the
Västerås
Eskilstuna
Stockholm
Unspecified
Apartment

International Marketing
8.7. REASON FOR CHOOSING
The biggest number of respondents,
electricity supplier because it provides electricity at lower pr
25% of the respondents considered good service as the main factor while selecting the
electricity supplier. 9, 25% of the respondents said that they had
5, 50% of the respondents selected their electricity supplier because many othe
their social circle were using the same supplier. Only 5
environment friendly electricity while choosing their
respondents did not know about their electricity supplier’s name or t
remember the name while filling in the questionnaire
other reasons for choosing their electricity supplier. 2
the question.
FIGURE 11
5,50%
28%
15,25%
Reason of Choosing Current Company
Mälardalens University
20
ING CURRENT ELECTRICITY PROVIDER
The biggest number of respondents, that is 24, 50%, said that they chose the current
electricity supplier because it provides electricity at lower price than the competitors. 10,
of the respondents considered good service as the main factor while selecting the
of the respondents said that they had no other option available.
of the respondents selected their electricity supplier because many othe
using the same supplier. Only 5% of the respondents considered
environment friendly electricity while choosing their electricity supplier. 28%
respondents did not know about their electricity supplier’s name or they were unable to
remember the name while filling in the questionnaire. 15, 25% of the respondents had some
g their electricity supplier. 2% of the respondents did not answer
11. REASON OF CHOOSING CURRENT ELECTRICITY COMPANY
24,50%
10,25%
5%
9,25%
5,50%
2%
Reason of Choosing Current Company
Low Price
Good Service
Environmental Friendly
No other Supplier Available
Other people used that
Don't Know
Others
Unspecified
älardalens University
, said that they chose the current
ice than the competitors. 10,
of the respondents considered good service as the main factor while selecting the
no other option available.
of the respondents selected their electricity supplier because many other people in
of the respondents considered
electricity supplier. 28% of the
hey were unable to
of the respondents had some
of the respondents did not answer
OMPANY
Reason of Choosing Current Company
Low Price
Good Service
Environmental Friendly
No other Supplier Available
Other people used that
Don't Know
Unspecified
International Marketing
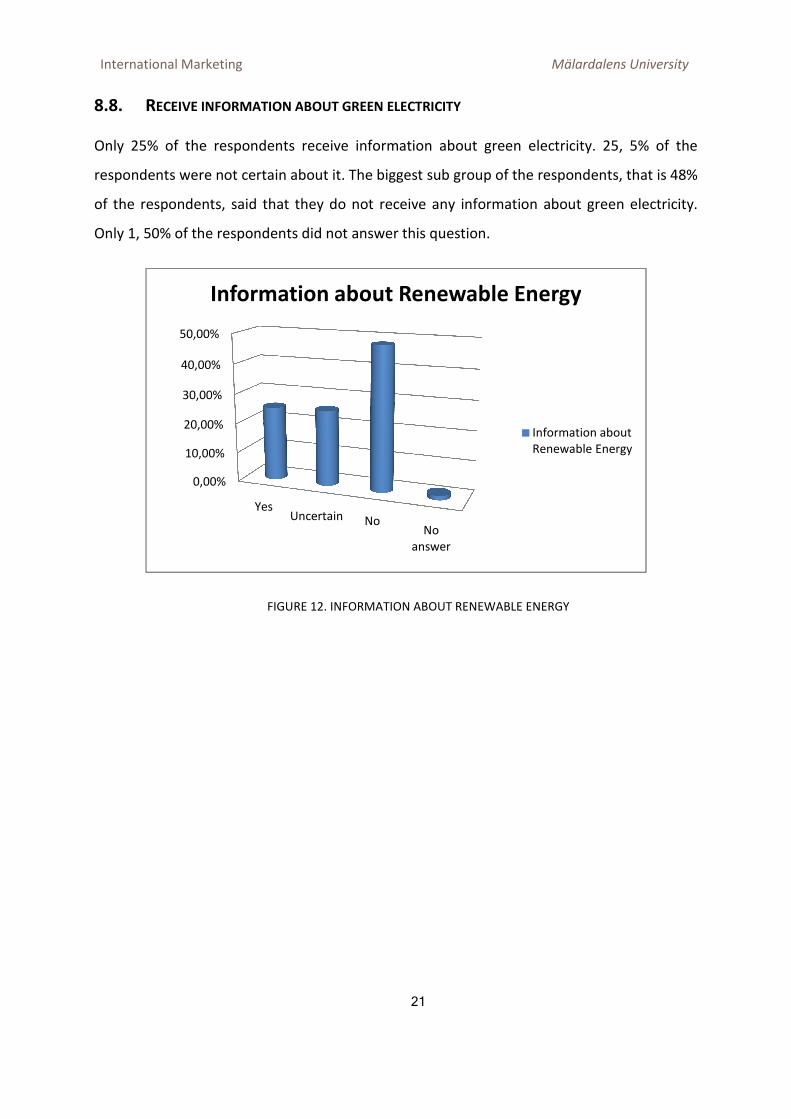
8.8. RECEIVE INFORMATION A
Only 25% of the respondents receive informati
respondents were not certain about it. The biggest sub group
of the respondents, said that they do not receive any information abou
Only 1, 50% of the respondents did not answer this question.
FIGURE
0,00%
10,00%
20,00%
30,00%
40,00%
50,00%
Yes
Information about Renewable Energy
Mälardalens University
21
ECEIVE INFORMATION ABOUT GREEN ELECTRICITY
of the respondents receive information about green electricity. 25, 5
respondents were not certain about it. The biggest sub group of the respond
of the respondents, said that they do not receive any information abou
of the respondents did not answer this question.
FIGURE 12. INFORMATION ABOUT RENEWABLE ENERGY
Uncertain NoNo
answer
Information about Renewable Energy
Information about
Renewable Energy
älardalens University
on about green electricity. 25, 5% of the
of the respondents, that is 48%
of the respondents, said that they do not receive any information about green electricity.
Information about Renewable Energy
Information about
Renewable Energy

International Marketing
8.9. USE GREEN ELECTRICITY
Majority of the respondents’ d
using green electricity. 26% of the respondents said that they use green
14% of the respondents did not answer this question.
62%
14%
Mälardalens University
22
GREEN ELECTRICITY
Majority of the respondents’ do not use green electricity. 62% of the respondents are
of the respondents said that they use green
of the respondents did not answer this question.
FIGURE 13. USE GREEN ELECTRICITY
25%
14%
Use Green Electricity
Use green electricity
Donot use green electricity
No answer
älardalens University
of the respondents are not
of the respondents said that they use green electricity, while
Use green electricity
Donot use green electricity

International Marketing
8.10. GREEN ELECTRICITY PRI
47% of the respondents said that they do not know about t
the respondents think that price for gre
average while only 4% think that the prices are lower. 2
this question.
Lower
Mälardalens University
23
REEN ELECTRICITY PRICE
of the respondents said that they do not know about the green electricity prices. 30
the respondents think that price for green electricity is higher. 18% think that th
nk that the prices are lower. 2% of the respondents did not answer
FIGURE 14. GREEN ELECTRICITY PRICE
4%
18%
30%
47%
2%
Green Electricity Price
Average Higher Don't know No answer
älardalens University
he green electricity prices. 30% of
think that the price is
of the respondents did not answer

International Marketing
8.11. WHY DO NOT USE GREEN
Most of the respondents, that are 43
28% of the respondents said that they have lack of informat
of the respondents were satisfied with their current suppliers and did not want to
4% think that it takes time while 6
electricity. 3 % of the respondents did not answer this question.
FIGURE
Takes time
4%
Satisfied with
current supplier
16%
Other reasons
6%
Why Do not Use Green Electricity
Mälardalens University
24
HY DO NOT USE GREEN ELECTRICITY
respondents, that are 43%, do not use green electricity because it is expensive.
of the respondents said that they have lack of information about green electricity. 16
of the respondents were satisfied with their current suppliers and did not want to
hink that it takes time while 6% said they have some other reasons for
of the respondents did not answer this question.
FIGURE 15. WHY DO NOT USE GREEN ELECTRICITY
High price
44%
Lack of
information
28%
Satisfied with
current supplier
Other reasons
6%
Did not answer
3%
Why Do not Use Green Electricity
älardalens University
ity because it is expensive.
ion about green electricity. 16%
of the respondents were satisfied with their current suppliers and did not want to change.
said they have some other reasons for not using green
International Marketing
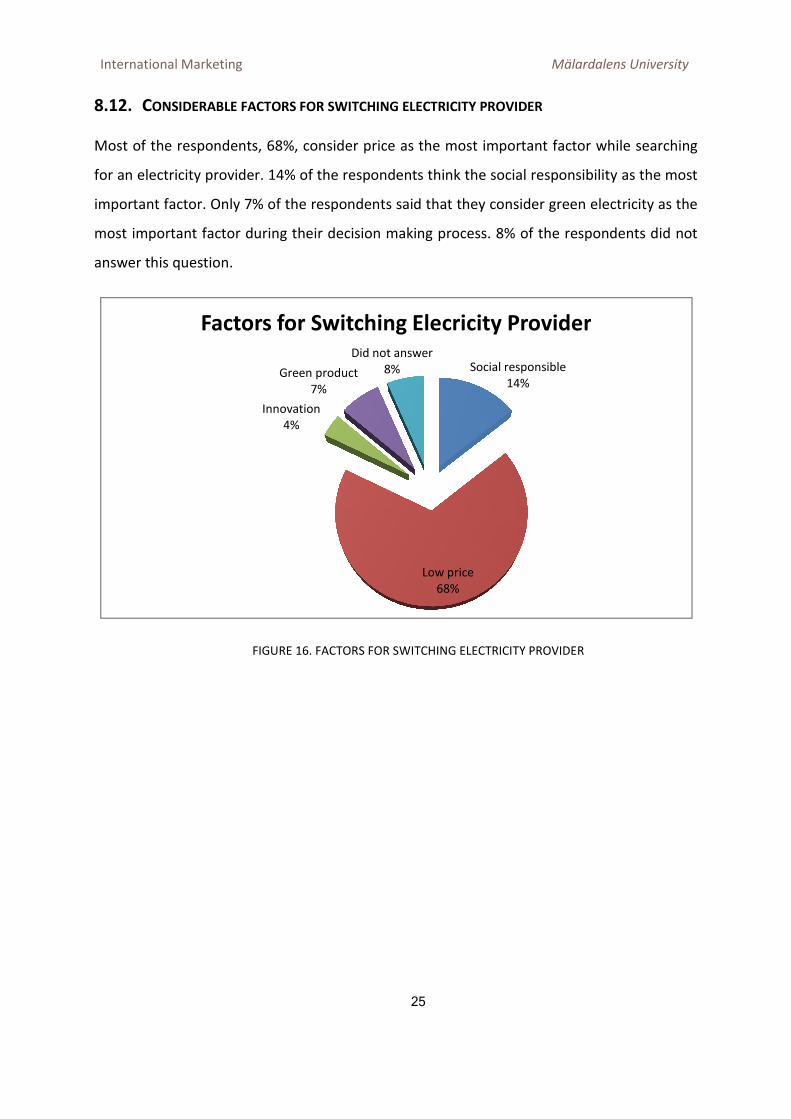
8.12. CONSIDERABLE FACTORS
Most of the respondents, 68%
for an electricity provider. 14%
important factor. Only 7% of the respondents said that they consider green electricity as the
most important factor during t
answer this question.
FIGURE
Innovation
4%
Green product
Factors for Switching Elecricity Provider
Mälardalens University
25
ONSIDERABLE FACTORS FOR SWITCHING ELECTRICITY PROVIDER
%, consider price as the most important factor while searching
% of the respondents think the social responsibility as th
of the respondents said that they consider green electricity as the
most important factor during their decision making process. 8% of the respondents did not
FIGURE 16. FACTORS FOR SWITCHING ELECTRICITY PROVIDER
Social responsible
14%
Low price
68%
Innovation
4%
Green product
7%
Did not answer
8%
Factors for Switching Elecricity Provider
älardalens University
, consider price as the most important factor while searching
of the respondents think the social responsibility as the most
of the respondents said that they consider green electricity as the
of the respondents did not
ELECTRICITY PROVIDER
Factors for Switching Elecricity Provider

International Marketing
8.13. HOW MUCH EXTRA MONEY
Most of the respondents, 36%
electricity. 17% of the respondents said that they will pay 1
electricity. 16 % were ready to pay 51
respondents were willing to pay 101
willing to pay more than 300 SEK
answer this question.
Extra Spending for Green Energy
0 1-
Mälardalens University
26
OW MUCH EXTRA MONEY YOU WILL PAY FOR GREEN ELECTRICITY
%, said that they will not pay even a single penny
of the respondents said that they will pay 1 - 50 SEK extra for green
were ready to pay 51-100 SEK extra for green electricity. 10
respondents were willing to pay 101-300 SEK extra for green electricity while only 4
willing to pay more than 300 SEK extra for green electricity. 17% of the respondents did not
FIGURE 17. EXTRA PAYING FOR GREEN ENERGY
36%
17%16%
10%
4%
17%
Extra Spending for Green Energy
-50 51-100 101-300 301 or above No Answer
älardalens University
, said that they will not pay even a single penny extra for green
50 SEK extra for green
extra for green electricity. 10% of the
green electricity while only 4% were
of the respondents did not
Extra Spending for Green Energy
No Answer
International Marketing Mälardalens University
27
9. ANALYSIS
Here we will try to analyze different factors which affect consumers to select electricity
supplier which is our major part of thesis and those factors are price, services,
environmental friendly or availability.
9.1. ANALYZING DIFFERENT FACTORS WITH RESPECT TO OCCUPATION
Students
Majority of the students said that low price is the factor that mainly affects their choice for
an electricity supplier. There were 20, 51% students who ticked low price as the main factor
influencing their decision making process. 10, 25% of the students said that they selected
the current supplier because there was no other alternative available for them. On the third
place were good services. 8, 97% of the student consumers said that they see services
offered the company as the most important factor while making their decision to buy
electricity. Only 5, 76% of the student consumers think environment friendly electricity as
main factor for selecting an electricity supplier. 14, 10% of the student consumers said that
they have some other factors that influence their selection process.
Employed
For the employed people, again, low price came out as the most influential factor while
selecting electricity supplier. 27, 72% of the employed consumers think price as the main
factor during their electricity supplier selection process. On the second place are good
services. 11, 96% of the employed people consider services as the main factor while
selecting their electricity supplier. Only 4, 89% of the employed consumers said that they
consider green electricity as the top priority. 16, 85% of the employed consumers said that
they have some factors other than those mentioned in the questionnaire.

International Marketing
FIGURE
Self Employed
35% of the self employed consumers think low price as the most important factor while
deciding some electricity supplier. 15
electricity supplier because there was no othe
selected their supplier because of good services. 10
reasons for selecting their electr
0,00%
10,00%
20,00%
30,00%
40,00%
50,00%
60,00%
Low Price
Good Services
Environmental Friendly
No other Supplier
Other poeple used
Don't know
Other reasons
Unspecified
Comparison between Occupation and Supplier
Mälardalens University
28
FIGURE 18. COMPARISON WITH RESPECT TO OCCUPATION
of the self employed consumers think low price as the most important factor while
g some electricity supplier. 15% of the self employed consumers selected the
electricity supplier because there was no other option available for them. 10
er because of good services. 10% people said that they had some other
reasons for selecting their electricity supplier.
Students Employed Self
Employed
Pensioner
20,51% 27,72% 35% 38,88%
8,97% 11,96% 10% 11,11%
5,76% 4,89% 5% 5,55%
10,25% 8,15% 15% 16,66%
5,76% 4,89% 5% 0%
30,76% 24,46% 20% 16,66%
14,10% 16,85% 10% 11,11%
3,84% 1,09% 0% 0%
Comparison between Occupation and Supplier Selection
älardalens University
SPECT TO OCCUPATION
of the self employed consumers think low price as the most important factor while
of the self employed consumers selected the
r option available for them. 10% people
people said that they had some other
Others
9,09%
4,54%
0%
13,63%
54,54%
18,18%
0%
Comparison between Occupation and Supplier

International Marketing Mälardalens University
29
Pensioner
38% of the pensioner consumers consider price as the most important factor for selecting
electricity supplier. 16% of these consumers’ had no other option available. 11% of the
pensioner consumers think good services as the most important factor. Only 5% of the
pensioner consumers chose their electricity supplier because of environmental reason. 11%
of them said that they had some other reasons for selecting their electricity provider.
Others
14% of the other people had no other option available for them. 9% think price as the most
important factor for them to choose some certain electricity provider. No one in the retired
consumers’ think environmental friendliness as the main factor during their decision making
process. 18% of the retired consumers’ said that they had some other reasons for choosing
some certain electricity supplier.
So from the figure 18; we can see that pensioner consumers are more conscious about low
price, while students are slightly more caring about the environment and green electricity
comparing to other occupations. Besides that all other factors are almost similar for all
consumers with respect to different occupations.

International Marketing Mälardalens University
30
9.2. ANALYZING DIFFERENT FACTORS WITH RESPECT TO INCOME
Electricity consumers with income less than 10,000 SEK per month
63, 97% of these consumers said that they think low price as the most important factor for
choosing an electricity supplier. 16, 27% of this group of consumers consider social
responsibility of the supplier as the most important factor. Only 9, 3% of these consumers
think about green electricity while choosing their electricity supplier.
Consumers with income between 10,001 - 20,000 SEK per month
69, 33% of these consumers think low price as the most important factor for them while
choosing an electricity supplier. 13% voted for social responsibility while only 6, 67%
consider green electricity as the most dominant factor for them while choosing an electricity
supplier.
Consumers with income between 20,001 - 30,000 SEK per month
66, 67% of these consumers think about price when choosing an electricity supplier for
them. 13, 34% consider social responsibility as the most important factor while only 11, 67%
of these consumers think for green electricity when choosing an electricity supplier.
Consumers with income between 30,001 - 40,000 SEK per month
75% of these consumers think as price the most important factor while choosing an
electricity supplier. 19, 23% voted for social responsibility while only 2% of these consumers
think about green electricity.
Consumers with income between 40,001 - 60,000 SEK per month
70% of these consumers think about low price while choosing an electricity supplier. 20%
think about how social responsible the electricity supplier is, while only 3, 7% of these
consumers voted for green electricity as the most important factor.

International Marketing
Consumers with income between 60,001
82, 6% of these consumers think that price matters the most for them. 4,
consumers voted for each of the social responsibility and green electricity.
Consumers with income more than 80,001 SEK per month
78, 94% of these consumers consider low price as the most important factor for them while
choosing an electricity supplier for them. 15,
responsibility of the supplier as the most important factor. No one in this group of
consumers think about green electricity as the most important factor.
FIGURE 19. COMPARISON BETWEEN I
From this graph (figure 19); we can
sensitive about the price of the electricity
having lower income. Similarly consumers with lower income are more consideration for
green product than the consumers having higher income.
00,10,20,30,40,50,60,70,80,9
Comparison between Income & Factor
Mälardalens University
31
Consumers with income between 60,001 - 80,000 SEK per month
% of these consumers think that price matters the most for them. 4,
consumers voted for each of the social responsibility and green electricity.
more than 80,001 SEK per month
% of these consumers consider low price as the most important factor for them while
y supplier for them. 15, 78% of these consumers think social
responsibility of the supplier as the most important factor. No one in this group of
consumers think about green electricity as the most important factor.
COMPARISON BETWEEN INCOME AND FACTOR CONSIDERA
we can conclude that consumers having higher income are more
sensitive about the price of the electricity that they are using rather than the consumers
Similarly consumers with lower income are more consideration for
green product than the consumers having higher income.
Comparison between Income & Factor Consideration
älardalens University
% of these consumers think that price matters the most for them. 4, 34% of these
consumers voted for each of the social responsibility and green electricity.
% of these consumers consider low price as the most important factor for them while
78% of these consumers think social
responsibility of the supplier as the most important factor. No one in this group of
AND FACTOR CONSIDERATION
that consumers having higher income are more
than the consumers
Similarly consumers with lower income are more consideration for
Comparison between Income & Factor
Social responsible
Low price
Innovation
Green product
International Marketing
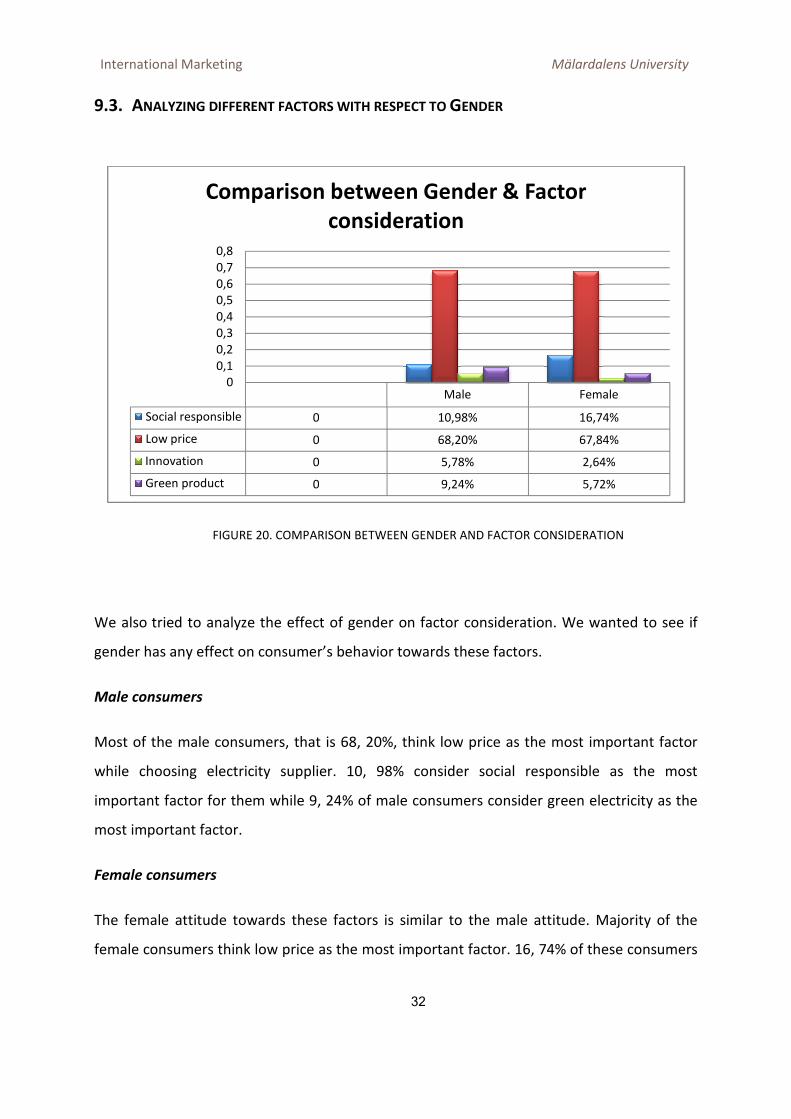
9.3. ANALYZING DIFFERENT FACTORS WITH RESPECT
FIGURE 20. COMPARISON BETWEEN
We also tried to analyze the effect of gender on factor consideration.
gender has any effect on consumer’s behavior towards these factors.
Male consumers
Most of the male consumers, that is 68, 20
while choosing electricity supplier. 10,
important factor for them while 9, 24
most important factor.
Female consumers
The female attitude towards these factors is similar to the male attitude. Majority of the
female consumers think low price as the most important factor. 16,
Social responsible
Low price
Innovation
Green product
0
0,1
0,2
0,3
0,4
0,5
0,6
0,7
0,8
Comparison between Gender & Factor
Mälardalens University
32
ACTORS WITH RESPECT TO GENDER
. COMPARISON BETWEEN GENDER AND FACTOR CONSIDERA
tried to analyze the effect of gender on factor consideration. We
gender has any effect on consumer’s behavior towards these factors.
, that is 68, 20%, think low price as the most important factor
while choosing electricity supplier. 10, 98% consider social responsible as the most
tant factor for them while 9, 24% of male consumers consider green electricity as the
female attitude towards these factors is similar to the male attitude. Majority of the
female consumers think low price as the most important factor. 16, 74% of these consumers
Male
0 10,98%
0 68,20%
0 5,78%
0 9,24%
Comparison between Gender & Factor consideration
älardalens University
AND FACTOR CONSIDERATION
We wanted to see if
price as the most important factor
% consider social responsible as the most
% of male consumers consider green electricity as the
female attitude towards these factors is similar to the male attitude. Majority of the
% of these consumers
Female
16,74%
67,84%
2,64%
5,72%
Comparison between Gender & Factor

International Marketing
consider social responsible as the most important factor for them. Only 5,
consumers said that they consider green product as the most important factor while
selecting electricity supplier for them.
From the figure 20; we can see that male consumers are more conscious about green
product than female consumers, while
responsibility than male consumers. Both are almost equally sensitive about low price.
9.4. WILLINGNESS TO PAY EXTRA
RENEWABLE ENERGY
FIGURE 21. COMPARISON BETWEEN R
Consumers Who Receive Information
The majority of these consumers, that is 39
penny extra for green electricity. 20
an amount up to 50 SEK per month on green electricity. 15
0,00%5,00%
10,00%15,00%20,00%25,00%30,00%35,00%40,00%
Yes
0 39,00%
1--50 20,00%
51--100 15,00%
101--300 10,00%
301----- 4,00%
No answer 12,00%
Comparison Between Receiving Information & Willingness to Pay Extra
Mälardalens University
33
consider social responsible as the most important factor for them. Only 5,
consumers said that they consider green product as the most important factor while
selecting electricity supplier for them.
we can see that male consumers are more conscious about green
product than female consumers, while female consumers give more value to social
responsibility than male consumers. Both are almost equally sensitive about low price.
TO PAY EXTRA, WHO RECEIVE INFORMATION ABOUT
COMPARISON BETWEEN RECEIVING INFORMATION & WILLINGNESS TO PAY
nformation Regularly
e consumers, that is 39%, said that they will not spend even a single
extra for green electricity. 20% of consumers belonging to this group are will
month on green electricity. 15% say that they can spend 51
Yes Uncertain No
39,00% 32,35% 35%
20,00% 16,66% 17%
15,00% 13,72% 19%
10,00% 10,78% 10%
4,00% 2,94% 4%
12,00% 23,52% 14%
Comparison Between Receiving Information & Willingness to Pay Extra
älardalens University
consider social responsible as the most important factor for them. Only 5, 72% of the female
consumers said that they consider green product as the most important factor while
we can see that male consumers are more conscious about green
female consumers give more value to social
responsibility than male consumers. Both are almost equally sensitive about low price.
& WILLINGNESS TO PAY EXTRA
%, said that they will not spend even a single
belonging to this group are willing to pay
% say that they can spend 51-100
35%
17%
19%
10%
14%
Comparison Between Receiving Information

International Marketing Mälardalens University
34
SEK per month extra for green electricity. Only 4% were willing to pay an amount more than
300 SEK extra per month for green electricity.
Consumers Who do not Receive Information
The consumers who do not receive information about green electricity have almost similar
attitude as the consumers receiving information. 35% of these consumers say that they will
not pay any amount extra for green electricity. 17% are willing to pay an amount up to 50
SEK per month extra for green electricity. 19% are willing to pay between 51 - 100 SEK per
month for green electricity. 10% say that they will pay an amount between 101 - 300 SEK per
month extra for green electricity. Only 4 % are willing to pay an amount more than 300 SEK
extra per month for green electricity.
From the graph above (figure 21); we can see that there is no much difference in willingness
to pay extra for green electricity, between consumers who regularly receive information
about green electricity and the consumers who do not receive information regularly.

International Marketing
9.5. ANALYZING THE ATTITUD
FIGURE
Consumers Having no Child
69, 91% of the consumers who do not
13, 27% think social responsibility
electricity as the main factor.
Consumers Having One Child
66, 10% of the consumers think
supplier. 18, 64% consider social responsibility as th
these consumers think green electricity as the most important factor for them.
Consumers Having Two Children
65, 78% of these consumers think low price as the most important factor for
consider while choosing some electricity supplier. 15,
the most important factor. 11,
important factor for them.
Social responsible 0
Low price 0
Innovation 0
Green product 0
0
0,1
0,2
0,3
0,4
0,5
0,6
0,7
0,8
Pe
rce
nta
ge
People Living with/ without Children
Mälardalens University
35
THE ATTITUDE OF CONSUMERS WITH AND WITHOUT CHILDREN
FIGURE 22. PEOPLE LIVING WITH/ WITHOUT CHILDREN
who do not have any child consider low price as the main factor
27% think social responsibility as the most important factor while 7,
consumers think low price is the main factor for selecting an
consider social responsibility as the most important factor. Only 5
these consumers think green electricity as the most important factor for them.
hildren
% of these consumers think low price as the most important factor for
consider while choosing some electricity supplier. 15, 78% consider social responsibility
the most important factor. 11, 84% of these consumers think green product as the most
No Child One Child Two Children
0 13,27% 18,64% 15,78%
0 69,91% 66,10% 65,78%
0 4,42% 5,08% 2,63%
0 7,50% 5,00% 11,84%
People Living with/ without Children
älardalens University
AND WITHOUT CHILDREN
rice as the main factor.
as the most important factor while 7, 50% think green
for selecting any electricity
e most important factor. Only 5% of
these consumers think green electricity as the most important factor for them.
% of these consumers think low price as the most important factor for them to
78% consider social responsibility as
% of these consumers think green product as the most
Two ChildrenMore than
two Chidren
7,14%
75%
3,57%
People Living with/ without Children

International Marketing Mälardalens University
36
Consumers Living with More than Two Children
75% of these consumers think that low price is the main factor for them. 7, 14% consider
social responsibility as the most important factor. None of these consumers think green
electricity as the most important factor for them.
Even though we have seen a little bit trend in those consumers who are living with two
children as the percentage is 11, 84% and they give lower value to social responsibility of the
supplier and give no value to greener product. On the other hand all other categories lie
within 10%. And only price is the factor which has the major impact over the decision about
electricity supplier.
International Marketing
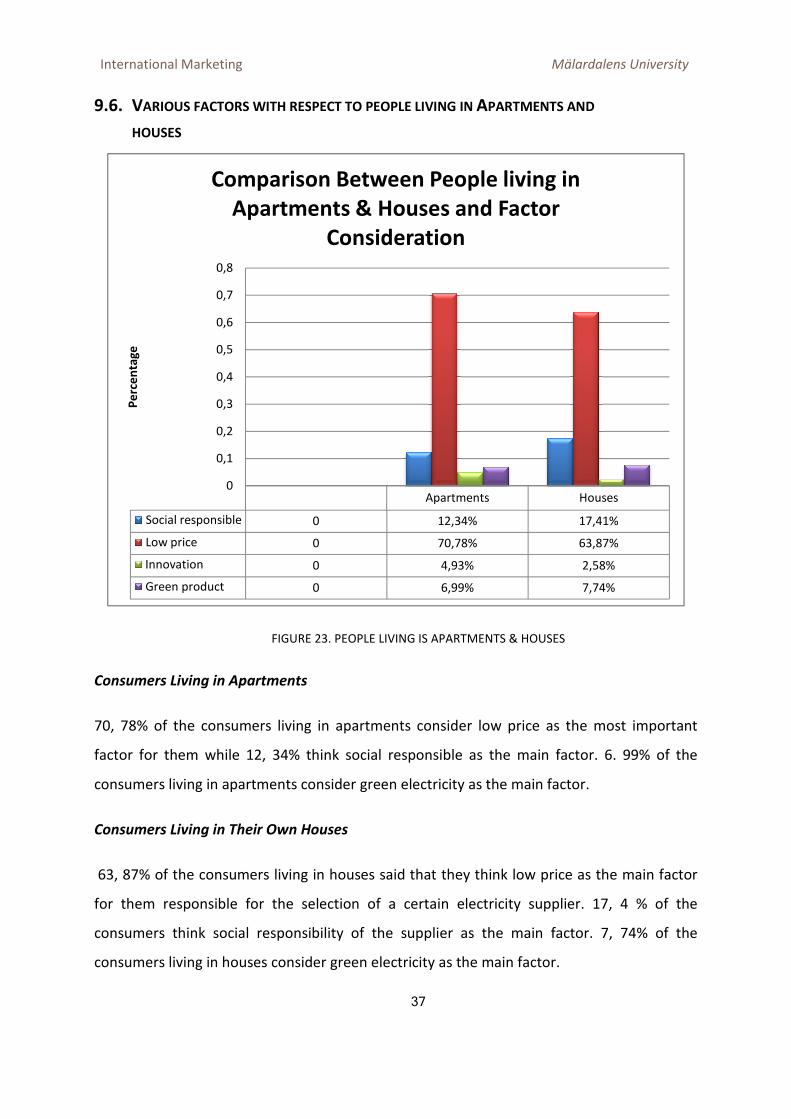
9.6. VARIOUS FACTORS WITH RES
HOUSES
FIGURE
Consumers Living in Apartments
70, 78% of the consumers living in apartments consider low price as the most important
factor for them while 12, 34% think social responsible as the main factor. 6. 99% of the
consumers living in apartments consider
Consumers Living in Their Own
63, 87% of the consumers living in houses said that they think low price as the main factor
for them responsible for the selection of a certain electricity supplier. 17, 4 % of the
consumers think social responsibility of the supplier as the main factor. 7, 74% of the
consumers living in houses consider green electricity as the main factor.
Social responsible
Low price
Innovation
Green product
0
0,1
0,2
0,3
0,4
0,5
0,6
0,7
0,8
Pe
rce
nta
ge
Comparison Between People living in Apartments & Houses and Factor
Mälardalens University
37
OUS FACTORS WITH RESPECT TO PEOPLE LIVING IN APARTMENTS AND
FIGURE 23. PEOPLE LIVING IS APARTMENTS & HOUSES
iving in Apartments
70, 78% of the consumers living in apartments consider low price as the most important
factor for them while 12, 34% think social responsible as the main factor. 6. 99% of the
consumers living in apartments consider green electricity as the main factor.
wn Houses
63, 87% of the consumers living in houses said that they think low price as the main factor
for them responsible for the selection of a certain electricity supplier. 17, 4 % of the
consumers think social responsibility of the supplier as the main factor. 7, 74% of the
consumers living in houses consider green electricity as the main factor.
Apartments
0 12,34%
0 70,78%
0 4,93%
0 6,99%
Comparison Between People living in Apartments & Houses and Factor
Consideration
älardalens University
PARTMENTS AND
70, 78% of the consumers living in apartments consider low price as the most important
factor for them while 12, 34% think social responsible as the main factor. 6. 99% of the
green electricity as the main factor.
63, 87% of the consumers living in houses said that they think low price as the main factor
for them responsible for the selection of a certain electricity supplier. 17, 4 % of the
consumers think social responsibility of the supplier as the main factor. 7, 74% of the
Houses
17,41%
63,87%
2,58%
7,74%
Comparison Between People living in

International Marketing Mälardalens University
38
From the graph above (figure 23); we can see that the consumers living in their own houses
are less price conscious and give more value to social responsibility and green product than
the consumers living in apartments.

International Marketing Mälardalens University
39
10. CONCLUSION
With reference to the topic, strategic and research question of our thesis, we came to an
admirable decision about the factors (price, services, environmental friendly or availability)
which influence people to purchase electricity in Swedish market.
We have tried to see the data from different angles (occupation, income, information and
gender) to check the major share of factor but result is almost same in every context. Even
though it was in our mind, as Grazin and Olsen 1991 say, before writing the thesis that
environmental friendly will be one of the most concerning factor in Swedish market because
whenever we talked to anyone about green energy and sustainability they said that, yes it is
very important and we should think about that. But results are totally opposite to that and
we do not have any hesitation in saying that Swedish people mostly emphasis on price
rather than any other factors.
According to Joseph and kredler 2009, in the beginning we also had a perception in mind
that might be young people or especially students will be more willing to support
environmental friendly energy but after gathering the data we saw that we were wrong and
same is the result for the income level, does not matter if a person is earning less than
10,000 or more than 80,000 SEK they all focus on price. And the second important factor is
the services that companies offer, thirdly is the availability even though it is not a big issue to
switch to the services of any other company but still people prefer to stick with that what
they have in excess easily and finally at 4th place they consider environmental friendly factor
is important.
Another aspect that we used to analyse the data is difference of opinion between male and
female but statistics show that price is the important factor, secondly they prefer that
companies should be social responsible and thirdly they said that they will go for greener
product and more or less same ratio have observed between male and female respondents.
Some people said that lack of information can be one of the reasons that people do not go
for environmental friendly products but when we compare the information available with
willingness to pay extra for green energy there were no astonishing results and all the three

International Marketing Mälardalens University
40
types of respondents Yes, uncertain and No replied between the range of 15-20% they can
spend 1-50 SEK. It means it does not matter if people have information or not they are not
willing to spend extra on green energy promotions and products.
As far as effects on consumers’ behavior with respect to living with or without children is
also not very promising and the same result of lower price has been revealed from here,
even though we have seen a little bit trend in those consumers who are living with their two
children are mild towards greener environment as the percentage is 11, 84% otherwise all
other categories lie within 10%, which falsified our perspective about green energy that
might be people having children concern about the environment as their children are the
part of future generation (Figure 22).

International Marketing Mälardalens University
41
So if we try to summarize all the results of our finding and analysis, most demandable
answer from customers’ point of view is described below with respect to our adopted model
(Figure 4)
FIGURE 24. CONSUMER DECISION ABOUT ELECTRICITY SUPPLIER, SOURCE: AUTHORS
International Marketing Mälardalens University
42
11. RECOMMENDATIONS
On the basis of our finding and analysis here in this chapter we would like to add certain
recommendations for the green or intended to be green companies, which can be beneficial
for them both in terms of revenue generating and concerning about environment.
The green energy companies should not use advertisement or packages based on
occupation. As we can see from Figure 18, that there is no much difference in the factor
consideration for consumers belonging to different fields of life.
Green energy companies should also avoid any advertisement or special package which will
target consumers belonging to some specific income level. As we can see from figure 19, in
analysis, that higher income does not assure consumer’s willingness to pay more for green
energy. There is also no useful difference between the factor consideration of consumers
belonging to different income levels. Similarly green energy companies should also avoid
targeting consumers belonging to some specific gender. As figure 20 shows that there is no
much difference in factor consideration in male and female consumers.
As we can see from the Fig.22, that a marketing campaign or special package targeting
consumers on the basis of their marital status, or the number of children, will not be much
beneficial. The Figure shows that there is no much difference in factor consideration for
these consumers. Similarly, figure 23 shows that any marketing campaign targeting
consumers living in apartments or living in their own houses will not much difference.
So if we try to answer our strategic question on the basis of our findings we recommend
companies who are working on greener product that it does not matter how good your
product is and how much it is good for environment, the thing that can influence consumers
is price and social responsible (Figure 16).
Even though it is difficult to equalize the price of green electricity with the conventional
electricity but we think there are certain marketing techniques that companies can adopt to
enhance the share of green electricity. As Granzin and Olsen said in 1991 we also
recommend that media promotions should appeal the sense of community. Moreover

International Marketing Mälardalens University
43
Ottman said in 1993 that local subsidiaries can be more successful than multinational power
organizations.
We will also recommend that companies should create awareness about the carbon
footprints (Figure 2) that how much we contribute towards maximizing the omission of CO2
in the atmosphere as it is not only a responsibility of government or a single company to
save environment. So everyone should contribute towards it and companies should bring
some techniques on papers time to time so that best results can be observed.

International Marketing Mälardalens University
44
12. FUTURE RESEARCH
Even though our research work concluded in a respectable manner with positive results for
the electricity companies in Sweden that which are the things they should focus but there is
no limit for betterment and there is always room for more comprehensive and useful
research and we think our work will also lead to a new platform for the research in the
energy and renewable sector of Sweden.
Each factor that we have chosen in our research can be chosen individually in future to reach
up to the deepest level of affects that can generate from it, e.g. if we say that 30% of the
population say that good services are important for them to chose the electricity supplier
then which services, either it is customer relation services or the quality services or the
billing services and it is same with the other factors as well.
We think that sample size and location can be increased to see the more comprehensive
results, because we have limitation of time and revenue that’s why we focused on the
limited number of respondents and areas.

International Marketing Mälardalens University
45
13. BIBLIOGRAPHY
BBC, UK [online] Available at:
http://www.bbc.co.uk/radio4/youandyours/technology_launch.shtml
[Accessed April 04, 2010]
Bjorheden, R. (2003). Drivers behind the development of forest energy in Sweden. Biomass
and Bioenergy.
CarbonFootprint. (2010). Carbon Footprint. Retrieved May 20, 2010, from
http://www.carbonfootprint.com/carbonfootprint.html
David P. Chynoweth, J. M. (2000). Renewable methane from the anaerobic digestion of
biomass. Renewable energy.
EK, K & Söderholm (2008). Households’ Switching Behaviour between electricity supplier in
Sweden. European Regulatory Perspectives. 16 (4), 254-261. Retrieved from Wiley Iner
Science Database, Mälardalens University Liberary.
Eskilstuna Energi & Miljö [online] Available at: http://www.eem.se [Accessed March 28,
2010]
Fisher, C., Buglear, J., Lowry, D., Mutch, A., & Tansley, C. (2007). Researching and Writing a
Dissertation: A Guiding Book for Business students. London: Pearson Education.
Fuller, D. A. (1999). Sustainable Marketing: Managerial-Ecological Issues. Markets and
Market Development. Sage Publications, California, USA. Academic Book was issued from
Mälardalen University Library.
Hetesi, E. (2009). Measurement and analysis of customer loyalty to an electricity distributor,
specialties of clusters of loyalty on customer market. Akademiai Journals Collection , 307-
330.

International Marketing Mälardalens University
46
Info Pakistan. (2010). Retrieved June 03, 2010, from
http://www.infopakistan.pk/2010/04/electricity-load-shedding-in-pakistan-only-due-to-
defective-policies/
Johansson, T. B., McCormick, K., Neij, L., & Turkenburg, W. (2004). The Potentials of
Renewable Energy. Secretariat of the International Conference for Renewable Energies, (p.
1).
Joseph, K. N., & Kredler. (2009). How green should you go? Understanding the role of green
atmospherics in service environment evaluations. International Journal of Culture, Tourism
and Hospitality Research .
Lilius, M. (2007). Fortum. Retrieved June 03, 2010, from Fortum Homepage:
http://www.fortum.com/gallery/pdf/Fortum_sahkomarkkinat_A4_CO_ENG2.pdf
L. Bird, R. (2002). A review of international green power markets: recent experience, trends
and market drivers. Renewable and Sustainable Energy Reviews , 525.
L. Schipper, F. J. (1993). Energy Use in Sweden: An International Perspective. California:
University of California.
Lindqvist, M. (2010, April 10). Introduction to EEM. (W. &. Akmal, Interviewer)
Painuly, J. (2000). Barriers to renewable energy penetration; a framework for analysis.
Renewable Energy.
Peattie K. & Crane A. (2005). Green Marketing: Legend, myth, farce or prophesy?.Qualitative
Market Research, 8(4). 357-370. Retrieved from Emerald Database. Mälardalen University
Library.
Perner, L. (nd). Consumer Behavior: The Psychology of Marketing. Retrieved 04 10, 2010,
from consumer psychologist: http://www.consumerpsychologist.com/
Shepley, P. (2010, january 31). What Is Green Energy. Retrieved april 06, 2010, from
wisegeek: http://www.wisegeek.com/what-is-green-energy.htm

International Marketing Mälardalens University
47
Wahiduddin, 2008 Retrieved May 27, 2010, from
http://wahiduddin.net/words/bismillah.html
Wiser, R. H. (1998). Green power marketing: increasing customer demand for renewable
energy. Utilities Policy .
Wiser, R. H. (2006). Using contingent valuation to explore willingness to pay for renewable
energy: A comparison of collective and voluntary payment vehicles. Ecological economics .
Wiser, R. (2000). The role of public policy in emerging green power markets: an analysis of
marketer preferences. Renewable and Sustainable Energy Reviews .
Zarnikau, J. (2003). Consumer demand for ‘green power’ and energy efficiency. Energy Policy

International Marketing Mälardalens University
48
14. APPENDIX
This section includes all the data, which we used and go through during the process of our
research and as it consists of many things so we placed it in the last to have appropriate data
in the main paper and if anyone want to see more detailed then he/ she can found it here.
14.1. GREEN ENERGY
Green energy is the energy that is produced in such a way that its production has the least
negative impact on the environment. The energy sources in use like fossil fuels have very
negative effect on the environment. Solar energy, wind energy, hydro energy and
geothermal energy are some examples of the green energy. Every method of energy
collection creates pollution, but the purpose of the green energy is to create energy with as
little pollution as possible. Cleaning up the present fossil fuels so that more clean energy is
produced is also one purpose of green energy. (Shepley, 2010) The green energy products
are generally 100% renewable energy offerings which are prepared either from many
sources, or only one source, like hydro or solar or wind energy. (L. Bird, 2002)
As the public awareness about environmental issues is increasing, the usage of green energy
is also increasing. Renewable energy sources provided almost 20 % of total world energy
demand in 2000, and will fulfill 90 % of total primary energy demand in 2020. (Painuly, 2000)
Why Green Energy?
According to David P. Chynoweth, John M. Owens and Robert Legrand, the recent emphasize
for green or renewable energy is related to global environmental quality. The combustion of
fossil fuels releases toxic compounds like oxides of nitrogen and sulfur. These pollutants
cause health and environmental problems globally, the most dangerous of which is global
warming caused by increasing concentrations of carbon dioxide. For example, the use of
renewable biomass as a source of energy is not only greener but also creates closed
balanced carbon cycle with respect to atmospheric carbon dioxide. Another concern is the
need for treatment and disposal of large quantities of organic wastes. These wastes are not

International Marketing Mälardalens University
49
only environmental threat but are also potential renewable energy resource. (David P.
Chynoweth, 2000)
The increasing population of the globe and the limited quantity of fossil fuels also make it
necessary for us to move to renewable energy resources as soon as possible. This will help us
in sustaining our species on the planet in a way that is compatible for the preservation of the
biosphere. (David P. Chynoweth, 2000)
Green Energy in Sweden
Green power was started in Sweden in 1996 and today there are more than 50 companies
offering green power options to electricity consumers in Sweden. Most of the companies
produce their own green power but there are some companies that purchase green power
and resell it to their customers. Green power sales increased about 32% in 2000 and
contributed to 6% of the total electricity sales in Sweden. The average price premium in
2000 it was almost 1, 4 öre3/ KWH4, which was about 8 - 10% premium over the cost of
electricity for commercial and industrial users. (L. Bird, 2002)
Green marketing has the advantage of customers’ willingness to purchase and pay many
times higher for the product. The product has the benefit that consumers think it good for
their environment and health.
The marketers should take care of some very important points while marketing green
energy. Green power programs will be more successful when they appeal to the sense of the
community. It means that community based marketing techniques should be used. The
collective harm messages like everybody should work to protect the environment should be
used. (Granzin and Olsen, 1991) This means that local subsidiaries can be more successful
than multinational power organizations, for green power. The marketing messages should
be targeted to the most suitable social norms. (Ottman, 1993)
3 1 Öre = 0, 00127269 US $
4 Kilo Watt per Hour

International Marketing Mälardalens University
50
Here is the graphical representation of the data about the Swedish market energy trends
and consumption from Schipper’s report:
(L. Schipper, 1993)
(L. Schipper, 1993)
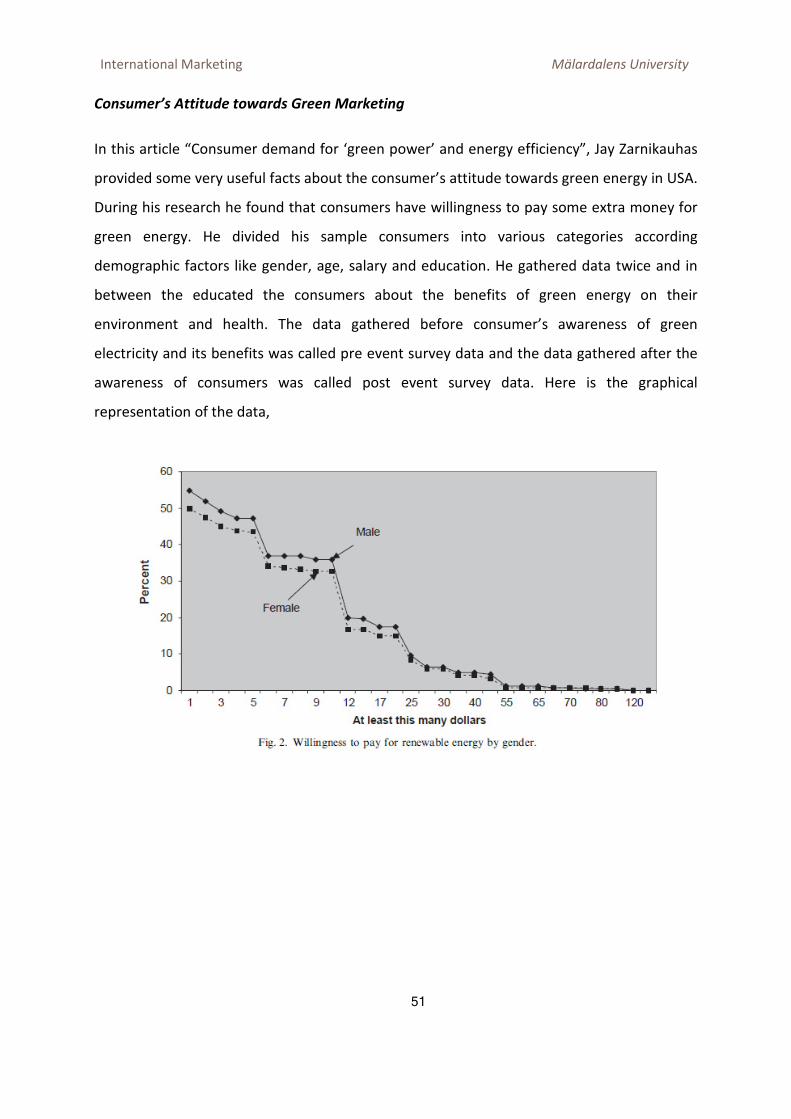
International Marketing Mälardalens University
51
Consumer’s Attitude towards Green Marketing
In this article “Consumer demand for ‘green power’ and energy efficiency”, Jay Zarnikauhas
provided some very useful facts about the consumer’s attitude towards green energy in USA.
During his research he found that consumers have willingness to pay some extra money for
green energy. He divided his sample consumers into various categories according
demographic factors like gender, age, salary and education. He gathered data twice and in
between the educated the consumers about the benefits of green energy on their
environment and health. The data gathered before consumer’s awareness of green
electricity and its benefits was called pre event survey data and the data gathered after the
awareness of consumers was called post event survey data. Here is the graphical
representation of the data,

International Marketing Mälardalens University
52
(Zarnikau, 2003)
(Zarnikau, 2003)
(Zarnikau,2003)

International Marketing Mälardalens University
53
From the information presented above, we can see that educating consumers about the
benefits of green electricity can make consumers to pay higher money for green energy.
(Zarnikau, 2003)
However the literature on contingency valuation shows that the actual participation of
consumers may be lower than suggested by the survey results because while answering a
survey question, the consumer may not consider the costs associated with the green
electricity, but he will consider those costs in his actual life. (Wiser R. H., Using contingent
valuation to explore willingness to pay for renewable energy: A comparison of collective and
voluntary payment vehicles, 2006)
14.2. BARRIERS TO GREEN ENERGY PENETRATION
In this article “Barriers to renewable energy penetration; a framework for analysis”, J.P.
Painuly, says that green energy has the potential to provide clean energy with sustainability
to billions of people in developing countries. Although green energy has so much potential
but even then it is unable to penetrate in the developing countries. The barriers in the
penetration of green energy in the developing countries may be categorized as:
Market failure/ Imperfection
These barriers may be due to lack of investments in green energy, lack of information and
awareness, restricted access to technology, lack of competition, missing market
infrastructure and/or high investment requirements.
Market distortions
This barrier category can be defined as Favor (such as subsidies) to conventional energy,
taxes on Green or renewable energy and Trade barriers.
Economic and financial
These barriers may be because the green energy might be economically not feasible or there
might be lack of financial institutions to support green energy.
International Marketing Mälardalens University
54
Institutional
These barriers may be due to Lack of a legal/regulatory framework to support green or
renewable energy, unstable economic environment, lack of involvement of stakeholders in
decision making, lack of R&D culture, lack of private sector and lack of professional
institutions.
Technical
These barriers may be due to lack of standard and codes, lack of skilled persons and/or lack
of entrepreneurs.
Social, cultural and behavioral
These barriers may be due to the lack of acceptance of the green electricity by the society or
the consumers.
Other barriers
Other barriers may be uncertain policies by the government or lack of infrastructure needed
for the production of green electricity. (Painuly, 2000)
14.3. SOME DEFINITIONS
Green Power
“The green power products are generally 100 % renewable energy offerings supplied from
either a mix of several renewable, or a single resource, such as hydro or wind”. (L. Bird,
2002)
Renewable Energy Sources
While “Renewable energy sources refer to hydropower, biomass energy, solar energy, wind
energy, geothermal energy, and ocean energy. The term ’new’ renewable suggests a greater
focus on modern and sustainable forms of renewable energy, in particular: modern biomass
energy, geothermal heat and electricity, small-scale hydropower, low-temperature solar

International Marketing Mälardalens University
55
heat, wind electricity, solar photovoltaic and thermal electricity, and marine energy”.
(Johansson, McCormick, Neij, & Turkenburg, 2004)
14.4. QUESTIONNAIRE
Below is the sample of our questionnaire which we used for our research, even though our
questionnaire was in Swedish to give ease to the Swedish people to fill it but we have
provided both Swedish and English versions so that non Swedish can also understand that
what we have actually asked.
Swedish Version
1. Vilken är din nationalitet? ……………………..
2. Du är: � Man � Kvinna
3. Just nu är du i huvudsak:
� Student � Anställd � Egen företagare � Pensionär � Annat
4. Födelseår: …………………..
5. Vilken kommun bor du i? ………………………..
6. Du bor i : � Hus � Lägenhet
7. I ditt hushåll finns det normalt: ___ vuxna ___ barn
8. Vilket elbolag använder du idag? ………………………..…..
9. Vilket var det huvudsakliga skälet till att du valde din nuvarande leverantör?
� Låga priser � Bra tjänster � Miljövänliga � Det fanns inga andra alternativ tillgängliga
� Andra använder dem � Vet inte � Annat .....................................................
10. Använder du i huvudsak “grön el”? � Ja � Nej
11. ”I allmänhet så tycker jag att min elleverantör är bra och ger ett bra värde för
pengarna”
� Instämmer inte alls � Instämmer delvis � Osäker � Instämmer delvis � Instämmer helt
och hållet � Vet inte
12. “Jag har förtroende för min nuvarande elleverantör”
� Instämmer inte alls � Instämmer delvis � Osäker � Instämmer delvis � Instämmer helt
och hållet � Vet inte
13. “Jag brukar normalt kontrollera min elräkning noga”

International Marketing Mälardalens University
56
� Instämmer inte alls � Instämmer delvis � Osäker � Instämmer delvis � Instämmer helt
och hållet � Vet inte
14. ”Om jag kunde så skulle jag hellre byta till en annan leverantör”
� Instämmer inte alls � Instämmer delvis � Osäker � Instämmer delvis � Instämmer helt
och hållet � Vet inte
15. Jämfört med konkurrenterna tror jag att min elleverantörs priser är:
� Lägre � Samma / Genomsnittliga � Högre � Vet inte
16. För mig så skulle ett byte från min nuvarande leverantör till en ny vara:
___________________________________________________________________________
Instämmer Instämmer Osäker Instämmer Instämmer Vet inte
inte alls delvis inte delvis helt _
* En bra idé � � � � � �
* Klokt � � � � � �
* Obehagligt � � � � � �
* Önskvärt � � � � � �
17. För grön el så är priserna: � Lägre � Samma / genomsnittliga � Högre � Vet inte
18. “Jag tror att många hushåll i min kommun har bytt elleverantör”
� Instämmer inte alls � Instämmer delvis � Osäker � Instämmer delvis � Instämmer helt
och hållet � Vet inte
19. Jag har bytt elleverantör totalt …... gånger.
20. Kan du berätta varför du bytte leverantör? (Om du svarade ”noll” på fråga 19 så kan
du hoppa över denna)
………………………………………………………………………………………………………………
21. Vilken sannolikhet är det att du ska byta från din nuvarande elleverantör till en ny
� Osannolikt � Sannolikt � Inte troligt � Troligt � Inte en chans � Säkert
22. ”Tanken på att få två räkningar – en från elleverantören och en annan för
nätkostnaden – avskräcker mig från att hitta en annan leverantör.”
� Instämmer inte alls � Instämmer delvis � Osäker � Instämmer delvis � Instämmer helt
och hållet � Vet inte
23. Har du fått information angående leverantörer av förnybar energi
International Marketing Mälardalens University
57
� Ja � Osäker � Nej
24. Min nuvarande leverantör tillhandahåller förnybar energi.
� Ja � Osäker � Nej
25. Av vilken anledning skulle du INTE använda en elleverantör som erbjuder grön el?
(Välj de två alternative som du tycker passar bäst)
� Priset är för högt � Det saknas information
� Det tar tid � Jag är nöjd med min nuvarande leverantör � Annat…………………..…………
26. Vad får dig att vilja välja en viss elleverantör?
� De är socialt ansvarstagande � Låga priser � Innovationer � Grönaste produkten
27. Hur mycket extra skulle du vara beredd att betala – per månad – för att få 100%
förnybar el?
…………………kronor / månad
28. Om två bolag har samma priser, vad skulle då få dig att byta från det ena till det
andra?
……………………………………………………….………………………………
29. Hur höga är hushållets totala inkomster per månad?
� Mindre än 10.000 kr � 10.001-20.000 kr � 20.001 – 30.000 kr
� 30.001 – 40.000 kr � 40.001 - 60.000 kr � 60.001 – 80.000 kr
� 80.001 – eller högre
International Marketing Mälardalens University
58
English Version
1. What is your nationality? ……………………..
2. You are: � Male � Female
3. Right now you are mainly:
� Student � Employed � Self-employed � Retired �Other
4. Year of birth: …………………..
5. What town do you live in? ………..
6. You are living in a: � House � Apartment
7. In your household there is typically: ___ Adults ___ Children
8. Which electricity company are you using? ……………..
9. What was the main reason for choosing your current supplier?
� Low prices � God services � Environmentally friendly � No other supplier available �
Other people use them � Don’t know � Other .....................
10. Do you mainly use “green electricity”? � Yes � No
11. “Overall, I consider my electricity supplier to be good and give good value for the
money”
� Strongly disagree � Partly disagree � Do not know � Uncertain � Partly agree �
Strongly agree
12. “I have confidence in my present electricity supplier”
� Strongly disagree � Partly disagree � Do not know � Uncertain � Partly agree �
Strongly agree
13. I usually study the electricity bill carefully
� Strongly disagree � Partly disagree � Do not know � Uncertain � Partly agree �
Strongly agree
14. If I could I would rather change to another supplier

International Marketing Mälardalens University
59
� Strongly disagree � Partly disagree � Do not know � Uncertain � Partly agree �
Strongly agree
15. Compare to its competitors, I believe that my electricity supplier’s prices are:
� Lower � The same/ average � Higher � Don’t know
16. For me, switching from my current electricity supplier to a new one is:
� Strongly disagree � Partly disagree � Do not know � Uncertain � Partly agree �
Strongly agree
a. A good idea � � � � � �
b. Wise � � � � � �
c. Unpleasant � � � � � �
d. Desirable � � � � �
17. For green electricity the prices are:
� Lower � The same/ average � Higher � Don’t know
18. I believe that many other households in my municipality have changed electricity
supplier
� Strongly disagree � Partly disagree � Do not know � Uncertain � Partly agree �
Strongly agree
19. In the past, I switched electricity supplier ... times
Could you specific the reasons why you switched please?
…………………………………………………
20. What is the probability that you would switch from your current electricity supplier to a
new one.
� Unlikely � Likely � Improbable � Probable � No chance � Certain
21. The idea of having to pay two bills – one for the network and one for the electricity –
discourages me from finding another supplier.
� Strongly disagree � Partly disagree � Do not know � Uncertain � Partly agree �
Strongly agree
22. I received information concerning renewable energy suppliers
� Yes � Uncertain � No

International Marketing Mälardalens University
60
23. My current supplier provides renewable electricity:
� Yes � Uncertain � No
24. Why wouldn’t you sign a contract with a supplier providing green energy? (Select the 2
most relevant reasons)
� The price is too high � There is a lack of information � It takes time � I am satisfied
with my actual supplier � Other……………………
25. What makes you want to choose a certain electricity provider?
� Social responsible � Low price � Innovations � Greenest Product
26. How much extra would you be prepared to pay per month to get 100% renewable
energy? ………………… kronor / month
27. If the electricity prices of the companies are same what other factors influence you to
switch the company? ……………………………………
28. What is the normal household income per month?
� Less than 10,000 SEK � 10.001–20,000 SEK � 20,001 – 30,000 SEK � 30,001 – 40,000
SEK � 40,001 - 60.000 SEK � 60,001 – 80,000 SEK � 80,001 – or more