Embed Size (px)
Citation preview
Draft: Not to be quoted
Entry Choice of Indian Multinationals – A Transaction Cost Analysis
Dr. Vinish Kathuria Fulbright Senior Researcher Department of Economics
University of Colorado at Boulder 256 UCB Boulder CO 80309-0256.
Ph. (303) 786-1019, 492-2647 Fax: (303) 492-8960
Email: [email protected]; [email protected].
June 24, 2007
Abstract: The nineties onwards has witnessed strong economic performance and outward FDI from a number of developing countries including India. It is difficult to construe how the factors influencing outward investment from developed countries would explain the behaviour of developing countries multinationals. Under this backdrop, this study contributes to the literature by carrying out the analysis for India, to see a) what determines the choice between joint venture (JV) and wholly-owned subsidiary (WOS) for firms from developing country; and b) whether the factors are different than the one for the developed country foreign firms. The analysis is carried out on a sample of 250 entries (88 WOS and 162 JVs) made by 142 Indian manufacturing firms during 1992 to 1999. The analysis indicates that a number of transaction specific variables explain Indian firms’ outward investment. Size, age and experience influenced entry choice in more developed countries, whereas building of both upstream and downward capabilities is found crucial for firms investing in relatively underdeveloped countries.
Key Words: Foreign Investment, Developing countries multinationals, Transaction cost, India.
Paper submitted for 2nd Annual Conference on ‘Globalization of Chinese and Indian Enterprises’ to be held in October 2007.

Entry Choice of Indian Multinationals – A Transaction Cost Analysis
1. Introduction
A firm’s decision to invest in a foreign country is often a strategic one, where it has to make two sequential choices: a) whether to acquire/buy an existing firm or set up the facility; and if it decides to set-up own facility; b) whether to do it alone by establishing a wholly-owned subsidiary (WOS) or engage a local partner by creating a joint venture (JV) i.e., entry mode choice. These decisions are called strategic because each choice is replete with benefits and risks. Though acquisitions are a fast means of building up a base for production in an alien environment, they are piggy-bagged by post-acquisition failures due to technological mismatch, lack of knowledge of the new market and differences in cultures1 etc. (Dikova and Witteloostuijn, 2004), apart from the assets valuation problems before acquisition (Harzing, 2002). On the other hand, Greenfield investments provide a great deal of flexibility and choice with regard to location, plant size etc. and even allows the firm to keep its trade secrets to itself, besides facilitating propagating corporate cultures abroad. On the flip side, they often have the longest gestation period, besides increasing the firm’s investment risk (Brouthers and Brouthers, 2000) in the form of exposure to currency fluctuations (Davidson, 1982), political and economic stability in the country (Anderson and Gatignon, 1986). JVs though facilitate investors to draw on the experience, and resources of local partner that minimizes risks, but are often replete with challenges as the local partner has different capabilities, interests and goals (Dikova and Witteloostuijn, 2004) and sometimes opportunism behaviour (Hennart, 1991; Gomes-Casseres, 1989). Moreover, like any other partnership concern, in JVs there is the risk of the partners' interests changing over time2 (Chang and Rosenzweig, 2001). Thus, each mode has its benefits and challenges.
There exist a plethora of studies that have investigated factors that might influence the choice for different entry modes. See, for example, Brouthers and Brouthers (2000), Arora and Fosfuri (2000), Benito (1996), Erramilli and Rao (1993), Kim and Hwang (1992), Agarwal and Ramaswami (1992), Hennart (1991), Hill et al. (1990), Kogut and Singh (1988), Anderson and Gatignon (1986), Caves (1982), among others. The studies can be divided in two broad strands. Group one, which has focused on entry choice between two alternatives: licensing, and WOS with JV forming an intermediary.3 These studies are primarily based on two theories of foreign investment - transaction cost, where the motivation of the foreign firm is to reduce the cost of doing business, or alternatively, there is Ownership-Location-Internationalization (OLI) framework that guides the decision to expand in foreign markets.
The second group has looked into when an equity mode of entry is chosen, the foreign firm whether acquires an existing local firm or sets up a completely new plant. A significant number of studies have investigated factors that might influence this choice using mainly transaction cost theory as the basis for the choice (see, for instance, Brouthers and Brouthers, 2000; Barkema and Vermeulen, 1998; Hennart et al., 1995; Padmanabhan and Cho, 1995; Cho and Padmanabhan, 1995; Anderson and Svensson, 1994; Hennart and Park, 1993; Kogut and Singh, 1988; Caves and Mehra, 1986; Wilson, 1980 among others).
A major limitation with this literature is that they have looked the choice of a firm to enter into a developed country having its origin in another developed country namely US, Japan or Europe.4 The nineties has witnessed rise of foreign firms from developing countries too. How relevant would the same 1 The studies indicate that merger and acquisition (M&A) failure rate ranges from 50-70% (Source: http://www.refr esher.com/!darveau.html accessed November 2006). The classic acquisitions that failed to achieve promised growth and profitability are Daimler Benz acquiring Chrysler, Conseco and Greentree Financial, AOL and Time Werner and Hewlett-Packard acquiring Compaq Computer Corporation (Source: www.businessweek.com/magazin e/content/05_08/b3921038_mz011.htm accessed November 2006). 2 In the Indian context a number of foreign firms that started as JVs now work independently as WOS. The notable examples include Mahindra-Ford (now Ford India), Kirloskar-Toyota (now Toyota India), TVS-Suzuki (now Suzuki India) etc. 3 Few studies have specifically focused on the choice between JV and WOS (see for example, Chen and Hennart, 2002; Makino and Neupert, 2000; Buckley and Casson, 1998; Hennart and Larimo, 1998; Hennart 1991; Gomes-Casseres, 1989 among others). 4 Only recently the focus has expanded to newly industrialized economies (NIEs) like Taiwan, Singapore etc. See for instance, Makino et al., (2002) for Taiwanese firms’ entry choice.
1
factors that explain the choice of a developed country multinational firm would be anybody’s guess?5 Moreover, for these foreign firms since the host and home countries were almost at the comparative level of development, the entry choice primarily became a feature of two kinds of factors: a) overall technological intensity of the sector (i.e., industry specific factor); and b) relative technological advantage of firms (i.e., firm specific factor) (Anand and Delios, 2002). However, when firms from developing countries plan to invest, they can enter in either types of countries – countries with less relative development or countries at much higher level of development. Consequently, the entry choice would differ. In that case, the choice is governed a great deal by country-specific factors, since countries less developed than the home country would not offer any significant advantage in terms of learning or seeking new assets.
This study, thus, contributes to the literature by carrying out the analysis for a growing developing country, namely India, to see a) what determines the choice between JV and WOS for firms from developing country; and b) whether the factors are different from the one for the developed country foreign firms. In this context, it is important to mention that nearly two decades ago few studies were carried out that investigated why foreign direct investment (FDI) occurs from developing or NIEs. The focus of these studies was on FDI to downstream countries i.e., to other developing or NIEs (see for example, Lall, 1983; Wells, 1983, 1977; Kumar and McLeod, 1981 etc.). From the late 1990s, efforts have been made to see the factors influencing choice of entry mode from NIEs (Chen and Chen, 1998; Makino et al., 2002 among others), but to the best of our knowledge, there exist no study looking into the entry choice of firms from big developing countries like India (and/or China) to upstream countries.
The choice of India is important, as the country embarked on a liberalization policy in 1991 resulting in a number of key policy changes. These changes were primarily aimed at enhancing the contestability of Indian industry through their ability to withstand foreign competition both from imports and FDI (Kathuria, 2002). A manifestation of the increased contestability is the increased ability of Indian firms to invest outside India and capture markets6 – a ‘push’ factor.7 Data shows that India’s outward FDI flow, which averaged around 22 US million dollars during the period 1985-95, has increased substantially in next 10 years reaching a peak of 2,222 US million dollars in 2004 (Table 1). Apart from this, in 2003 and 2004, India was ranked 14th in the stock of outward investment in the list of the top 15 developing economies. Interestingly, India’s outward FDI growth is the highest among these 15 countries for the period 2000 to 2004 and second highest for the period 1990 to 2004 (Table A1, Appendix 1).
The organization of the remaining paper is as follows: Section 2 deals with the theoretical background of the study and provides theories explaining entry mode choice of firms. Section 3 formulates the hypotheses to be tested, while Section 4 deals with the data and methodology. Section 5 provides the results. Section 6 compares the results with that of other studies carried out for developed countries and paper concludes with Section 7.
5 Erramilli (1996) based on his analysis has concluded that an investing firm’s nationality significantly impacts its ownership level. 6 To give few examples, Ranbaxy is the 9th largest generics company in the world and 76% of its revenue comes from overseas. Dr Reddy's Laboratories became the 1st Asia Pacific pharmaceutical company outside Japan to list on the NYSE in 2001. Asian Paints is among the 10 largest decorative paints makers in the world and has production facilities across 24 countries. Bharat Forge is the world's 2nd largest forgings maker and only 31% of its turnover is from India. Essel Propack is the world's largest manufacturer of lamitubes - tubes required to package toothpaste. It has 17 plants spread across 11 countries and the company commands a 30% of the 12.8 billion-units global tubes market (Source: http://www.ibef.org/artdispview.aspx?art_id=4218&cat_id=387&page=1 accessed March 2005). 7 There are ‘pull factors’ also influencing this outward investment. For example, the rising wealth in some of the East Asian countries has increased the supply of capital, and capital account convertibility in these countries has acted as a pull to the investment from India and other developing countries (Aykut and Ratha, 2004: 168).
2

2. Choice of Entry Modes - Background
The OLI (ownership–location-internalization) framework or the ‘eclectic paradigm’ given by Dunning (2000), explains what makes a firm more outward oriented.8 However, several theories exist explaining the choice of entry mode of firms (refer Andersen, 1997 for a brief summary). The behavioural theory of firm, given by Cyert and March (1963) through its underlying assumption that firms stay close to their past practices and routines, explain that the process of internationalization is gradual and sequential only. In this sequential learning, the U-model (Uppsala) of internationalization of firm emphasizes that: (a) firms move to distant countries only after having established themselves in markets that are closer to home and the experience gained at home is of no significance in foreign markets (Kogut and Singh, 1988); and (b) the more the knowledge gained about a particular market, the more will be the commitments made in terms of ownership of the establishment (Arora and Fosfuri, 2000) starting from exports to setting up of production facility.
The ‘resource-based view of the firm’ given by Wernerfelt (1984) argues that the heterogeneity in the choice of entry mode is a result of interplay between a firm’s endowment of complementary capabilities. According to this view, there are two kinds of capabilities. Downstream capabilities like marketing, distribution and country-specific institutional expertise are imperfectly mobile (or geographically non-fungible) across countries, whereas upstream capabilities like R&D activities or intangible technology advantages are mobile (i.e., geographically fungible) (Anand and Delios, 2002). The cross border M&A (or JVs) are driven by the complementarities between internationally mobile and non-mobile capabilities (ibid.).
Another approach that explains choice of entry mode is the 'syncretic theory' developed by Hill et al. (1990) and Contractor (1990). The approach emphasizes that different entry modes provide different levels of ownership commitments, degrees of control and risk (Arora and Fosfuri, 2000). For example, licensing of technology would be low risk, low ownership and at the same time, would offer a low degree of control. On the other hand, WOS and acquisitions are high risk but offer a high degree of control. The approach suggests that there are strategic variables, environmental variables and transaction specific variables which form the decision making process of entry mode.
Transaction cost theory given by Williamson (1979) and formalized by Anderson and Gatignon (1986) and Hennart (1988) for entry choice posits that the choice between full ownership and partial ownership (i.e., WOS vs. JV) will depend on the costs and benefits of sharing ownership relative to that of full ownership, under conditions of considerable risk and uncertainty. According to this view, JV is preferred over WOS when the investing firm requires complementary assets or intermediate inputs (such as industry specific knowledge, market familiarity, access to technology, distribution network and natural resources), which if procured from the market entail high transaction costs or would be difficult to replicate or acquire (Hennart, 1991; Makino and Neupert, 2000).
Building on transaction cost theory of entry choice, Hennart (1991) in his study for Japanese investment in US has identified several key variables. The study argues that the need for JV will be strong in the following four cases: when parent firm i) has little local experience; ii) needs access to local resources; iii) diversifies into a new industry; or iv) enters a high growth industry. On the contrary, firms which need to transfer large amount of tacit knowledge, or which differentiate their products through advertising will prefer going for WOS, as the transfer of knowledge and brands are subject to free-riding by the partner (Anderson and Gatignon, 1986; Hennart, 1991).
Though studies, in general, have found support for transaction cost explanation for the entry choice between JV and WOS (see for example, Gomes-Casseres, 1989; Hennart, 1991; Buckley and Casson, 1998; Hennart and Larimo, 1998; Makino and Neupert, 2000 etc.), there are few studies that have emphasized the importance of the non-transaction cost factors also such as host government restrictions, host country risk and uncertainty, and strategic factors (Hill et al., 1990; Kim and Hwang, 1992 etc.).
8 According to this framework there are three reasons why a firm would carry out operations abroad - ownership (O) or comparative advantages such as proprietary knowledge, access to finance etc., the locational factors (L) when certain locations are more endowed with particular resource than others and the Internalization theory (I) which stems from the ‘Transaction cost theory’ states that if the net benefits from internalizing cross border intermediate product markets are high, the more likely the firm is to carry out operations abroad.
3
Studies by Erramili (1996), Shane (1994) while not finding support for transaction cost theory, have concluded that the choice is nationality specific, where the role of nationality is more significant than the cultural distance. Interestingly, the conclusion of these studies have been refuted by Makino and Neupert, (2000), Hennart and Larimo (1998) etc. which have found cultural distance - influencing the entry-choice through transaction cost explanation - a far more potent factor than nationality. The present study contributes additional evidence on the role of transaction costs on entry choice of firms from developing countries.
3. Model and Hypothesis
In order to verify the transaction cost theory for Indian multinationals, a probit model has been employed. While formulating the model and choosing the appropriate variables, the study mainly builds on Hennart (1988) and partly on Anderson and Gatignon (1986). Since most previous studies have been done for developed countries, and that too for entry into one country, some of the variables need to be modified in the context of India. This is because investment by firms from the developed countries is in countries that are either at the comparative level of development or in countries with much lower development level. However, Indian firms have invested in both categories of countries – the more developed (upstream investment) and the countries below India’s level of development (downstream investment). This upstream and downstream investment implies that the choice is governed not only by exploitation of existing capabilities but also desire to enhance capabilities (Madhok, 1997).
3.1 Model
Since the nature of the choice for firm is discrete, i.e, it is an “either-or” choice, a model which allows the use of a discrete dependent variable has to be used. Probit model is a non-linear statistical model that achieves the objective of relating the choice probability to explanatory factors in such a way that the probability remains in the [0,1] interval.
The dependent variable in Probit model is binary, which takes the value 1 if the firm opts for WOS mode and 0 otherwise. The explanatory variables are continuous variables which affect the choice of the firm. The coefficients of these variables will give the direction of the relationship between the probability and that variable (for example, the sign of the coefficient of ‘Foreign Experience’ will tell us whether previous experience in investing abroad facilitates WOS choice or JV choice). However, the coefficient is not directly interpretable as the effect of a change in an explanatory variable on the mean of the dependent variable. The marginal effect of a variable is different from the coefficient in the probit model and is given by the product of the coefficient and the probability density function (pdf) (Greene, 2003). Since the pdf is always positive, the direction of the marginal effects is same as that of the coefficient.
Thus, the model is represented as follows:
MODE = α + βi xik+ u;
where α and βi are unknown parameters and u is the residual. MODE is unobserved latent variable and is defined as: MODE = 1 if firm prefers WOS; and 0 otherwise.
The discussion in previous section indicates that entry choice depends on three categories of factors – two related to transaction cost (gain and cost from sharing equity) and a third factor unrelated to the transaction cost.9 The same factors have been used to choose variables affecting entry choice of Indian firms.
3.2 Gains from JV
Hennart (1991) argues that the JV will be preferred: when investing firm i) has little local experience; ii) need access to local resources; iii) diversifies into a new industry; and iv) enters a high growth industry.
9 In the terminology of Anderson and Gatignon (1986), the entry mode choice can be divided into four categories: a) transaction specific assets (including R&D and human capital investments specific to the use, nature of industry etc.); b) external uncertainty (exemplified by country risk and transaction specific assets); c) internal uncertainty (caused by less foreign experience, cultural distance etc.); and d) free riding potential (mainly for Advertising intensive industries).
4
Apart from these there are internal uncertainty factors that indicate the choice in favour of JVs such as cultural distance between home country (i.e., India) and the host country etc. (Anderson and Gatignon, 1986).
Foreign Experience (Forexp) The process of entering in a foreign country is by nature a dynamic process (Johanson and Vahlne, 1977) and the knowledge that a firm has of the global economy could affect the choice of entry mode (Harzing, 2002). A firm with more experience in international investments would be more knowledgeable about foreign culture, institutional characteristics and other site-specificities (Hennart, 1991; Arora and Fosfuri, 2000). On the other hand, first time investors may fear the unknown and consequently overstate risks and understate returns of international markets (Davidson, 1980).10 Thus, an experienced firm would more likely to exploit every possible feature of the host economy and therefore would look for a high degree of flexibility and freedom in management. On the other hand, a firm without significant foreign experience may first need to acquire the capabilities, and consequently its purchase is subject to high transaction costs. Thus to deal with the local environment, firm may prefer JVs (or acquisitions) (Hennart, 1991; Wilson, 1980). The only argument where first time investors may opt for WOS is due to their ethnocentric orientation (Anderson and Gatignon, 1986). The ethnocentricity may induce investors to demand to have their own nationals in key positions, which is easier to achieve via full ownership (Weichmann and Pringle, 1979). The literature in general has supported the role of experience in setting up of WOS. The only study that has found a decreased reliance on WOS with increase in foreign experience is by Davidson and McFetridge (1985). Thus, Indian firms are more likely to invest in JV when they have no or limited prior foreign experience.
Access to Local Resources (Resour) In natural resource industries, the local firms have a first mover advantages as they benefit from government policies that often reserve them for locals, thus get differential rents (Gomes-Casseres, 1989; Hennart, 1991). Moreover, government policies / restrictions often discourage or prohibit full ownership in these industries by foreign firms and it is costly for a foreign firm to circumvent these policies. Thus, one would expect a greater propensity to JV in resource intensive industries.
Diversification into other industry (Diver) Diversification has two aspects: a firm entering into an unrelated industry or entry by a firm, which is already diversified. In both cases, the firm would have less specialized knowledge of the product in question and therefore entry will be through the JV mode (Chang and Rosenzweig, 2001). From transaction-cost point of view, diversification in new industry makes it difficult as well as costly for the foreign firm to acquire product-specific knowledge or access to distribution etc. through contract or replication, which can be more efficiently obtained through JV (Hennart, 1991). On the other hand, a focused firm would try to exploit its knowledge of the product and thereby invest in a WOS. Dikova and Witteloostuijn (2004), Arora and Fosfuri (2002), Chang and Rosenzweig (2001), Contractor and Kundu (1998), Hennart (1991), Gatignon and Anderson (1988), Davidson (1983), among others have in general found that entry with a new line of business is more likely to be in the form of a JV or acquisition rather than a WOS. Indian firms, thus are more likely to invest in JV if they are already diversified or diversifying into newer areas.
Cultural / Geographical distance / Regional Preferences (Region) While making the investment decision, a firm often considers factors such as the geographical distance and the relative advantages of the host country. Apart from geographical distance, the cultural distance also plays a key role in influencing the decision (Mayrhofer, 2004; Chang and Rosenzweig, 2001; Makino and Neupert, 2000). The distance not only introduces the possibility of friction in the management of the firm (Harzing, 2002), but also enhances uncertainty (Anderson and Gatignon, 1986; Kogut and Singh, 1988) and creates high information costs (Root, 1983), which firms try to avoid by turning management over to JVs. Moreover, familiarity with a country reduces the (perceived) benefits of
10 It is to be noted that this experiential learning does not reduce the cultural distance between home and host country, but certainly augments the firm’s experience in operating business in a foreign market (Root, 1987).
5

a JV from transaction cost point of view (Gomes-Casseres, 1989).11 Thus, a country/region located closer (geographically and culturally) to India may be favoured for WOS, because of easy administration, less uncertainty and low information costs. In fact, U-model explicitly postulates that the relationship between the familiarity with the rules, norms and values of the foreign market would be positive with that of the resource commitment (Johanson and Vahlne, 1977). The evidence of the role of cultural distance in influencing investment decision is fairly mixed. Hennart and Larimo (1998) in their comparative study of Japanese and Finnish investment in US and Arora and Fosfuri (2000) for Chemical plants found that JVs are the preferred norm with increased cultural distance.12 On the other hand, Kim and Daniels (1991) and Contractor and Kundu (1998) using data on hotel industry found no effect of cultural distance on investment decision. Since the South Asian and African13 regions are geographically and culturally close, the Indian firms may prefer having a WOS in these regions. This implies that Indian firms are more likely to invest in WOS if they are investing in regions which are nearer both geographically and culturally. 3.3 Costs of sharing Equity There are four main factors that increase the costs of setting up JV: a) when firms need to transfer large amount of tacit knowledge, or b) firms using advertising to differentiate their products. Both the cases - the transfer of knowledge and brands - are subject to free-riding by the partner and hence induces firm to go for WOS (Hennart, 1991). The technological intensity of the industry and the level of the development of the host country also affect the cost of sharing equity, thus dictating the entry choice.
Technological Advantage of the Firm (RND) The exchange of knowledge from parent to subsidiary or JV partner entails some transaction costs. These costs increase if the transferred technology is tacit and transferred to firms in a poorly protected intellectual property regime. The situation is compounded because tacitness makes the pricing of technology difficult (Anderson and Gatignon, 1986) and preventing its leakage beyond JV partner is hard (Hladik, 1985). Moreover, a firm’s need for complementary technological know-how varies indirectly with its R&D intensity (Ferguson, 1981). Apart from this, when competitive advantage is built on superior application of technology, the preference would be for green field venture (Brouthers and Brouthers, 2000). This implies a firm having high R&D intensity would have low propensity to JV. According to Anand and Delios (2002), technology know-how of a firm (called the upstream capabilities) being fungible, a firm having higher technological advantage can exploit it through WOS rather than a JV. The relation however may not be universally applicable. This is because despite having high R&D intensity, a developing country firm’s investment in a highly developed region such as Europe or U.S. may have nothing much to exploit, rather the firm may have more to learn through JV. Since firms from India have invested in both kinds of countries, investment in technologically advanced countries will facilitate them to acquire complementary assets, hence to go for JVs whereas in less developed countries Indian firms may be in a better position to exploit their technological advantages and hence may prefer WOS (Arora and Fosfuri, 2000).
Technological Intensity of the Industry (Ind) The choice of entry mode is also influenced by the technology intensity of the sector. Kogut and Gander (1993) have pointed out that market based transactions in technology are more likely to occur when technologies are more codified and easier to transfer across firms. Teece (1977) and Balakrishnan and Koza (1993) have shown that the cost of transferring technology to other industries were lower for mature and standardized technologies, resulting in reduced asymmetric information and less opportunities for opportunistic behaviour. This implies that firms belonging to industries with complex and more proprietary knowledge would prefer going for WOS. On the other hand, for an industry having high asset 11 It is to be noted that the familiarity need not be confounded with ‘development’. A country like Nepal may not be highly developed, but its closeness with India motivates local firms to invest in WOS. 12 The study however argues that in part cultural distance can be proxied by geographical distance and common language (Arora and Fosfuri, 2000: 568). 13 The culturally closeness with Africa for WOS is dictated by old historical ties. This is because a number of African countries like South Africa, Kenya, Mauritius etc. are the former British colonies similar to India and trade including the slave trade from India to these countries was not uncommon. After their independence, the people migrated to these countries may have been instrumental in renewing ties with their families in India by seeking investment.
6
specificity, the risk involved in investing abroad may be diluted by engaging in a JV. Thus, which of the factors dominate would determine entry choice. Though transaction cost explanation does not predict the relation, but the resource view of the firm is unequivocal in suggesting the role of technology intensity. According to this view, for firms from developing countries, irrespective of their technological intensity, the investment in less developed countries would be of ‘asset exploitation’ and firms would prefer WOS, whereas in more developed countries, for complex and higher level of technology, it would be of ‘asset seeking’ type and preference would be for JVs. If firms are classified into three categories based on the level of technology employed – high-tech, medium-tech and low-tech firms, one can hypothesize that Indian firms irrespective of the technology intensity of the industry would be opting for WOS if the host country is at the same or lower level of development than India. On the other hand, investment by a firm belonging to high tech industry would be through JV if the host country is at higher level of development than India.
Brand Equity (Advint) Transaction cost theory suggests that firms that differentiate their products through advertising prefer to seek full ownership (Hennart, 1991). This is because a company’s image and reputation will be a public good to the other firm in the JV. Thus, ceteris paribus, when the potential for free riding is high, entry modes offering high control i.e., WOS is more efficient (Hennart, 1991; Anderson and Gatignon, 1986). However, this is more relevant for firms in developed countries. For Indian firms investing outside, their brand will be relatively unknown and image may be of less value across the borders, especially if the investment is in more developed countries. Since these downstream capabilities would take time to build on (i.e., are less geographically fungible) in developed countries, they induce entry by acquiring (or JV) (Anand and Delios, 2002). For the present study, we hypothesize that the brand or advertising have important role when firms invest in relatively less developed countries, hence would go for WOS.
Host Country Index (Countindx) As mentioned, investment by Indian firms is in both categories of countries – more developed and less developed than India. This level of development of the host country can be in terms of legal framework, infrastructure, tariff etc., which would determine the choice of entry mode. In the event of the country development index being high (low), a firm would be willing to make more (less) financial commitments through WOS (JV) since this would indicate more (less) room for patenting, having better infrastructure, free trade flows and so on. On the other hand, ‘resource view of firm’ suggests that a positive (negative) differential index between host and India means firm’s investment would be of asset seeking (exploiting) type, hence JV (WOS) would be the preferred mode. Moreover, increased economic development raises the experience and sophistication of local firms, which can contribute more to the investing firm, thus increases the attractiveness for JV (Gomes-Casseres, 1989). Thus it is difficult to hypothesize which of these impacts would be more. Chang and Rosenzweig (2001) however find that greater comparative advantage over host country firms leads to greenfield investment.
3.4 Other factors
Apart from these, there are non-transaction specific factors also like size, age, type of the firm etc. that would influence entry choice.
Size of the Firm (Size) The size of the firm is an indicator of its financial position (Arora and Fosfuri, 2000). The smaller the firm, the lesser would be the expected capacity to invest and bear risk, hence more affinity towards setting up of a JV (Hennart, 1991). Smaller firms are also likely to have less knowledge of the markets, of products and so on, as they have less ability to research these areas. Controlling for industry heterogeneity, the size of the firm also indicates its success over its competitors in the domestic market and the likelihood of it possessing a comparative advantage over the competition abroad. Thus, Indian firms are more likely to invest in JV if they are small in size.
Age of the Firm (Age) The effect of ‘Age’ on the choice of entry mode can be hypothesized in two ways. On the one hand, older firms by virtue of their experience can venture into new territories and bear the risks that go with these investments, thus leading to a WOS mode of entry. On the contrary, older firms may be more conservative and therefore may not be willing to engage in large investments abroad, thus may prefer
7
JVs. Conversely, younger firms despite being more adventurous and willing to seek profits outside the home turf may not have the financial resources or the experience to make large risky investments outside India. Thus it is difficult to indicate the precise impact of Age on the entry choice.
Firm Type (Frmtyp) The financial backing that a firm has could also play a role in determining entry mode. Firms, which have the backing of a financially strong (weak) ‘group’ may perceive the risk differently than independent companies. In such a situation, a group company may have propensity to invest in a WOS (JV). On the other hand, an independent firm may be resource constraint, thereby forcing it to go for JV. Alternatively, a stand-alone company would have more flexibility (i.e., the ability to change systems and methods quickly and at a low cost) than the group company, which is bound by group philosophy and culture. Since WOS provides more flexibility than the JV (Anderson and Gatignon, 1986), standalone firms may prefer WOS to continue to have flexibility. Thus it is difficult to hypothesize the precise impact of Firm type on the propensity to go for WOS.
Industry Concentration (Conc) The concentration of the industry of entry in the host country could also affect the choice of entry mode. The higher the degree of concentration, the entry will have greater impact on existing firms, and the greater the probability that they will retaliate against investors (Hennart, 1991). Thus, high concentrated industry may induce entry through JV. Since many of the studies were focused on a single host industry and with respect to few countries (see for example, Arora and Fosfuri, 2000; Anand and Delios 2002 etc.), or single country but many industries (see for instance, Hennart, 1991 etc.), they could easily control for this. Since the present study deals with investments in several industries and in several countries, we could not account for this. For the same reason, we could not include the ‘growth of industry’ as an indicator that militates against the choice for WOS (Hennart, 1991).
4. Data and Methodology 4.1 Data Collection and Cleaning The first task in carrying out the analysis is compilation of all the firms that have invested abroad in recent past. A list of firms investing outside India (i.e. Indian MNCs) since 1992 was compiled14 using yearly publications of the Indian Investment Centre (IIC), an outfit of Ministry of Industry of Government of India.15 The publication provides the names of the Indian firms along with the date of entry, the field of operation that the firm has invested in, and the host country. The host countries are grouped into seven major regions of the world viz. Africa, America, East Asia, Europe, Oceania, South Asia and West Asia.
The publication is available only up to the year 1999.16 The non-availability of investment data prior to 1992 forced the period of analysis to be restricted to 1992-1999 comprising of approximately 2000 investments. Since only after the 1991 liberalization process Indian firms began investing abroad in a big way, the period is quite appropriate. In the first step, the non-manufacturing sector firms are excluded as their behaviour and the determinants of entry choice would be very different.17 This reduced the sample size to 655 entries. Unfortunately, a significant proportion of these 655 entries are private sector firms, which are not listed in any stock exchange. These private sector firms had to be eliminated from the sample, as the data on these firms is not accessible. Similarly, government controlled enterprises had to 14 An attempt was also made to analyze the investments of the largest 500 Indian companies with respect to size and market capitalization as enumerated by a weekly magazine ‘Business Today’ i.e., BT 500. Surprisingly, the list revealed that there are very few companies in BT 500 that have invested abroad during this period. This implies that the top Indian companies are not necessarily the ones that invest outside. 15 The publication is called ‘Indian Joint Ventures and Wholly Owned Subsidiaries Abroad Approved during the Year.’ 16 Unfortunately, IIC has stopped publishing data after 1999 and recently, the Ministry has disbanded the centre. 17 Many a times, it is easy to enter a foreign country in service sector than in manufacturing due to myriad clearances required from environment, industry, commerce departments etc. before production can commence. Moreover, since most previous studies have carried out analysis for manufacturing firms only, this would make the comparison more appropriate.
8
be dropped since the motivation of these enterprises is not always maximization of profit. Besides the government or public sector enterprises have the financial backing of the government and would therefore be in a better position to bear much larger risks. All these truncations resulted in the final sample consisting of 250 entries18 made by 142 firms during the period 1992-99. Of these 250 entries, 162 (i.e., ≈ 65%) were in the form of JVs and remaining 88 (i.e., 35%) were WOS.
4.2 Data Characteristics Tables 2 and 3 illustrate the profile of the data set. It is clear from Table 2 that a large number of firms (94 firms) (i.e., ≈ 66%) are first time investors and only 34% of the firms (i.e., 48 firms) had prior foreign experience. Of these 48 firms having multiple entries, seven firms had five or more entries during the period. Further, these 142 firms entered in 49 countries in these 7 years. Seven countries namely, US (28), UK (26), Nepal (19), Mauritius (18), Malaysia (14), Sri Lanka (11) and UAE (10) have received more than 50% of entries during the period.19
From Table 3, we can see that 26% of the firms in low-technology sector have nearly 28% of the total entry (i.e., 37 firms have 71 entries), whereas a little over 13% of the high tech firms (i.e., 19 firms) have nearly 26% (i.e., 66) of the entry. Pharmaceuticals, textiles, engineering, electrical and electronic equipment are the top five sectors from where Indian MNCs have invested abroad.
4.3 Variable Construction The dependent variable in the model is a binomial variable and it takes the value 1 in the event of a WOS being the preferred mode of entry and the value 0 in the event of entry mode being a JV.
4.3.1 Independent variables Table 4 gives the variables and their definition with expected sign. The table also gives the sign as predicted in other studies for foreign firms’ investment from developed countries. It can be seen that for some of the variables like R&D intensity or Advertising Intensity, the expected sign depends on the nature of the host country, unlike for developed country firms where one can predict for sure.
Studies like Harzing (2002) have defined experience as the number of years passed since the firm established its first foreign subsidiary. However, this requires knowing investment history of the firm, which unfortunately we do not have. In absence, we have measured the foreign experience (FOREXP) of a firm as the number of investments made abroad prior to the entry in question during the period of analysis. The diversity (DIVER) of the firm is assessed using two measures. First measure uses the sales turnover of the top three most revenue earning products of the firm. However, the effect of the variable seems more pronounced when included as a dummy i.e. a value of ‘1’ is attached if the most revenue earning product of the firm accounts for less than 50% of the total sales turnover (indicating that the firm’s earnings are through a diverse product line) and if not, the value ‘0’ is attached. Following Hennart (1991) and Gomes-Casseres (1989), a dummy variable is created to proxy for the investing firm’s need to access natural resource (RESOUR). The dummy is equal to 1 if the foreign firm’s entry is in a resource intensive industry i.e., food and beverages, rubber, pulp and paper, cement, glass, leather, tobacco, textile, primary metals etc.
As hypothesized country/region located closer and having historical ties to India may be favoured for WOS, because of easy administration facilitated by cultural proximity. The present study tests for this region-specific impact using a dummy for each of the seven regions (REGION_Dummy) namely, Africa, America, Europe, East Asia, West Asia, South Asia and Oceania.
The technological advantage of a firm is often measured through its R & D intensity (i.e., the ratio of R & D expenditure to the total sales turnover of the firm, R&DINT). Since the R&D expenditure of a firm may include investment in capital equipment at times, which will lead to surges in the expenditure in certain years, the average R&D intensity for three years before entry is used to smoothen the surges. Unfortunately, as in India the Company Law does not make it mandatory for a firm to report R&D expenditure if it is below 1% of sales turnover, some of the firms though engaged in R&D may not report
18 One firm, which had an unusually high Advertising intensity (47.62%), which is more than five times the next firm, had to be omitted being an outlier. 19 Figure in parenthesis are the number of entries in these countries by Indian firms.
9

these figures. In order to reduce the bias, an additional indicator (RND) is constructed which is a dummy that takes the value ‘1’ if it fulfills either of the two conditions: a) the firm either has a Ministry of Science and Technology (MoST) recognized in-house R&D unit,20 or b) it reports some R&D expenditure; and ‘0’ otherwise.21
The study also hypothesizes that firms in the low (LOW-tech), medium technology (MEDIUM-tech) and high technology (HIGH-tech) would be going for JVs (WOS) when they are investing in more (less) developed countries. The classification, as used in the study is the one given by the MoST based on the R&D intensities of different industries. A dummy for a firm falling in either of these three industries – low, medium and high tech, and 0 otherwise has been used to capture the technological opportunities varying over industries.
Advertising intensity (ADVINT) (average of three years before entry) has been taken as a variable reflecting the brand building in the home country. The choice of entry mode depends on the level of development of the host country in terms of legal framework, infrastructure, tariff etc. Studies like Arora and Fosfuri (2000) have tried to control for some of these variables separately. Since those aspects are highly varied, a better way to assess the development of a country is through an index (COUNTINDX). The host country index published by the ‘Economic Freedom Network’ at www.freetheworld.com is a composite of indices on various aspects of a country such as government (government spending, share in consumption, investment, size of the government, judiciary, politics etc.), legal systems (property rights, law and order), state of the economy and openness (GDP, inflation, interest rate, trade barriers, tariffs, labour market analysis) etc. This index ranges from 0 to 10. The index available to the year closest to the year of entry has been used for the analysis.22
4.3.2 Control Variables Average sales turnover of the firm in the preceding three years is used as a proxy for the size of the firm. Since firms belong to different industries having different minimum efficient scale, the size (SIZE) is normalized using log of sales. The age (AGE) of the firm at the time of entry is arrived at by calculating the difference between the year of entry and the year of incorporation of the firm. Type of firm (FIRMTYP) is distinguished by a dummy that takes the value 1 for independent firms and 0 for group companies.
4.4 The Econometric Model and econometric issues The dependent variable being a binomial, the probit model has been selected, with each entry counted as one observation.23 The independent and control variables as hypothesized above are measured at the end of year t-1 to ensure that we measure entry-decision probability prior to the entry decision. In other words, if we use these characteristics influenced by the entry activity, the results will likely be biased. The dependent variable (MODE) takes the value 1 in case of a WOS and 0 in the case of a JV.
MODEijt = β0 + β1FOREXPit-1 + β2RESOURit-1 + β3DIVERit-1 + β4-9REGION_dummy + β10RNDit-1 (or R&DINTit-1) + β11-12INDUSTRYTYPE + β13ADVINTit-1 + β14COUNTINDXk + β15SIZEit-1 + β16AGEit-1 + β17FIRMTYPit-1 + uijkt
20 The MoST has given recognition to the R&D labs of nearly 1000 private sector firms. The recognition in the past conferred them a number of benefits including getting cheaper credit, easier import of technology and tax rebate (Kathuria and Das, 2005). 21 The data shows that of the 128 cases, where the firms have MoST recognized in-house R&D, in nearly 59% cases (i.e., 75 observations) firms have not spent anything on R&D. And for 38 cases the R&D intensity is less than 1%. On the other hand, of the 122 cases, which do not have recognized R&D, in 35 cases, firms have spent some amount on R&D. 22 It is to be noted that some of the country specific variables like Market Size or GDP of the host country has relevance when the choice is between licensing and investment (see for example, Arora and Fosfuri, 2000). This is because the smaller market may induce investing firm to go for licensing and vice versa. 23 Studies analyzing the choice of entry mode have either used probit or logit model. The logit model assumes logistic distribution, whereas the probit model assumes a standard normal distribution. However, there is hardly any difference in the estimations between the two except that logit model has slightly fatter tail (Source: http://www.u.arizona.edu/~bsjones/logitprobit.doc, accessed November 2006).
10
The model is estimated by maximum likelihood (ML) method. Yatchew and Griliches (1984) show that heteroskedastic disturbances in a binary choice model may lead to inconsistent estimates. Greene (1997: 891) indicates that there are three tests - the Largrangian multiplier (LM) test, Likelihood Ratio (LR) test and Wald test specific to the probit model to test the heteroskedasticity of a homoskedastic probit model. Since we have a cross section of firms investing outside India, they differ with respect to size and age, both of which could have introduced heteroskedasticity. For size, use of log of sales instead of sales takes care of the heteroskedasticity partly. However, both LR and Wald test do not reject the null of homoskedastic disturbances with respect to age.24
The models have been run using econometric software STATA 8. Further, the coefficients estimated for the model are not directly interpretable as the effect of a change in an explanatory variable on the mean of the dependent variable. The marginal effect of a variable is different from the coefficient in the probit model and is given by the product of the coefficient and the probability density function (pdf) (Greene, 2003). Since the pdf is always positive, the direction of the marginal effects is same as that of the coefficient.
Descriptive Statistics Table 5 provides some descriptive statistics of the variables for the whole sample of 250 entries. Columns 3 and 4 give these characteristics across the two modes – JV and WOS. From the table, interesting patterns emerge. The average age of the firm (row 1) investing abroad is fairly high; this implies experience plays a key role in deciding to invest in foreign markets. However it is the younger firms which have invested more in WOS (row 1, column 4). A higher country index has induced the firms to go for WOS rather than JVs (row 3). Of the 250 entries, over 50% (i.e., 126) belong to Medium Tech industries (row 12). WOS are slightly higher in low-technology industries (row 11), whereas JVs are more in High technology industries (row 13).
Though, Europe (row 17) is the most preferred destination for Indian MNCs with 67 entries for both JVs and WOS, JVs are mostly preferred in East Asia (row 16), and WOS and JVs are equally preferred in America (row 15). It is interesting to note that South Asia (row 19), despite having the lowest country index (=5.64) received the fourth best investment (i.e., 34 entries) – whether in the form of JV or WOS - from Indian firms. This is because of high familiarity of Indian firms with the region. This supports the transaction costs hypothesis and U-model of internationalization of production that firms first invest in the neighboring countries before going to far-off places. A high investment in Africa (row 14) is again a testimony to the role of old historical ties with the continent.
Rows 4 to 11 indicate that with respect to size (as measured by sales), advertising intensity, entry in diverse product line, R&D, firm type, and resource dependence, there is no statistical difference between the firms investing through JVs or WOS.
5. Results
Columns 2 and 3 of Table 6 give the results of the binomial probit model for the full sample. A positive coefficient implies that the independent variable tends to increase the probability that full ownership will be opted and negative coefficient implies the opposite. Columns 2 and 3 of the Table 7 report the marginal effect for the model. The predicting capacity of the models is discussed with respect to two criteria: a) contingency tables; and b) likelihood ratio index25 and is given in Table 8.
5.1 Analysis for Entire Indian Manufacturing Sector - Model 1 Rows 1 to 14 of the Table give results for the different variables constructed pertaining to the benefits (rows 1 to 9) and costs (rows 10 to 14) of setting JV, vis-à-vis WOS, whereas rows 15 to 17 give results for the control variables influencing Indian firms’ foreign investment. The results partly support our 24 The possible multicollinearity effects among few independent variables were checked by a) correlation coefficient; and b) alternatively dropping variables. However, there was no indication of multicollinearity. 25 Likelihood Ratio Index (LRI) is an analog to R2 in a conventional regression model and is given by LRI = 1 – (ln L/ln Lo), where Lo is the log likelihood computed with only a constant term. LRI is bounded between 0 and 1. If all the slope coefficients are 0, it equals 0 (Greene, 1997: 891). In fact, this is nothing but pseudo-R2 (Wooldridge, 2002).
11

conjecture. All significant variables have the correct sign as hypothesized. Consistent with our hypotheses, the results suggest that the Indian firms prefer WOS over JV when they have sufficient foreign experience (FOREXP), enter in culturally and geographically close regions (e.g., S. Asia and Africa), and invest in low technology sectors (LOW-tech), thus giving support to transaction cost theory. The positive and significant sign for South Asia is also a testimony to U-theory of firm’s investment. Interestingly, the affinity for WOS is high when Indian firms invest in relatively more developed countries (COUNTINDX), indicating that Indian firms are willing to make more financial commitment if the country has more institutions in place. Surprisingly, the diversity (DIVER), resource requirement (RESOUR) and fungibility of intangible assets i.e.., R&D (RND), which are predicted to have influence on the entry choice, do not attain significance. Since RND has not attained significance and given the way it has been constructed, the model is rerun with R&D Intensity (R&DINT) as a variable representing technological intensity (Column 3). The results hardly change.
Among the control variables, SIZE of the firm and its AGE are important contributor to entry choice. The significance and negative coefficient for AGE implies that older Indian firms are more conservative than the newer more adventurous firms, thus prefer JVs. On the other hand, a bigger firm (SIZE) has the greater ability to increase financial commitment abroad, thus preferring WOS. The type of the firm (FIRMTYP) does not seem to have any influence on the entry choice.
As mentioned, the transaction cost explanation works differently for firms when they invest in more developed countries, than their investment in relatively underdeveloped countries. For investment in the countries which are more developed than India, the aim could be to seek some assets from them (‘asset-seeking’ behaviour). On the other hand, behaviour would be ‘asset exploitation’ if countries level of development is below that of India’s. This asset exploitation behaviour is manifested through WOS, whereas asset seeking is manifested through JVs (Anand and Delios, 2002). In fact, one of the reasons for partial explanation of transaction cost theory (i.e., variables like ADVINT, or FIRMTYP or DIVER or RND/R&DINT not attaining significance) in Indian firms’ case could be the fact that the sample contained all the entries irrespective of the extent of development of the host country. Thus analysis is repeated for two groups of the firms separately – firms investing in countries, which are underdeveloped vis-à-vis India and vice versa.
5.2 Impact of country’s development on entry mode – Models 2 and 3 Columns 4 to 7 of Table 6 report the results where the sample is divided in two categories based on the characteristics of the host country. Category 1 is for investment in countries below India’s development (i.e., Models 3 and 4) and category 2 corresponds to countries which are more developed than India (i.e., Models 5 and 6). It is to be noted that models are run separately for both the indicators of technological intensity of the firm – RND and R&DINT. Several hypotheses of transaction cost theory are verified as well as interesting differences emerge for the choice of entry mode across the two groups. The results indicate that for investment in countries with relatively less development, not same transaction cost variables are important as when firms invest in more developed countries.
Foreign experience (FOREXP), diversification (DIVER) nature of Industry (LOW-tech and MEDIUM-tech), technological level of the firm (R&DINT) and brand image (ADVINT) facilitates in reducing transaction cost when firms invest in less developed countries. A positive and significant sign of ADVINT implies that a strong brand is essential, if the firm wishes to carry it over to the host country with relatively less development through a WOS. Similarly, a firm having high technological assets would exploit it through WOS, when it plans to invest in countries with relatively less development. For these countries, Indian firms prefer WOS in both - low-technology and medium-technology sectors, whereas for more developed countries, Indian firms could invest only in low-technology (LOW-tech) sector. Table 7 indicates that the probability of setting up a WOS is 4% higher for a firm that invests on R&D compared to a firm that does not (row 11, column 5). However, the probability is 6-8% higher for a firm that invests on Advertising compared to a firm that does not (row 13, columns 4 and 5, Table 7). Interestingly, the propensity to invest in WOS drops by nearly one-fourth if the firm diversifies (row 3, column 4).
With respect to control variables, SIZE and AGE influence entry choice only when firms invest in more developed countries (columns 6 and 7). Surprisingly, these variables have no such bearing on investment in countries with relatively less development (columns 4 and 5). Thus, level of institutional development
12
of the host country drives investment differently for Indian firms. Interestingly, transaction-cost variable - resource requirement (RESOUR) and control variable – firm type (FIRMTYP) do not influence Indian MNCs investment decision. The probability of setting up a WOS in a developed region is higher by one-tenth for a firm that is bigger in size compared to a smaller firm (row 15, column 7, Table 7).
5.3 Performance of the Model Table 8 shows the prediction of different models estimated above. One of the ways to measure how well the model fits the data is to classify observations (Amemiya, 1981). This ability to classify is then required to be judged against the classification rate that would have been obtained by chance. The chanced classification rate is given by a2 + (1-a2), where a is the proportion of JVs in the sample (Morison, 1974). From rows 5 and 6 of Table 8, it can be easily concluded that the model predicts better than that which could be predicted by chance (i.e., baseline prediction). From the table it can be seen that overall, at least 71% (Model 5) of the cases have been predicted correctly by different models, if we consider RND as a variable explaining technological intensity of the firm. However, this increases to 72% when R&D intensity (R&DINT) is considered (Model 6).
Rows 2 and 4 of the table indicate that models tend to over-predict JVs and slightly under-predict WOS. In other words, the model’s specificity i.e., its capacity to correctly classify JVs is better than the sensitivity rate (i.e., the ability to correctly classify WOS).26
6. Comparison with other studies This section compares the findings of the present study with other studies. Since most other studies have been carried out for foreign firms from developed countries, the comparison may yield the significance of distinctive variables for developing countries. Table 9 compares the sign and significance of different variables. It can be seen that transaction cost explanations are slightly different for developing countries’ firms that invest outside as compared to that of the firms from developed countries.
For firms in developed countries, diversification, resource based entry, possession of intangible assets and brand building affect the transaction cost and hence entry choice. But for Indian firms, regional and cultural proximity and experience are far more powerful predictor of transaction cost theory than these variables. Similarly, nature of host country differently impacts these transaction cost variables in case of India (columns 3 and 4, Table 9). Brand building and technology intensity of the firm play an important role when Indian firms invest in relatively underdeveloped country. For entry into developed regions, non-transaction cost factors such as Size and Age play a key role than many of the transaction specific variables.
7. Discussion Issues governing foreign firms and their entry into host country have been studied extensively in developed countries’ contexts. Interestingly, the nineties and the beginning of this century has witnessed strong economic performance and outward FDI from a number of developing countries. It is difficult to construe how the factors influencing outward investment from developed countries would explain the behaviour of developing countries MNCs. Under this backdrop, this study contributes to the literature by carrying out the analysis for a large developing country, namely India, to see a) what determines the choice between joint venture (JV) and wholly-owned subsidiary (WOS) for firms from developing country; and b) whether the factors are different than the one for the developed country foreign firms. In order to investigate the entry choice decision, the study used a sample of 250 entries made by 142 Indian manufacturing firms during 1992 to 1999. About 35% of this entry (i.e., 88 entries) consisted of WOS while the remaining 162 entries were JVs.
26 There is a reason why models have predicted JVs better than the WOS. The models used are aimed at predicting control, but use ownership as a proxy for control. Control and ownership are not always same, as it is possible to obtain effective control disproportionate to ownership. In fact, special contractual arrangement, expertise or status as a government body may induce a minority partner to exercise larger influence (Anderson and Gatignon, 1986). As a result, one could observe full control tantamount to WOS when the model would predict JV. On the other hand, firms may not choose more than 50% ownership, when they do not need full control. As a result, a certain proportion of predicted JVs will be in fact WOS and while most WOS will actually be WOS.
13
Based on our analysis, it can be concluded that both transaction cost and non-transaction cost factors influence entry choice of Indian firms. Among transaction cost variables, that reduce the costs of transaction are entering in culturally and geographically close regions (e.g., S. Asia and Africa), investment in low technology sectors (LOW-tech), and having sufficient foreign experience. The decision to go for WOS is further buttressed by the host country’s level of institutional development, which may be reducing the transaction cost. Among the control or non-transaction cost variables, SIZE of the firm and its AGE are important contributor to entry choice. The results showed that older firms are more conservative and prefer JVs to WOS. The results also indicated that the younger Indian MNCs, which were relatively big in size, having sufficient foreign experience and belonging to low-technology sector preferred going for WOS.
An important contribution of the present paper is testing for the hypothesis that the transaction cost explanation works differently for firms when they invest in more developed countries, than their investment in relatively underdeveloped country. This is because the aim in the former case could be ‘asset-seeking’ manifested through WOS and in later could be ‘asset exploitation’ manifested through JVs. Thus analysis is repeated for two groups of the firms separately – firms investing in countries, where level of development is less than India and vice versa.
The analysis yielded that foreign experience, diversification, nature of Industry (LOW-tech and MEDIUM-tech), technology intensity of the firm and brand image facilitates in reducing transaction cost when Indian firms invest in relatively less developed countries. Whereas for investment in relatively more developed countries, nature of industry and region are the only transaction-cost specific variables. In fact, for investment in these countries, non-transaction specific variable like SIZE and AGE influence entry choice significantly. In other words, building of both upstream and downward capabilities was found crucial for firms investing in relatively underdeveloped countries vis-à-vis India, whereas size, age and experience influenced entry choice in more developed countries.
The study has a number of policy implications for developing countries firms aspiring to invest abroad. The results indicate that firms can now identify those aspects that they need to strengthen or invest in depending on the mode they prefer. Building a strong brand and acquiring technological assets, through investment in advertising and R&D are essential if firms intend to invest in WOS in countries relatively less developed. Similarly, for any firm aspiring to set-up a WOS, the first route is investing in the neigbouring region so as to have first hand experience in investment. From the host country point of view, if other developing countries especially in South Asian region wish to increase the FDI inflow from India, they need to focus on improving the institutional structure that would enhance the status of their country index.
The study has a number of future avenues for research. Due to the non-availability of data, the study could not include the private limited Indian multinationals. Though the size of the firm was included as a variable, choice of entry mode is more a function of the size of the investment in relation to the size of the firm (as has been used in several studies). This would have explained the degree of risk that the firm bears in an investment. In absence of data on the size of the investment, the study had to exclude the variable. The studies for developed countries have used ‘company strategy’ as a non-transaction specific variable affecting entry choice,27 and they could assess the contribution through a primary survey. Since the present study is based on secondary data, we could not include the variable. Including company strategy, private limited firms, checking role of the investment size are few extensions of the study. Lastly, the period used in the analysis is till 1999 and as shown in Table 1A that in the last few years, FDI from India has increased significantly - a post 1999 analysis would shed new light on the relevance of these factors.
27 See for example, Dikova and Witteloostuijn (2004), Harzing (2002) etc. which find that global strategy of the firm may dictate WOS entry mode. A ‘globally-oriented’ firm, where subsidiary act as a pipeline for headquarter, would prefer the green-field mode. This is because the knowledge of the host country market would not be of much use. Conversely, the firm with a ‘multi-domestic orientation’, where firms are characterized as a decentralized network, would prefer an acquisition or even JV which will give it the benefit of a group of employees who are already familiar with the local market conditions (Harzing, 2002).
14
References:
Agarwal S. and S.N. Ramaswami (1992) “The choice of foreign market entry mode: impact of ownership, location and internationalization factors”, Jr of International Business Studies, 23(1): 1–27.
Amemiya, T. (1981) “Qualitative Response Models: A Survey”, Jr of Economic Literature, 19: 1483-1536.
Anand J. and A. Delios (2002) “Absolute and Relative Resources as Determinants of International Acquisitions”, Strategic Management Jr, 23: 119-134.
Andersen, O. (1997) “Internationalization and Market Entry Mode: A review of theories and conceptual frameworks”, Management International Review, 37(2): 27-42.
Anderson E. and H. Gatignon (1986) “Modes of Foreign Entry: A Transaction Cost Analysis and Propositions,” Jr of International Business Studies, 17(3): 1-26.
Andersson T. and R. Svensson (1994) “Entry modes for direct investment determined by the composition of firm-specific skill”, Scandinavian Jr of Economics, 96(4): 551–560
Arora A. and A. Fosfuri (2000) “Wholly Owned Subsidiary versus Technology Licensing in the Worldwide Chemical Industry,” Jr of International Business Studies, 31(4): 555-72
Aykut, D. and D. Ratha (2004) “South-south FDI flows: How big are they?”, Transnational Corporation, 13(1): 149-76.
Balakrishnan, S. and S. Koza (1993) “Information Asymmetry, Adverse Selection and Joint Venture”, Jr of Economic Behaviour and Organization, 20(1): 99-118.
Barkema H.G. and F. Vermeulen (1998) “International expansion through start-up or acquisition: a learning perspective”, Academy of Management Jr, 41: 7–26.
Benito G. (1996) “Ownership structures of Norwegian foreign subsidiaries in manufacturing”, International Trade Jr, 10(2): 157–198.
Brouthers K.D., and L.E. Brouthers (2000) “Acquisition of Greenfield start-up? Institutional, cultural and transaction cost influences”, Strategic Management Jr, 21(1): 89–97.
Buckley, P.J. and M.C. Casson (1998) “Analyzing Foreign Market entry strategies: Extending the internationalization approach”, Jr of International Business Studies, 29(3): 539-62.
Caves R. (1982) Multinational Enterprise and Economic Analysis, Cambridge University Press: New York.
Caves R.E. and S.K. Mehra (1986) Entry of foreign multinationals into U.S. manufacturing industries. In Competition in Global Industries, Porter ME (ed.). Harvard Business School Press: Boston MA; 449–481.
Chang S. and P. Rosenzweig (2001) “The choice of Entry mode in sequential Foreign Direct Investment,” Strategic Management Jr, 22: 747-76
Chen, H. and T-J. Chen (1998) “Network Linkage and Location Choice in Foreign Direct Investment”, Jr of International Business Studies, 29(3): 445-67.
Chen, S.S. and J.F. Hennart (2002) “Japanese Investors’ Choice of Joint Ventures versus Wholly-owned Subsidiaries in the US: The Role of Market Barriers and Firm Capabilities”, Jr of International Business Studies, 33(1): 1-18.
Cho K.R. and P. Padmanabhan (1995) “Acquisition versus new venture: the choice of foreign establishment mode by Japanese firms”, Jr of International Management, 1(3): 255–286.
Contractor, F. J. (1990) “Ownership Patterns of U.S. Joint Ventures abroad and the liberalization of foreign government regulations in the 1980s: Evidence from the Benchmark surveys”, Jr of International Business Studies, 21: 55-73.
Contractor, F. J. and S. K. Kundu (1998) “Model Choice in a World of Alliances: Analyzing organizational forms in the international hotel sector”, Jr of International Business Studies, 29: 325-58.
15
Cyert, R.M. and J.G. March (1963) A Behavioural Theory of the Firm, Prentice-Hall, Englewood Cliffs, NJ.
Davidson, W.H. (1983) “Market Similarity and Market Selection: Implications of International Marketing Strategy”, Jr of Business Research, 11: 439:56.
Davidson, W.H. and D.G. McFetridge (1985) Key characteristics in the choice of international technology transfer mode, Jr of International Business Studies, 16: 5-21.
Dikova D. and A. Witteloostuijn (2004) Acquisition versus Greenfield Foreign Entry: Diversification Mode Choice in Central and Eastern Europe, Department of International Economics and Business, University of Groningen.
Dunning J H (2000) “The Eclectic Paradigm as an Envelope for the Economic and Business Theories of MNE activity,” International Business Review, 9: 163-90.
Eramilli KM, and C.P. Rao (1993) “Service firms’ international entry mode choice: a modified transaction-cost analysis approach”, Jr of Marketing, 57(3): 19–38.
Eramilli MK. (1996) “Nationality and subsidiary ownership patterns in multinational corporations”, Jr of International Business Studies, 27(2): 225–248.
Gatignon, H. and Anderson, E. (1988) “The Multinational corporation’s degree of control over foreign subsidiaries: An empirical test of a transaction cost explanation”, Jr of Law, Economics and Organization, 4(2): 305-35.
Gomez-Casseres B. (1989) “Ownership structures of foreign subsidiaries: theory and evidence”, Jr of Economic Behavior and Organization, 11: 1–25.
Greene, W.H. (2003) Econometric Analysis (5th edn), Prentice-Hall: Upper Saddle River, NJ.
Greene W.H. (1997) Econometric Analysis (3rd edn), Prentice-Hall: Upper Saddle River, NJ.
Harzing, A. W. (2002) “Acquisitions versus Greenfield Investments: International Strategy and Management of Entry Modes”, Strategic Management Jr, 23: 211-27.
Hennart J.F. (1988) “A transaction cost theory of Equity Joint Ventures”, Strategic Management Jr, 9: 361-74.
Hennart J.F. and Y.R. Park YR (1993) “Greenfield vs. acquisition: the strategy of Japanese investors in the United States”, Management Science, 39: 1054–1070.
Hennart J-F, J. Larimo J, and S-F. Chen (1995) Does national origin affect the propensity of foreign investors to enter the United States through acquisition? In Proceedings of the 21st EIBA conference, vol. 2, Urbino; 401–422.
Hennart, J.F. (1991) “The Transaction Costs theory of Joint Ventures: An empirical study of Japanese subsidiaries in the United States”, Management Science, 37(4): 483-96.
Hennart, J.F. and J. Larimo (1998) “The Impact of Culture on the Strategy of Multinational Enterprises: Does National Origin affect ownership decisions”, Jr of International Business Studies, 29: 515-38.
Hill CWL, P. Hwang P, and CW Kim (1990) “An eclectic theory of the choice of international entry mode”, Strategic Management Jr, 11(2): 117–128.
Hladik, K. (1985) International Joint Ventures, D.C. Heath, Lexington, MA.
Johanson, J. and J.E. Vahlne (1977) “The Internationalization process of the firm: A model of knowledge development and increasing foreign market commitments”, Jr of International Business Studies, 8: 23-32.
Kathuria V. and S. Das (2005) “Impact of FDI on R&D Strategies of firms in the post-1991 era”, IIM Management Review, 17(2).
Kathuria, V. (2002), “Liberalisation, FDI and productivity spillovers − an analysis of Indian manufacturing firms”, Oxford Economic Papers, 54: 688-718.
16
Kim WC and P. Hwang (1992) “Global strategy and multinationals’ entry mode choice”, Jr of International Business Studies, 23(1): 29–53.
Kim, W.C. and J. Daniels (1991) “Marketing Channel decisions of foreign manufacturing subsidiaries”, Management International Review, 31: 123-38.
Kogut, B. and H. Singh (1988) “The effect of national culture on the choice of entry mode”, Jr of International Business Studies, 19: 411-32.
Kogut, B. and U. Zander (1993) “Knowledge of the firm and the evolutionary theory of the multinational corporation”, Jr of International Business Studies, 24: 625-45.
Kumar K. and M.G. McLoed (1981) Multinationals from Developing Countries, Lexington, MA: D.C. Health and Company.
Lall, S. (1983) The New Multinationals: The Spread of Third World Enterprises, New York: Wiley.
Madhok, A. (1997) “Cost, Value and foreign market entry mode: The Transaction and the firm”, Strategic Management Jr, 18(1): 39-61.
Makino, S. and K.E. Neupert (2000) “National Culture, Transaction Costs and the Choice Between Joint Venture and Wholly Owned Subsidiary”, Jr of International Business Studies, 31(4): 705-13.
Makino, S., C.M. Lau and R.S. Yeh (2002) “Asset Exploitation versus Asset-seeking: Implications for Location Choice of Foreign Direct Investment from New Industrialized Economies”, Jr of International Business Studies, 33(3): 403-21.
Mayrhofer, U. (2004) “The influence of national origin and uncertainty on the choice between cooperation and merger-acquisition: an analysis of French and German firms,” International Business Review, 13: 83-99.
Morison, D. (1974) Discriminant Analysis, in Handbook of Marketing Research, R. Ferber (ed.), Wiley, New York, 2442-57.
Padmanabhan P, and K.R. Cho (1995) “Methodological issues in international business studies: the case of foreign establishment mode decisions by multinational firms”, International Business Review, 4(1): 55–73.
Root, F.R. (1983) Foreign Market Entry Strategies, New York, AMACON.
Root, F.R. (1987) Entry Strategy for International Markets, Lexington Books, Lexington, MA.
Shane, S. A. (1994) “The effect of national culture on the choice between licensing and direct foreign investment”, Strategic Management Jr, 15: 627-42.
Teece, D. J. (1977) “Technology Transfer by Multinational Firms: The Resource Cost of transferring technological know-how”, Economic Jr, 87 (June): 242-61.
UNCTAD World Investment Report 2000: Country Fact Sheet; UNCTAD Report 20th Oct 2004 - India’s Outward FDI: a giant awakening?
Wells, L.T. (1977) The Internationalization of Firms from Developing Countries, in Tamir Agmon and C. P. Kindleberger (eds.) Multinationals from Small Countries, Cambridge, MA: MIT Press (133-56).
Wells, L.T. (1983) Third World Multinationals: The Rise of Investment from Developing Countries, Cambridge, MA: MIT Press.
Wernerfelt, B. (1984) “A Resource-based View of the Firm”, Strategic Management Jr, 5: 171-80.
Williamson, O.E. (1979) “Transaction Cost Economics: The Governance of Contractual Relations”, Jr of Law and Economics, 22 (October): 233-62.
Wilson, B.D. (1980) “The propensity of Multinational Companies to expand through acquisitions”, Jr of International Business Studies, 11: 59-65.
Wooldridge (2002) Introductory Econometrics: A Modern Approach, South Western College Publishing.
17
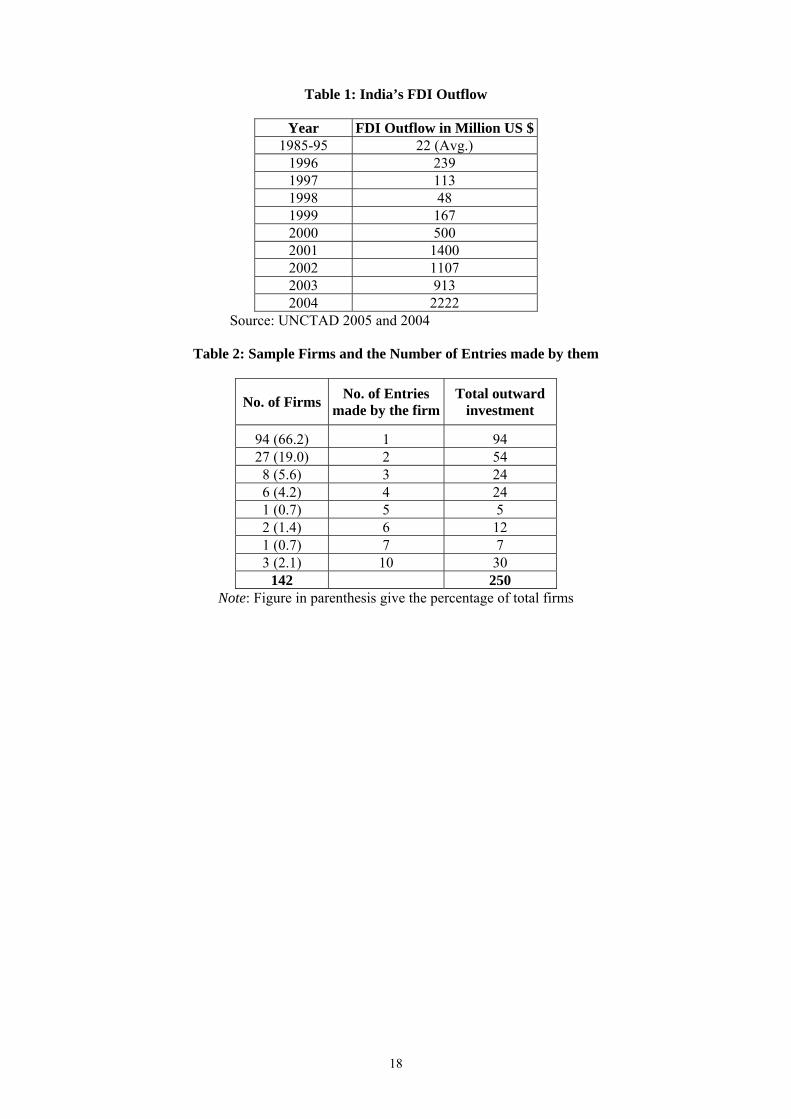
Table 1: India’s FDI Outflow
Year FDI Outflow in Million US $1985-95 22 (Avg.)
1996 239 1997 113 1998 48 1999 167 2000 500 2001 1400 2002 1107 2003 913 2004 2222
Source: UNCTAD 2005 and 2004
Table 2: Sample Firms and the Number of Entries made by them
No. of Firms No. of Entries made by the firm
Total outward investment
94 (66.2) 1 94 27 (19.0) 2 54
8 (5.6) 3 24 6 (4.2) 4 24 1 (0.7) 5 5 2 (1.4) 6 12 1 (0.7) 7 7 3 (2.1) 10 30
142 250 Note: Figure in parenthesis give the percentage of total firms
18
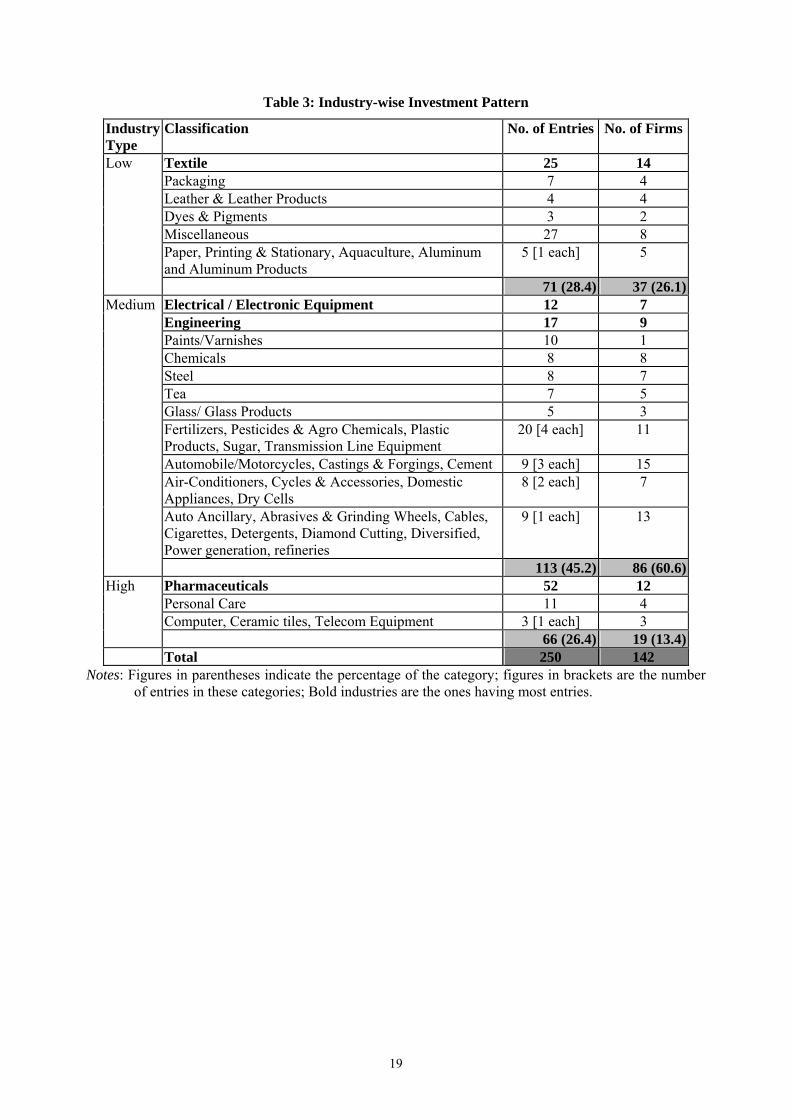
Table 3: Industry-wise Investment Pattern
Industry Type
Classification No. of Entries No. of Firms
Textile 25 14 Packaging 7 4 Leather & Leather Products 4 4 Dyes & Pigments 3 2 Miscellaneous 27 8 Paper, Printing & Stationary, Aquaculture, Aluminum and Aluminum Products
5 [1 each] 5
Low
71 (28.4) 37 (26.1)Electrical / Electronic Equipment 12 7 Engineering 17 9 Paints/Varnishes 10 1 Chemicals 8 8 Steel 8 7 Tea 7 5 Glass/ Glass Products 5 3 Fertilizers, Pesticides & Agro Chemicals, Plastic Products, Sugar, Transmission Line Equipment
20 [4 each] 11
Automobile/Motorcycles, Castings & Forgings, Cement 9 [3 each] 15 Air-Conditioners, Cycles & Accessories, Domestic Appliances, Dry Cells
8 [2 each] 7
Auto Ancillary, Abrasives & Grinding Wheels, Cables, Cigarettes, Detergents, Diamond Cutting, Diversified, Power generation, refineries
9 [1 each] 13
Medium
113 (45.2) 86 (60.6)Pharmaceuticals 52 12 Personal Care 11 4 Computer, Ceramic tiles, Telecom Equipment 3 [1 each] 3
High
66 (26.4) 19 (13.4) Total 250 142
Notes: Figures in parentheses indicate the percentage of the category; figures in brackets are the number of entries in these categories; Bold industries are the ones having most entries.
19
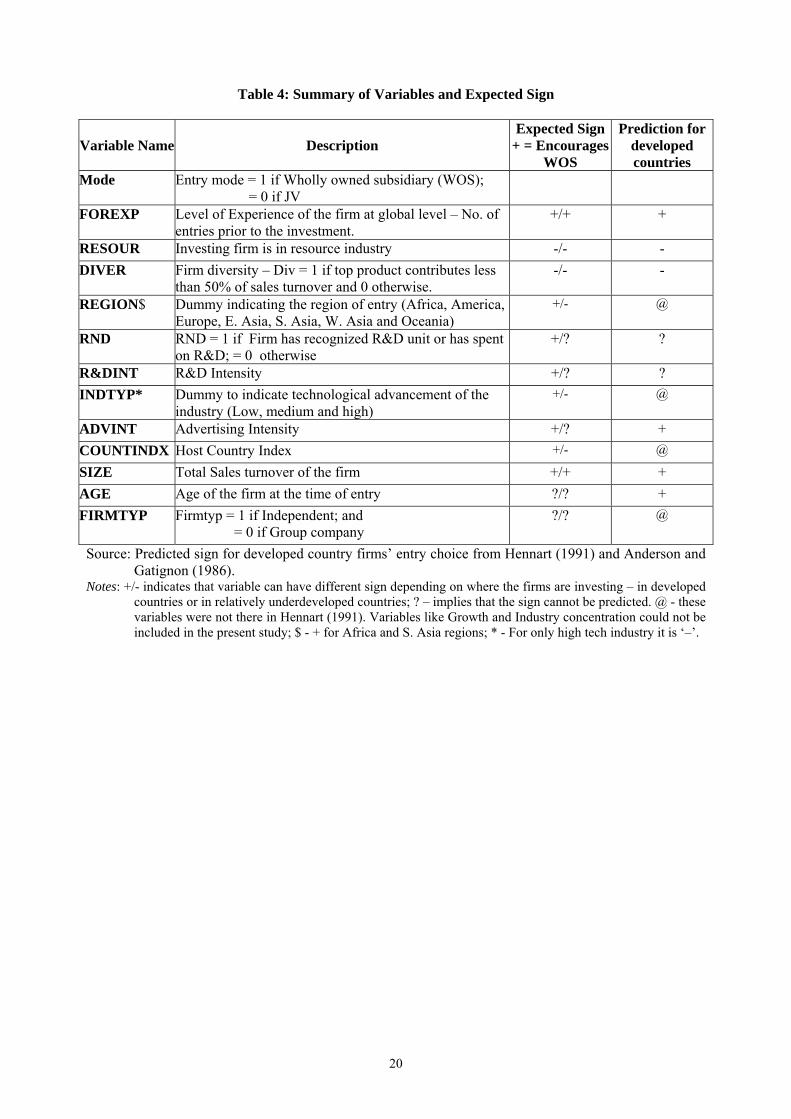
Table 4: Summary of Variables and Expected Sign
Source: Predicted sign for developed country firms’ entry choice from Hennart (1991) and Anderson and Gatignon (1986).
Variable Name Description Expected Sign
+ = Encourages WOS
Prediction for developed countries
Mode Entry mode = 1 if Wholly owned subsidiary (WOS); = 0 if JV
FOREXP Level of Experience of the firm at global level – No. of entries prior to the investment.
+/+ +
RESOUR Investing firm is in resource industry -/- - DIVER Firm diversity – Div = 1 if top product contributes less
than 50% of sales turnover and 0 otherwise. -/- -
REGION$ Dummy indicating the region of entry (Africa, America, Europe, E. Asia, S. Asia, W. Asia and Oceania)
+/- @
RND RND = 1 if Firm has recognized R&D unit or has spent on R&D; = 0 otherwise
+/? ?
R&DINT R&D Intensity +/? ? INDTYP* Dummy to indicate technological advancement of the
industry (Low, medium and high) +/- @
ADVINT Advertising Intensity +/? + COUNTINDX Host Country Index +/- @
SIZE Total Sales turnover of the firm +/+ + AGE Age of the firm at the time of entry ?/? + FIRMTYP Firmtyp = 1 if Independent; and
= 0 if Group company ?/? @
Notes: +/- indicates that variable can have different sign depending on where the firms are investing – in developed countries or in relatively underdeveloped countries; ? – implies that the sign cannot be predicted. @ - these variables were not there in Hennart (1991). Variables like Growth and Industry concentration could not be included in the present study; $ - + for Africa and S. Asia regions; * - For only high tech industry it is ‘–’.
20

Table 5: Descriptive Statistics of Variables for all firms and two entry modes (JV vs WOS)
Variable
All the firms (N = 250)(2)
JV (N = 162) (3)
WOS (N = 88) (4)
1 Age (years) 29.16 (19.88) 30.96 (20.48) 25.85* (18.38) 2 Foreign Experience (No.) 1.09 (1.83) 0.95 (1.69) 1.36* (2.06) 3 Country Index 7.08 (1.18) 6.84 (1.21) 7.54* (0.98) 4 Size (Sales in Rs.Million)# 430.94 (781.24) 433.47 (817.14) 426.29 (714.95)5 Advertising Intensity (%) 0.99 (1.73) 1.02 (1.61) 0.94 (1.94) 6 R&D Intensity (%) 0.49 (2.24) 0.35 (1.53) 0.76 (3.15) 7 RND$ 0.66 [165] 0.65 [106] 0.58 [59] 8 Firmtype$ 0.54 [134] 0.51 [83] 0.58 [51] 9 Diversity$ 0.28 [71] 0.27 [44] 0.31 [27]
10 Resource Dependence$ 0.29 [72] 0.25 [41] 0.35 [31] Industry Type$
11 Low Tech 0.27 [68] 0.20 [33] 0.40* [35] 12 Medium Tech 0.504 [126] 0.54 [87] 0.44 [39] 13 High Tech 0.22 [56] 0.26* [42] 0.16 [14]
Region$ 14 Africa 0.13 [33] 0.12 [19] 0.16 [14] 15 America 0.14 [36] 0.11 [18] 0.20 [18] 16 E. Asia 0.17 [42] 0.20 [33] 0.10 [9] 17 Europe 0.27 [67] 0.23 [38] 0.33 [29] 18 Oceania 0.03 [7] 0.04 [6] 0.01 [1] 19 S. Asia 0.14 [34] 0.14 [22] 0.14 [12] 20 W. Asia 0.12 [31] 0.16 [26] 0.06 [5]
Notes: * - indicates difference in means is statistically significant at minimum 10% level. $ - Indicator is a dummy variable; # - 1 US $ = Rs. 45 (approx.). Figure in parenthesis are the standard deviation, figures in brackets are the number of entries in these industries/regions.
21

Table 6: Results of Probit Regression Analysis: Transaction Cost determinants of Entry Choice (WOS vs. JV) of Indian MNCs
Dep. Variable: Mode
(WOS=1, JV= 0) Model 1
(2) Model 2
(3) Model 3
(4) Model 4
(5) Model 5
(6) Model 6
(7) 1 FOREXP 0.117* (0.063) 0.123* (0.062) 0.53* (0.148) 0.74* (0.148) 0.029 (0.065) 0.032 (0.064)2 RESOUR 0.056 (0.225) 0.003 (0.224) -0.33 (0.56) -0.32 (0.67) 0.31 (0.6) 0.30 (0.25) 3 DIVER -0.135 (0.203) -0.134 (0.204) -0.684 (0.554) -2.84* (1.11) -0.092 (0.24) -0.10 (0.24) 4 S. Asia 2.14* (0.70) 1.49* (0.41) 1.73* (0.61) 2.06* (0.67) @ @ 5 Africa 0.90* (0.66) 0.90* (0.37) 0.78 (0.74) 1.24 (0.89) 1.35* (0.44) 1.36* (0.44) 6 Oceania -0.62 (0.67) -0.61 (0.69) @ @ 0.27 (0.68) 0.29 (0.69) 7 E. Asia -0.196 (0.64) -0.20 (0.37) -0.53 (0.71) -0.88 (0.73) 0.40 (0.43) 0.41 (0.43) 8 Europe 0.45 (0.63) 0.44 (0.35) @ @ 1.22* (0.40) 1.25* (0.40) 9 America 0.448 (0.66) 0.43 (0.39) 1.1 (0.86) 1.11 (0.92) 1.41* (0.41) 1.45* (0.41)
10 RND 0.17 (0.235) 0.11 (0.6) 0.11 (0.26) 11 R&D Intensity 0.038 (0.04) 0.28* (0.07) -0.03 (0.06) 12 Low-tech 0.835* (0.35) 0.80* (0.34) 3.48* (1.12) 4.14* (1.24) 0.60* (0.36) 0.54* (0.35) 13 Medium-tech 0.34 (0.29) 0.31 (0.29) 2.26* (0.88) 2.42* (0.99) 0.194 (0.325) 0.18 (0.32) 14 ADVINT 0.054 (0.065) 0.048 (0.064) 0.356* (0.13) 0.43* (0.15) -0.012 (0.091) -0.019 (0.09) 15 COUNTINDX 0.54* (0.12) 0.53* (0.12) 16 SIZE 0.13* (0.079) 0.14* (0.077) -0.081 (0.196) -0.013 (0.21) 0.275* (0.096) 0.289* (0.097)17 AGE -0.019* (0.006) -0.019*(0.006) -0.018 (0.012) -0.014 (0.012) -0.025* (0.007)-0.025* (0.007)18 FIRMTYP -0.04 (0.197) -0.031 (0.196) 0.021 (0.49) -0.41 (0.51) -0.087 (0.22) -0.081 (0.22) 19 Constant -5.53* (0.92) -5.42* (0.92) -3.73* (1.22) -4.69* (1.67) -2.31* (0.56) -2.30* (0.56) 20 Pseudo R2 0.21 0.21 0.29 0.41 0.18 0.18 21 Wald χ2 (Prob>chi2) 58.18 (0.000) 57.17 (0.000) 24.79 (0.037) 38.46 (0.004) 41.91 (0.0002) 41.87 (0.0002)22 Log Likelihood -127.88 -127.64 -26.65 -22.28 -98.62 -98.58 23 Predicted Correctly 75.2% 75.2% 78.8% 78.8% 70.8% 70.8% 24 N 250 (WOS = 88, JV = 162) 66 (WOS = 17, JV = 49) 178 (WOS = 71, JV = 107)
Notes: * - denotes significance at minimum 10% level; Figure in parenthesis are the standard errors. @ - dropped due to all entries either have single mode or are below threshold of country index. Models 1 and 2 – For all the firms with RND and R&D Intensity; Models 3 and 4 – for countries less developed than India (on the basis of country index) with RND and R&D Intensity; Models 5 and 6 – for countries more developed than India (on the basis of country index) with RND and R&D Intensity.
22

Table 7: Marginal Effects for Different Models
Variable
(1) Model 1
(2) Model 2
(3) Model 3
(4) Model 4
(5) Model 5
(6) Model 6
(7) 1 FOREXP 0.0412* 0.043* 0.118* 0.106* 0.011 0.0122 RESOUR$ 0.0197 0.001 -0.068 -0.042 0.12 0.123 DIVER$ -0.046 -0.046 -0.124 -0.227* -0.035 -0.0384 S. Asia$ 0.55* 0.54* 0.38* 0.324* @ @5 Africa$ 0.34* 0.34* 0.22 0.30 0.49* 0.50*6 Oceana$ -0.18 -0.17 @ @ 0.10 0.117 E. Asia$ -0.066 -0.068 -0.093* -0.076* 0.16 0.168 Europe$ 0.165* 0.161 @ @ 0.45* 0.46*9 America$ 0.167 0.16 0.36 0.28 0.52* 0.53*
10 RND$ 0.06 0.02 0.041 11 R&D Intensity 0.013 0.04* -0.01111 Low-tech$ 0.31* 0.30* 0.91* 0.96* 0.23* 0.2112 Medium-tech$ 0.12 0.11 0.44* 0.44* 0.07 0.0713 ADVINT 0.019 0.017 0.079* 0.061* -0.005 -0.00714 COUNTINDX 0.19* 0.187* 15 SIZE 0.046* 0.051* -0.018 -0.002 0.104* 0.109*16 AGE -0.007* -0.007* -0.004 -0.002 -0.009* -0.009*17 FIRMTYP$ -0.014 -0.01 0.005 -0.06 -0.033 -0.031
Notes: Same as Table 6. $ - variable is a dummy, thus MFX for the dummy variable is a change from 0 to 1.
Table 8: Performance of the Models – Prediction vs. Actual
All firms Country type 1 Country type 2 Model 1 Model 2 Model 3 Model 4 Model 5 Model 6
1 Actual JV 162 49 107 2 JVs Predicted 143 (88.3) 142 (87.7) 44 (89.8) 46 (93.9) 88 (82.2) 88 (82.2) 3 Actual WOS 88 17 71 4 WOS Predicted 45 (51.1) 45 (51.1) 8 (47.1) 9 (52.9) 38 (53.5) 40 (56.3) 5 Total Prediction 188 (75.2) 187 (74.8) 52 (78.8) 55 (83.3) 126 (70.8) 128 (71.9) 6 Baseline Rate 54.4% 61.8% 52.04% 7 N 250 66 178
Note: Numbers in parentheses are the correct predictions in percentage; N – Total observations.
Table 9: Comparison with other studies – Transaction cost explanation for firms’ investment
Variable Present Study
(Model 2) Present Study
(Model 4) Present Study
(Model 6) Previous Studies
1 FOREXP +(s) +(s) + + (s) 2 RESOUR + - + - (s) 3 DIVER - -(s) - - (s) 4 REGION* +(s) +(s) +(s) @ 5 RND/R&D Intensity + +(s) +/- + (s) 6 INDTYP +(s) +(s) +(s) - (s) 7 ADVINT + +(s) - + / - 8 COUNTINDX +(s) @ 9 SIZE/Relative size +(s) - +(s) - / - (s) 10 AGE / Age of Affiliate -(s) - -(s) + (s) 11 FIRMTYP - + - @ Source: For developed countries studies – Hennart (1991), Makino and Neupert (2000), * - Gatignon and
Anderson (1988). Note: Firm type and Resource requirement are found to have no influence on entry decisions in any of the models.
23

Appendix 1
Table A: Top 15 Developing Economies’ Outward Investors, FDI Stock in 2003 and 2004 (US $ bn.)
Source: UNCTAD 2004
Rank Economy Value 1990
Value 2000
Value 2003
Value 2004
% growth since 1990
% growth since 2000
1 Hong Kong 11.9 388.4 336.1 405.6 3308.4 (3) 4.4 2 Singapore 7.8 56.8 90.9 100.9 1193.6 77.6 (3) 3 Taiwan 30.4 66.7 65.2 91.2 200.0 36.7 4 Brazil 41.0 51.9 54.6 64.4 57.1 24.1 5 China 4.4 27.8 37.0 38.8 781.8 39.6 (5) 6 Korea 2.3 26.8 34.5 39.3 1608.7 (4) 46.6 (4) 7 Malaysia 2.7 21.3 29.7 13.8 411.1 -35.2 8 South Africa 15.0 32.3 24.2 28.8 92.0 -10.8 9 Argentina 6.0 21.1 21.3 21.8 263.3 3.3
10 Mexico 1.0 7.5 13.8 15.9 1490.0 (5) 112.0 (2) 11 Chile 0.1 11.1 13.8 14.4 14300.0 (1) 29.7 12 Venezuela 1.2 7.7 8.0 9.2 666.7 19.5 13 Iran Na 0.4 6.8 Na Na Na14 India 0.1 1.9 5.1 6.6 6500.0 (2) 247.4 (1) 15 Nigeria 1.2 4.1 4.6 4.8 300.0 17.1
Note: Figure in parenthesis gives the rank in terms of growth.
24