Embed Size (px)
Citation preview

STATE OF NORTH CAROLINA HIGHER EDUCATION COMPREHENSIVE PLANNING PROGRAM
FACILITIES INVENTORY
AND UTILIZATION STUDY
2013
James B Hunt Library, North Carolina State University


HIGHER EDUCATION COMPREHENSIVE PLANNING PROGRAM
FACILITIES INVENTORY AND UTILIZATION STUDY FALL OF 2013
For THE STATE OF NORTH CAROLINA
FORTY-SEVENTH EDITION
THE UNIVERSITY OF NORTH CAROLINA Facilities Space Utilization and Analysis
Chapel Hill, North Carolina
October 2014

The James B. Hunt Jr. Library
North Carolina State University
(Cover page)
Opened on January 2, 2013, the James B. Hunt Jr. Library has won international
recognition and a host of awards as “the library of the future.” An iconic space that
captures the spirit of NC State’s commitment to innovative education and research, it has
become the 21st
century face of a university intent on addressing the grand challenges of
society and strengthening the economy of North Carolina.
The 243,500-square-foot library was funded with $93.75 million in state appropriations
and $5 million in private gifts from individuals and corporations who wished to support
one of the world’s most creative learning and collaborative spaces. The lead designer
was Snøhetta, an internationally known firm whose recent projects include the entry
pavilion for the National September 11 Memorial and Museum and the new look for
Times Square in New York City. The executive architects were Clark Nexsen, and the
construction contractor was Skansa USA. The building has been awarded a LEED
(Leadership in Energy and Environmental Design) Silver certification.
The Hunt Library’s bold design is a visual statement of its bold purpose: to be a place not
of the past but of the future, a place where students, faculty, and partners can gather to
research, learn, experiment, collaborate, and strengthen NC State’s long tradition of
leading transformative change. The facility has been featured in Time, Scientific
American, Forbes, The Chronicle of Higher Education and other influential press for the
way its spaces and technologies make it easy for students and faculty to immerse
themselves in interactive computing, simulated environments, multimedia creation, and
large-scale visualization—tools that are enabling revolutionary ways to see and use
information.
It’s Teaching and Visualization Lab, for instance, has enabled researchers to create 270
degree simulations that allow traffic engineers to build an immersive space where
planners and citizens can watch a new overpass rise and experience its effects on
everything from traffic patterns to sunlight in nearby neighborhoods. In its Creativity
Studio, Naval ROTC midshipmen virtually pilot any ship in the U.S. fleet and the next
generation of forensics experts digitally recreate a crime scene to find clues in cold cases.
The Institute for Emerging Issues (IEI) is also located in the Hunt Library. IEI is a think-
and-do tank at NC State University focused on tackling big issues that affect North
Carolina’s future growth and prosperity.
The Hunt Library has attracted tens of thousands of visitors from all over the world,
especially those interested in how architecture and technology can be used to create
spaces that encourage collaborative learning and game-changing research.
Cover page photo ©Jeff Goldberg/Esto
ii

The University of North Carolina
John C. Fennebresque, Chairman Thomas W. Ross Board of Governors President
Kathryn M. Henz Associate Vice President of Academic Policy,
Planning & Analysis
University of North Carolina General Administration Space Utilization Analysis
Jeffrey D. Hill Karen Copeland Director AutoCAD Tech
Technical Committee
Suzanne Canipe Art Rex UNC at Chapel Hill Appalachian State University
Jan Fazzari Judith Smith Cape Fear Community College UNC at Greensboro
Jeffrey D. Hill Sally Rau Academic Policy, Planning & Analysis N.C. State University
Lindsay Noth Kim Higdon Academic Policy, Planning & Analysis East Carolina University
iii

Participating Institutions
UNIVERSITY OF NORTH CAROLINA Thomas W. Ross, President
Research Universities I Chancellor Project Officer
N. C. State University Randy Woodson Sally Rau, Facilities Information Manager
UNC at Chapel Hill Carol L. Folt Suzanne Canipe Space Information Analyst
Doctoral Universities Chancellor Project Officer
East Carolina Univ. Steven Ballard Kim Higdon Space Analyst
N.C. A &T State Univ. Harold L. Martin, Sr. Alton Rucker Social Research Associate
UNC at Charlotte Philip L. Dubois Steve Coppola Provost for Inst. Research
UNC at Greensboro Linda P. Brady Maggie Capone-Chrismon, Office of Space Management
Master’s (Comprehensive) Universities and Colleges I Chancellor Project Officer
Appalachian State Univ. Sheri N. Everts Arthur B. Rex Space Mgmt. & Planning
Fayetteville State Univ James A. Anderson Ashlynn Moore Planning & Construction
N. C. Central University Deborah Saunders-White Tim Williams Design and Construction
UNC at Pembroke Kyle R. Carter Jeannie Davis Assoc. Dir. IE Reporting
UNC at Wilmington William A. Sederburg Steffaney Cohen Interim Interim Dir. Inst. Research
Western Carolina Univ. David O. Belcher Elizabeth Snyder Research Specialist
Winston-Salem State Univ. Donald J. Reaves Donna Presnell Facility Planner
Baccalaureate (Liberal Arts) Universities and Colleges I and II Chancellor Project Officer
Elizabeth City State Univ. Stacey Franklin Jones Damon Wade Dir. Inst. Res. & Assessment
UNC at Asheville Douglas Orr Archer Gravely Interim Dir. Inst. Research
iv

Schools of Art, Music, and Design Chancellor Project Officer
UNC School of the Arts M. Lindsay Bierman Xiaoyun Yang Dir. Inst. Research
Teaching Hospitals Executive Director Project Officer
UNC Hospitals at Chapel Hill Gary L. Park Laura McClamb Asset Manager
NORTH CAROLINA COMMUNITY COLLEGE SYSTEM R. Scott Ralls, System President
Community Colleges President Project Officer
Alamance CC Algie C. Gatewood Terry McNeill Dean Curriculum Programs
Asheville-Buncombe TCC Dennis F. King Tommy Biddix Equip. Coordinator
Beaufort County CC Barbara Tansey Sherry Stotesberry Equip. Coordinator
Bladen CC William “Bill” Findt David Gooden Systems Administrator
Blue Ridge CC Molly Parkhill Peter Hemans Dir. Of Facilities
Brunswick CC Susanne Adams Sheila Galloway Dir. Fiscal Services
Caldwell CC & TI Kenneth A. Boham Donnie Bassinger V.P. Facilities Services
Cape Fear CC Ted D. Spring Camellia Rice Sr. V.P. Bus. & Inst. Svcs.
Carteret CC Kerry Youngblood Renee Donald Plant Operations Coord.
Catawba Valley CC Garrett Hinshaw Jessica Page Coord. Curriculum/Facilities
Central Carolina CC T. E. (Bud) Marchant Wayne R. Robinson VP Admin. Services
Central Piedmont CC Paul A. Zeiss Vicki Saville Assoc. V.P Facilities Svcs
Cleveland CC L. Steve Thornburg Tommy Greene V. P. Fin. & Admin. Services
Coastal Carolina CC Ronald K. Lingle David Heatherly Exec. Vice President
College of the Albemarle Kandi Deitemeyer Robert Howard V.P. Bus. & Finance
Craven CC Catherine Chew Larry Henderson Dir. Facilities & Security
v

Davidson County CC Mary Rittling Keith Raker Dir. Physical Plant
Durham TCC William “Bill” Ingram Richard McKown Dir. Facility Services
Edgecombe CC Deborah L. Lamm Katherine Lancaster Controller
Fayetteville TCC J. Larry Keen Sheila Dawson Env. Svcs Tech.
Forsyth TCC Gary M. Green Jim Dubois Bldg. Construction Tech.
Gaston College Patricia A. Skinner Rex Clay Dir. Inst. Effectiveness
Guilford TCC Randy Parker Mitchell Johnson Assoc. VP Admin. Svcs
Halifax CC Ervin Griffin, Sr. Debra Smith V.P. Admin Svcs
Haywood CC Barbara Parker Karen Denny Campus Development
Isothermal CC Walter Dalton Steven Matheny V. P. Admin. Services
James Sprunt CC Lawrence Rouse Wanda Ramsey Res. & Accreditation Assoc.
Johnston CC David N. Johnson Michael Cross VP Fin. & Admin.
Lenoir CC Brantley Briley B.J. Koonce Dir. Env. Services
Martin CC Ann R. Britt Jennifer Cherry Purchasing Coord.
Mayland CC John C. Boyd William Ellis Equip. & Rec. Tech.
McDowell TCC Bryan Wilson Ryan Garrison VP Finance & Admin.
Mitchell CC Tim Brewer Gary W. Johnson Dir. of Facilities
Montgomery CC Mary Chesson Connie Harris Interim Dir. Evening Programs
Nash CC William S. Carver, II Annette Dishner VP Finance
Pamlico CC Cleve H. Cox James Curry VP Admin. Services
Piedmont CC Walter C. Bartlett Rhonda Strickland Admin Asst. Admin. Svcs
Pitt CC G. Dennis Massey Kelly Moore Facil. Scheduling Officer
Randolph CC Robert S. Shackleford, Jr. Daffie H. Matthews VP Admin. Services
Richmond CC W. Dale McInnis Glenn Sims Dir Facilities Services
vi

Roanoke-Chowan CC Michael Elam Charles Strickland VP Admin. Services
Robeson CC Pamela Hilbert Sybil Boone, Exec. Asst. to VP Instruction
Rockingham CC William C. Aiken Susan A. Hall Interim Admin. Svcs. Asst.
Rowan-Cabarrus CC Carol S. Spalding Jonathan Chamberlain Chief Officer Capital Projects
Sampson CC Paul Hutchins William Starling VP Administration
Sandhills CC John R. Dempsey Lynn May Office Coordinator
South Piedmont CC Stan Sidor Marci Jackson Coordinator, Institutional Data
Southeastern CC Kathleen S. Matlock Betty Jo Ramsey V.P. Operations & Fin.
Southwestern CC Don Tomas Charles J. Reece Dir. Human Res./Fac. Dev.
Stanly CC Brenda S. Kays Rebecca T. Wall Chief Financial Officer
Surry CC David Shockley Debbie Wolfe Dir. Admin. Svcs
Tri-County CC Donna Tipton-Rogers Bill Vespasian Exec. V.P. for Operations
Vance-Granville CC Stelfanie Williams Vickie Watkins Systems Administrator
Wake TCC Stephen C. Scott Wendell B. Goodwin Facilities Engineer Officer
Wayne CC Kay Albertson Don Magoon Chief Admin. Svcs.
Western Piedmont CC Michael Helmick Linda Carswell Dir. Purchasing
Wilkes CC Jeffrey A. Cox. Steven Hall Equip. Coordinator
Wilson TCC C. H. “Rusty” Stephens Hadie Horne VP Finance/Admin
PRIVATE INSTITUTIONS
Gen. Baccalaureate Colleges President Project Officer
Barton College Norval C. Kneten D. Kris Lynch VP Fin. Affairs
vii

Campbell University Jerry M. Wallace John Strickland Facilities Management
Mars Hill College Dan Lunsford Suzanne Klonis Dir. Inst. Research
Pfeiffer University Jerry Boone Sharon Bard Interim Dir. of Facilities
Note: Chancellors and Presidents are listed as of the publication date. The Project Officers are the persons who supplied the data used in this year’s study.
viii

Foreword
This study, the forty-seventh in the annual series of facilities inventory and utilization studies, reflects the status of space in North Carolina institutions of higher education at the end of the drop-add period of the 2013 fall term at each college. It also gives indications of the uses being made of the space and provides, where feasible, norms and historical information for the past five years to enable institutions to make their own assessments of their facilities.
In order to realize substantial savings in printing costs, the Facilities Inventory and Utilization Study is being published in its entirety online in a format that can be printed front and back. The 2013 study can be found at http://www.northcarolina.edu/?q=academic-policy-planning-and-analysis/publications.
The purposes of this study include providing facilities data to state authorities, making data on North Carolina facilities available to other commissions for comparative purposes, and providing participating institutions with data, which may be helpful in the management of their facilities. This report presents selected summary information from the quantities of data assembled in the 2013 comprehensive planning studies. Other studies have been conducted resulting in detailed information pertinent to this study. This information has been incorporated into this study to continually broaden the information available. Detailed facility condition information for UNC institutions presented on page 124 is such an example.
Public senior institutions, community and technical colleges, and participating private institutions throughout the state have cooperated fully in time, energy, and funds to provide data for the studies. The participating institutions are listed in the preceding section. The gathering and review of data for the studies have been accomplished through the joint effort of the agencies providing membership to the Technical Committee. The Project Officers of the participating institutions deserve special recognition for the tremendous job they have done in providing the basic data for this study.
Jeffrey D. Hill Director
ix

Contents
Page
Foreword ix
Table of Contents x
List of Tables xi
Introduction 1
I. Utilization of Instructional Space 7
II. Interior Space Characteristics 59
III. Building Characteristics 107
IV. Accessibility of Facilities to the
Mobility Impaired 129
Institutional Index 155
Bibliography 158
Index 159
x

List of Tables
Page
Utilization of Instructional Space
l. Capacity/Enrollment Ratio 9
2. Square Feet of Academic Facilities Per FTE Student 15
3. Average Weekly Room Hours of Instruction
in Classrooms 20
4. Average Weekly Room Hours of Instruction
in Class Laboratories 24
5. Average Weekly Use of Student Stations
in Classrooms 28
6. Average Weekly Use of Student Stations
in Class Laboratories 32
7. Percent Student Station Utilization,
Classrooms and Class Laboratories 36
8. Student Clock Hours of Instruction 41
9. Space Factors 44
10. Range of Selected Space Utilization Indices 48
11. Space Standards 49
12. FTE Enrollments 54
Interior Space Characteristics
13. Net-To-Gross Ratio 61
14. Percentage Distribution of Assignable
Area by Summary Programs 64
14a. Instruction, Research & Public Service Subprograms 71
14b. Academic Support Subprograms 78
14c. Student Service and Physical Plant
Operations Subprograms 82
xi

14d. Institutional Administration, Independent
Operations & Unassigned Subprograms 86
15. Assignable Area by Room Code 90
16. Assignable Square Feet Per Student Station for Classrooms 98
17. Assignable Square Feet Per Student Station for Class Laboratories 102
Building Characteristics
18. Ownership of Buildings 109
19. Capital Investment, Non-Residential Buildings 112
20. Capital Investment, Residential Buildings 112
21. Age of Buildings Reported by Gross Square Feet 116
22. Condition of Buildings 120
22a. FCAP: Maintenance and Repair Needs 120
23. Estimated Cost to Renovate or
Replace Unsatisfactory Facilities 125
Accessibility of Facilities to the Mobility Impaired
24. Accessible Area As a Percentage of Assignable 131
25. Accessible Area by Summary Programs 135
25a. Instruction, Research & Public Service Subprograms 138
25b. Academic Support Subprograms 142
25c. Student Service and Physical Plant Operations Subprograms 144
25d. Institutional Administration, Independent
Operations & Unassigned Subprograms 146
26. Accessible Area by Room Code 149
xii

Introduction
The efficient use of campus facilities is of increasing concern to most colleges and
universities. This concern is partially a reflection of the high costs involved in constructing and maintaining buildings, but it also stems from a broader recognition of the importance of facilities planning. The effective allocation and utilization of space is essential if an institution of higher education is to maximize its resources in accomplishing its objectives in the areas of instruction, research, and public service.
The primary purpose of the Facilities Inventory and Utilization Study is to provide higher education administrators with a detailed statistical profile of the facilities of their own campuses and of the other colleges and universities in North Carolina. The study also presents data which can provide the basis for comparative assessments of the extent to which space is used for instructional purposes. In short, this publication is intended as an important analytical tool for use in facilities planning. It is published annually by UNC General Administration’s Space Utilization and Analysis which is a division of Academic Policy, Planning and Analysis.
Institutions Included
The study provides data for 78 institutions of higher education in North Carolina. This universe includes all of the sixteen public senior institutions, which comprise the University of North Carolina, 4 private non-profit colleges and universities, and the 58 public two-year institutions, which represent the Community College System. In addition, data are provided for UNC Hospitals at Chapel Hill, a part of the University of North Carolina. The participating colleges and universities are listed by type of institution on pages iv-viii along with the name of the President or Chancellor and the project officer for each school. An alphabetical listing of these institutions, including mailing addresses and other information, can be found on pages 155-157.
Beginning in the Fall of 2002, the 36 private institutions participating in the data collection were given the option of continuing the yearly assessment of their facilities on a fee for service basis. Of the 38 campuses, Barton College, Campbell University, Mars Hill College, and Pfeiffer University have elected to participate in 2013. Each of these participating institutions is provided with building, room, and utilization reports for their campus, and will retain the ability to request special data analysis as part of this service. Campuses that rejoin the data collection effort under the fee for service agreement will be added at the beginning of each data collection cycle.
Because of the unique facilities requirements of health affairs complexes and medical schools, data for the Division of Health Affairs at East Carolina University and the University of
1
North Carolina at Chapel Hill are listed separately from their parent campuses. For similar reasons, the Facilities Inventory and Utilization Study separately lists the data for North Carolina State University's School of Veterinary Medicine.
Types of Data Collected
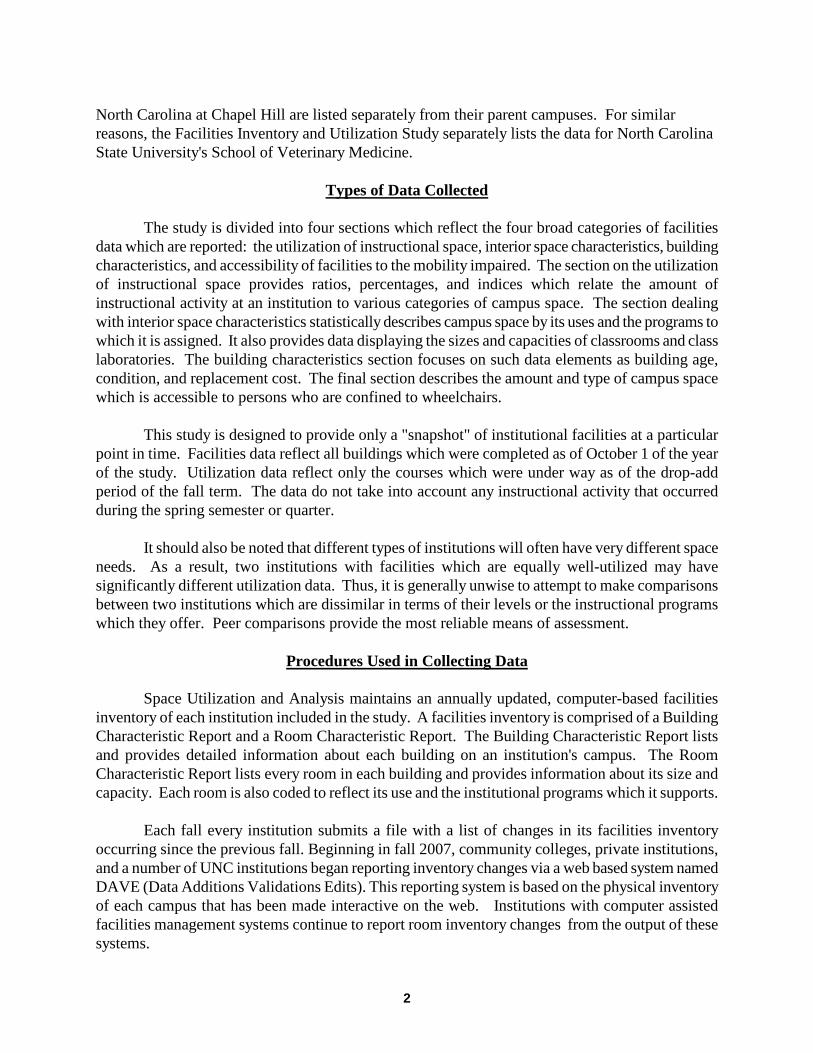
The study is divided into four sections which reflect the four broad categories of facilities data which are reported: the utilization of instructional space, interior space characteristics, building characteristics, and accessibility of facilities to the mobility impaired. The section on the utilization of instructional space provides ratios, percentages, and indices which relate the amount of instructional activity at an institution to various categories of campus space. The section dealing with interior space characteristics statistically describes campus space by its uses and the programs to which it is assigned. It also provides data displaying the sizes and capacities of classrooms and class laboratories. The building characteristics section focuses on such data elements as building age, condition, and replacement cost. The final section describes the amount and type of campus space which is accessible to persons who are confined to wheelchairs.
This study is designed to provide only a "snapshot" of institutional facilities at a particular point in time. Facilities data reflect all buildings which were completed as of October 1 of the year of the study. Utilization data reflect only the courses which were under way as of the drop-add period of the fall term. The data do not take into account any instructional activity that occurred during the spring semester or quarter.
It should also be noted that different types of institutions will often have very different space needs. As a result, two institutions with facilities which are equally well-utilized may have significantly different utilization data. Thus, it is generally unwise to attempt to make comparisons between two institutions which are dissimilar in terms of their levels or the instructional programs which they offer. Peer comparisons provide the most reliable means of assessment.
Procedures Used in Collecting Data
Space Utilization and Analysis maintains an annually updated, computer-based facilities inventory of each institution included in the study. A facilities inventory is comprised of a Building Characteristic Report and a Room Characteristic Report. The Building Characteristic Report lists and provides detailed information about each building on an institution's campus. The Room Characteristic Report lists every room in each building and provides information about its size and capacity. Each room is also coded to reflect its use and the institutional programs which it supports.
Each fall every institution submits a file with a list of changes in its facilities inventory occurring since the previous fall. Beginning in fall 2007, community colleges, private institutions, and a number of UNC institutions began reporting inventory changes via a web based system named DAVE (Data Additions Validations Edits). This reporting system is based on the physical inventory of each campus that has been made interactive on the web. Institutions with computer assisted facilities management systems continue to report room inventory changes from the output of these systems.
2

Space utilization data are based on the annual submission by each institution of a list of its fall term courses. For each course, the institution provides information indicating when and where the class meets and the number of students enrolled. Institutions provide these data by E-mail, FTP or on the UNC-GA File server. Each institution's course data are run against its updated facilities inventory to generate the Instructional Space Utilization Report. This report indicates how effectively an institution uses its facilities and measures its need for classroom and laboratory space in relation to comparable institutions.
Schools which need help in updating their facilities inventory or compiling utilization data are provided technical assistance by the Space Utilization and Analysis staff. Questions are answered by telephone, or if a problem is particularly complex, a campus visit is arranged. The Space Utilization and Analysis staff also assists institutions by taking the measurements of new buildings for which the institutions have provided blueprints. For the past several years, because of improved in-house data processing capabilities, the Space Utilization and Analysis staff has provided data search services, software, special analyses, and facilities survey assistance to participating institutions making such special requests.
Both the facilities inventory updates and the utilization data from each school are reviewed carefully by the Space Utilization and Analysis staff. Extensive computer edits are also used as a means of ensuring accuracy and consistency. When problems are discovered, the institutions are contacted for additional information or corrections.
Every year each institution receives a PDF of its updated Building and Room Characteristic Reports and its Instructional Space Utilization Report. Also provided is one copy of the Building Data Summary Report, which analyzes in detail the institution's building data, and a number of statistical tables which describe the institution's assignable area and its accessible space in terms of their use and the programs to which they are assigned. The reports and tables are also supplied to the Finance Division of the University of North Carolina-General Administration (UNC constituent institutions only), and to the N.C. Community College System office (two-year public institutions only).
Limitations and Special Situations
This study contains reliable and useful information concerning the facilities of colleges and universities in North Carolina and their utilization for instructional purposes. It is important, however, to note two limitations in the data provided.
Although campus facilities would generally be viewed as including such assets as parking
lots, tennis courts, and radio control towers, this study is limited to data relating to buildings. For purposes of the study, a building is defined as any roofed structure. This definition includes trailers and other mobile units.
3

Because of technical problems in collecting course information from medical schools and related programs, utilization data are not supplied by the Division of Health Affairs at East Carolina University and the University of North Carolina at Chapel Hill, UNC Hospitals at Chapel Hill, or the North Carolina State University School of Veterinary Medicine. They are, therefore, excluded from most of the utilization tables. Separate enrollment figures are provided for these divisions, however, and Table 2 includes utilization data for the Veterinary School and the two Divisions of Health Affairs at public institutions (although these data are excluded from all totals).
Special situations exist at several institutions which can affect both the reporting and summarization of utilization data. These situations are described below to enable reviewers to make more accurate and fair comparisons among different institutions.
UNC School of the Arts instructs secondary school students as well as students at the college level. To reflect this fact, high school courses conducted at the campus were also considered in calculating student clock hours. The high school students were not included in the full-time equivalent enrollment figures for this institution, however. In Table 2, this has the effect of significantly underestimating the total utilization of academic space for the N.C. School of the Arts. It should also be noted that the programs conducted at the U.N.C. School of the Arts inherently require significantly more space per student than at other constituent institutions of the University of North Carolina. Comparisons of this institution's utilization with that of any other college or university would, therefore, be misleading.
N.C. State University and N.C. A&T State University similarly show an above-average square footage of academic facilities per FTE student (Table 2) and understated utilization of academic space in other tables. This is due to these institutions’ extensive instruction and research programs in Agriculture and Engineering, which require significantly more academic space per FTE student than is typical of other general academic programs.
As further clarification of institution groupings, graph references to "UNC Campuses" refer to the sixteen public Baccalaureate-granting institutions of the University of North Carolina. Table subtitles and graph legends for “Community Colleges” refer to the 58 Community Colleges of the North Carolina Community College system.
Facilities and utilization data for the North Carolina School of Science and Math (NCSSM) is
available in a separate report under the heading of Constituent High School. The data elements collected, formats maintained, and statistics generated for the Facilities Inventory and Utilization Study adhere very strongly to nationally developed standards and procedures for facilities inventory and utilization reporting. In the interests of state and national comparability and standardization, changes such as addition/omission of data items and format/master file rearrangement are not made by this central office to suit the special interests or needs of a particular campus.
4

Many North Carolina institutions accommodate these local information needs by including
additional data on campus-maintained files, in formats suitable to campus researchers and planners, as a supplement to facilities (national standard) data. This office does, however, provide the special request services mentioned above to all North Carolina institutions for all data maintained on the building, room, and utilization files. In addition, these services are provided to institutions which maintain supplemental or special campus information items when these data are provided with the request.
5

This Page Intentionally Left Blank
6

Appalachian Hall, Appalachian State University
This new 18,022 square foot facility seeks to maintain a stimulating and supportive
community for students. Living with other Honors students provides special opportunities for
project collaboration, studying together, and sharing intellectual and social growth. Special
speakers, discussion groups, and activities sponsored by the Appalachian Honors Association
(AHA) are hosted in The Honors College, which is housed in the $7.9 million academic wing
(Appalachian Hall) between the two residence halls (Cone and Summit), further contributing to
the sense of a learning community. Together the three buildings form the Brad and Carole
Wilson Honors and Engagement Community.
Utilization of Instructional Space
Capacity/Enrollment Ratio . . . . . . . . . . . . . . . . . . . . . . . . . . . . . . . . 9 Sq. Ft. Academic Facilities Per FTE Student . . . . . . . . . . . . . . . . . . 15 Room Hours of Instruction in Classroom . . . . . . . . . . . . . . . . . . . . . 20 Room Hours of Instruction in Class Laboratories . . . . . . . . . . . . . . . . . . . . . . . . . . . . . . . . . . . . . . . . . 24 Use of Student Stations in Classrooms . . . . . . . . . . . . . . . . . . . . . . 28 Use of Student Stations in Class Laboratories . . . . . . . . . . . . . . . . . . . . . . . . . . . . . . . . . . . . . . . . . 32 Percent Student Station Utilization . . . . . . . . . . . . . . . . . . . . . . . . . 36 Student Clock Hours of Instruction . . . . . . . . . . . . . . . . . . . . . . . . . 41 Space Factors . . . . . . . . . . . . . . . . . . . . . . . . . . . . . . . . . . . . . . . . . 44 Range of Space Utilization Indices . . . . . . . . . . . . . . . . . . . . . . . . . 48 Space Standards . . . . . . . . . . . . . . . . . . . . . . . . . . . . . . . . . . . . . . . 49 FTE Enrollments . . . . . . . . . . . . . . . . . . . . . . . . . . . . . . . . . . . . . . . 54
7

This Page Intentionally Left Blank
8

TABLE 1:
CAPACITY / ENROLLMENT RATIO
The capacity/enrollment ratio, often referred to as the C/E ratio, is the amount of
instructional and library space on campus divided by the total fall term student clock hours of
that institution. The C/E ratio relates the amount of space directly used in an institution's
instructional programs to the instructional activity of the campus. It is one of the most
commonly used indices of instructional utilization of institutional facilities.
In analyzing and comparing the capacity/enrollment ratios, it should be kept in mind that
a relatively low ratio generally indicates a high level of space utilization. It should also be noted,
however, that such factors as the level of an institution and the kind of instructional programs
that it offers will affect the amount of space required and, therefore, the C/E ratio. The
capacity/enrollment ratio for all institutions of higher education in North Carolina has been
between four and five for many years, but the graph on page 11 confirms that this ratio varies
widely by type of institution.
Instructional and Library Space
Instructional and library space is defined in terms of program codes (pages 65-66, 71-73,
78-79, 82-83, 86-87) and room use codes (pp. 91-92). It is the sum of the areas of all rooms
which carry both a program designation of 11-18 (Instruction), 41 (Library Services), or 01
(Unassigned, Capable of Use), and one of the room use codes listed below, with the exception
that office space is omitted from program 01:
110 Classroom 410 Study Room
115 Classroom Service 420 Stack
430 Open-Stack Study Room
440 Processing Room 210 Class Laboratory
215 Class Laboratory Service 455 Study Service
220 Open Laboratory 510 Armory
225 Open Lab Service 515 Armory Service
310 Office 520 Athletic or Physical Ed.
315 Office Service 525 Athletic or Physical Ed. Svc.
9

Student Clock Hours
Student clock hours is a measurement of the total weekly hours of scheduled instruction
for all of an institution's students. It is computed for each course by multiplying the number of
times the course meets each week by the number of hours of each course meeting (rounded to the
half hour), and multiplying that product by the number of students. Thus, if a course with 20
students meets Tuesdays and Thursdays from 9:00 a.m. until 10:30 a.m., the number of student
clock hours resulting from that class would be 60 (2 meetings/week x 1.5 hours/meeting x 20
students).
The student clock hours reported in this study are based upon on-campus courses, both
credit and non-credit, which were in progress during the week following the drop-add period of
the fall term and which lasted for at least eight weeks. More detailed student clock hour data are
provided in Table 8.
CAPACITY/ENROLLMENT RATIO = INSTRUCTIONAL & LIBRARY SPACE
TOTAL WEEKLY STUDENT CLOCK HOURS
10

Capacity / Enrollment Ratio
11
C/ERatio
3.9
3.9
4.1
4.3
4.6
4.0
4.1
4.3
4.3
4.4
6.2
6.5
6.3
6.2
6.5NC
Prv
tU
NC
Cam
puse
sN
CC
C
2009
2010
2011
2012
2013
2009
2010
2011
2012
2013
2009
2010
2011
2012
2013
0.0 1.0 2.0 3.0 4.0 5.0 6.0 7.0
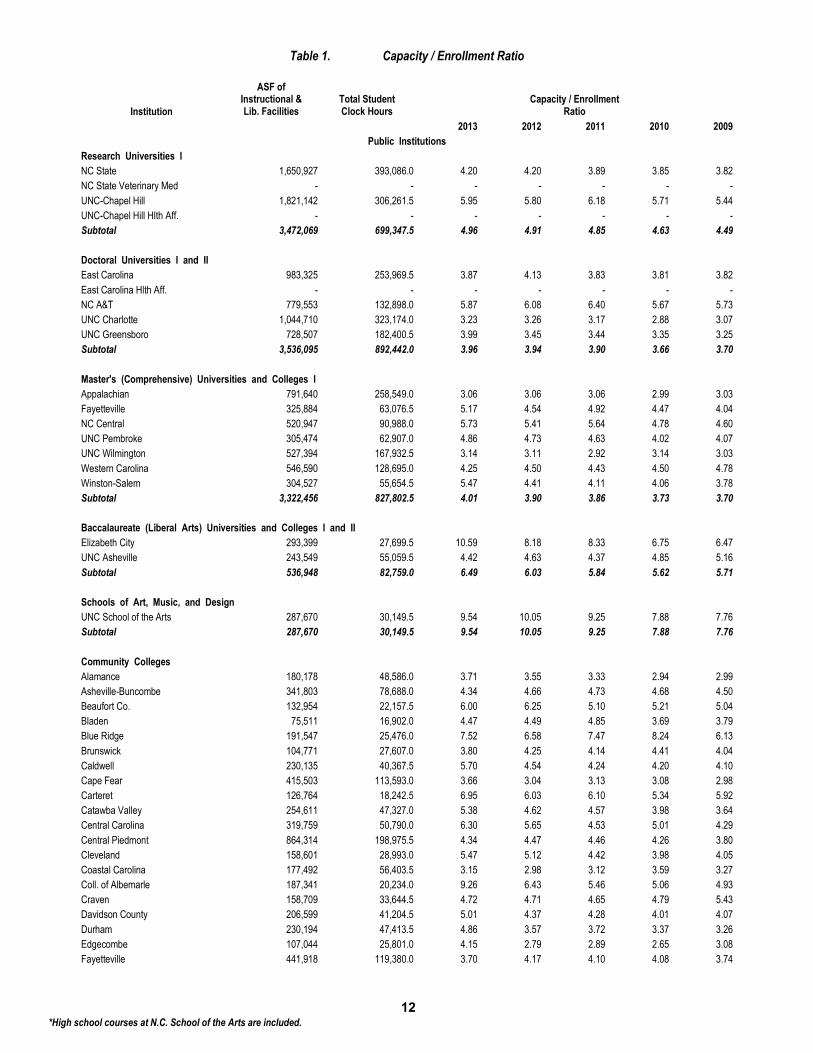
Table 1. Capacity / Enrollment Ratio
12*High school courses at N.C. School of the Arts are included.
Institution
ASF of Instructional & Lib. Facilities
Total Student Clock Hours
Capacity / Enrollment Ratio
2013 2012 2011 2010 2009
Public Institutions
Research Universities I
NC State 1,650,927 393,086.0 4.20 4.20 3.89 3.85 3.82
NC State Veterinary Med - - - - - - -
UNC-Chapel Hill 1,821,142 306,261.5 5.95 5.80 6.18 5.71 5.44
UNC-Chapel Hill Hlth Aff. - - - - - - -
Subtotal 3,472,069 699,347.5 4.96 4.91 4.85 4.63 4.49
Doctoral Universities I and II
East Carolina 983,325 253,969.5 3.87 4.13 3.83 3.81 3.82
East Carolina Hlth Aff. - - - - - - -
NC A&T 779,553 132,898.0 5.87 6.08 6.40 5.67 5.73
UNC Charlotte 1,044,710 323,174.0 3.23 3.26 3.17 2.88 3.07
UNC Greensboro 728,507 182,400.5 3.99 3.45 3.44 3.35 3.25
Subtotal 3,536,095 892,442.0 3.96 3.94 3.90 3.66 3.70
Master's (Comprehensive) Universities and Colleges I
Appalachian 791,640 258,549.0 3.06 3.06 3.06 2.99 3.03
Fayetteville 325,884 63,076.5 5.17 4.54 4.92 4.47 4.04
NC Central 520,947 90,988.0 5.73 5.41 5.64 4.78 4.60
UNC Pembroke 305,474 62,907.0 4.86 4.73 4.63 4.02 4.07
UNC Wilmington 527,394 167,932.5 3.14 3.11 2.92 3.14 3.03
Western Carolina 546,590 128,695.0 4.25 4.50 4.43 4.50 4.78
Winston-Salem 304,527 55,654.5 5.47 4.41 4.11 4.06 3.78
Subtotal 3,322,456 827,802.5 4.01 3.90 3.86 3.73 3.70
Baccalaureate (Liberal Arts) Universities and Colleges I and II
Elizabeth City 293,399 27,699.5 10.59 8.18 8.33 6.75 6.47
UNC Asheville 243,549 55,059.5 4.42 4.63 4.37 4.85 5.16
Subtotal 536,948 82,759.0 6.49 6.03 5.84 5.62 5.71
Schools of Art, Music, and Design
UNC School of the Arts 287,670 30,149.5 9.54 10.05 9.25 7.88 7.76
Subtotal 287,670 30,149.5 9.54 10.05 9.25 7.88 7.76
Community Colleges
Alamance 180,178 48,586.0 3.71 3.55 3.33 2.94 2.99
Asheville-Buncombe 341,803 78,688.0 4.34 4.66 4.73 4.68 4.50
Beaufort Co. 132,954 22,157.5 6.00 6.25 5.10 5.21 5.04
Bladen 75,511 16,902.0 4.47 4.49 4.85 3.69 3.79
Blue Ridge 191,547 25,476.0 7.52 6.58 7.47 8.24 6.13
Brunswick 104,771 27,607.0 3.80 4.25 4.14 4.41 4.04
Caldwell 230,135 40,367.5 5.70 4.54 4.24 4.20 4.10
Cape Fear 415,503 113,593.0 3.66 3.04 3.13 3.08 2.98
Carteret 126,764 18,242.5 6.95 6.03 6.10 5.34 5.92
Catawba Valley 254,611 47,327.0 5.38 4.62 4.57 3.98 3.64
Central Carolina 319,759 50,790.0 6.30 5.65 4.53 5.01 4.29
Central Piedmont 864,314 198,975.5 4.34 4.47 4.46 4.26 3.80
Cleveland 158,601 28,993.0 5.47 5.12 4.42 3.98 4.05
Coastal Carolina 177,492 56,403.5 3.15 2.98 3.12 3.59 3.27
Coll. of Albemarle 187,341 20,234.0 9.26 6.43 5.46 5.06 4.93
Craven 158,709 33,644.5 4.72 4.71 4.65 4.79 5.43
Davidson County 206,599 41,204.5 5.01 4.37 4.28 4.01 4.07
Durham 230,194 47,413.5 4.86 3.57 3.72 3.37 3.26
Edgecombe 107,044 25,801.0 4.15 2.79 2.89 2.65 3.08
Fayetteville 441,918 119,380.0 3.70 4.17 4.10 4.08 3.74

Table 1. Capacity / Enrollment Ratio
13*High school courses at N.C. School of the Arts are included.
Institution
ASF of Instructional & Lib. Facilities
Total Student Clock Hours
Capacity / Enrollment Ratio
2013 2012 2011 2010 2009
Forsyth 439,761 105,134.0 4.18 3.85 3.06 3.23 3.26
Gaston 328,788 56,285.5 5.84 5.23 5.05 4.53 4.69
Guilford 575,902 165,956.5 3.47 3.51 3.39 3.06 3.15
Halifax 110,807 17,395.5 6.37 5.50 5.71 5.11 5.25
Haywood 163,252 19,972.5 8.17 6.84 7.69 6.75 7.16
Isothermal 165,597 22,468.5 7.37 5.80 5.47 4.43 4.23
James Sprunt 73,142 14,527.5 5.03 4.08 4.31 4.59 4.13
Johnston 221,404 44,222.5 5.01 4.40 4.26 4.05 5.03
Lenoir 219,956 36,340.5 6.05 5.63 5.00 4.82 4.59
Martin 82,091 14,365.5 5.71 5.23 5.03 5.67 7.60
Mayland 73,511 11,426.5 6.43 5.53 5.50 5.27 4.71
McDowell 73,491 13,429.0 5.47 4.65 4.84 4.63 4.81
Mitchell 169,809 39,481.5 4.30 3.75 3.54 3.24 3.53
Montgomery 68,261 9,374.5 7.28 6.87 6.43 6.04 6.03
Nash 123,258 34,279.0 3.60 3.61 3.17 3.51 3.07
Pamlico 34,705 3,135.5 11.07 9.81 10.30 7.82 7.55
Piedmont 89,352 16,349.0 5.47 4.67 3.96 3.27 3.35
Pitt 284,880 87,772.5 3.25 3.08 2.42 2.49 2.38
Randolph 190,911 29,618.0 6.45 5.27 5.14 4.31 4.55
Richmond 101,602 27,203.5 3.73 3.81 3.59 3.65 3.91
Roanoke-Chowan 60,005 15,263.0 3.93 3.94 5.48 5.07 5.35
Robeson 129,107 38,179.5 3.38 3.40 2.97 2.73 2.60
Rockingham 158,350 26,005.0 6.09 5.24 5.23 5.10 4.83
Rowan-Cabarrus 237,803 68,577.5 3.47 3.61 3.22 2.83 2.60
Sampson 96,583 21,566.5 4.48 4.32 4.49 4.00 4.36
Sandhills 226,674 46,603.0 4.86 4.36 3.87 4.17 4.06
South Piedmont 122,123 21,925.5 5.57 5.19 5.13 3.39 3.52
Southeastern 122,784 15,144.0 8.11 6.47 6.12 6.31 5.13
Southwestern 131,725 23,220.5 5.67 4.64 5.40 4.74 4.60
Stanly 98,606 18,425.5 5.35 4.27 4.35 4.19 3.70
Surry 245,940 48,832.5 5.04 4.86 5.00 4.46 4.50
Tri-County 80,805 14,861.0 5.44 7.33 6.42 6.10 6.53
Vance-Granville 158,644 37,712.0 4.21 3.89 4.04 4.22 3.84
Wake 616,929 188,355.0 3.28 3.16 2.85 3.04 3.12
Wayne 164,439 38,301.5 4.29 3.89 3.92 4.10 4.11
Western Piedmont 166,129 27,436.5 6.06 5.11 4.24 4.07 4.00
Wilkes 172,740 37,816.0 4.57 4.71 4.80 4.29 4.21
Wilson 101,938 20,323.0 5.02 5.01 6.03 4.89 4.74
Subtotal 11,587,552 2,539,071.0 4.56 4.26 4.09 3.93 3.86
Private Institutions
NC Private Universities
Barton 126,900 16,360.0 7.76 7.94 8.08 8.37 8.27
Campbell 331,772 64,364.5 5.15 4.54 4.52 4.65 4.14
Mars Hill 177,664 21,847.0 8.13 8.55 9.26 10.20 9.59
Pfeiffer 119,318 13,036.0 9.15 8.99 8.78 8.51 9.04
Subtotal 755,654 115,607.5 6.54 6.22 6.29 6.54 6.20
Grand Total 23,498,444 5,187,179.0 4.53 4.34 4.23 4.05 4.00

This Page Intentionally Left Blank
14

TABLE 2:
SQUARE FEET OF ACADEMIC FACILITIES
PER FTE STUDENT
The ratio of an institution's square footage of academic facilities to its full-time
equivalent enrollment represents an important index of the instructional utilization of campus
facilities. It was first used by the U. S. Office of Education as a planning standard in the 1960s.
In 1969, the Office of Education published an extensive study entitled Federal Support for
Higher Education Construction: Current Programs and Future Needs which provided normative
figures by level and control of institution. The figures, which are still widely used in
determining facilities needs, can be summarized as follows:
Institutional Level Public Private Total
University 132 150 136
Four-year 93 103 98
Two-year 70 75 70
All Institutions 103 115 107
There is currently much national interest in updating these norms through a new national survey
of higher education facilities.
Academic Facilities
"Academic facilities" is a broader concept than "instructional and library space" (page 9).
In general terms, it includes all space used for instruction, research, and the administration or
support of instruction or research.
Academic facilities can be more precisely defined in terms of program codes (pages 65-
66, 71-73, 78-79, 82-83, 86-87) and room use codes (pp. 91-93). The term refers to an
institution's total assignable area (page 61) less the square footage of all rooms bearing program
codes 42 (Museums and Galleries), 52 (Social and Cultural Development), 55 (Student Auxiliary
Services), 56 (Intercollegiate Athletics), 65 (Faculty and Staff Auxiliary Services), 66 (Public
Relations/Development), 91-92 (Independent Operations), and 02 (Incapable of Use). In
addition, space with program code 63 (General Administration and Logistical Service) is deleted
if it also has room use code 750 (Central Service), 755 (Central Service Support), 760
(Hazardous Materials), 770 (Hazardous Waste Storage), or 775 (Hazardous Waste Service).
Space with program 01 (Unassigned, Capable of Use) and any of the following room use codes
is also excluded from academic facilities: 523 (Athletic Facilities Spectator Seating), 630 (Food
Facility), 635 (Food Facility Service), 660 (Merchandising), 665 (Merchandising Service), 750
(Central Service), 755 (Central Service Support), 760 (Hazardous Materials Storage), 770
(Hazardous Waste Storage), 775 (Hazardous Waste Service) all of the 800s (Health Care
Facilities), and all of the 900s (Residential Facilities).
15

FTE Enrollment
Full-time equivalent (FTE) enrollment is computed by assigning a percentage to each
part-time student to reflect his/her course load and then adding the result to the total full-time
enrollment. FTE enrollment differs from the other frequently used standard for estimating
student populations, headcount enrollment, in that the latter treats full-time and part-time
students identically. A more detailed description of the procedure used in calculating FTE
enrollment can be found on page 54.
In this table, the FTE enrollments which are reported for the institutions of the
Community College System include only credit enrollment generated in all inventoried space.
Noncredit enrollment is not reflected in this table. Total FTE enrollments for these institutions--
which take into account all credit instruction regardless of where it is conducted--are not listed in
Table 2 because they are irrelevant to space utilization analysis. They are reported, however, in
the parenthesized figures of Table 12. Methods of FTE calculation for the constituent
institutions of both the University of North Carolina and Community College System are again
outlined on page 54.
SQ. FT. OF ACADEMIC FACILITIES PER FTE STUDENT =
SQUARE FEET OF ACADEMIC FACILITIES
FTE ENROLLMENT
16

Square Feet of Academic Facilities Per FTE Student
17
Sq. Ft./ FTE
83.1
82.0
84.7
90.7
96.7
107.3
108.2
110.6
114.0
114.8
113.0
110.9
107.2
108.4
110.6NC
Prv
tU
NC
Cam
puse
sN
CC
C
2009
2010
2011
2012
2013
2009
2010
2011
2012
2013
2009
2010
2011
2012
2013
0.0 20.0 40.0 60.0 80.0 100.0 120.0

***High school enrollment is excluded from this table, resulting in a significant understatement of the total utilization of academic facilities at NCSA.
**Agricultural programs at NC A&T require a significant amount of academic space. The 2013 figures for these programs are: ASF: 233,747; FTE: 784; ASF per FTE: 298. Figures for all other campus programs are:ASF: 1,307,682; FTE: 9,060; ASF per FTE: 144.
*Divisions of Health Affairs and NCSU Veterinary School are excluded from all totals.
***High school enrollment is excluded from this table, resulting in a significant understatement of the total utilization of academic facilities at NCSA.
**Agricultural programs at NC A&T require a significant amount of academic space. The 2013 figures for these programs are: ASF: 233,747; FTE: 784; ASF per FTE: 298. Figures for all other campus programs are:ASF: 1,307,682; FTE: 9,060; ASF per FTE: 144.
*Divisions of Health Affairs and NCSU Veterinary School are excluded from all totals.18
Table 2. Square Feet of Academic Facilities Per FTE Student
Institution
ASF ofAcademicFacilities
FTEEnrollment
Square Feet of Academic FacilitiesPer FTE Student
2013 2012 2011 2010 2009Public Institutions
Research Universities INC State 5,760,782 29,928 192 186 183 183 180NC State Veterinary Med 414,590 357 1,161 1,245 1,279 1,107 1,086UNC-Chapel Hill 3,651,042 22,266 164 163 155 153 154UNC-Chapel Hill Hlth Aff. 2,422,880 4,723 513 503 509 510 568
Subtotal* 9,411,824 52,194 180 176 171 170 169
1,507,895 21,840 69 73 68 67 69814,182 2,430 335 319 338 349 344
1,541,429 9,844 157 157 154 146 1441,720,082 23,975 72 73 70 67 69
Doctoral Universities I and IIEast CarolinaEast Carolina Hlth Aff.NC A&T**UNC CharlotteUNC Greensboro 1,454,210 16,195 90 86 82 80 77
Subtotal* 6,223,616 71,854 87 88 84 81 81
Master's (Comprehensive) Universities and Colleges IAppalachian 1,208,791 17,097 71 71 71 69 70Fayetteville 522,914 5,319 98 92 86 84 76NC Central 794,164 7,477 106 100 103 91 92UNC Pembroke 473,791 5,443 87 86 79 72 75UNC Wilmington 955,095 13,106 73 76 76 77 75Western Carolina 841,585 9,038 93 97 94 95 95Winston-Salem 489,280 5,036 97 92 80 78 75
Subtotal 5,285,620 62,516 85 84 82 79 78
Baccalaureate (Liberal Arts) Universities and Colleges I and IIElizabeth City 408,599 2,301 178 150 144 124 116UNC Asheville 403,886 3,442 117 123 115 121 125
Subtotal 812,485 5,743 141 135 128 122 121
Schools of Art, Music, and Design UNC School of the Arts*** 449,842 902 499 514 506 520 516
UNC Subtotal 22,183,387 193,209 115 114 111 108 107
Community CollegesAlamance 217,855 3,216 68 63 57 59 57Asheville-Buncombe 429,709 5,798 74 69 71 77 82Beaufort Co. 169,560 1,222 139 130 112 114 120Bladen 95,333 1,116 85 78 68 60 59Blue Ridge 231,598 1,430 162 162 149 144 138Brunswick 139,154 1,050 133 139 138 147 133Caldwell 280,461 2,404 117 95 89 92 89Cape Fear 548,653 6,468 85 67 64 62 65Carteret 155,881 938 166 146 144 134 132Catawba Valley 320,962 2,730 118 106 95 83 83Central Carolina 357,881 3,726 96 86 93 80 79Central Piedmont 1,156,353 10,490 110 110 100 99 90Cleveland 190,516 1,800 106 101 87 77 78Coastal Carolina 205,543 2,808 73 72 72 67 69Coll. of Albemarle 256,700 1,220 210 193 155 151 150Craven 191,256 1,820 105 108 97 94 102Davidson County 282,287 3,220 88 85 82 78 78

***High school enrollment is excluded from this table, resulting in a significant understatement of the total utilization of academic facilities at NCSA.
**Agricultural programs at NC A&T require a significant amount of academic space. The 2013 figures for these programs are: ASF: 233,747; FTE: 784; ASF per FTE: 298. Figures for all other campus programs are:ASF: 1,307,682; FTE: 9,060; ASF per FTE: 144.
*Divisions of Health Affairs and NCSU Veterinary School are excluded from all totals.19
Table 2. Square Feet of Academic Facilities Per FTE Student
Institution
ASF ofAcademicFacilities
FTEEnrollment
Square Feet of Academic FacilitiesPer FTE Student
2013 2012 2011 2010 2009Durham 322,491 3,064 105 100 103 92 91Edgecombe 148,024 1,556 95 87 81 72 78Fayetteville 582,426 9,000 65 64 63 67 67Forsyth 596,390 6,628 90 78 60 63 64Gaston 410,847 4,624 89 88 86 76 75Guilford 751,209 8,404 89 77 70 70 77Halifax 164,887 810 204 167 150 140 141Haywood 197,597 1,106 179 165 157 134 168Isothermal 224,463 1,338 168 138 130 109 105James Sprunt 108,263 1,124 96 84 93 99 89Johnston 291,670 2,578 113 110 103 94 105Lenoir 263,517 2,288 115 115 103 94 97Martin 104,352 632 165 161 147 152 157Mayland 93,033 776 120 114 114 112 125McDowell 100,311 964 104 92 92 77 85Mitchell 219,470 1,854 118 109 94 88 92Montgomery 80,700 658 123 118 123 115 117Nash 147,123 2,100 70 72 66 62 70Pamlico 51,918 78 666 618 351 295 231Piedmont 129,279 1,230 105 92 73 64 62Pitt 346,398 6,892 50 50 40 40 42Randolph 249,986 1,746 143 136 129 119 132Richmond 154,363 1,846 84 82 85 94 98Roanoke-Chowan 79,931 568 141 139 123 135 146Robeson 163,247 1,914 85 66 68 70 66Rockingham 195,676 1,618 121 125 107 99 100Rowan-Cabarrus 328,025 3,714 88 86 74 68 57Sampson 117,946 1,092 108 109 103 95 97Sandhills 266,268 2,486 107 100 87 82 82South Piedmont 180,293 1,058 170 164 142 123 138Southeastern 159,224 928 172 138 121 118 99Southwestern 175,853 1,298 135 127 114 105 110Stanly 127,699 1,986 64 61 55 55 55Surry 284,274 2,750 103 101 98 88 87Tri-County 110,340 588 188 164 153 141 144Vance-Granville 228,675 2,802 82 79 73 74 75Wake 744,417 11,074 67 66 60 63 66Wayne 222,706 3,020 74 75 74 74 79Western Piedmont 242,917 1,678 145 137 113 108 103Wilkes 225,958 2,326 97 99 97 87 86Wilson 124,554 932 134 132 134 114 115
Subtotal 14,946,422 154,584 97 91 85 82 83
Private InstitutionsNC Private Universities
Barton 174,428 976 179 178 163 168 172Campbell 463,634 5,617 83 76 76 80 84Mars Hill 229,046 1,389 165 180 192 210 200Pfeiffer 188,963 1,568 121 117 109 106 104
Subtotal 1,056,071 9,550 111 108 107 111 113
Grand Total 38,185,880 357,343 107 104 99 96 97

TABLE 3:
AVERAGE WEEKLY ROOM HOURS OF INSTRUCTION
IN CLASSROOMS
The average weekly room hours of instruction in classrooms is calculated by dividing the
total room hours of instruction in classrooms by the total number of classrooms. In more general
terms, it is the average number of hours that an institution's classrooms are used for instructional
purposes each week. Weekly room hours of instruction is also referred to as the Room
Utilization Rate (RUR).
The total room hours of instruction in classrooms is the number of hours each week that
each classroom is used for regularly scheduled classes. Thus, a classroom which is used
Mondays, Wednesdays, and Fridays from 9:00 a.m. until 1:00 p.m. and on Tuesdays and
Thursdays from 8:30 a.m. until noon would generate 19 room hours (4 hours/day x 3 days/week
+ 3.5 hours/day x 2 days/week). Table 3 indicates the total room hours of instruction in
classrooms; the total number of classrooms can be found in Table 16.
For purposes of this study, a classroom is defined as a room used to conduct classes that
do not require special-purpose equipment for student use. Thus, a classroom is by definition a
general use facility which could be used for teaching the lecture portion of any course. If a
room is used for regularly scheduled classes but has special equipment which ties it to a
particular subject matter, then the room is a class laboratory and its use would not be taken into
account in this table.
Table 3 separates average weekly room hours of instruction in classrooms into daytime
and nighttime utilizations. Daytime utilization is based on all classes with beginning times
between and including 5:00 a.m. and 4:59 p.m.; nighttime utilization is based on all other classes.
The "All Hours" section of Table 3 indicates the sum of the daytime and nighttime figures for the
last five years.
The average weekly room hours of classroom instruction can serve as an indicator of the
adequacy of the number of classrooms at an institution. The University of North Carolina
standard is 35 hours of instruction in classrooms per week, but the institutions in North Carolina
and in many other states average significantly fewer hours.
AVG. WEEKLY ROOM HOURS OF INSTRUCTION IN CLASSROOMS =
TOTAL ROOM HOURS OF INSTRUCTION IN CLASSROOMS
TOTAL NUMBER OF CLASSROOMS
20

Average Weekly Room Hours of Instruction In Classrooms
21
Day Night
13.5
3.4
14.1
3.7
14.5
4.0
14.7
4.1
14.3
4.2
23.4
3.1
23.5
3.2
23.3
3.2
24.2
3.5
23.8
3.4
13.6
2.4
14.3
2.3
14.0
2.3
14.0
2.4
13.6
2.1
0.0
4.0
8.0
12.0
16.0
20.0
24.0
28.0
32.0
NC CC UNC Campuses NC Prvt
2013 2012 2011 2010 2009 2013 2012 2011 2010 2009 2013 2012 2011 2010 2009

22
Table 3. Average Weekly Room Hours of Instruction in Classrooms
InstitutionTotal Room
Hours
AverageDaytimeHours
AverageNighttime
Hours All Hours2013 2012 2011 2010 2009
Public InstitutionsResearch Universities I
NC State 7,328.0 28.3 2.5 30.8 29.9 29.3 28.2 28.0UNC-Chapel Hill 7,868.0 25.0 1.9 26.9 26.8 24.0 24.5 24.7Subtotal 15,196.0 26.5 2.2 28.7 28.1 26.3 26.2 26.2
Doctoral Universities I and IIEast Carolina 5,601.5 25.1 2.0 27.1 27.1 27.9 28.7 27.9NC A&T 3,719.5 21.1 3.0 24.1 23.6 19.8 21.5 21.1UNC Charlotte 6,553.0 24.1 6.4 30.5 30.2 31.1 31.4 29.4UNC Greensboro 4,413.5 26.0 4.0 30.0 32.2 32.5 36.6 36.4Subtotal 20,287.5 24.1 3.9 28.0 28.3 27.6 29.2 28.2
Master's (Comprehensive) Universities and Colleges IAppalachian 6,207.0 27.5 2.8 30.3 31.0 30.4 32.1 30.9Fayetteville 1,972.0 24.1 6.2 30.3 33.1 28.4 34.3 33.8NC Central 2,693.0 16.3 2.6 18.9 19.2 20.2 22.3 22.5UNC Pembroke 2,414.0 19.3 3.7 23.0 23.3 24.7 28.3 28.2UNC Wilmington 4,587.0 23.7 3.0 26.7 27.3 28.9 29.2 31.4Western Carolina 3,218.5 25.2 2.8 28.0 26.0 28.2 29.0 26.7Winston-Salem 2,030.0 20.3 3.9 24.2 29.7 31.4 30.4 28.6Subtotal 23,121.5 22.8 3.3 26.1 26.8 27.5 29.1 28.7
Baccalaureate (Liberal Arts) Universities and Colleges I and IIElizabeth City 898.5 9.7 1.2 10.9 13.9 15.4 16.5 16.0UNC Asheville 1,567.0 26.4 2.1 28.5 25.8 29.0 30.2 30.8Subtotal 2,465.5 16.3 1.5 17.8 19.2 21.8 23.0 23.1
Schools of Art, Music, and DesignUNC School of the Arts 599.0 10.8 0.5 11.3 11.7 11.6 10.2 11.2Subtotal 599.0 10.8 0.5 11.3 11.7 11.6 10.2 11.2
Community CollegesAlamance 1,961.0 15.1 4.3 19.4 18.9 19.5 20.2 17.5Asheville-Buncombe 2,125.5 15.6 3.2 18.8 15.7 18.2 20.8 20.7Beaufort Co. 892.5 12.1 2.3 14.4 13.1 15.1 16.1 13.3Bladen 753.5 14.0 4.0 18.0 18.3 18.5 19.2 17.4Blue Ridge 1,242.5 11.9 4.4 16.3 15.9 15.9 14.9 16.5Brunswick 1,246.0 15.9 3.0 18.9 17.9 20.3 15.9 16.9Caldwell 1,526.5 12.2 2.6 14.8 17.6 17.3 18.3 16.1Cape Fear 3,260.5 18.5 5.9 24.4 26.4 26.2 27.6 27.3Carteret 935.5 10.1 4.7 14.8 14.6 14.1 15.4 13.5Catawba Valley 1,379.5 13.4 3.0 16.4 18.1 20.6 21.0 24.6Central Carolina 2,005.5 8.8 2.3 11.1 11.7 14.4 13.4 14.9Central Piedmont 7,125.5 14.6 4.3 18.9 19.8 17.8 18.5 20.2Cleveland 994.5 11.5 3.8 15.3 16.0 19.9 22.4 21.4Coastal Carolina 1,858.0 16.4 3.8 20.2 23.9 22.1 21.3 19.9Coll. of Albemarle 620.0 7.3 1.6 8.9 11.8 16.0 13.3 11.9Craven 1,267.0 12.7 3.1 15.8 15.6 16.4 17.8 12.3Davidson County 1,267.0 12.9 1.2 14.1 15.0 14.3 15.0 15.0Durham 1,443.0 9.3 2.8 12.1 17.5 17.4 18.6 20.9Edgecombe 896.0 10.9 2.6 13.5 18.3 20.0 19.2 15.9Fayetteville 3,824.0 14.4 3.0 17.4 16.4 18.4 18.1 18.7Forsyth 3,607.0 13.6 3.8 17.4 21.1 23.3 23.8 22.8Gaston 1,728.5 10.3 2.8 13.1 14.5 16.5 19.3 16.8Guilford 5,569.0 15.9 4.2 20.1 19.9 20.8 22.2 20.2Halifax 766.5 13.6 2.7 16.3 15.3 15.5 15.2 14.2Haywood 584.0 11.1 2.1 13.2 14.8 12.9 15.9 13.5Isothermal 579.0 7.5 1.6 9.1 10.1 12.3 13.0 13.9James Sprunt 625.5 12.5 3.2 15.7 16.7 14.8 16.8 16.6

23
Table 3. Average Weekly Room Hours of Instruction in Classrooms
InstitutionTotal Room
Hours
AverageDaytimeHours
AverageNighttime
Hours All Hours2013 2012 2011 2010 2009
Johnston 1,621.0 12.0 2.5 14.5 15.5 16.0 14.8 12.8Lenoir 1,486.0 12.4 2.5 14.9 14.8 14.4 13.4 14.7Martin 361.0 10.3 2.1 12.4 17.9 19.5 16.2 13.8Mayland 562.5 9.7 2.8 12.5 15.2 15.4 16.1 16.0McDowell 553.0 11.4 4.0 15.4 15.1 13.1 8.8 9.3Mitchell 1,507.5 11.6 3.0 14.6 16.4 15.3 17.3 15.8Montgomery 473.5 12.4 5.1 17.5 18.6 18.7 17.9 17.4Nash 1,240.0 16.0 4.3 20.3 20.9 23.8 21.6 22.8Pamlico 236.0 8.2 3.0 11.2 10.6 10.6 12.7 13.2Piedmont 788.5 11.8 3.3 15.1 16.5 17.8 20.7 22.0Pitt 2,743.5 21.8 6.2 28.0 29.2 33.8 33.7 33.5Randolph 1,060.0 9.0 2.2 11.2 14.7 16.4 19.4 18.2Richmond 1,051.5 16.2 4.8 21.0 21.2 15.0 14.8 18.9Roanoke-Chowan 495.0 11.1 3.9 15.0 16.4 11.4 14.6 15.5Robeson 984.5 15.8 4.3 20.1 19.1 21.1 23.7 24.9Rockingham 794.0 14.0 2.5 16.5 21.5 19.5 20.2 18.7Rowan-Cabarrus 2,656.5 17.4 6.8 24.2 22.6 25.2 21.5 26.6Sampson 743.0 13.3 4.4 17.7 19.1 17.8 18.2 16.4Sandhills 1,742.0 13.3 2.7 16.0 17.3 20.1 17.6 19.0South Piedmont 773.5 10.4 2.5 12.9 15.5 14.4 18.6 19.5Southeastern 553.5 8.6 1.7 10.3 13.0 14.3 11.5 12.2Southwestern 1,003.0 16.3 1.3 17.6 19.0 18.2 19.2 19.8Stanly 799.5 13.9 2.1 16.0 18.2 17.2 14.3 18.1Surry 1,602.0 13.0 2.4 15.4 16.8 15.5 17.7 16.3Tri-County 617.0 10.4 3.6 14.0 11.3 12.5 12.6 10.8Vance-Granville 1,343.0 16.0 4.3 20.3 18.2 18.2 16.0 16.5Wake 5,119.5 18.0 4.3 22.3 20.8 24.1 22.6 22.9Wayne 934.0 14.4 2.6 17.0 16.5 17.7 15.1 15.1Western Piedmont 946.5 12.9 3.2 16.1 18.6 23.5 24.0 22.5Wilkes 1,531.0 13.3 2.7 16.0 17.3 17.8 19.3 19.1Wilson 695.0 9.9 2.7 12.6 13.5 12.9 14.2 17.3Subtotal 87,099.5 13.5 3.4 16.9 17.8 18.5 18.8 18.5
Private InstitutionsNC Private Universities
Barton 695.5 14.7 2.7 17.4 17.0 16.4 17.1 16.2Campbell 1,682.0 15.6 2.1 17.7 18.8 18.7 18.8 17.6Mars Hill 1,036.0 13.5 2.5 16.0 16.9 14.8 13.8 14.5Pfeiffer 589.5 9.2 2.6 11.8 12.0 13.4 14.4 13.0Subtotal 4,003.0 13.6 2.4 16.0 16.6 16.3 16.4 15.7
Grand Total 152,772.0 16.5 3.3 19.8 20.5 20.9 21.3 21.1

TABLE 4:
AVERAGE WEEKLY ROOM HOURS OF INSTRUCTION
IN CLASS LABORATORIES
The average weekly room hours of instruction in class laboratories is calculated by
dividing the total room hours of instruction in class laboratories by the total number of class
laboratories. In more general terms, it is the average number of hours that an institution's class
laboratories are used for instructional purposes each week. Weekly room hours of instruction is
also referred to as the Room Utilization Rate (RUR).
The total room hours of instruction in class laboratories is the number of hours each week
that each class laboratory is used for regularly scheduled classes. This figure is provided in
Table 4; the total number of class laboratories can be found in Table 17. Table 4 also separates
the average room hour data into daytime and nighttime uses of class laboratories. For specific
definitions of "daytime" and "nighttime," and for a more detailed explanation of the calculation
of total room hours, see page 20.
For purposes of this study, a class laboratory is defined as a room used primarily for
regularly scheduled classes that require special-purpose equipment for student participation,
experimentation, observation, or practice in a field of study. This definition excludes rooms used
for regularly scheduled classes which have no special-purpose equipment (i.e., classrooms) and
also excludes rooms with special-purpose equipment which are not used for regularly scheduled
classes (i.e., other kinds of laboratories).
Table 4 can provide some indication of the adequacy of the number of class laboratories
at a particular institution. Unfortunately, since the data reflect the utilization of all class
laboratories, it is impossible to determine whether an institution's shortage (or surplus) of these
rooms is limited to certain types or is "across the board." In such cases, an institution might be
able to make a more useful measurement by determining the average weekly use of each type of
class laboratory.
Because each class laboratory is designed for use in a particular field of study, most of
them are not used as frequently as classrooms. The University of North Carolina standard for
the average use of class laboratories is 20 hours per week. Many of the institutions of the
Community College System approach or exceed this figure, at least in part because of the
technical nature of most of their instructional programs. The other colleges and universities in
North Carolina generally fall well below this norm.
AVG. WEEKLY ROOM HOURS OF INSTRUCTION IN CLASS LABORATORIES =
TOTAL ROOM HOURS OF INSTRUCTION IN CLASS LABORATORIES
TOTAL NUMBER OF CLASS LABORATORIES
24

Average Weekly Room Hours of Instruction In Laboratories
25
Day Night
11.3
2.9
11.9
3.2
12.0
3.1
12.4
3.3
12.1
3.3
12.5
1.7
12.9
1.9
11.5
1.6
12.0
1.8
11.6
1.7
8.5
0.99.0
1.0
9.0
1.0
8.1
1.0
8.1
1.2
0.0
2.0
4.0
6.0
8.0
10.0
12.0
14.0
16.0
18.0
NC CC UNC Campuses NC Prvt
2013 2012 2011 2010 2009 2013 2012 2011 2010 2009 2013 2012 2011 2010 2009

26
Table 4. Average Weekly Room Hours of Instruction in Class Laboratories
InstitutionTotal Room
Hours
AverageDaytimeHours
AverageNighttime
Hours All Hours2013 2012 2011 2010 2009
Public InstitutionsResearch Universities I
NC State 3,218.5 11.4 1.0 12.4 11.5 12.5 12.6 13.1UNC-Chapel Hill 1,168.5 9.9 1.6 11.5 13.9 9.3 9.5 9.5Subtotal 4,387.0 11.0 1.2 12.2 12.1 11.4 11.6 12.0
Doctoral Universities I and IIEast Carolina 2,305.5 13.7 1.9 15.6 14.3 14.4 16.2 16.0NC A&T 1,222.5 12.9 1.6 14.5 14.0 5.3 6.2 5.8UNC Charlotte 2,467.5 13.1 2.5 15.6 16.7 16.7 16.3 15.1UNC Greensboro 1,450.5 18.8 2.2 21.0 24.0 16.7 16.9 17.9Subtotal 7,446.0 14.1 2.1 16.2 16.5 12.2 12.9 12.8
Master's (Comprehensive) Universities and Colleges IAppalachian 2,656.0 19.8 2.8 22.6 22.4 19.5 21.9 20.8Fayetteville 625.0 10.2 2.0 12.2 15.9 14.5 17.5 20.2NC Central 623.0 8.4 1.7 10.1 10.9 12.8 13.1 12.5UNC Pembroke 529.0 15.9 1.2 17.1 15.8 15.2 14.9 15.9UNC Wilmington 1,249.0 12.4 2.5 14.9 18.1 18.6 18.5 19.5Western Carolina 1,050.5 12.4 1.6 14.0 14.2 15.2 15.9 9.0Winston-Salem 638.5 8.7 1.1 9.8 12.5 13.2 13.6 11.5Subtotal 7,371.0 13.2 2.0 15.2 16.5 16.3 17.1 15.3
Baccalaureate (Liberal Arts) Universities and Colleges I and IIElizabeth City 544.0 7.4 0.8 8.2 8.9 8.5 9.3 10.1UNC Asheville 459.0 12.0 1.5 13.5 13.4 14.1 13.9 13.4Subtotal 1,003.0 9.0 1.0 10.0 10.7 10.7 11.1 11.5
Schools of Art, Music, and DesignUNC School of the Arts 778.0 9.9 1.7 11.6 11.3 12.2 15.2 14.5Subtotal 778.0 9.9 1.7 11.6 11.3 12.2 15.2 14.5
Community CollegesAlamance 916.5 13.6 3.0 16.6 16.3 17.4 19.2 17.5Asheville-Buncombe 1,867.0 14.2 3.4 17.6 17.9 16.3 16.2 18.5Beaufort Co. 337.0 8.7 1.8 10.5 13.8 14.7 16.2 14.4Bladen 364.0 10.2 5.7 15.9 19.2 12.4 20.2 14.3Blue Ridge 635.5 9.8 2.4 12.2 13.1 12.6 11.2 13.6Brunswick 328.0 15.1 3.2 18.3 18.9 15.8 17.7 16.9Caldwell 633.0 8.4 2.0 10.4 11.8 11.5 14.0 14.4Cape Fear 2,551.5 17.1 3.8 20.9 24.3 23.8 22.0 21.5Carteret 400.5 6.1 3.0 9.1 9.4 9.2 10.0 9.5Catawba Valley 1,258.5 11.9 2.1 14.0 16.0 15.3 17.7 17.4Central Carolina 962.5 7.2 1.6 8.8 10.3 10.2 11.2 12.8Central Piedmont 2,289.5 10.5 3.4 13.9 12.9 12.8 13.5 14.7Cleveland 865.5 8.8 3.6 12.4 14.1 14.0 14.4 14.6Coastal Carolina 1,216.5 18.8 2.1 20.9 22.1 21.4 20.5 18.5Coll. of Albemarle 496.0 6.0 1.3 7.3 9.6 12.4 9.8 9.6Craven 559.0 9.7 3.3 13.0 12.3 12.2 12.5 11.5Davidson County 602.0 8.6 1.6 10.2 14.7 13.0 13.3 14.4Durham 692.5 6.4 2.6 9.0 12.7 14.1 13.5 12.8Edgecombe 703.5 12.6 4.5 17.1 18.4 17.1 16.2 14.8Fayetteville 2,259.0 11.8 3.2 15.0 13.6 13.9 13.3 14.2Forsyth 1,958.0 13.0 4.0 17.0 17.8 20.1 19.2 17.4Gaston 920.5 9.8 3.4 13.2 14.1 14.1 15.4 14.1Guilford 1,876.0 8.6 2.5 11.1 10.0 11.7 10.4 10.5Halifax 386.0 12.3 1.0 13.3 12.9 14.9 15.4 13.2Haywood 887.5 10.6 2.1 12.7 12.5 11.4 12.9 15.3Isothermal 573.5 9.5 2.7 12.2 13.8 15.4 17.9 17.8James Sprunt 280.0 10.7 2.7 13.4 15.5 13.9 13.9 13.2

27
Table 4. Average Weekly Room Hours of Instruction in Class Laboratories
InstitutionTotal Room
Hours
AverageDaytimeHours
AverageNighttime
Hours All Hours2013 2012 2011 2010 2009
Johnston 643.5 9.8 2.1 11.9 10.6 12.8 13.0 11.4Lenoir 694.0 8.9 1.9 10.8 11.9 11.4 11.2 11.0Martin 411.0 14.6 1.8 16.4 15.1 16.7 16.6 13.0Mayland 181.0 8.4 2.3 10.7 12.7 10.2 12.9 15.5McDowell 493.0 15.4 6.0 21.4 22.3 20.4 23.8 20.3Mitchell 523.5 10.1 2.7 12.8 14.9 15.0 11.9 11.4Montgomery 386.0 16.7 6.0 22.7 20.8 19.9 19.6 20.5Nash 589.0 12.5 4.4 16.9 17.5 19.2 20.3 18.5Pamlico 154.0 7.6 3.4 11.0 11.0 9.5 12.3 13.1Piedmont 553.0 14.7 5.0 19.7 22.1 23.3 21.8 23.0Pitt 1,556.0 13.9 2.5 16.4 17.2 20.0 17.7 20.0Randolph 557.0 8.4 2.2 10.6 10.3 9.6 13.7 13.3Richmond 559.5 12.3 4.6 16.9 17.3 15.8 16.4 13.6Roanoke-Chowan 327.5 12.7 4.6 17.3 17.8 16.4 16.0 16.1Robeson 848.0 16.0 3.3 19.3 16.9 17.9 19.9 19.7Rockingham 483.0 8.3 2.2 10.5 11.9 11.7 11.9 9.8Rowan-Cabarrus 1,218.5 12.5 4.9 17.4 18.7 20.5 24.2 23.8Sampson 327.5 10.3 2.3 12.6 13.3 10.4 14.4 12.0Sandhills 565.5 8.6 1.3 9.9 11.3 12.3 12.2 12.8South Piedmont 555.0 12.8 2.2 15.0 14.5 15.1 16.4 16.5Southeastern 429.0 11.8 1.2 13.0 12.0 13.0 12.3 14.6Southwestern 631.0 11.2 2.2 13.4 15.1 15.4 16.1 17.4Stanly 438.0 12.9 2.7 15.6 18.6 13.5 20.0 18.1Surry 630.5 11.4 2.1 13.5 14.0 14.1 15.7 13.4Tri-County 475.5 12.5 2.9 15.4 16.0 16.3 18.5 16.4Vance-Granville 904.0 12.0 2.8 14.8 18.2 13.6 17.0 16.8Wake 2,880.0 13.9 3.4 17.3 19.0 19.7 19.8 18.0Wayne 890.0 13.3 2.6 15.9 17.2 16.2 15.8 18.3Western Piedmont 758.5 12.0 2.5 14.5 16.6 16.3 15.6 13.3Wilkes 781.5 13.8 2.5 16.3 15.1 14.9 13.1 14.8Wilson 548.0 12.4 4.7 17.1 15.5 13.6 16.7 15.5Subtotal 47,810.5 11.3 2.9 14.2 15.0 15.1 15.7 15.4
Private InstitutionsNC Private Universities
Barton 191.0 9.5 0.1 9.6 9.8 11.8 11.6 10.1Campbell 458.5 10.8 2.3 13.1 13.4 12.5 10.1 13.0Mars Hill 213.5 7.3 0.3 7.6 8.5 8.9 9.4 8.8Pfeiffer 129.5 5.5 0.3 5.8 7.1 6.0 5.7 -Subtotal 992.5 8.5 0.9 9.4 10.0 10.0 9.1 9.3
Grand Total 69,788.0 11.6 2.5 14.1 14.9 14.4 14.9 14.6

TABLE 5:
AVERAGE WEEKLY USE OF STUDENT STATIONS
IN CLASSROOMS
Average weekly use of student stations in classrooms is calculated by dividing the total
number of student clock hours generated in classrooms by the total number of student stations in
classrooms. More generally, it can be thought of as the average number of hours each week that
each classroom student station is used.
For the current year, Table 5 reports the total number of classroom student stations and
breaks down the average weekly use figure into daytime and nighttime utilizations. (See page 20
for precise definitions of classrooms and of daytime and nighttime utilizations.) For purposes of
comparison, this table also lists the average weekly use of student stations for the previous four
years.
The average weekly use of student stations can serve as an indicator of the adequacy of
the number of student stations in classrooms. A norm which has been frequently cited is 22.75
hours per week. This figure is based on the assumption that the average weekly use of
classrooms is 35 hours (see Table 3) and that there is 65% utilization of student stations when
classrooms are in use (Table 7). Most North Carolina colleges and universities fall considerably
below this norm, suggesting a surplus of classroom student stations.
AVERAGE WEEKLY USE OF STUDENT STATIONS IN CLASSROOMS =
TOTAL STUDENT CLOCK HOURS IN CLASSROOMS
TOTAL STUDENT STATIONS IN CLASSROOMS
28

Average Weekly Room Use of Student StationsIn Classrooms
29
Day Night
8.4
1.8
8.9
1.9
9.3
2.1
9.6
2.3
9.6
2.4
16.0
1.5
16.1
1.6
16.2
1.6
17.0
1.8
17.0
1.8
7.7
1.08.4
1.0
8.5
1.0
8.0
1.0
8.1
0.8
0.0
2.0
4.0
6.0
8.0
10.0
12.0
14.0
16.0
18.0
20.0
NC CC UNC Campuses NC Prvt
2013 2012 2011 2010 2009 2013 2012 2011 2010 2009 2013 2012 2011 2010 2009

30
Table 5. Average Weekly Use of Student Stations in Classrooms
InstitutionNo. of
StationsTotal StudentClock Hours
AverageDaytimeHours
AverageNighttime
Hours All Hours2013 2012 2011 2010 2009
Public InstitutionsResearch Universities I
NC State 14,735 298,001 19.1 1.1 20.2 20.7 20.6 20.1 19.8UNC-Chapel Hill 15,428 277,060 16.9 1.1 18.0 17.7 16.8 17.1 17.6Subtotal 30,163 575,061 18.0 1.1 19.1 19.1 18.7 18.6 18.8
Doctoral Universities I and IIEast Carolina 10,483 200,656 18.1 1.1 19.2 19.2 20.1 20.1 19.7NC A&T 7,248 98,940 12.4 1.2 13.6 13.3 12.5 13.8 13.2UNC Charlotte 12,420 268,102 18.0 3.6 21.6 20.5 20.0 23.0 22.2UNC Greensboro 8,698 148,339 15.4 1.7 17.1 18.8 19.5 22.3 22.7Subtotal 38,849 716,037 16.4 2.0 18.4 18.5 18.4 20.2 19.8
Master's (Comprehensive) Universities and Colleges IAppalachian 8,360 183,005 20.4 1.5 21.9 22.0 22.2 22.4 22.2Fayetteville 2,592 44,769 14.4 2.8 17.2 18.7 16.2 18.7 19.9NC Central 6,095 66,636 9.7 1.2 10.9 11.2 11.6 12.5 13.8UNC Pembroke 3,654 52,608 12.8 1.6 14.4 14.8 14.7 17.3 16.8UNC Wilmington 7,884 140,329 16.3 1.5 17.8 17.3 19.5 20.0 22.9Western Carolina 4,546 92,838 18.8 1.6 20.4 18.8 20.0 19.7 18.9Winston-Salem 3,581 39,495 9.7 1.4 11.1 14.2 15.4 15.2 16.1Subtotal 36,712 619,677 15.3 1.5 16.8 17.1 17.7 18.3 19.0
Baccalaureate (Liberal Arts) Universities and Colleges I and IIElizabeth City 3,319 16,873 4.7 0.4 5.1 7.1 8.4 10.1 9.8UNC Asheville 1,944 34,003 16.4 1.0 17.4 16.1 18.3 18.9 18.8Subtotal 5,263 50,876 9.0 0.6 9.6 10.8 12.5 13.8 13.6
Schools of Art, Music, and DesignUNC School of the Arts 1,253 7,909 6.2 0.2 6.4 6.7 7.5 7.0 7.8Subtotal 1,253 7,909 6.2 0.2 6.4 6.7 7.5 7.0 7.8
Community CollegesAlamance 3,122 34,745 8.8 2.3 11.1 12.2 12.4 13.9 12.1Asheville-Buncombe 3,449 42,250 10.3 1.9 12.2 11.7 12.4 12.9 13.1Beaufort Co. 2,443 15,876 5.5 1.0 6.5 5.6 7.5 7.2 6.9Bladen 1,144 9,586 7.2 1.2 8.4 7.5 9.9 12.1 12.0Blue Ridge 1,993 15,222 6.2 1.4 7.6 8.2 8.6 8.1 9.5Brunswick 1,938 17,307 7.6 1.3 8.9 8.1 9.0 7.4 8.3Caldwell 3,044 28,264 8.0 1.3 9.3 11.5 11.6 12.2 11.7Cape Fear 4,140 61,750 12.0 2.9 14.9 17.8 17.3 17.7 17.3Carteret 1,524 10,669 5.0 2.0 7.0 7.7 7.8 10.2 8.7Catawba Valley 2,655 23,536 7.6 1.3 8.9 11.5 12.0 13.9 16.2Central Carolina 5,118 33,603 5.5 1.1 6.6 7.0 9.5 8.2 9.2Central Piedmont 11,519 155,865 10.6 2.9 13.5 13.3 12.5 12.9 14.3Cleveland 2,066 13,974 5.6 1.2 6.8 7.4 9.4 10.8 11.3Coastal Carolina 2,793 32,581 10.0 1.7 11.7 14.0 13.2 12.0 13.7Coll. of Albemarle 1,840 10,536 4.8 0.9 5.7 8.0 9.9 10.2 9.4Craven 1,743 23,901 11.4 2.3 13.7 13.6 13.7 12.2 8.3Davidson County 2,784 27,842 9.2 0.8 10.0 10.2 10.3 10.3 9.2Durham 3,992 34,878 6.7 2.0 8.7 12.1 11.1 12.5 13.5Edgecombe 1,733 14,023 6.8 1.3 8.1 11.6 12.2 13.6 11.6Fayetteville 9,298 76,550 7.0 1.2 8.2 7.2 7.9 7.8 8.9Forsyth 6,024 64,495 8.7 2.0 10.7 12.8 16.4 15.2 15.4Gaston 4,457 38,279 7.2 1.4 8.6 8.8 10.0 11.5 10.3Guilford 8,300 123,015 11.9 2.9 14.8 15.3 15.2 18.1 17.5Halifax 1,279 10,866 7.2 1.3 8.5 8.9 9.5 10.7 10.3Haywood 1,336 9,018 5.9 0.8 6.7 7.2 6.6 8.5 8.0Isothermal 2,095 9,362 3.8 0.7 4.5 6.0 6.6 8.0 9.5James Sprunt 1,113 8,720 6.7 1.2 7.9 9.1 8.4 9.5 8.7

31
Table 5. Average Weekly Use of Student Stations in Classrooms
InstitutionNo. of
StationsTotal StudentClock Hours
AverageDaytimeHours
AverageNighttime
Hours All Hours2013 2012 2011 2010 2009
Johnston 3,425 32,699 8.0 1.6 9.6 10.8 10.8 10.8 8.9Lenoir 2,813 21,994 7.0 0.8 7.8 8.3 8.8 9.5 9.7Martin 782 5,062 5.8 0.7 6.5 8.4 9.8 7.4 5.8Mayland 1,178 8,295 5.5 1.6 7.1 8.3 8.6 8.3 10.1McDowell 1,095 6,083 4.2 1.3 5.5 7.7 6.6 4.7 5.4Mitchell 3,041 27,464 7.3 1.7 9.0 10.4 10.6 12.0 11.5Montgomery 803 5,305 4.9 1.7 6.6 6.9 7.5 7.3 8.1Nash 2,012 20,379 8.4 1.7 10.1 11.1 12.9 10.8 12.5Pamlico 483 2,141 3.3 1.1 4.4 4.9 4.1 6.1 6.2Piedmont 1,279 8,670 5.4 1.3 6.7 7.4 9.5 11.6 12.4Pitt 3,286 61,504 15.1 3.6 18.7 19.3 24.0 23.9 24.7Randolph 2,709 21,293 6.3 1.5 7.8 9.4 10.5 11.9 10.8Richmond 1,684 17,514 8.2 2.2 10.4 10.6 10.1 9.8 10.1Roanoke-Chowan 890 6,670 5.7 1.8 7.5 10.2 6.1 7.9 7.0Robeson 1,447 20,290 11.3 2.8 14.1 14.3 14.8 16.8 18.0Rockingham 1,626 16,817 9.3 1.0 10.3 11.5 11.8 13.3 13.4Rowan-Cabarrus 3,378 48,594 10.8 3.5 14.3 13.4 15.2 14.9 18.7Sampson 1,382 13,652 7.9 2.0 9.9 10.5 11.3 11.8 11.1Sandhills 3,699 34,186 8.2 1.0 9.2 10.6 12.0 10.7 11.5South Piedmont 1,512 12,996 7.1 1.5 8.6 8.7 8.1 14.2 15.2Southeastern 2,122 8,947 3.8 0.4 4.2 5.6 6.0 5.6 6.6Southwestern 1,427 13,608 9.0 0.5 9.5 11.9 10.9 12.6 13.6Stanly 1,869 12,956 6.1 0.8 6.9 7.7 8.5 7.4 9.0Surry 3,131 32,250 8.8 1.5 10.3 10.4 9.4 11.3 11.4Tri-County 1,061 7,224 5.5 1.3 6.8 5.6 6.2 6.5 5.9Vance-Granville 2,140 21,814 8.3 1.8 10.1 10.4 10.2 9.3 10.3Wake 8,559 125,512 12.2 2.5 14.7 13.6 17.2 15.8 15.4Wayne 1,711 18,549 9.6 1.3 10.9 10.8 10.5 10.4 10.1Western Piedmont 1,834 15,493 7.1 1.3 8.4 11.0 13.4 14.5 13.0Wilkes 3,050 25,582 7.4 1.0 8.4 8.3 8.1 9.7 9.7Wilson 1,839 11,805 5.3 1.1 6.4 6.5 5.6 7.0 7.4Subtotal 160,209 1,632,046 8.4 1.8 10.2 10.8 11.4 11.9 12.0
Private InstitutionsNC Private Universities
Barton 1,678 11,682 5.9 1.0 6.9 6.9 6.9 6.8 6.9Campbell 5,157 50,763 9.0 0.8 9.8 11.3 11.5 11.4 11.2Mars Hill 1,852 16,943 8.0 1.1 9.1 9.3 8.2 7.4 7.7Pfeiffer 1,603 10,192 5.1 1.3 6.4 6.5 7.2 6.5 6.1Subtotal 10,290 89,579 7.7 1.0 8.7 9.4 9.4 9.0 8.9
Grand Total 282,739 3,691,184 11.4 1.7 13.1 13.6 14.0 14.5 14.6

TABLE 6:
AVERAGE WEEKLY USE OF STUDENT STATIONS
IN CLASS LABORATORIES
Average weekly use of student stations in class laboratories is calculated by dividing the
total number of student clock hours generated in class laboratories by the total number of student
stations in class laboratories. More generally, it can be thought of as the average number of
hours each week that each class lab student station is used.
For the current year, Table 6 reports the total number of class lab student stations and
breaks down the average weekly use figure into daytime and nighttime utilizations. (See page 24
for a discussion of what the term class laboratory includes and page 20 for precise definitions of
daytime and nighttime utilizations.) For purposes of comparison, this table also lists the average
weekly use of student stations for the previous four years.
The average weekly use of student stations can serve as an indicator of the adequacy of
the number of stations in class laboratories. A norm which has been frequently cited is 15 hours.
This figure is based on the assumption that the average weekly use of class labs is 20 hours (see
Table 4) and that there is 75% utilization of student stations when class labs are in use (Table 7).
Most North Carolina colleges and universities fall considerably below this norm. This fact
suggests a surplus of class laboratory student stations but gives no indication whether this surplus
exists for all types of class laboratories or is limited to the labs of certain academic disciplines.
AVERAGE WEEKLY USE OF STUDENT STATIONS IN CLASS LABORATORIES =
TOTAL STUDENT CLOCK HOURS IN CLASS LABORATORIES
TOTAL STUDENT STATIONS IN CLASS LABORATORIES
32

Average Weekly Room Use of Student Stations In Laboratories
33
Day Night
7.7
1.7
8.2
1.8
8.3
1.9
8.7
2.0
8.6
2.0
9.6
1.3
9.9
1.4
9.2
1.2
9.8
1.5
9.7
1.5
4.9
0.55.7
0.6
5.7
0.7
4.7
0.7 5.3
0.7
0.0
1.0
2.0
3.0
4.0
5.0
6.0
7.0
8.0
9.0
10.0
11.0
12.0
NC CC UNC Campuses NC Prvt
2013 2012 2011 2010 2009 2013 2012 2011 2010 2009 2013 2012 2011 2010 2009

34
Table 6. Average Weekly Use of Student Stations in Class Laboratories
InstitutionNo. of
StationsTotal StudentClock Hours
AverageDaytimeHours
AverageNighttime
Hours All Hours2013 2012 2011 2010 2009
Public InstitutionsResearch Universities I
NC State 6,523 71,739 10.2 0.8 11.0 10.9 11.3 12.4 12.3UNC-Chapel Hill 2,301 19,915 7.2 1.4 8.6 11.2 8.1 8.6 8.4Subtotal 8,824 91,654 9.4 1.0 10.4 11.0 10.5 11.2 11.1
Doctoral Universities I and IIEast Carolina 3,772 41,076 9.4 1.5 10.9 9.8 10.2 11.0 11.1NC A&T 2,127 23,570 10.0 1.1 11.1 10.3 4.9 5.5 5.1UNC Charlotte 4,014 47,786 10.0 2.0 12.0 11.3 11.5 12.9 12.5UNC Greensboro 2,090 26,369 11.4 1.2 12.6 16.4 12.3 12.0 13.1Subtotal 12,003 138,800 10.0 1.5 11.5 11.5 9.4 10.2 10.4
Master's (Comprehensive) Universities and Colleges IAppalachian 2,603 47,936 16.0 2.4 18.4 18.2 16.6 18.2 17.8Fayetteville 1,402 12,839 7.5 1.7 9.2 11.0 9.6 10.0 10.0NC Central 1,292 12,023 8.1 1.2 9.3 11.5 11.9 12.0 11.6UNC Pembroke 689 8,453 11.5 0.7 12.2 12.2 11.0 12.5 13.9UNC Wilmington 2,053 21,916 9.2 1.5 10.7 13.3 14.6 15.2 16.4Western Carolina 1,957 22,281 10.2 1.2 11.4 11.3 12.1 12.0 9.1Winston-Salem 1,552 9,581 5.7 0.5 6.2 7.4 8.0 9.3 8.8Subtotal 11,548 135,028 10.2 1.5 11.7 12.8 12.7 13.4 12.7
Baccalaureate (Liberal Arts) Universities and Colleges I and IIElizabeth City 1,482 9,092 5.7 0.4 6.1 6.5 6.3 7.1 8.0UNC Asheville 794 7,070 8.0 0.9 8.9 9.5 10.4 10.3 9.8Subtotal 2,276 16,162 6.5 0.6 7.1 7.7 7.8 8.3 8.7
Schools of Art, Music, and DesignUNC School of the Arts 1,616 12,464 6.4 1.3 7.7 6.9 7.7 10.3 10.3Subtotal 1,616 12,464 6.4 1.3 7.7 6.9 7.7 10.3 10.3
Community CollegesAlamance 1,331 13,763 8.9 1.4 10.3 9.6 10.9 13.6 13.4Asheville-Buncombe 2,874 31,094 8.8 2.0 10.8 11.4 10.2 9.3 10.9Beaufort Co. 1,268 5,214 3.5 0.6 4.1 5.2 5.9 6.3 6.8Bladen 522 4,328 5.8 2.4 8.2 11.3 8.4 14.3 10.2Blue Ridge 1,175 6,469 4.4 1.1 5.5 6.3 6.3 5.6 8.6Brunswick 406 5,466 12.0 1.5 13.5 11.9 10.7 10.7 11.5Caldwell 1,279 9,755 6.5 1.1 7.6 9.8 8.9 11.0 13.5Cape Fear 2,954 44,932 12.7 2.5 15.2 17.1 17.2 15.9 16.3Carteret 1,012 6,289 4.9 1.3 6.2 8.0 7.0 7.0 6.7Catawba Valley 1,883 18,192 8.3 1.3 9.6 10.8 10.6 13.2 12.6Central Carolina 2,512 15,088 5.3 0.7 6.0 6.7 6.2 7.2 8.3Central Piedmont 3,800 35,676 7.1 2.3 9.4 8.6 8.9 9.0 10.4Cleveland 1,555 12,697 6.2 2.0 8.2 8.9 9.5 10.8 10.0Coastal Carolina 1,493 20,749 12.9 1.0 13.9 13.3 13.5 10.9 11.5Coll. of Albemarle 1,267 6,536 4.2 0.9 5.1 6.9 8.5 7.4 7.3Craven 1,010 8,065 5.9 2.0 7.9 7.9 7.9 9.1 7.9Davidson County 1,574 10,418 5.6 1.0 6.6 8.4 8.5 9.3 10.4Durham 1,807 11,807 4.7 1.8 6.5 8.3 9.3 9.3 8.4Edgecombe 853 10,222 9.9 2.1 12.0 14.9 13.7 14.7 13.8Fayetteville 3,904 38,098 7.8 2.0 9.8 9.3 8.4 8.2 8.5Forsyth 2,514 30,090 9.4 2.6 12.0 12.5 15.0 13.6 12.4Gaston 1,892 14,827 6.4 1.4 7.8 8.9 8.9 9.3 10.4Guilford 3,730 34,491 7.4 1.9 9.3 8.1 9.8 9.2 9.3Halifax 598 4,921 7.7 0.6 8.3 12.5 9.7 11.2 11.3Haywood 1,302 10,164 6.7 1.1 7.8 9.5 9.1 10.1 10.3Isothermal 1,040 9,456 7.5 1.5 9.0 10.9 11.8 14.4 14.7James Sprunt 476 3,630 6.4 1.3 7.7 9.0 8.4 7.9 8.3

35
Table 6. Average Weekly Use of Student Stations in Class Laboratories
InstitutionNo. of
StationsTotal StudentClock Hours
AverageDaytimeHours
AverageNighttime
Hours All Hours2013 2012 2011 2010 2009
Johnston 1,350 9,637 5.8 1.3 7.1 7.1 8.6 8.9 7.7Lenoir 1,596 9,918 5.4 0.8 6.2 6.8 7.4 8.1 8.8Martin 578 5,938 9.1 1.2 10.3 9.1 9.8 8.7 7.1Mayland 390 2,784 5.6 1.6 7.2 6.6 6.9 9.6 10.0McDowell 633 6,388 7.9 2.2 10.1 11.0 11.4 11.8 11.1Mitchell 978 7,970 6.7 1.5 8.2 10.2 10.0 8.9 7.9Montgomery 317 3,530 8.1 3.0 11.1 10.5 10.1 11.2 11.3Nash 774 8,582 8.4 2.7 11.1 9.0 11.1 11.1 10.5Pamlico 257 973 3.0 0.8 3.8 3.8 5.1 5.7 6.0Piedmont 772 6,768 6.9 1.9 8.8 10.5 12.0 14.3 13.5Pitt 1,670 24,023 12.2 2.2 14.4 15.3 17.4 16.1 17.4Randolph 1,249 7,699 4.9 1.2 6.1 6.9 5.5 7.4 9.6Richmond 731 8,308 8.6 2.7 11.3 10.8 11.6 12.1 8.7Roanoke-Chowan 468 3,989 6.9 1.6 8.5 10.2 9.6 7.8 7.7Robeson 1,095 16,272 12.8 2.1 14.9 14.5 13.9 12.8 12.8Rockingham 1,081 6,573 4.9 1.2 6.1 6.9 7.1 6.9 6.9Rowan-Cabarrus 1,570 18,370 8.6 3.1 11.7 12.7 13.3 18.0 17.9Sampson 585 6,946 10.1 1.7 11.8 11.9 8.2 11.6 8.8Sandhills 1,246 7,968 5.6 0.8 6.4 7.3 8.5 8.7 8.3South Piedmont 830 7,752 8.1 1.3 9.4 8.5 9.0 11.8 10.6Southeastern 888 4,445 4.5 0.5 5.0 5.3 6.7 7.2 8.4Southwestern 735 8,098 9.8 1.2 11.0 11.4 11.5 12.2 12.3Stanly 1,060 4,861 3.9 0.6 4.5 6.0 4.8 8.0 7.2Surry 1,127 11,046 8.6 1.2 9.8 8.6 8.7 10.8 8.4Tri-County 616 7,555 9.8 2.5 12.3 8.0 9.6 10.0 11.0Vance-Granville 1,673 14,421 7.5 1.1 8.6 11.0 9.3 10.4 11.7Wake 3,664 53,347 11.9 2.6 14.5 16.6 16.7 16.3 15.2Wayne 1,564 16,569 9.3 1.3 10.6 11.6 11.8 11.6 12.4Western Piedmont 1,120 9,870 7.5 1.3 8.8 9.2 10.9 10.4 8.6Wilkes 1,406 10,053 6.5 0.7 7.2 6.3 6.7 6.7 7.0Wilson 737 6,564 6.2 2.7 8.9 8.7 7.9 10.0 9.6Subtotal 78,791 739,638 7.7 1.7 9.4 10.0 10.1 10.7 10.6
Private InstitutionsNC Private Universities
Barton 475 3,628 7.6 0.0 7.6 7.3 7.4 6.6 7.2Campbell 1,323 6,995 4.3 1.0 5.3 7.5 7.5 5.5 7.2Mars Hill 742 3,218 4.2 0.1 4.3 4.6 5.2 5.0 5.1Pfeiffer 426 2,103 4.8 0.2 5.0 5.3 4.3 4.3 -Subtotal 2,966 15,943 4.9 0.5 5.4 6.3 6.4 5.4 6.0
Grand Total 118,024 1,149,687 8.2 1.5 9.7 10.3 10.2 10.7 10.7

TABLE 7:
PERCENT STUDENT STATION UTILIZATION,
CLASSROOMS AND CLASS LABORATORIES
Percent student station utilization indicates the average percentage of student stations that
are occupied when classrooms or class laboratories are in use. It is calculated by dividing the
student clock hours generated in classrooms (or class labs) by the potential student clock hours
for classrooms (or class labs) and multiplying by 100 to convert to a percentage. Potential
student clock hours is computed on a room-by-room basis by multiplying the number of student
stations in each room by the room hours of instruction generated by the room (Tables 3 and 4).
It indicates the number of student clock hours which would be generated if every room were
filled to capacity (i.e., if the number of students equaled the number of stations) each time a
course met in the room.
It is important to keep in mind that the percent student station utilization assesses the
utilization of rooms only when they are in use. This figure is therefore a helpful indicator of how
close to capacity an institution's courses are to the rooms in which they are scheduled. It does
not, however, indicate the overall efficiency of utilization since it does not take into account how
frequently a room is used. Percent student station utilization may also be referred to as the
Station Occupancy Rate (SOR).
The University of North Carolina standards are 65% for classrooms and 75% for class
laboratories. The higher percentage for class labs reflects the assumption that these rooms,
although used less frequently than classrooms because of their specialized configuration and/or
equipment, are usually closer to being filled to capacity when they are in use. Data for
University of North Carolina institutions indicate that the percent student station utilization of
labs at most campuses are generally higher than classrooms. For both types of rooms, the
average percentage for all N.C. institutions exceeds 60%.
PERCENT STUDENT STATION UTILIZATION IN CLASSROOMS (OR CLASS LABS)
EQUALS
STUDENT CLOCK HOURS IN CLASSROOMS (OR CLASS LABS)
POTENTIAL STUDENT CLOCK HOURS IN CLASSROOMS (OR CLASS LABS)
36

Percent of Student Station UtilizationClassrooms and Class Laboratories
In Classrooms
57.9 58.0 58.460.0
61.862.7 62.5 62.3
63.564.3
49.250.7 50.4
47.9
49.9
45.0
50.0
55.0
60.0
65.0
70.0
NC CC UNC Campuses NC Prvt
2013 2012 2011 2010 2009 2013 2012 2011 2010 2009 2013 2012 2011 2010 2009
In Laboratories
59.5 59.5
61.7 62.163.7
66.4 65.8 66.1
68.369.4
53.7 53.1 53.7
49.1
52.2
45.0
50.0
55.0
60.0
65.0
70.0
NC CC UNC Campuses NC Prvt
2013 2012 2011 2010 2009 2013 2012 2011 2010 2009 2013 2012 2011 2010 2009
37

38
Table 7. Percent Student Station Utilization, Classrooms and Class Laboratories
Institution Classrooms Laboratories2013 2012 2011 2010 2009 2013 2012 2011 2010 2009
Public InstitutionsResearch Universities I
NC State 64.5 66.3 66.9 65.7 65.4 76.6 75.4 78.9 84.0 79.3UNC-Chapel Hill 66.0 66.4 65.0 66.7 66.5 65.3 71.7 73.4 75.2 70.4Subtotal 65.2 66.4 66.0 66.2 65.9 73.9 74.3 77.6 81.8 77.2
Doctoral Universities I and IIEast Carolina 63.8 63.8 64.2 64.1 64.0 56.7 54.3 55.1 56.1 57.2NC A&T 54.7 53.4 57.5 57.4 59.2 69.2 70.8 75.8 72.6 64.7UNC Charlotte 67.9 65.0 61.2 70.0 70.0 67.6 63.4 59.9 70.5 74.4UNC Greensboro 58.2 61.1 58.2 61.1 63.1 60.6 62.3 63.0 61.8 65.5Subtotal 62.5 62.0 60.7 64.2 64.9 62.9 61.4 60.8 64.2 65.6
Master's (Comprehensive) Universities and Colleges IAppalachian 68.9 68.8 70.5 68.3 69.8 75.6 75.2 78.0 77.0 78.8Fayetteville 54.5 54.5 54.8 52.4 55.7 61.2 59.9 55.6 50.0 47.3NC Central 51.2 50.5 51.3 52.7 56.3 74.0 79.2 69.1 67.8 69.2UNC Pembroke 59.9 62.0 58.1 59.6 59.4 65.0 66.1 61.7 65.1 72.9UNC Wilmington 63.6 60.4 65.3 66.1 67.3 66.0 68.3 72.9 75.9 79.7Western Carolina 70.6 70.7 69.2 66.4 67.1 64.7 61.8 62.8 60.7 60.6Winston-Salem 45.0 48.2 48.5 50.2 54.8 49.9 47.5 50.8 64.2 70.6Subtotal 61.6 60.9 61.8 61.4 63.1 67.4 67.0 67.4 68.0 69.8
Baccalaureate (Liberal Arts) Universities and Colleges I and IIElizabeth City 44.1 48.2 46.6 51.6 56.7 54.0 56.9 50.4 51.6 68.8UNC Asheville 61.0 59.3 60.7 60.7 59.5 61.3 65.3 68.1 65.1 67.4Subtotal 54.1 54.3 54.3 56.5 58.3 57.0 60.7 57.8 57.0 68.2
Schools of Art, Music, and DesignUNC School of the Arts 52.2 50.3 58.1 60.9 63.3 61.9 56.1 55.9 60.8 62.6Subtotal 52.2 50.3 58.1 60.9 63.3 61.9 56.1 55.9 60.8 62.6
Community CollegesAlamance 50.5 57.1 54.0 58.9 55.3 55.3 52.0 55.1 62.9 68.3Asheville-Buncombe 66.5 75.4 68.9 63.9 65.8 54.3 55.9 59.4 51.8 54.3Beaufort Co. 40.1 42.1 45.9 42.0 48.7 38.2 38.8 42.2 39.9 45.9Bladen 46.3 39.9 49.5 58.7 64.6 47.3 53.4 59.6 69.2 63.4Blue Ridge 46.2 49.4 52.6 51.5 58.1 40.5 43.9 48.7 50.1 57.0Brunswick 42.2 47.0 50.5 44.0 56.1 70.4 60.0 62.9 53.1 64.2Caldwell 62.0 62.4 63.5 63.7 65.4 59.0 67.9 63.7 63.8 76.6Cape Fear 60.0 63.6 63.9 62.7 63.6 67.8 67.9 69.4 67.9 70.9Carteret 46.5 49.9 51.3 62.0 60.4 56.0 69.7 64.4 65.0 65.3Catawba Valley 52.3 60.9 56.8 61.3 64.0 66.7 65.7 65.5 71.0 71.4Central Carolina 53.2 54.3 61.7 58.9 57.6 61.4 61.6 59.2 60.8 61.9Central Piedmont 70.7 65.8 67.5 67.8 70.7 63.6 62.5 63.8 61.5 65.7Cleveland 44.4 45.6 45.4 47.0 51.6 51.3 50.3 55.9 62.7 56.0Coastal Carolina 55.7 56.7 58.1 53.4 65.0 63.9 59.0 61.4 52.6 59.9Coll. of Albemarle 54.2 55.9 55.7 61.0 59.0 60.2 63.0 62.8 70.9 69.2Craven 79.4 79.8 75.4 64.5 62.2 58.8 60.8 62.5 68.7 66.0Davidson County 61.0 57.9 62.6 61.9 56.4 56.3 49.6 59.8 67.8 66.1Durham 67.8 61.7 56.3 59.0 59.3 60.5 59.5 59.8 63.9 64.5Edgecombe 53.1 58.1 56.2 66.7 67.8 57.5 67.6 66.9 74.7 78.1Fayetteville 45.2 42.0 40.6 40.3 44.2 61.6 62.8 56.6 58.5 55.7Forsyth 57.4 56.4 64.2 59.3 62.3 66.0 66.4 68.9 65.7 66.9Gaston 66.2 60.7 61.1 59.5 62.9 56.2 58.0 59.5 53.7 66.0Guilford 71.4 71.7 67.8 75.7 81.3 66.3 56.9 65.6 73.7 75.4Halifax 46.9 52.0 54.6 61.9 66.7 50.4 78.6 54.5 60.4 71.5Haywood 52.1 49.6 51.6 47.4 49.4 50.4 55.4 55.9 54.4 52.3Isothermal 43.2 48.3 50.3 56.2 63.6 65.7 69.0 67.3 73.1 74.7James Sprunt 46.4 52.2 54.5 56.1 53.6 53.4 50.2 57.6 50.6 53.2Johnston 59.7 63.9 61.7 69.3 63.2 56.9 62.6 63.5 64.1 65.5Lenoir 55.7 60.4 59.5 65.0 65.1 52.4 50.8 60.0 65.7 70.7

39
Table 7. Percent Student Station Utilization, Classrooms and Class Laboratories
Institution Classrooms Laboratories2013 2012 2011 2010 2009 2013 2012 2011 2010 2009
Martin 52.8 46.6 48.3 48.2 41.2 54.1 50.7 52.3 43.2 42.8Mayland 59.0 56.7 56.3 53.4 62.1 56.1 49.3 68.7 75.7 66.9McDowell 38.8 44.4 42.2 54.1 56.2 43.9 44.1 48.3 44.1 49.0Mitchell 56.7 58.2 62.9 61.3 63.4 60.8 68.1 64.9 72.4 66.4Montgomery 38.0 38.3 39.7 39.4 43.5 52.2 52.3 51.8 58.0 57.5Nash 52.1 49.5 52.0 48.5 57.8 60.6 47.6 53.9 51.3 53.4Pamlico 36.2 42.8 36.7 43.9 42.1 30.9 30.2 45.9 40.9 39.4Piedmont 38.5 37.9 47.0 49.9 48.7 40.1 44.1 46.5 60.7 52.3Pitt 65.7 65.6 69.7 69.8 72.8 71.5 73.5 70.4 71.7 71.5Randolph 59.5 58.0 57.7 56.5 54.0 51.6 56.3 51.7 50.4 66.5Richmond 45.6 46.7 56.7 56.6 46.9 59.5 57.4 65.9 67.2 57.5Roanoke-Chowan 46.9 59.3 47.9 51.6 43.1 47.2 55.2 55.3 46.5 43.7Robeson 66.7 73.9 69.3 71.3 74.7 73.9 84.1 79.7 69.6 69.7Rockingham 58.9 49.9 57.2 60.2 64.7 47.5 48.4 51.5 52.5 59.2Rowan-Cabarrus 59.6 59.4 59.1 67.0 68.4 63.9 62.8 65.5 73.0 75.9Sampson 59.2 57.5 65.6 66.3 69.4 88.0 81.3 73.8 73.9 72.7Sandhills 55.9 58.4 57.4 58.8 57.0 55.1 54.9 61.3 64.4 57.8South Piedmont 63.4 54.5 52.5 71.7 76.5 56.5 56.5 55.9 67.4 62.9Southeastern 38.5 36.8 35.3 50.0 57.1 36.5 40.2 47.9 51.6 54.2Southwestern 52.0 59.5 56.4 60.8 64.1 67.0 65.6 65.4 68.0 64.2Stanly 45.5 42.2 49.7 50.2 48.3 29.9 31.7 36.2 36.9 38.7Surry 65.7 59.8 58.0 61.3 68.3 71.9 61.5 62.9 66.9 65.5Tri-County 45.9 44.0 46.8 45.5 50.8 73.1 43.7 54.7 48.6 60.4Vance-Granville 49.8 55.5 55.1 56.3 60.0 55.1 58.6 64.9 56.5 63.2Wake 67.1 66.8 68.4 65.4 65.9 73.7 77.3 75.8 72.2 75.9Wayne 59.8 58.8 54.4 61.8 60.9 57.8 61.0 68.9 69.8 66.9Western Piedmont 53.8 59.4 55.4 58.1 59.5 59.4 50.7 63.2 64.0 59.6Wilkes 49.5 46.6 43.8 48.0 47.7 41.7 40.0 41.7 46.8 44.7Wilson 53.9 53.0 46.7 51.5 47.6 52.4 54.0 55.9 56.3 58.3Subtotal 57.9 58.0 58.4 60.0 61.8 59.5 59.5 61.7 62.1 63.7
Private InstitutionsNC Private Universities
Barton 37.4 38.4 39.5 36.9 39.0 63.0 65.1 56.3 47.3 55.3Campbell 51.8 53.9 53.1 52.5 54.6 48.5 52.5 56.1 49.2 49.9Mars Hill 54.2 53.7 52.8 52.3 52.8 47.5 39.6 44.5 42.5 45.3Pfeiffer 46.9 49.3 49.6 40.8 42.6 77.0 69.1 62.4 70.2 78.1Subtotal 49.2 50.6 50.3 47.9 49.9 53.7 53.1 53.7 49.1 52.2
Grand Total 60.1 60.1 60.1 61.4 62.7 61.6 61.4 63.0 63.9 65.3

This Page Intentionally Left Blank
40

TABLE 8:
STUDENT CLOCK HOURS
OF INSTRUCTION
This table indicates the weekly student clock hours of instruction being conducted at the
end of the fall drop-add period. Student clock hours are computed by multiplying for each
course the number of hours that the course meets each week by the number of students enrolled.
(To compute the number of hours that the course meets each week, the class length is rounded to
the nearest half hour and multiplied by the number of times the class meets weekly.) The data
reflect both credit and non-credit courses which were at least eight weeks in duration.
The columns headed "Laboratories" reflect instruction conducted only in class
laboratories (room code 210). A precise definition of class laboratory is provided on page 24.
The columns headed "Other" reflect instruction in rooms coded other than 110 and 210 (e.g.,
other types of laboratories, physical education facilities, offices). An outline of the room use
code structure is presented on pp. 91-92.
The number of clock hours conducted in a particular category of space is a function of the
number of students enrolled, the nature of the instructional programs being pursued by the
students, and the instructional philosophy of the institution. As a result, the number of student
clock hours generated per FTE student varies by type of institution:
INSTITUTIONAL GROUP STUDENT CLOCK HR./FTE
By Control: University of North Carolina 13
Private Institutions 12
Community/Technical Colleges 16
By Level: Major Research Universities 13
Other Baccalaureate-Granting
Institutions 13
Two-year Institutions 16
All North Carolina Institutions 15
41
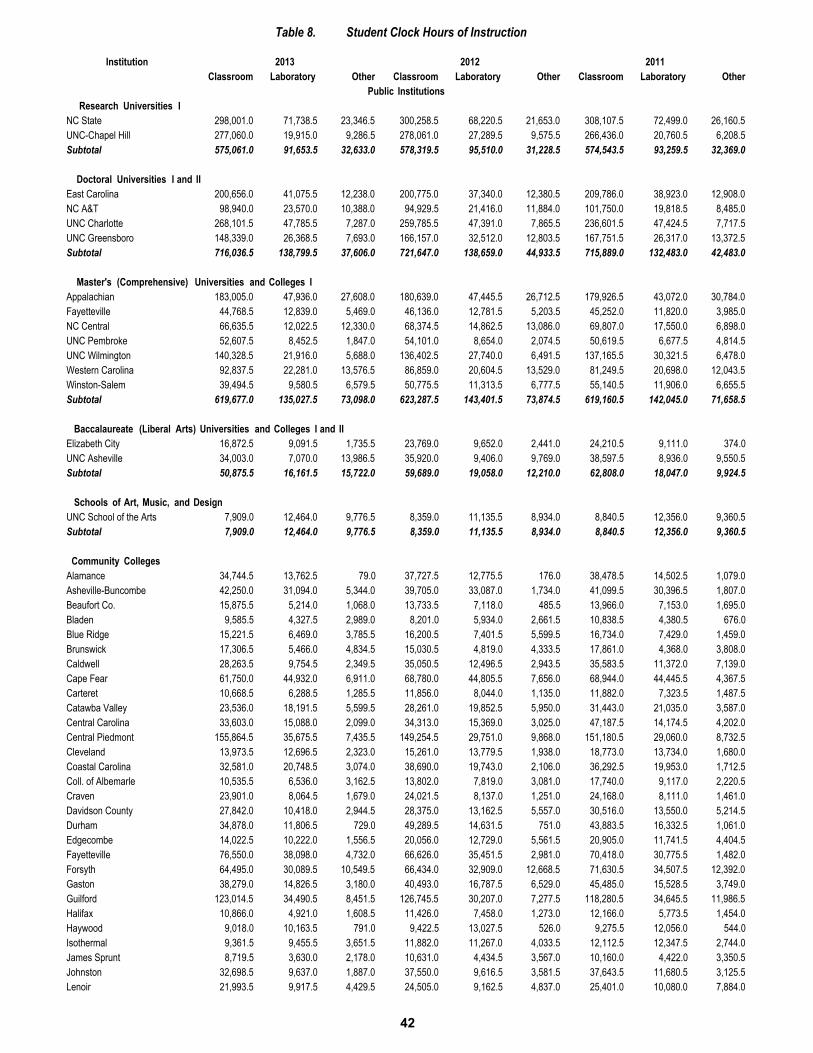
42
Table 8. Student Clock Hours of Instruction
Institution 2013 2012 2011Classroom Laboratory Other Classroom Laboratory Other Classroom Laboratory Other
Public InstitutionsResearch Universities I
NC State 298,001.0 71,738.5 23,346.5 300,258.5 68,220.5 21,653.0 308,107.5 72,499.0 26,160.5UNC-Chapel Hill 277,060.0 19,915.0 9,286.5 278,061.0 27,289.5 9,575.5 266,436.0 20,760.5 6,208.5Subtotal 575,061.0 91,653.5 32,633.0 578,319.5 95,510.0 31,228.5 574,543.5 93,259.5 32,369.0
Doctoral Universities I and IIEast Carolina 200,656.0 41,075.5 12,238.0 200,775.0 37,340.0 12,380.5 209,786.0 38,923.0 12,908.0NC A&T 98,940.0 23,570.0 10,388.0 94,929.5 21,416.0 11,884.0 101,750.0 19,818.5 8,485.0UNC Charlotte 268,101.5 47,785.5 7,287.0 259,785.5 47,391.0 7,865.5 236,601.5 47,424.5 7,717.5UNC Greensboro 148,339.0 26,368.5 7,693.0 166,157.0 32,512.0 12,803.5 167,751.5 26,317.0 13,372.5Subtotal 716,036.5 138,799.5 37,606.0 721,647.0 138,659.0 44,933.5 715,889.0 132,483.0 42,483.0
Master's (Comprehensive) Universities and Colleges IAppalachian 183,005.0 47,936.0 27,608.0 180,639.0 47,445.5 26,712.5 179,926.5 43,072.0 30,784.0Fayetteville 44,768.5 12,839.0 5,469.0 46,136.0 12,781.5 5,203.5 45,252.0 11,820.0 3,985.0NC Central 66,635.5 12,022.5 12,330.0 68,374.5 14,862.5 13,086.0 69,807.0 17,550.0 6,898.0UNC Pembroke 52,607.5 8,452.5 1,847.0 54,101.0 8,654.0 2,074.5 50,619.5 6,677.5 4,814.5UNC Wilmington 140,328.5 21,916.0 5,688.0 136,402.5 27,740.0 6,491.5 137,165.5 30,321.5 6,478.0Western Carolina 92,837.5 22,281.0 13,576.5 86,859.0 20,604.5 13,529.0 81,249.5 20,698.0 12,043.5Winston-Salem 39,494.5 9,580.5 6,579.5 50,775.5 11,313.5 6,777.5 55,140.5 11,906.0 6,655.5Subtotal 619,677.0 135,027.5 73,098.0 623,287.5 143,401.5 73,874.5 619,160.5 142,045.0 71,658.5
Baccalaureate (Liberal Arts) Universities and Colleges I and IIElizabeth City 16,872.5 9,091.5 1,735.5 23,769.0 9,652.0 2,441.0 24,210.5 9,111.0 374.0UNC Asheville 34,003.0 7,070.0 13,986.5 35,920.0 9,406.0 9,769.0 38,597.5 8,936.0 9,550.5Subtotal 50,875.5 16,161.5 15,722.0 59,689.0 19,058.0 12,210.0 62,808.0 18,047.0 9,924.5
Schools of Art, Music, and DesignUNC School of the Arts 7,909.0 12,464.0 9,776.5 8,359.0 11,135.5 8,934.0 8,840.5 12,356.0 9,360.5Subtotal 7,909.0 12,464.0 9,776.5 8,359.0 11,135.5 8,934.0 8,840.5 12,356.0 9,360.5
Community CollegesAlamance 34,744.5 13,762.5 79.0 37,727.5 12,775.5 176.0 38,478.5 14,502.5 1,079.0Asheville-Buncombe 42,250.0 31,094.0 5,344.0 39,705.0 33,087.0 1,734.0 41,099.5 30,396.5 1,807.0Beaufort Co. 15,875.5 5,214.0 1,068.0 13,733.5 7,118.0 485.5 13,966.0 7,153.0 1,695.0Bladen 9,585.5 4,327.5 2,989.0 8,201.0 5,934.0 2,661.5 10,838.5 4,380.5 676.0Blue Ridge 15,221.5 6,469.0 3,785.5 16,200.5 7,401.5 5,599.5 16,734.0 7,429.0 1,459.0Brunswick 17,306.5 5,466.0 4,834.5 15,030.5 4,819.0 4,333.5 17,861.0 4,368.0 3,808.0Caldwell 28,263.5 9,754.5 2,349.5 35,050.5 12,496.5 2,943.5 35,583.5 11,372.0 7,139.0Cape Fear 61,750.0 44,932.0 6,911.0 68,780.0 44,805.5 7,656.0 68,944.0 44,445.5 4,367.5Carteret 10,668.5 6,288.5 1,285.5 11,856.0 8,044.0 1,135.0 11,882.0 7,323.5 1,487.5Catawba Valley 23,536.0 18,191.5 5,599.5 28,261.0 19,852.5 5,950.0 31,443.0 21,035.0 3,587.0Central Carolina 33,603.0 15,088.0 2,099.0 34,313.0 15,369.0 3,025.0 47,187.5 14,174.5 4,202.0Central Piedmont 155,864.5 35,675.5 7,435.5 149,254.5 29,751.0 9,868.0 151,180.5 29,060.0 8,732.5Cleveland 13,973.5 12,696.5 2,323.0 15,261.0 13,779.5 1,938.0 18,773.0 13,734.0 1,680.0Coastal Carolina 32,581.0 20,748.5 3,074.0 38,690.0 19,743.0 2,106.0 36,292.5 19,953.0 1,712.5Coll. of Albemarle 10,535.5 6,536.0 3,162.5 13,802.0 7,819.0 3,081.0 17,740.0 9,117.0 2,220.5Craven 23,901.0 8,064.5 1,679.0 24,021.5 8,137.0 1,251.0 24,168.0 8,111.0 1,461.0Davidson County 27,842.0 10,418.0 2,944.5 28,375.0 13,162.5 5,557.0 30,516.0 13,550.0 5,214.5Durham 34,878.0 11,806.5 729.0 49,289.5 14,631.5 751.0 43,883.5 16,332.5 1,061.0Edgecombe 14,022.5 10,222.0 1,556.5 20,056.0 12,729.0 5,561.5 20,905.0 11,741.5 4,404.5Fayetteville 76,550.0 38,098.0 4,732.0 66,626.0 35,451.5 2,981.0 70,418.0 30,775.5 1,482.0Forsyth 64,495.0 30,089.5 10,549.5 66,434.0 32,909.0 12,668.5 71,630.5 34,507.5 12,392.0Gaston 38,279.0 14,826.5 3,180.0 40,493.0 16,787.5 6,529.0 45,485.0 15,528.5 3,749.0Guilford 123,014.5 34,490.5 8,451.5 126,745.5 30,207.0 7,277.5 118,280.5 34,645.5 11,986.5Halifax 10,866.0 4,921.0 1,608.5 11,426.0 7,458.0 1,273.0 12,166.0 5,773.5 1,454.0Haywood 9,018.0 10,163.5 791.0 9,422.5 13,027.5 526.0 9,275.5 12,056.0 544.0Isothermal 9,361.5 9,455.5 3,651.5 11,882.0 11,267.0 4,033.5 12,112.5 12,347.5 2,744.0James Sprunt 8,719.5 3,630.0 2,178.0 10,631.0 4,434.5 3,567.0 10,160.0 4,422.0 3,350.5Johnston 32,698.5 9,637.0 1,887.0 37,550.0 9,616.5 3,581.5 37,643.5 11,680.5 3,125.5Lenoir 21,993.5 9,917.5 4,429.5 24,505.0 9,162.5 4,837.0 25,401.0 10,080.0 7,884.0

43
Table 8. Student Clock Hours of Instruction
Institution 2013 2012 2011Classroom Laboratory Other Classroom Laboratory Other Classroom Laboratory Other
Martin 5,061.5 5,937.5 3,366.5 6,349.5 5,272.5 4,085.5 7,453.0 5,682.0 3,177.0Mayland 8,294.5 2,784.0 348.0 9,608.0 2,560.5 1,052.5 9,941.0 2,684.5 661.0McDowell 6,083.0 6,387.5 958.5 8,399.0 6,942.0 474.0 7,230.0 7,397.5 546.0Mitchell 27,464.0 7,970.0 4,047.5 31,524.5 9,956.0 3,782.5 32,479.5 9,716.5 5,457.5Montgomery 5,304.5 3,530.0 540.0 5,436.0 3,517.5 952.0 5,883.5 3,577.5 1,042.0Nash 20,379.0 8,581.5 5,318.5 22,274.0 6,918.5 5,119.0 24,752.0 8,345.0 4,443.0Pamlico 2,141.0 972.5 22.0 2,350.5 978.0 211.0 2,013.5 1,320.5 36.0Piedmont 8,670.0 6,767.5 911.5 9,446.0 8,093.0 1,583.0 12,175.0 9,255.0 1,114.5Pitt 61,503.5 24,023.0 2,246.0 64,207.0 25,871.5 2,441.0 58,261.0 25,472.0 2,962.0Randolph 21,292.5 7,699.0 626.5 22,795.0 7,880.5 1,692.0 25,460.0 6,389.5 1,081.5Richmond 17,514.0 8,307.5 1,382.0 18,310.5 8,297.0 1,368.0 19,639.0 9,739.0 1,670.0Roanoke-Chowan 6,669.5 3,988.5 4,605.0 9,141.0 4,791.5 1,295.5 5,430.0 4,487.0 1,027.0Robeson 20,289.5 16,271.5 1,618.5 21,140.5 15,384.5 1,348.0 23,595.0 17,451.0 1,900.5Rockingham 16,817.0 6,573.0 2,615.0 18,961.0 8,321.5 3,558.0 19,544.5 8,596.5 3,166.0Rowan-Cabarrus 48,593.5 18,370.0 1,614.0 46,608.5 20,574.5 389.0 51,336.5 24,144.5 728.5Sampson 13,652.0 6,946.0 968.5 14,525.0 6,980.0 840.5 15,639.0 4,797.0 1,091.0Sandhills 34,185.5 7,967.5 4,450.0 38,299.5 9,069.0 3,481.5 37,261.0 10,516.0 4,308.0South Piedmont 12,996.0 7,751.5 1,178.0 12,709.0 7,651.5 1,578.5 11,885.0 7,987.0 2,416.0Southeastern 8,946.5 4,445.0 1,752.5 10,910.5 4,713.0 2,423.5 12,381.5 5,881.5 1,112.5Southwestern 13,607.5 8,097.5 1,515.5 18,872.5 7,464.5 2,220.5 13,963.5 7,762.5 1,208.5Stanly 12,955.5 4,861.0 609.0 15,981.5 6,587.5 1,240.0 17,617.0 5,191.5 251.0Surry 32,250.0 11,045.5 5,537.0 33,845.5 10,641.0 4,584.0 26,920.0 13,170.5 7,319.0Tri-County 7,223.5 7,555.0 82.5 5,969.0 4,909.5 149.0 6,561.0 5,939.5 40.0Vance-Granville 21,813.5 14,420.5 1,478.0 26,407.0 16,765.0 874.5 25,628.0 15,175.5 2,267.5Wake 125,511.5 53,346.5 9,497.0 116,918.5 62,739.5 16,524.5 119,770.5 58,626.0 10,432.5Wayne 18,549.0 16,568.5 3,184.0 20,263.0 16,539.0 5,810.5 20,425.0 16,478.0 5,587.0Western Piedmont 15,493.0 9,869.5 2,074.0 20,280.0 10,133.0 1,108.0 25,547.5 11,147.0 1,295.0Wilkes 25,582.0 10,052.5 2,181.5 25,379.0 8,900.5 2,360.0 24,057.5 9,264.0 2,043.0Wilson 11,805.0 6,564.0 1,954.0 11,792.0 6,474.0 2,502.0 10,144.0 5,868.0 1,310.0Subtotal 1,632,045.5 739,637.5 167,388.0 1,722,026.0 776,702.0 188,135.0 1,763,042.5 782,057.5 176,198.5
Private InstitutionsNC Private Universities
Barton 11,681.5 3,628.0 1,050.5 11,632.5 3,510.0 833.0 11,641.0 3,525.5 537.0Campbell 50,762.5 6,994.5 6,607.5 52,208.0 7,061.0 6,306.0 52,694.0 7,143.5 5,988.5Mars Hill 16,943.0 3,218.0 1,686.0 14,975.0 3,149.0 1,770.0 13,196.0 3,561.5 1,624.5Pfeiffer 10,192.0 2,102.5 741.5 10,231.0 2,260.5 781.0 11,256.5 1,839.5 446.0Subtotal 89,579.0 15,943.0 10,085.5 89,046.5 15,980.5 9,690.0 88,787.5 16,070.0 8,596.0
Grand Total 3,691,183.5 1,149,686.5 346,309.0 3,802,374.5 1,200,446.5 369,005.5 3,833,071.5 1,196,318.0 350,590.0

TABLE 9:
SPACE FACTORS
A space factor is the assignable square feet of a given type of space divided by the
student clock hours of instruction generated from that type of space. It is very useful to facilities
planners in that it combines into a single factor the concepts of weekly room hours (Tables 3 and
4), percent student station utilization (Table 7), and assignable square feet per student station
(Tables 16 and 17). The lower the space factor, the more effectively the space is being utilized
for instructional purposes.
Space factors can be specifically defined in two ways. For Table 9, the formula:
Space Factor = Assignable Square Feet
Student Clock Hours
is used. Note that space factors must relate to a specified type of space. For example, a
classroom space factor is calculated by dividing the assignable square feet of classroom space by
the student clock hours generated in classrooms.
An alternative formula is:
Space Factor = Assignable Sq. Ft./Station .
Avg. Weekly Room Hours X Percent Station Utilization
Although the two are equivalent, they may produce slightly different results because of
the rounding which is inherent in the second formula. The second formula is nevertheless useful
in calculating space factor norms.
Classrooms. If the norms cited for Tables 3, 7, and 16 are used for the three factors
which comprise the second formula, the result is a space factor of 0.79:
Classroom Space Factor = 18 = 0.79
35 X .65
Although this represents a frequently cited norm for classroom space factors, it is
considerably lower (i.e., more efficient) than the classroom space factors of most North Carolina
institutions. The current average can be calculated by using the state averages for the three
required indices from Tables 3, 7, and 16:
Classroom Space Factor = 22 = 1.85
19.8 X .601
44

Class Laboratories. The average assignable square footage per station in class laboratories varies
widely among different types of labs. This variance results in a wide range of space factors and
makes the defining of norms difficult. Standards adopted by the University of North Carolina
(See Table 11) classify class laboratories into four categories, based on discipline requirements,
and assign a space factor (and other criteria) for each:
High Intensive (e.g., Engineering and intensive Fine Arts) is assigned a Space Factor standard of
7.20. This is based on standards of 20 Weekly Room Hours (Room Utilization Rate), a
Percent Student Station Utilization (or Station Occupancy Rate) of 0.75, and ASF per
Student Station (Station Size) of 108 square feet.
Intensive (e.g., Agriculture, Architecture, Biological Sciences, Health Professions, Library and
Physical Sciences) is assigned a Space Factor Standard of 4.67. This is based on
standards of 20 Weekly Room Hours, a Percent Student Station Utilization of 0.75, and
ASF per Student Station of 70 square feet.
Moderately Intensive (e.g., Communications, Education) is assigned a Space Factor standard of
3.33. This is based on standards of 20 Weekly Room Hours, a Percent Student Station
Utilization of 0.75, and ASF per student Station of 50 square feet.
Non-Intensive (e.g., Business, Cinematography, Languages) is assigned a Space Factor of 2.20.
This is based on standards of 20 Weekly Room Hours, a Percent Student Station
Utilization of 0.75, and ASF per Student Station of 33 square feet.
Teaching Areas. Teaching areas represent the sum of classroom and class laboratory
space. A space factor norm for teaching areas has not been derived, but the group means can be
useful in assessing the extent of utilization.
Table 10 has also been developed to assist institutions in analyzing their utilization data.
High, low, and weighted means are reported for average weekly room hours, percent student
station utilization, and space factors in both classrooms and class laboratories.
45

46
Table 9. Space Factors
Institution Classrooms Laboratories Teaching Areas2013 2012 2011 2010 2009 2013 2012 2011 2010 2009 2013 2012 2011 2010 2009
Public InstitutionsResearch Universities I
NC State 0.84 0.82 0.81 0.83 0.83 3.80 3.97 3.63 3.46 3.55 1.42 1.41 1.35 1.32 1.34UNC-Chapel Hill 0.96 0.98 1.06 1.03 1.02 4.32 3.24 4.83 4.59 4.77 1.19 1.18 1.33 1.29 1.29Subtotal 0.90 0.90 0.93 0.92 0.92 3.92 3.76 3.90 3.71 3.81 1.31 1.30 1.34 1.31 1.32
Doctoral Universities I and IIEast Carolina 0.92 0.90 0.86 0.86 0.88 3.53 3.86 3.73 3.46 3.43 1.36 1.37 1.31 1.29 1.31NC A&T 1.41 1.45 1.55 1.40 1.45 3.54 3.62 8.12 7.24 8.08 1.82 1.85 2.62 2.47 2.51UNC Charlotte 0.82 0.84 0.86 0.73 0.76 3.73 3.60 3.45 3.14 3.42 1.26 1.26 1.29 1.14 1.25UNC Greensboro 0.99 0.90 0.87 0.75 0.74 3.82 2.82 3.90 3.96 3.64 1.42 1.21 1.28 1.18 1.14Subtotal 0.97 0.95 0.96 0.86 0.88 3.65 3.49 4.32 4.02 4.05 1.40 1.36 1.48 1.38 1.41
Master's (Comprehensive) Universities and Colleges IAppalachian 0.90 0.89 0.88 0.86 0.87 2.41 2.44 2.68 2.44 2.50 1.21 1.22 1.23 1.18 1.19Fayetteville 1.18 1.06 1.24 1.08 1.01 4.06 3.28 3.56 3.20 2.82 1.82 1.54 1.72 1.52 1.34NC Central 1.69 1.65 1.55 1.40 1.27 4.53 3.66 3.37 3.24 3.36 2.13 2.01 1.91 1.74 1.61UNC Pembroke 1.58 1.55 1.35 1.15 1.18 3.39 3.45 3.73 3.36 3.00 1.83 1.81 1.63 1.38 1.39UNC Wilmington 1.12 1.16 0.99 1.00 0.85 3.64 2.90 2.66 2.82 2.64 1.46 1.45 1.30 1.30 1.17Western Carolina 1.02 1.11 1.04 1.08 1.12 3.84 3.98 3.45 3.51 4.64 1.57 1.66 1.53 1.59 1.83Winston-Salem 1.76 1.37 1.26 1.27 1.20 5.64 4.72 4.39 3.73 3.94 2.51 1.98 1.81 1.78 1.71Subtotal 1.18 1.17 1.10 1.06 1.02 3.48 3.19 3.14 3.00 3.13 1.60 1.55 1.48 1.42 1.40
Baccalaureate (Liberal Arts) Universities and Colleges I and IIElizabeth City 3.71 2.64 2.11 1.76 1.79 6.26 5.90 6.16 5.41 4.61 4.61 3.58 3.21 2.72 2.58UNC Asheville 1.24 1.39 1.19 1.16 1.18 4.92 4.45 4.38 4.65 4.80 1.87 2.02 1.79 1.78 1.80Subtotal 2.06 1.88 1.55 1.41 1.43 5.68 5.19 5.28 5.06 4.69 2.93 2.68 2.38 2.19 2.15
Schools of Art, Music, and DesignUNC School of the Arts 3.92 3.92 3.28 3.48 3.11 6.71 7.16 6.46 4.83 4.89 5.62 5.77 5.13 4.37 4.23Subtotal 3.92 3.92 3.28 3.48 3.11 6.71 7.16 6.46 4.83 4.89 5.62 5.77 5.13 4.37 4.23
Community CollegesAlamance 2.05 1.87 1.84 1.64 1.78 4.31 4.64 4.09 3.34 3.33 2.69 2.57 2.45 2.14 2.35Asheville-Buncombe 2.11 2.22 2.09 2.05 2.04 4.41 4.31 4.76 5.22 4.62 3.09 3.17 3.23 3.25 3.08Beaufort Co. 3.03 3.56 2.62 2.74 3.39 9.66 7.26 7.06 6.65 6.75 4.67 4.82 4.13 4.16 4.66Bladen 2.80 3.12 2.36 1.91 1.86 6.34 4.97 6.73 4.04 5.65 3.90 3.90 3.62 2.70 3.00Blue Ridge 4.03 3.80 3.66 3.91 3.20 13.00 11.36 11.46 13.09 8.94 6.71 6.17 6.06 6.61 5.15Brunswick 2.74 3.02 2.80 3.02 2.65 4.13 4.68 5.17 5.05 4.72 3.07 3.42 3.26 3.57 3.19Caldwell 3.00 2.42 2.38 2.26 2.34 7.05 5.50 6.04 4.97 4.04 4.04 3.23 3.27 3.00 2.90Cape Fear 1.79 1.52 1.55 1.53 1.52 3.23 2.88 2.88 3.16 3.15 2.40 2.06 2.07 2.18 2.19Carteret 3.93 3.53 3.46 2.64 3.10 8.30 6.49 7.39 7.47 7.78 5.55 4.73 4.96 4.19 4.70Catawba Valley 2.84 2.25 2.07 1.83 1.58 5.17 4.68 4.79 3.91 4.14 3.86 3.25 3.16 2.76 2.57Central Carolina 3.61 3.35 2.44 2.81 2.50 6.92 6.18 6.70 5.87 4.94 4.64 4.23 3.42 3.69 3.23Central Piedmont 2.11 2.14 2.17 2.09 1.82 6.67 7.55 7.55 7.42 6.11 2.96 3.04 3.04 2.93 2.50Cleveland 3.36 3.08 2.37 2.06 1.97 4.60 4.24 3.89 3.59 3.89 3.95 3.63 3.02 2.69 2.71Coastal Carolina 1.78 1.49 1.58 1.75 1.53 3.23 3.50 3.46 4.24 4.04 2.34 2.17 2.25 2.58 2.32Coll. of Albemarle 5.26 3.73 3.16 2.94 3.20 11.91 7.98 6.35 6.59 6.62 7.81 5.27 4.24 3.90 4.14Craven 2.04 2.05 2.03 2.13 2.72 7.29 6.99 7.01 6.91 6.16 3.37 3.30 3.28 3.40 4.03Davidson County 2.35 2.31 2.28 2.10 2.37 5.92 4.69 4.60 4.33 3.97 3.32 3.06 2.99 2.81 2.92Durham 2.53 1.81 1.97 1.72 1.55 7.02 5.61 5.03 4.98 5.92 3.66 2.68 2.80 2.54 2.45Edgecombe 2.44 1.70 1.62 1.45 1.70 3.99 3.20 3.47 3.24 3.44 3.09 2.29 2.29 2.07 2.35Fayetteville 2.09 2.39 2.11 2.11 1.87 4.27 4.53 5.04 5.16 4.94 2.82 3.13 3.00 3.02 2.75Forsyth 2.22 1.87 1.47 1.58 1.51 5.03 5.00 3.66 4.04 4.41 3.11 2.91 2.18 2.37 2.42Gaston 2.68 2.58 2.28 1.93 2.20 5.54 4.83 4.85 4.65 4.09 3.48 3.24 2.93 2.65 2.77Guilford 1.59 1.55 1.59 1.37 1.42 5.33 6.08 5.17 5.83 5.86 2.41 2.42 2.40 2.11 2.16Halifax 3.40 3.23 3.03 2.67 2.77 7.46 4.92 6.35 5.34 5.28 4.66 3.90 4.10 3.58 3.65Haywood 3.58 3.17 3.57 2.93 3.10 7.42 6.25 7.39 6.54 5.50 5.62 4.96 5.73 5.05 4.48Isothermal 5.16 3.82 3.11 2.59 2.18 5.38 4.44 4.10 3.33 3.28 5.27 4.12 3.61 2.97 2.70James Sprunt 3.04 2.62 2.85 2.53 2.75 5.40 4.42 4.83 5.00 4.84 3.73 3.15 3.45 3.17 3.36Johnston 2.47 2.18 2.18 2.20 2.69 6.83 6.84 5.63 5.58 6.52 3.46 3.13 3.00 3.01 3.63Lenoir 3.24 3.13 2.91 2.89 2.79 7.09 6.87 6.55 5.27 4.75 4.44 4.15 3.94 3.56 3.35

47
Table 9. Space Factors
Institution Classrooms Laboratories Teaching Areas2013 2012 2011 2010 2009 2013 2012 2011 2010 2009 2013 2012 2011 2010 2009
Martin 4.53 3.45 2.94 3.92 5.07 5.39 6.07 5.64 6.39 7.77 4.99 4.64 4.11 5.09 6.29Mayland 3.66 3.12 3.02 3.18 3.11 7.34 7.98 7.62 5.47 5.15 4.59 4.14 3.99 3.83 3.51McDowell 3.87 2.80 3.25 5.00 4.33 4.87 4.48 4.41 4.18 4.12 4.38 3.56 3.84 4.54 4.22Mitchell 2.52 2.20 2.16 1.88 1.96 5.65 4.52 4.63 4.93 5.60 3.22 2.75 2.73 2.46 2.63Montgomery 3.59 3.41 3.13 3.23 2.97 5.00 4.58 4.66 4.81 4.96 4.15 3.87 3.71 3.87 3.68Nash 2.37 2.17 1.86 2.24 1.92 4.52 5.61 4.38 4.36 4.66 3.01 2.98 2.49 2.86 2.60Pamlico 6.47 5.89 6.88 4.70 4.56 10.87 10.81 8.00 7.22 6.82 7.84 7.34 7.32 5.54 5.33Piedmont 4.16 3.82 2.96 2.44 2.30 4.43 3.70 3.24 2.89 3.06 4.28 3.77 3.08 2.63 2.60Pitt 1.33 1.28 1.03 1.04 1.00 4.71 4.38 2.89 3.12 2.86 2.28 2.17 1.60 1.64 1.51Randolph 3.06 2.48 2.17 1.92 2.08 10.03 9.37 11.50 8.09 6.48 4.91 4.25 4.04 3.38 3.55Richmond 2.00 1.95 2.01 2.06 1.95 4.10 4.67 4.25 4.06 5.56 2.68 2.80 2.75 2.76 2.96Roanoke-Chowan 2.68 1.96 3.29 2.54 2.89 5.76 4.79 5.12 5.71 5.78 3.83 2.93 4.12 3.54 3.88Robeson 1.76 1.75 1.45 1.31 1.20 3.21 3.33 3.07 3.31 3.39 2.41 2.41 2.14 1.92 1.85Rockingham 2.18 1.94 1.90 1.72 1.71 8.64 7.30 7.06 7.34 7.38 3.99 3.57 3.48 3.22 3.17Rowan-Cabarrus 1.69 1.81 1.51 1.57 1.21 4.70 4.33 3.95 2.88 3.08 2.52 2.58 2.29 2.08 1.88Sampson 2.30 2.16 2.01 1.93 2.03 4.98 4.95 7.21 5.11 6.48 3.20 3.07 3.23 2.87 3.14Sandhills 2.51 2.14 1.87 2.09 1.94 6.77 5.80 5.00 4.86 5.22 3.32 2.85 2.56 2.77 2.66South Piedmont 3.03 2.91 3.06 1.78 1.63 4.62 5.07 4.86 3.74 4.14 3.63 3.72 3.78 2.42 2.37Southeastern 5.23 3.84 3.51 3.76 2.99 7.50 7.13 5.72 5.44 4.40 5.98 4.84 4.22 4.33 3.50Southwestern 3.09 2.43 2.73 2.40 2.23 5.09 4.90 4.82 4.58 4.52 3.84 3.13 3.48 3.13 2.99Stanly 2.52 2.30 2.11 2.43 1.99 7.22 5.45 6.92 4.13 4.50 3.80 3.22 3.21 3.06 2.75Surry 2.56 2.49 2.74 2.31 2.28 6.16 5.92 5.52 4.43 5.74 3.48 3.31 3.65 3.05 3.28Tri-County 4.02 4.87 4.43 4.41 4.74 4.44 6.83 5.65 5.46 5.53 4.24 5.75 5.01 4.90 5.11Vance-Granville 2.22 2.19 2.17 2.41 2.22 4.51 3.92 4.42 3.93 3.44 3.13 2.86 3.01 3.05 2.74Wake 1.58 1.70 1.37 1.46 1.48 3.56 3.10 3.01 3.08 3.32 2.17 2.19 1.91 2.01 2.11Wayne 1.91 1.93 1.99 2.03 2.09 3.62 3.36 3.32 3.41 3.16 2.72 2.57 2.58 2.63 2.59Western Piedmont 3.62 2.82 2.31 2.13 2.13 5.59 5.45 4.78 5.05 5.65 4.39 3.69 3.06 2.92 2.85Wilkes 2.28 2.30 2.39 2.01 2.02 5.96 6.73 6.15 6.05 6.00 3.32 3.45 3.44 2.99 2.99Wilson 3.53 3.40 4.00 3.22 2.93 5.18 5.57 6.14 4.86 5.29 4.12 4.17 4.78 3.83 3.83Subtotal 2.35 2.21 2.08 1.99 1.95 5.27 4.97 4.83 4.62 4.59 3.26 3.06 2.92 2.80 2.76
Private InstitutionsNC Private Universities
Barton 2.39 2.40 2.40 2.44 2.45 4.72 4.88 4.86 5.46 5.01 2.94 2.97 2.97 3.09 3.04Campbell 1.95 1.68 1.67 1.67 1.69 5.32 4.20 4.15 5.61 4.23 2.36 1.98 1.96 2.03 1.96Mars Hill 2.45 2.42 2.74 3.06 2.91 8.92 8.90 7.87 8.19 8.07 3.49 3.54 3.83 4.21 4.04Pfeiffer 3.29 3.28 2.94 3.03 3.22 8.85 8.23 10.11 9.74 10.49 4.24 4.17 3.95 4.01 4.27Subtotal 2.25 2.08 2.08 2.15 2.16 6.38 5.84 5.81 6.84 6.10 2.88 2.65 2.66 2.79 2.73
Grand Total 1.66 1.59 1.53 1.47 1.45 4.79 4.53 4.53 4.33 4.32 2.40 2.30 2.25 2.16 2.13

*Only one institution in this category
Table 10. Range of Selected Space Utilization Indices for Classrooms and Class Laboratories
*Only one institution in this category48
Table 10. Range of Selected Space Utilization Indices for Classrooms and Class Laboratories
Classification Room Hours Per Week % Student Station Utilization Space FactorHigh Mean Low High Mean Low High Mean Low
Classrooms
Public InstitutionsResearch Universities I 30.8 28.7 26.9 66.0 65.2 64.5 0.96 0.90 0.84Doctoral Universities I and II 30.5 28.1 24.2 67.9 62.5 54.7 1.41 0.97 0.82Master's (Comprehensive) Universities I 30.3 26.0 19.0 70.6 61.6 45.0 1.76 1.18 0.90Baccalaureate (Liberal Arts) Universities 28.5 17.9 10.8 61.0 54.1 44.1 3.71 2.06 1.24Schools of Art, Music, and Design* 11.3 11.3 11.3 52.2 52.2 52.2 3.92 3.92 3.92Community Colleges 28.0 16.9 8.9 79.4 57.9 36.2 6.47 2.35 1.33
Private InstitutionsNC Private Universities 17.7 16.0 11.8 54.2 49.2 37.4 3.29 2.25 1.95
Grand TotalState Range 30.8 19.7 8.9 79.4 60.1 36.2 6.47 1.66 0.82Typical Standard - 35.0 - - 65.0 - - 0.79 -
Class Laboratories
Public InstitutionsResearch Universities I 12.4 12.2 11.6 76.6 73.9 65.3 4.32 3.92 3.80Doctoral Universities I and II 21.0 16.2 14.6 69.2 62.9 56.7 3.82 3.65 3.53Master's (Comprehensive) Universities I 22.5 15.2 9.8 75.6 67.4 49.9 5.64 3.48 2.41Baccalaureate (Liberal Arts) Universities 13.5 10.0 8.2 61.3 57.0 54.0 6.26 5.68 4.92Schools of Art, Music, and Design* 11.6 11.6 11.6 61.9 61.9 61.9 6.71 6.71 6.71Community Colleges 22.7 14.2 7.3 88.0 59.5 29.9 13.00 5.27 3.21
Private InstitutionsNC Private Universities 13.1 9.5 5.9 77.0 53.7 47.5 8.92 6.38 4.72
Grand TotalState Range 22.7 14.1 5.9 88.0 61.6 29.9 13.00 4.79 2.41Typical Standard - 20.0 - - 75.0 - - 7.20 -

TABLE 11:
SPACE STANDARDS
(University of North Carolina only)
Space standards previously published in this study were selected from the Higher Education
Facilities Planning and Management Manuals published by the Western Interstate Commission for
Higher Education. While these published criteria were considered a useful baseline for subsequent
space standards development both at the national level* and by individual states and institutions, the
evolution of room configurations and needs at today’s institutions of higher education had clarified
the need for updated space planning standards in selected categories of space. To this end, the
University of North Carolina, in conjunction with higher education consultants (Eva Klein and
Associates, Ltd.), in 1997-98 developed space planning standards to be used as an additional variable
in the evaluation of capital project needs at the UNC campuses.
It should be noted that the criteria presented here are planning guidelines for current and
future needs based on specific assumptions of program, enrollment, employment, and/or research
growth during a given planning period. They are therefore neither programming nor design
standards for use as either architectural or cost estimation guides. In addition, these standards do not
attempt to address quality issues of space in terms of either facility condition or suitability for current
and future needs. Differences in institutional missions, program diversity, or specific strategic plans
were also not included as components of the development. As a result, these standards are not
intended as exclusive or absolute indicators for determination of project needs. Given these
limitations, the adopted criteria are used within various standard formulas to develop totals for
predicted space for each campus. These figures are in turn used, in comparison with inventoried
space statistics, to calculate hypothetical surplus/deficit assignable square footages in the selected
categories.
Space planning standards were developed for the first four series of HEGIS Room Use
Codes as defined in both the national and N.C. facilities classification manuals. These standards
were officially adopted by the UNC Board of Governors in October, 1998:
100 Series - Classroom Facilities - The standards apply only to the 110-Classroom Room
Use Code. Room Use Code 115 (Classroom Service) is omitted in the calculations in
accordance with typical comparative reporting practices in higher education.
*The most recent set of national space criteria was developed in 1985: Space Planning Guidelines,
Council of Educational Facility Planners, International.
49

Space Standards
Table 11
200 Series - Laboratory Facilities - Two types of laboratory space were studied:
210 - Class Laboratory - This includes only those laboratories that are used for
regularly scheduled instruction. Excluded are areas classified as 215-Class
Laboratory Service, 220-Open Laboratory (irregularly scheduled), and 225-Open
Laboratory Service.
250 - Research/Nonclass Laboratory - Based again on typical industry reporting
standards, this analysis also includes space classified as 255-Research/Nonclass
Laboratory Service as an aggregate for calculations. Only 250/255 space further
classified under the Program Codes for Research (codes 21 and 22) are used in the
calculations.
300 - Office Facilities - Recommendations for office space standards aggregate inventoried
square footages for the four Room Use Codes in the 300-series: 310-Office, 315-Office
Service, 350-Conference Room, and 355-Conference Room Service. This is again in
accordance with recently inventoried space standards for higher education systems and
institutions throughout the country.
400 - Study Facilities - For study facilities, separate figures for predicted space are
calculated for 410-Study Room, 420-Stack, 430-Open-Stack Study Room (using an
assumption of an equal assignment of space to stack and study area within the formula), 440-
Processing Room, and 455-Study Service. For surplus/deficit estimations, these figures are
aggregated to study, stack, and service space and then subset under Program Code 41-Library
Services for application to campus central libraries (i.e., excludes departmental libraries and
study areas within residential and other buildings).
CLASSROOM (110) STANDARDS
Average Student Station Size 18 ASF
(See Table 16)
Average Weekly Room Hours 35 hours/week
(Also Room Utilization Rate - see Table 3)
Station Occupancy Ratio 65%
(Also Percent Student Station
Utilization - see Table 7)
Space Factor (see Table 9) 0.79
50

Space Standards
Table 11
CLASS (TEACHING) LABORATORY (210) STANDARDS
Space Factors are based on a Percent Student Station Utilization (Station Occupancy Ratio) of
75% and a Weekly Room Hour (Room Utilization Rate) standard of 20 hours.
ASF Space
Teaching Lab Category Discipline Per Station Factor
Highly Intensive Engineering (including 108 7.2
Textiles), Applied Design,
Dance, Dramatic Arts.
Intensive Agriculture, Architecture 70 4.67
Biological Sciences, Health
Professions, Library Sciences,
Physical Sciences.
Moderately Intensive Communications, Computer/ 50 3.33
Info Tech, Education, Art, Home
Economics, Law, Psychology.
Non-Intensive Business, Cinematograpy, 33 2.2
Music, Language, Letters,
Mathematics, Public Affairs,
Social Sciences.
RESEARCH/NONCLASS LABORATORY (250/255) STANDARDS
Currently, a research space planning standard ASF allowance of 9,000 square feet per $1 million of
organized research expenditures, averaged over five years, is recommended for application to only
the two major research universities–UNC-Chapel Hill and N.C. State University. For all other UNC
institutions, program considerations, and not planning standards, remain as the basis for justification
for research space capital requests. A recommendation is in place to ultimately develop four
categories of disciplines with corresponding ASF allowances per $1 million of averaged
expenditures:
51

Space Standards
Table 11
RESEARCH/NONCLASS LABORATORY (250/255) STANDARDS (continued)
ASF per $l M
Averaged Organized
Research Lab Category Discipline Research Expenditures
Highly Intensive Production Agriculture/ 11,000
Animal, Crop, Poultry,
Soil Sciences.
Intensive Agricultural Sciences (other 9,000
than Production Agriculture),
Architecture and Related Programs,
Conservation and Renewable
Resources/Textiles, Forestry,
Marine Sciences, Engineering,
Health Professions, Physical
Sciences.
Moderately Intensive Biological Sciences, Home 6,000
Economics, Psychology.
Non-Intensive Applied Math/Statistics, 4,000
Business, Communications,
Education, Fine Arts, Languages,
Law, Letters, Library Sciences,
Public Affairs, Social Sciences.
OFFICE FACILITY (310/315, 350/355) STANDARDS
Office standards are based on an aggregation of all office facilities space (Office-310, Office Service-
315, Conference Room-350, Conference Room Service-355). Four standards of ASF allowance,
based on personnel categories, were developed.
Administrative 275 ASF
Instructional and Professional 190 ASF
Technical and Clerical 140 ASF
Graduate Assistants 95 ASF
52

Space Standards
Table 11
STUDY FACILITY (410, 420, 430, 440, 455) STANDARDS
Central Libraries only (Program Code 41)
Study Space (Includes 410-Study Room 25 ASF per station for 20%
and 50% of 430-Open-Stack of FTE students plus 8% of
Study Room space) FTE faculty.
Stack Space (Includes 420-Stack and 50% 0.08 ASF per volume
of 430-Open-Stack Study Room
Space)
Service Space (Includes 440-Processing Room 15% of the combined predicted
and 455-Study Service space) requirement for study and stack
space.
53

TABLE 12:
ENROLLMENTS
The two primary measures of student populations are full-time equivalent (FTE)
enrollment and headcount enrollment. FTE enrollment considers part-time students as fractions
of full-time students through the use of conversion formulas which are described below.
Headcount enrollment makes no distinction between full-time and part-time students.
FTE enrollments are generally more relevant than headcount enrollments in making
space utilization assessments. Table 12, therefore, reports only FTE enrollments. This section,
however, does describe some data trends in headcount enrollment.
FTE Enrollment
FTE enrollment as used in this study is based on the fall enrollment. It is defined as the
number of full-time students (those carrying at least 75 percent of the normal credit hour load)
plus the equivalent number of students enrolled for less than 75 percent of the normal full-time
load. In obtaining the undergraduate FTE enrollment figures for the University of North
Carolina, a student carrying 12 or more credit hours is considered a full-time student. In those
instances where a student takes less than 12 hours, the following method of calculating FTE
students is used: a student with a load of nine through 11 credit hours is the equivalent of 3/4
FTE; the student with a six through eight credit hour load is the equivalent of ½ FTE; and a
student with less than six credit hours is the equivalent of 1/4 FTE. In obtaining graduate FTE
enrollment figures for the University of North Carolina, a student carrying nine or more credit
hours is considered a full-time student. In those instances where a graduate student takes less
than nine credit hours, the following method of equating is used: a student with a load of six
through eight credit hours is the equivalent of 3/4 FTE; the student with a three through five
credit hour load is the equivalent of ½ FTE; and a student with less than three credit hours is the
equivalent of 1/4 FTE.
The N.C. Community College System Office reports FTE based on its official “class
membership" hour formula for calculation. Sixteen class membership hours per week for 16
weeks equate to one fall semester FTE. The total fall credit FTE is based on the total class
membership hours per week times sixteen weeks divided by 256 (16 membership hours times 16
weeks).
For the community colleges, Table 12, for 2009-2012, lists only fall on-campus
(inventoried space) credit enrollments. Noncredit enrollments are not included. Instruction
which took place in facilities not on a community college’s facilities inventory was not
considered in determining the FTE enrollments listed. For 2013, the fall on-campus credit FTE
is provided, but as a means of comparison, the total fall credit FTE (representing both on-campus
and off-campus credit instruction) is listed for all community colleges. Since private colleges
and universities and the constituent institutions of the University of North Carolina do not
conduct a significant number of instructional courses off-campus, the total FTE enrollments
which are listed may also be considered as approximating these institutions' campus-based en-
rollments. 54

Trends in Headcount Enrollments*
In 2011, a projection study was completed by the National Center for Education Statistics
(NCES) which presents an estimate map of higher education headcount enrollments at the
national level for the years 2009 through 2019, using enrollment data and demographic studies
from the years 1994 to 2008.* Highlights of these projections are presented here.
All Higher Education Institutions
Between 2000 and 2002, higher education enrollment increased from 15.3 million to 16.6
million, a growth of eight percent. Enrollment then increased from 17.5 million in 2000 to 19.1
million in 2008, an increase of nine percent over the period. This enrollment is expected to
increase to 22.4 million by the year 2019, an increase of 17 percent from 2008.
Enrollments by Gender of Student
Women played a major role in the increase of enrollment between 2000-2008.
Enrollment of women increased from 8.6 million in 2000 to 10.9 million in 2008 (27 percent).
This number is projected to increase to 13.2 million by the year 2019, or an additional 21
percent. Enrollment of men rose from 6.7 million to 8.2 million between 2000 and 2008. This
number is expected to increase to 9.2 million by 2019, a growth of 12 percent over the period.
Women’s share of college enrollments is projected to be 59% by 2019.
Enrollments in Public and Private Institutions
From 2000 to 2002, public institution enrollment grew from 11.8 million to 12.8 million.
Enrollment increased to 13.0 million in 2005 followed by a rise to 13.9 million in 2008, for a net
increase of seven percent over the period. This figure is expected to increase by another 18
percent to 16.5 million by the year 2019. Enrollment in private institutions grew from 3.6
million in 2000 to 5.1 million in 2008, an increase of 44 percent. Private enrollment is projected
to reach a high of 5.9 million by 2019, which is an additional 15 percent growth.
North Carolina institutions experienced a headcount enrollment increase of 0.4 percent in
2013. Public institutions showed a 0.3 percent increase, while private enrollments increased this
year by 0.7 percent. Enrollments for men increased by 0.7 percent and women increased by 0.1
percent. North Carolina's 2013 part-time enrollment decreased by 9.7 percent while the state’s
full-time enrollment increased by 3.6 percent.
* Hussar, William J. and Bailey, Tabitha M. ; Projections of Education Statistics to 2019; U.S.
Department of Education, National Center for Education Statistics, March 2011.
55
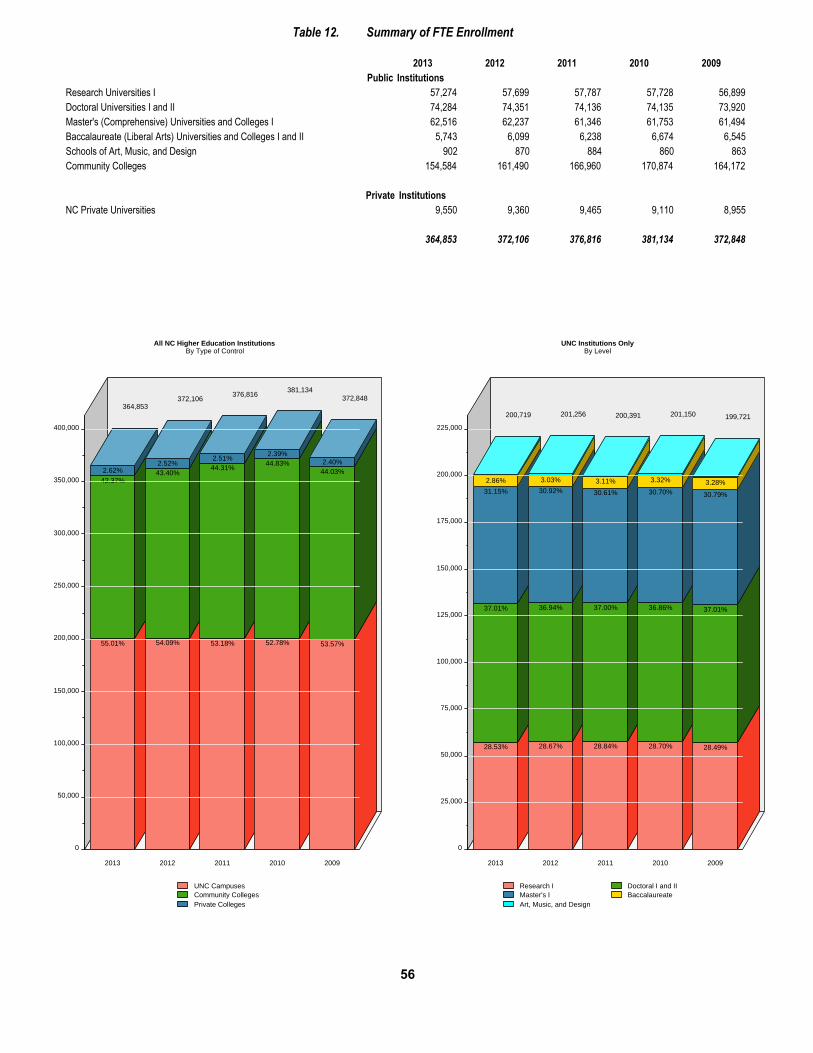
Table 12. Summary of FTE Enrollment
2013 2012 2011 2010 2009Public Institutions
Research Universities I 57,274 57,699 57,787 57,728 56,899Doctoral Universities I and II 74,284 74,351 74,136 74,135 73,920Master's (Comprehensive) Universities and Colleges I 62,516 62,237 61,346 61,753 61,494Baccalaureate (Liberal Arts) Universities and Colleges I and II 5,743 6,099 6,238 6,674 6,545Schools of Art, Music, and Design 902 870 884 860 863Community Colleges 154,584 161,490 166,960 170,874 164,172
Private InstitutionsNC Private Universities 9,550 9,360 9,465 9,110 8,955
364,853 372,106 376,816 381,134 372,848
All NC Higher Education InstitutionsBy Type of Control
UNC CampusesCommunity CollegesPrivate Colleges
55.01%
42.37%
2.62%
364,853
54.09%
43.40%2.52%
372,106
53.18%
44.31%2.51%
376,816
52.78%
44.83%2.39%
381,134
53.57%
44.03%2.40%
372,848
0
50,000
100,000
150,000
200,000
250,000
300,000
350,000
400,000
2013 2012 2011 2010 2009
UNC Institutions OnlyBy Level
Research I Doctoral I and IIMaster's I BaccalaureateArt, Music, and Design
28.53%
37.01%
31.15%
2.86%
200,719
28.67%
36.94%
30.92%
3.03%
201,256
28.84%
37.00%
30.61%
3.11%
200,391
28.70%
36.86%
30.70%
3.32%
201,150
28.49%
37.01%
30.79%
3.28%
199,721
0
25,000
50,000
75,000
100,000
125,000
150,000
175,000
200,000
225,000
2013 2012 2011 2010 2009
56

572013 UNCSA FTE enrollment including high school students is 1,172.2013 UNCSA FTE enrollment including high school students is 1,172.Total community college FTE enrollment includes both on- and off-campus students. See pages 54-55.Total community college FTE enrollment includes both on- and off-campus students. See pages 54-55.
Table 12. FTE Enrollments by Institution
Institution 2013 2012 2011 2010 2009On-Campus Total On-Campus On-Campus On-Campus On-Campus
Public InstitutionsResearch Universities I
NC State 29,928 - 30,296 30,638 30,397 29,875NC State Veterinary Med 357 - 334 312 310 317UNC-Chapel Hill 22,266 - 22,312 22,167 22,419 22,534UNC-Chapel Hill Hlth Aff. 4,723 - 4,757 4,670 4,602 4,173Subtotal 57,274 - 57,699 57,787 57,728 56,899
Doctoral Universities I and IIEast Carolina 21,840 - 21,830 22,352 22,727 22,397East Carolina Hlth Aff. 2,430 - 2,368 2,236 2,164 2,147NC A&T 9,844 - 9,859 10,063 9,983 9,792UNC Charlotte 23,975 - 23,540 22,630 22,286 21,910UNC Greensboro 16,195 - 16,754 16,855 16,975 17,674Subtotal 74,284 - 74,351 74,136 74,135 73,920
Master's (Comprehensive) Universities and Colleges IAppalachian 17,097 - 16,815 16,654 16,388 16,153Fayetteville 5,319 - 5,227 5,199 5,036 5,446NC Central 7,477 - 7,869 7,587 7,813 7,730UNC Pembroke 5,443 - 5,522 5,477 6,053 5,823UNC Wilmington 13,106 - 12,871 12,321 12,214 12,060Western Carolina 9,038 - 8,635 8,343 8,312 8,252Winston-Salem 5,036 - 5,298 5,765 5,937 6,030Subtotal 62,516 - 62,237 61,346 61,753 61,494
Baccalaureate (Liberal Arts) Universities and Colleges I and IIElizabeth City 2,301 - 2,720 2,772 3,112 3,078UNC Asheville 3,442 - 3,379 3,466 3,562 3,467Subtotal 5,743 - 6,099 6,238 6,674 6,545
Schools of Art, Music, and DesignUNC School of the Arts 902 (270) 870 884 860 863Subtotal 902 (270) 870 884 860 863
Community CollegesAlamance 3,216 (3,426) 3,430 3,772 3,592 3,570Asheville-Buncombe 5,798 (6,154) 6,148 5,888 5,670 5,358Beaufort Co. 1,222 (1,566) 1,312 1,346 1,320 1,312Bladen 1,116 (1,146) 1,232 1,432 1,612 1,474Blue Ridge 1,430 (1,810) 1,422 1,540 1,586 1,664Brunswick 1,050 (1,380) 980 1,020 1,034 1,140Caldwell 2,404 (3,070) 2,952 3,154 3,060 3,154Cape Fear 6,468 (7,494) 6,710 6,936 6,896 6,568Carteret 938 (1,294) 1,066 1,072 1,152 1,170Catawba Valley 2,730 (3,616) 2,974 3,272 3,542 3,528Central Carolina 3,726 (3,972) 3,816 3,526 3,874 3,816Central Piedmont 10,490 (14,176) 10,386 10,888 11,180 10,810Cleveland 1,800 (2,740) 1,882 2,108 2,364 2,334Coastal Carolina 2,808 (3,652) 2,902 2,918 3,132 3,050Coll. of Albemarle 1,220 (2,024) 1,144 1,448 1,482 1,502Craven 1,820 (2,560) 1,758 1,956 2,000 1,906Davidson County 3,220 (3,220) 3,318 3,412 3,540 3,368Durham 3,064 (3,706) 3,218 3,094 3,402 3,196Edgecombe 1,556 (2,270) 1,698 1,826 2,040 1,890Fayetteville 9,000 (9,178) 9,028 8,530 8,054 8,018Forsyth 6,628 (7,190) 6,974 7,404 7,030 6,426Gaston 4,624 (4,674) 4,850 4,858 5,174 5,218Guilford 8,404 (10,372) 9,744 10,462 10,630 9,636Halifax 810 (1,180) 986 1,098 1,186 1,178

582013 UNCSA FTE enrollment including high school students is 1,172.Total community college FTE enrollment includes both on- and off-campus students. See pages 54-55.
Table 12. FTE Enrollments by Institution
Institution 2013 2012 2011 2010 2009On-Campus Total On-Campus On-Campus On-Campus On-Campus
Haywood 1,106 (1,760) 1,158 1,308 1,428 1,178Isothermal 1,338 (1,862) 1,566 1,542 1,842 1,910James Sprunt 1,124 (1,130) 1,322 1,190 1,124 1,216Johnston 2,578 (3,576) 2,686 2,852 2,842 2,560Lenoir 2,288 (2,350) 2,266 2,518 2,670 2,556Martin 632 (654) 650 712 688 664Mayland 776 (938) 824 826 840 808McDowell 964 (964) 1,094 1,096 1,296 1,268Mitchell 1,854 (2,464) 2,006 2,280 2,302 2,192Montgomery 658 (690) 680 642 682 686Nash 2,100 (2,642) 2,050 2,122 2,280 2,010Pamlico 78 (470) 84 148 178 228Piedmont 1,230 (1,298) 1,402 1,762 2,024 2,090Pitt 6,892 (7,392) 6,876 6,260 6,256 5,526Randolph 1,746 (2,538) 1,686 1,760 1,892 1,690Richmond 1,846 (1,974) 1,950 1,928 1,756 1,544Roanoke-Chowan 568 (718) 576 648 594 546Robeson 1,914 (1,940) 2,462 2,340 2,218 2,320Rockingham 1,618 (1,618) 1,620 1,888 2,042 2,020Rowan-Cabarrus 3,714 (5,386) 3,850 4,504 4,990 4,950Sampson 1,092 (1,234) 1,078 1,150 1,238 1,190Sandhills 2,486 (3,288) 2,588 2,740 2,898 2,806South Piedmont 1,058 (1,742) 960 1,102 1,270 1,122Southeastern 928 (1,274) 1,064 1,228 1,378 1,558Southwestern 1,298 (1,998) 1,394 1,394 1,478 1,388Stanly 1,986 (2,134) 2,118 2,376 2,296 2,314Surry 2,750 (2,768) 2,750 2,808 2,748 2,776Tri-County 588 (1,132) 674 722 770 744Vance-Granville 2,802 (2,710) 2,896 3,174 3,092 3,084Wake 11,074 (15,116) 11,248 10,784 10,394 9,216Wayne 3,020 (3,266) 2,964 2,836 2,932 2,732Western Piedmont 1,678 (2,110) 1,778 2,128 2,214 2,322Wilkes 2,326 (2,456) 2,282 2,286 2,532 2,536Wilson 932 (1,440) 958 946 1,138 1,136Subtotal 154,584 (186,902) 161,490 166,960 170,874 164,172
Private InstitutionsNC Private Universities
Barton 976 - 979 1,067 1,041 1,017Campbell 5,617 - 5,432 5,426 5,265 5,047Mars Hill 1,389 - 1,328 1,249 1,139 1,198Pfeiffer 1,568 - 1,621 1,723 1,665 1,693Subtotal 9,550 - 9,360 9,465 9,110 8,955
Grand Total 364,853 (187,172) 372,106 376,816 381,134 372,848

Campbell University School of Osteopathic Medicine, Campbell University
Fall 2013 marked a historical moment in North Carolina when Campbell University
opened the first and only osteopathic medical school in the state. Responding to the need for
primary care physicians in North Carolina, especially in rural areas, this medical school will
primarily focus on training community-based osteopathic physicians who work in underserved
regions. Doctors of osteopathic medicine practice a whole-person approach, which means they
consider both the physical and mental needs of their patients. The 96,500 square foot Leon
Levine Hall of Medicine Sciences consists of classrooms, clinical simulation laboratories, small
group rooms, as well as student activity and administrative office space.
Interior Space Characteristics
Net-to-Gross Ratio . . . . . . . . . . . . . . . . . . . . . . . . . . . . . . . . . . . . . . . . . . 61Summary Programs . . . . . . . . . . . . . . . . . . . . . . . . . . . . . . . . . . . . . . . . 64Instruction, Research, and Public Service Subprograms . . . . . . . . . . . . . 71Academic Support Subprograms . . . . . . . . . . . . . . . . . . . . . . . . . . . . . . . 78Student Service and Physical Plant Operations Subprograms . . . . . . . . 82Institutional Administrations, Independent Operations &
Unassigned Subprograms . . . . . . . . . . . . . . . . . . . . . . . . . . . . . . . . . . 86Assignable Area by Room Code . . . . . . . . . . . . . . . . . . . . . . . . . . . . . . . 90ASF Per Student Stations for Classrooms . . . . . . . . . . . . . . . . . . . . . . . . 98ASF Per Student Stations for Class Laboratories . . . . . . . . . . . . . . . . . . 102
59

This Page Intentionally Left Blank
60

TABLE 13:
NET-TO-GROSS RATIO
The net-to-gross ratio is the assignable square foot (ASF) area of a building or group of buildings divided by the gross square foot (GSF). It is generally used as a measure of the efficiency of a building: the higher the net-to-gross ratio, the more space that can be assigned to the various programs for which the building was intended.
Simply stated, the gross area of a building is the sum of the floor areas of the outside faces of its exterior walls for all of the building's stories (or areas that have floor surfaces). A building's assignable area is the sum of all areas on all floors which are assigned to, or available for assignment to, an occupant or specific use. More specifically, it is the building's gross area less its building service, circulation, mechanical, and structural areas.
Beginning in 1985, parking deck space was coded as nonassignable. This change in policy, while providing a truer picture of interior space characteristics, has the effect of decreasing the net-to-gross ratios of institutions with parking decks because GSF figures include these structures. The following institutions have parking decks (their gross areas are indicated in parentheses): Cape Fear CC (581,435 sq. ft.), Central Piedmont CC (1,115,530 sq. ft.), Wake Technical CC (350,216), Guilford Technical CC (140,814) Appalachian State University (384,144), UNC at Wilmington (308,801), N. C. State University (2,304,785 sq. ft.), N.C. State Veterinary Medicine, (179,528 sq. ft), UNC at Chapel Hill-Health Affairs (1,707,986 sq. ft.), UNC at Chapel Hill-Academic Affairs (1,245,597 sq. ft.), UNC at Charlotte (2,704,732), UNC at Greensboro (875,642), UNC at Asheville (136,854). Adjusted net-to-gross figures for these institutions, which eliminate parking decks entirely and thus provide a more accurate index of campus space efficiency, are as follows: Cape Fear CC (59.4%), Central Piedmont CC (63%), Wake Technical CC (62.7%), Guilford TCC (65.4%) (N.C. State University (63%), N.C. State Veterinary Medicine, (63.4%), UNC at Chapel Hill-Health Affairs (54.3%), UNC at Chapel Hill Academic Affairs (60.6%), UNC at Charlotte (58.6%), UNC at Greensboro (57.9%), Appalachian State University (62.5%), UNC at Wilmington (62.1%), UNC at Asheville (64%).
If a renovation can increase the amount of assignable space in a building, then part of the cost of the renovation can be justified purely on a cost savings basis. Tables 19 and 20 suggest that new construction costs average $235 per gross square foot. Table 13 indicates that the average net-to-gross ratio is .568. This means that new construction costs are approximately $414 per assignable square foot.
CONSTRUCTION COST/ASF = CONSTRUCTION COST/GSF NET-TO-GROSS RATIO CONSTRUCTION COST/ASF = $235 = $414 .568 Thus every assignable square foot created through a renovation can be viewed as saving the institution $414 in new construction costs.
61

62
Table 13. Net-to-Gross Ratio
Institution Gross Sq. Ft. Assignable Sq. Ft. Net-to-Gross %2013 2012 2011 2010 2009
Public InstitutionsResearch Universities I
NC State 16,097,535 8,683,235 53.9 53.3 53.1 54.4 55.5NC State Veterinary Med 849,240 424,851 50.0 50.2 49.5 64.0 64.1UNC-Chapel Hill 13,170,370 7,222,629 54.8 54.8 54.9 54.7 56.6UNC-Chapel Hill Hlth Aff. 6,365,256 2,530,262 39.8 39.8 40.0 39.9 39.9Subtotal 36,482,401 18,860,977 51.7 51.4 51.3 52.1 53.1
Doctoral Universities I and IIEast Carolina 4,906,467 3,272,813 66.7 68.6 68.4 68.3 68.7East Carolina Hlth Aff. 1,556,358 827,019 53.1 56.3 56.2 56.1 59.0NC A&T 3,165,804 2,218,401 70.1 70.1 70.3 70.7 71.5UNC Charlotte 8,670,875 3,493,311 40.3 40.1 42.4 44.0 44.0UNC Greensboro 6,053,737 2,997,367 49.5 47.8 49.3 46.1 46.2Subtotal 24,353,241 12,808,911 52.6 53.0 54.5 54.5 54.9
Master's (Comprehensive) Universities and Colleges IAppalachian 4,895,596 2,821,238 57.6 59.1 58.7 58.1 58.6Fayetteville 1,448,406 892,087 61.6 61.9 61.2 58.7 58.6NC Central 2,263,733 1,457,852 64.4 64.4 64.4 63.3 63.3UNC Pembroke 1,551,034 1,023,469 66.0 66.0 66.6 65.0 65.1UNC Wilmington 3,818,579 2,179,820 57.1 59.7 57.5 57.9 66.8Western Carolina 3,175,222 2,028,270 63.9 63.8 64.9 64.9 65.1Winston-Salem 1,732,930 1,114,239 64.3 64.2 61.9 61.9 63.4Subtotal 18,885,500 11,516,975 61.0 61.9 61.3 60.8 62.8
Baccalaureate (Liberal Arts) Universities and Colleges I and IIElizabeth City 1,298,136 862,299 66.4 66.4 66.4 67.1 67.6UNC Asheville 1,523,357 887,132 58.2 58.7 59.5 59.6 59.5Subtotal 2,821,493 1,749,431 62.0 62.2 62.8 63.2 63.4
Schools of Art, Music, and DesignUNC School of the Arts 1,052,659 738,551 70.2 70.0 69.9 69.9 69.7Subtotal 1,052,659 738,551 70.2 70.0 69.9 69.9 69.7
Teaching HospitalsUNC Hospitals 2,499,249 1,358,302 54.3 54.3 54.3 54.3 54.3Subtotal 2,499,249 1,358,302 54.3 54.3 54.3 54.3 54.3
Community CollegesAlamance 393,712 238,366 60.5 60.9 60.9 60.7 58.7Asheville-Buncombe 894,841 511,055 57.1 57.4 57.1 57.1 57.0Beaufort Co. 270,733 189,556 70.0 70.0 71.2 71.1 71.1Bladen 150,920 110,946 73.5 74.6 75.3 75.3 75.5Blue Ridge 401,360 290,314 72.3 72.3 72.2 72.1 71.6Brunswick 389,291 254,175 65.3 65.4 65.9 64.7 64.7Caldwell 490,265 340,713 69.5 69.5 69.2 69.1 69.1Cape Fear 1,616,235 614,635 38.0 53.3 53.4 62.5 62.8Carteret 236,630 167,124 70.6 70.6 69.6 69.6 69.6Catawba Valley 566,125 365,292 64.5 64.5 64.5 69.2 69.2Central Carolina 585,654 404,568 69.1 69.7 69.7 70.2 70.8Central Piedmont 3,163,892 1,289,900 40.8 40.6 40.3 40.5 44.9Cleveland 301,108 207,079 68.8 68.8 67.4 67.4 67.4Coastal Carolina 331,906 218,626 65.9 67.9 68.0 68.0 68.0Coll. of Albemarle 404,088 272,245 67.4 63.4 63.4 62.7 63.0Craven 315,007 210,443 66.8 66.1 66.0 65.9 66.3Davidson County 455,455 310,482 68.2 68.2 67.9 67.7 67.1Durham 510,737 343,071 67.2 67.1 67.1 67.3 68.8Edgecombe 245,878 169,084 68.8 69.0 68.7 68.7 68.7Fayetteville 935,889 630,851 67.4 67.4 68.3 68.1 68.8Forsyth 964,500 668,782 69.3 69.6 69.3 69.3 67.6Gaston 714,567 475,497 66.5 65.9 66.3 66.8 66.8

63
Table 13. Net-to-Gross Ratio
Institution Gross Sq. Ft. Assignable Sq. Ft. Net-to-Gross %2013 2012 2011 2010 2009
Guilford 1,493,391 884,897 59.3 59.3 67.3 67.5 67.0Halifax 275,321 187,362 68.1 68.1 68.1 68.1 68.1Haywood 355,826 253,015 71.1 73.7 73.4 73.1 75.1Isothermal 356,005 241,215 67.8 67.7 66.8 66.9 66.9James Sprunt 166,650 117,674 70.6 70.9 70.9 70.9 71.7Johnston 470,046 338,241 72.0 72.1 72.1 70.8 70.7Lenoir 430,249 322,942 75.1 75.3 75.3 73.2 73.1Martin 229,431 170,782 74.4 74.4 74.4 74.4 74.4Mayland 159,916 113,020 70.7 71.9 72.4 70.6 72.3McDowell 159,319 117,076 73.5 73.5 73.5 73.5 73.1Mitchell 400,529 268,212 67.0 67.0 67.0 68.3 68.2Montgomery 129,642 92,421 71.3 71.3 70.2 70.0 70.4Nash 262,731 175,598 66.8 66.8 65.4 65.4 65.4Pamlico 86,035 55,243 64.2 64.2 64.2 64.5 64.5Piedmont 182,713 143,109 78.3 77.6 77.6 77.6 77.6Pitt 582,222 376,412 64.7 64.7 63.9 64.1 64.5Randolph 392,622 293,984 74.9 75.7 75.6 75.4 76.0Richmond 253,209 177,786 70.2 70.1 70.5 70.5 70.7Roanoke-Chowan 167,421 117,209 70.0 70.0 70.0 70.0 70.0Robeson 279,660 201,239 72.0 72.0 72.1 69.2 70.2Rockingham 327,731 230,981 70.5 70.8 70.8 70.8 70.4Rowan-Cabarrus 518,864 378,353 72.9 73.3 73.3 73.1 74.9Sampson 199,414 139,057 69.7 69.7 69.7 69.7 69.8Sandhills 495,633 321,663 64.9 65.5 66.0 66.0 66.6South Piedmont 404,558 322,160 79.6 76.2 58.7 75.6 75.6Southeastern 247,000 183,591 74.3 72.3 72.4 72.3 72.5Southwestern 294,802 203,835 69.1 69.1 71.3 71.0 71.0Stanly 208,656 147,199 70.5 70.5 70.5 70.8 71.0Surry 445,655 313,753 70.4 70.7 69.8 70.7 70.7Tri-County 153,889 117,608 76.4 76.4 76.4 76.6 75.7Vance-Granville 406,209 264,751 65.2 63.2 63.2 62.8 63.0Wake 1,703,651 848,436 49.8 55.0 54.5 63.3 64.6Wayne 402,962 255,443 63.4 63.5 62.3 62.2 62.2Western Piedmont 398,912 287,293 72.0 72.1 71.9 72.0 72.0Wilkes 410,580 298,201 72.6 72.6 71.8 71.7 72.0Wilson 209,319 143,403 68.5 69.3 69.3 69.3 69.4Subtotal 27,999,566 17,385,968 62.1 63.5 63.6 64.6 65.6
Private InstitutionsNC Private Universities
Barton 495,166 350,454 70.8 70.8 70.8 70.8 70.8Campbell 1,649,014 1,122,004 68.0 68.8 68.8 69.2 69.6Mars Hill 804,814 543,596 67.5 68.0 68.0 68.0 68.0Pfeiffer 558,149 373,986 67.0 67.0 66.9 70.0 70.3Subtotal 3,507,143 2,390,040 68.1 68.6 68.6 69.3 69.5
Grand Total 117,601,252 66,809,155 56.8 57.3 57.5 57.9 58.9

TABLE 14:
PERCENTAGE DISTRIBUTION OF ASSIGNABLE AREA
BY SUMMARY PROGRAMS AND SUBPROGRAMS
All colleges and universities conduct a wide range of activities in pursuit of their
missions as institutions of higher education. The Program Classification Structure, developed by
the National Center for Higher Education Management Systems in 1978, attempts to categorize
these activities.
The structure divides all of an institution's activities into ten major categories, called
programs. Each program is divided into various subprograms. Virtually every activity and
square foot of assignable space can be related to one of these subprograms.
Table 14 reports for each institution the percentage of total assignable area which is
classified under each program. Tables 14a-14d indicate these percentages for the subprograms.
Definitions of the programs and subprograms are provided in the narratives which precede the
tables.
In Tables 14 and 14a-14d, the percentages relate the assignable square footage of the
specified program or subprogram to the total assignable area for the institution. For Table 14,
these percentages should in theory add to exactly 100.0, but in some cases they do not because of
rounding. In Tables 14a-14d, the sums of the percentages reported for the subprograms
comprising a certain program should in theory equal the percentage for that program as reported
in Table 14. Again, they sometimes do not because of the rounding of the subprogram
percentages.
64

PROGRAM DEFINITIONS
The descriptions of programs and subprograms which precede Tables 14-14d are
excerpted from Program Classification Structure: Technical Report 106 by Douglas J. Collier.
10 Instruction Program. This program includes activities carried out for the express
purpose of eliciting some measure of educational change in a learner or group of learners.
An instructional activity need not be eligible for credit in meeting specified formal
curricular requirements leading to a post-secondary degree or certificate.
20 Research Program. Any activity intended to produce one or more research outcomes--
including the creation of knowledge, the organization of knowledge, and the application
of knowledge--is included within this program. A research activity may be conducted
with institutional funds or under the terms of agreement with an agency external to the
institution.
30 Public Service. The Public Service Program includes activities established to make
available to the public the various resources and capabilities of the institution for the
specific purpose of responding to a community need or solving a community problem.
40 Academic Support Program. Any activity carried out in direct support of one or more
of the Instruction (10), Research (20), and Public Service (30) Programs is classified as
Academic Support.
50 Student Service Program. The objective of the Student Service Program is to
contribute to the emotional and physical well-being of the students, as well as to their
intellectual, cultural, and social development outside of the context of the institution's
formal Instruction Program.
60 Institutional Administration Program. This program consists of those activities
carried out to provide for both the day-to-day functioning and the long-range viability of
the institution as an operating organization. The ultimate goal of the Institutional
Administration Program is to provide for the institution's organizational effectiveness and
continuity.
70 Physical Plant Operations Program. Activities related to maintaining existing grounds
and facilities, providing utility services, and planning and designing future plant
expansions and modifications are included within the Physical Plant Operations Program.
65

80 Student Financial Support Program. This program includes only the financial
assistance provided to students in the form of outright grants, trainee stipends, and prizes,
awarded by and/or administered through the institution. Although it is part of the
Program Classification Structure, this program applies only to funds and not to space or
activities. It is not, therefore, used in facilities inventories.
90 Independent Operations Program. Those institutional activities that are owned or
controlled by the institution as investments, and which are financed as part of the
institution's current operations, comprise the Independent Operations Program.
00 Unassigned. Facilities that are not in use at the time of the inventory are classified under
this program. It is unique to facilities management and is not included in the Program
Classification Structure.
66

Percentage Distribution of Assignable Areaby Summary Programs
Instruction Research Public ServiceAcademic Support Student Services Inst. Admin.Other
11,216
1,315
1,577
1,415
1,538
17,386
11,363
5,500
2,388
4,064
17,917
2,863
2,939
47,033
689
1,221
2,390
1000s ofSquare Feet
0
5,000
10,000
15,000
20,000
25,000
30,000
35,000
40,000
45,000
NC CC UNC NC Prvt
Instruction Research Public ServiceAcademic Support Student Services Inst. Admin.Other
64.51%
1.78%
7.56%
9.07%
8.14%
8.85%
24.16%
11.69%
5.08%
8.64%
38.09%
6.09%
6.25%
28.84%
7.01%
51.08%
7.52%
4.66%
0
10
20
30
40
50
60
70
80
90
100
NC CC UNC NC Prvt
67

68
Table 14. Percentage Distribution of Assignable Area by Summary Programs
AssignableSq. Ft.
In-struction
10Research
20
PublicService
30
AcademicSupport
40
StudentServices
50
Inst.Admin.
60
PhysicalPlant
70
Indep.Opns.
80
Un-assigned
00Public Institutions
Research Universities INC State 8,683,235 18.7 29.3 3.9 7.3 28.4 5.7 1.3 2.0 3.3NC State Veterinary Med 424,851 23.6 32.4 29.4 6.9 1.5 0.4 5.2 0.7 0.0UNC-Chapel Hill 7,222,629 21.5 7.5 0.6 11.0 47.9 5.8 3.4 0.8 1.4UNC-Chapel Hill Hlth Aff. 2,530,262 24.7 46.8 10.1 9.0 0.8 2.1 0.3 1.5 4.8Subtotal 18,860,977 20.7 23.4 4.1 9.0 31.5 5.2 2.1 1.5 2.7
Doctoral Universities I and IIEast Carolina 3,272,813 28.7 2.3 0.7 6.5 42.6 5.6 3.0 1.4 9.3East Carolina Hlth Aff. 827,019 26.1 21.3 31.4 12.2 - 4.7 3.2 - 1.1NC A&T 2,218,401 35.6 7.0 1.1 13.1 29.8 11.5 1.4 0.0 0.4UNC Charlotte 3,493,311 26.2 7.0 0.3 9.6 50.0 4.4 0.9 - 1.6UNC Greensboro 2,997,367 22.5 5.9 0.4 10.5 45.4 7.6 2.3 0.2 5.3Subtotal 12,808,911 27.6 6.5 2.6 9.8 40.3 6.7 2.0 0.4 4.2
Master's (Comprehensive) Universities and Colleges IAppalachian 2,821,238 27.4 0.6 2.7 5.6 54.2 4.8 1.6 2.3 0.9Fayetteville 892,087 34.3 1.8 0.1 11.2 34.7 4.8 1.4 1.2 10.5NC Central 1,457,852 35.1 2.5 0.6 7.6 36.1 6.5 0.7 1.3 9.6UNC Pembroke 1,023,469 27.7 0.2 0.2 9.4 52.6 8.0 1.9 - 0.0UNC Wilmington 2,179,820 21.2 5.4 0.9 8.1 54.0 7.5 1.1 - 1.9Western Carolina 2,028,270 23.7 1.5 0.2 10.2 51.2 7.1 2.9 1.0 2.2Winston-Salem 1,114,239 25.3 1.9 1.0 8.8 50.6 7.1 1.1 0.8 3.3Subtotal 11,516,975 26.9 2.1 1.1 8.2 49.3 6.4 1.6 1.1 3.3
Baccalaureate (Liberal Arts) Universities and Colleges I and IIElizabeth City 862,299 33.3 0.3 2.2 5.5 48.5 6.1 0.9 - 3.1UNC Asheville 887,132 24.0 1.6 1.5 10.1 51.7 4.4 4.6 2.0 0.0Subtotal 1,749,431 28.6 1.0 1.8 7.8 50.1 5.3 2.8 1.0 1.6
Schools of Art, Music, and DesignUNC School of the Arts 738,551 42.5 - 3.4 4.5 34.0 7.0 1.9 0.3 6.5Subtotal 738,551 42.5 - 3.4 4.5 34.0 7.0 1.9 0.3 6.5
Teaching HospitalsUNC Hospitals 1,358,302 1.0 0.5 81.8 - - 10.8 1.8 1.0 3.1Subtotal 1,358,302 1.0 0.5 81.8 - - 10.8 1.8 1.0 3.1
Community CollegesAlamance 238,366 72.9 - 1.2 7.4 7.2 9.6 1.6 0.1 0.0Asheville-Buncombe 511,055 63.7 - 2.0 5.3 6.3 7.4 1.7 9.9 3.7Beaufort Co. 189,556 66.4 - 3.1 6.8 8.2 9.3 3.3 2.8 0.0Bladen 110,946 62.9 - 0.6 8.5 14.0 7.8 5.5 0.7 0.0Blue Ridge 290,314 63.4 - 0.0 6.4 15.1 5.3 3.9 5.9 0.0Brunswick 254,175 40.5 - 1.0 3.5 7.0 7.1 2.8 31.7 6.4Caldwell 340,713 67.0 - 0.0 5.8 11.7 4.5 4.3 6.7 0.1Cape Fear 614,635 64.7 0.0 0.0 7.0 10.2 9.6 3.2 4.1 1.1Carteret 167,124 74.4 - - 6.9 7.8 9.0 0.9 1.0 0.0Catawba Valley 365,292 71.0 - - 7.5 6.5 7.5 - 5.3 2.2Central Carolina 404,568 78.3 - 1.0 4.2 7.2 4.6 0.1 4.6 0.1Central Piedmont 1,289,900 69.2 - 2.3 6.0 7.1 8.3 3.2 1.2 2.8Cleveland 207,079 70.9 - 1.9 11.6 5.9 8.5 1.1 0.1 0.1Coastal Carolina 218,626 74.4 - 0.1 11.1 6.2 6.1 2.1 - 0.0Coll. of Albemarle 272,245 68.1 - 9.3 6.1 6.8 8.4 1.2 0.0 0.1Craven 210,443 68.6 - 3.1 9.7 4.5 8.7 0.6 4.8 0.0Davidson County 310,482 61.1 - 2.6 10.5 6.8 13.6 3.7 1.8 0.0Durham 343,071 63.5 - - 9.6 4.3 8.1 11.9 2.6 0.0Edgecombe 169,084 57.8 - 12.7 8.7 8.5 7.0 1.3 4.0 0.0Fayetteville 630,851 67.1 - 1.2 9.8 8.6 10.8 2.4 0.1 0.0Forsyth 668,782 68.2 - 1.4 7.6 7.0 7.9 1.7 2.9 3.1

69
Table 14. Percentage Distribution of Assignable Area by Summary Programs
AssignableSq. Ft.
In-struction
10Research
20
PublicService
30
AcademicSupport
40
StudentServices
50
Inst.Admin.
60
PhysicalPlant
70
Indep.Opns.
80
Un-assigned
00Gaston 475,497 68.9 3.1 - 6.2 8.8 7.4 0.6 5.0 0.1Guilford 884,897 65.4 - 0.7 7.0 6.1 7.8 2.5 1.1 9.5Halifax 187,362 54.1 - 13.9 8.2 9.0 8.8 2.4 3.5 0.0Haywood 253,015 60.1 - 0.8 6.7 9.7 10.7 3.8 1.9 6.3Isothermal 241,215 65.3 - 9.4 6.9 5.6 7.5 3.1 2.2 0.0James Sprunt 117,674 60.0 - 2.9 13.4 9.7 8.3 3.4 1.2 1.1Johnston 338,241 62.4 - 0.4 10.6 13.0 9.0 3.6 0.9 0.0Lenoir 322,942 66.1 - 1.4 7.4 9.4 5.9 2.7 7.0 0.0Martin 170,782 45.1 - 1.4 7.9 38.7 3.8 2.3 0.6 0.0Mayland 113,020 58.8 - 1.9 9.8 10.5 8.1 3.7 6.9 0.2McDowell 117,076 64.3 - 1.7 6.5 7.2 9.7 5.0 5.6 0.0Mitchell 268,212 60.4 - 0.1 7.4 15.6 10.3 1.3 1.9 3.1Montgomery 92,421 65.4 - 0.3 9.3 11.1 9.1 2.3 2.6 0.0Nash 175,598 67.7 - 0.3 7.4 7.9 7.2 1.0 8.5 0.0Pamlico 55,243 67.2 - 0.8 10.7 7.7 8.7 3.8 1.1 0.0Piedmont 143,109 58.6 - 4.2 6.7 13.7 13.4 3.2 0.2 0.0Pitt 376,412 71.0 - - 8.7 8.5 6.6 4.6 0.0 0.6Randolph 293,984 64.0 - - 3.6 8.5 15.8 0.4 6.1 1.6Richmond 177,786 52.3 - 17.2 8.0 6.0 7.9 0.7 1.4 6.5Roanoke-Chowan 117,209 43.3 - 2.3 9.6 14.4 8.6 3.6 18.3 0.0Robeson 201,239 62.3 - 0.2 6.7 12.3 9.7 1.0 7.4 0.4Rockingham 230,981 66.6 - 1.4 7.4 9.3 7.5 0.8 4.8 2.2Rowan-Cabarrus 378,353 58.6 - 2.3 11.0 10.1 7.4 3.1 1.5 6.1Sampson 139,057 64.0 - 0.9 10.1 9.0 7.4 2.2 6.3 0.0Sandhills 321,663 70.1 - - 7.6 13.4 6.8 0.8 1.4 0.0South Piedmont 322,160 38.7 - 4.4 4.2 7.7 6.8 0.9 6.1 31.0Southeastern 183,591 61.4 - 1.5 9.5 12.9 6.2 1.4 1.1 6.1Southwestern 203,835 61.3 - 2.5 9.4 12.6 9.3 1.5 2.4 1.0Stanly 147,199 62.7 - 0.6 6.7 10.1 12.2 3.0 4.6 0.1Surry 313,753 75.9 - - 7.5 6.1 5.6 1.3 3.6 0.0Tri-County 117,608 69.4 - 0.1 8.6 7.9 13.8 0.2 - 0.0Vance-Granville 264,751 56.2 - 8.2 8.7 8.3 7.7 1.0 2.9 7.1Wake 848,436 70.0 - - 6.6 8.9 6.8 2.2 1.3 4.2Wayne 255,443 63.3 - 0.0 12.5 8.6 6.8 4.6 4.3 0.0Western Piedmont 287,293 52.9 - - 7.9 8.6 6.8 2.4 4.0 17.5Wilkes 298,201 52.9 - 0.1 7.9 19.7 6.6 7.0 5.4 0.4Wilson 143,403 66.7 - 0.4 7.2 8.7 14.7 2.3 - 0.0Subtotal 17,385,968 64.5 0.1 1.8 7.6 9.1 8.1 2.5 3.5 2.8
Private InstitutionsNC Private Universities
Barton 350,454 32.7 - - 8.8 45.4 11.1 1.6 - 0.4Campbell 1,122,004 27.8 1.1 - 6.4 55.2 5.8 2.3 1.3 0.1Mars Hill 543,596 29.1 - 1.3 7.2 52.1 6.0 1.8 0.1 2.4Pfeiffer 373,986 27.8 - 0.4 6.9 42.6 11.6 2.1 - 8.6Subtotal 2,390,040 28.8 0.5 0.4 7.0 51.1 7.5 2.0 0.6 2.0
Grand Total 66,809,155 34.8 8.3 4.1 8.3 31.0 6.7 2.1 1.7 3.1

This Page Intentionally Left Blank
70

TABLE 14a:
INSTRUCTION, RESEARCH AND
PUBLIC SERVICE SUBPROGRAMS
Table 14a indicates the percentages of institutional square footage under the Instruction,
Research, and Public Service Subprograms.
The definitions of these subprograms follow. Subprograms which are described but
which are not included in Table 14a had no square footage assigned to them by institutions.
11 General Academic Instruction. This subprogram includes those instructional offerings
intended both to prepare learners, in a generalized sense, to function in a number of
different occupations and to prepare them for further academic study. Instructional
offerings of this general academic nature are classified in this subprogram only if they are
offered as part of one of the institution's formal degree or certificate programs.
12 Vocational/Technical Instruction. This subprogram includes those instructional
offerings intended to prepare learners for immediate entry into a specific occupation or
career. Instructional offerings are classified in this subprogram only if they are offered as
part of one of the institution's formal degree or certificate programs.
13 Requisite Preparatory/Remedial Instruction. This category includes those
instructional offerings carried out to provide the learner with the skills or knowledge
required by the institution to undertake course work leading to a postsecondary degree or
certificate.
14 General Studies. This subprogram includes those instructional offerings that are not part
of one of the institution's formal postsecondary degree or certificate programs and that
are intended to provide the learner with knowledge, skills, and attitudes typically
associated with an academic discipline (such as literature, mathematics, philosophy).
15 Occupational-Related Instruction. This subprogram includes those instructional
offerings that are not carried out as part of a formal certificate or degree program but that
are offered to provide the learner with knowledge, skills, and background related to a
specific occupation or career.
16 Social Roles/Interaction Instruction. This subprogram includes those instructional
offerings that are not carried out as part of a certificate or degree program but that are
offered to provide the learner with knowledge, skills, and background needed to function
as a member of society or to interact with the variety of social institutions. It also
includes those offerings that deal with the person as a member of a particular social
organization or institution.
71

17 Home and Family Life Instruction. This subprogram includes those instructional
offerings that are not offered as part of a certificate or degree program, but which are
carried out to provide the learner with knowledge, skills, and capabilities related to the
establishment, maintenance, and improvement of a home; to the carrying out of those
functions typically associated with the conduct of a household; or to the person's
responsibilities as a member of the family unit.
18 Personal Interest and Leisure Instruction. This subprogram includes those
instructional activities that are not offered as part of a certificate or degree program, but
which are carried out to support an individual's recreational or vocational pursuits or to
improve his or her day-to-day living skills.
21 Institutes and Research Centers. This subprogram includes all research activities
conducted within the framework of a formal research organization except for those
conducted under the 21 federally funded research centers. (There are no federally funded
research centers in North Carolina.)
22 Individual or Project Research. This subprogram includes those research activities that
normally are managed within the academic departments. Such research activities usually
have a stated goal or purpose, have projected outcomes, and generally are created for
specific time periods as a result of a contract, grant, or specific time allocation of insti-
tutional resources. Research which is carried out as an instructional activity, however, is
classified under the appropriate Instructional Subprogram.
31 Direct Patient Care. This subprogram includes those activities carried out for the
specific purpose of providing direct patient care (prevention, diagnosis, treatment,
education, rehabilitation, and so forth). These services are typically rendered under the
auspices of a teaching hospital or health-sciences center and are provided for the benefit
of a clientele in the community-at-large rather than for the institution's own student body
or faculty and staff.
32 Health Care Supportive Services. This subprogram includes those activities that are
unique to a teaching hospital, health-science center, or clinic and that directly support the
provision of health care, but which cannot themselves legitimately be considered part of
the provision of direct patient care.
33 Community Services. This subprogram consists of resources, services, and expertise
made available to persons and groups outside of the context of the institution's regular
Instruction, Research, and support programs that are not included in the other Public
Service Subprograms (i.e., 31, 32, 34, and 35). Activities within this subprogram differ
from those under Cooperative Extension Services (34) in that they are generally
sponsored and controlled by the institution; extension services usually involve a sharing
of programmatic and fiscal control with an outside agency.
72
34 Cooperative Extension Services. This subprogram includes those activities that make
resources, services, and expertise available outside the Instruction, Research, and support
programs and that are conducted as cooperative efforts with outside agencies. A
distinguishing feature of the activities included in this subprogram is that programmatic
and fiscal control is usually shared with one or more external agencies or governmental
units.
35 Public Broadcasting Services. This subprogram includes the operation and
maintenance of broadcasting services that are operated outside the context of the
institution's Instruction, Research, and support programs. Excluded from this category
are broadcasting services that are conducted primarily in support of instruction,
broadcasting services that are primarily operated as a student-broadcasting club, and
broadcasting activities that are independent operations.
73

74
Table 14a. Instruction, Research, and Public Service Subprograms
GeneralAcademic
Instruction11
VocationalTechnical
Instruction12
PreparatoryRemedial
Instruction13
GeneralStudies
14
OccupationalRelated
Instruction15
SocialRoles
Instruction16
Home &Family Life
17
PersonalLeisure
Instruction18
Public InstitutionsResearch Universities I
NC State 18.5 - - 0.2 - - - -NC State Veterinary Med 23.6 - - - - - - -UNC-Chapel Hill 20.7 - - 0.5 0.3 - - -UNC-Chapel Hill Hlth Aff. 24.1 - 0.0 0.1 0.4 - - -Subtotal 20.2 - 0.0 0.3 0.2 - - -
Doctoral Universities I and IIEast Carolina 28.7 - 0.0 - - - - -East Carolina Hlth Aff. 26.1 - 0.0 - - - - -NC A&T 35.6 - - - - - - -UNC Charlotte 26.1 - - - 0.1 - - -UNC Greensboro 22.4 - 0.0 - 0.0 - - -Subtotal 27.5 - 0.0 - 0.0 - - -
Master's (Comprehensive) Universities and Colleges IAppalachian 27.4 - - - - - - -Fayetteville 34.1 - - 0.3 - - - -NC Central 35.1 - - - - - - -UNC Pembroke 27.7 - - - - - - -UNC Wilmington 21.2 - - 0.0 - - - -Western Carolina 23.3 - - 0.2 - - - 0.3Winston-Salem 25.1 - 0.2 - - - - -Subtotal 26.8 - 0.0 0.0 - - - 0.0
Baccalaureate (Liberal Arts) Universities and Colleges I and IIElizabeth City 32.7 - 0.3 0.2 - - - -UNC Asheville 23.6 - - 0.3 - - - 0.1Subtotal 28.1 - 0.2 0.2 - - - 0.1
Schools of Art, Music, and DesignUNC School of the Arts 42.5 - - - - - - -Subtotal 42.5 - - - - - - -
Teaching HospitalsUNC Hospitals 0.5 - - 0.5 - - - -Subtotal 0.5 - - 0.5 - - - -
Community CollegesAlamance 10.4 47.8 - 8.1 6.5 0.1 - -Asheville-Buncombe 13.4 38.3 1.3 4.0 5.1 0.7 - 0.9Beaufort Co. 1.3 51.4 1.5 1.1 11.1 - - -Bladen 13.1 48.5 - 0.6 0.6 - - -Blue Ridge 18.7 39.4 0.7 0.9 3.7 - - 0.0Brunswick 0.3 28.9 - 9.3 1.3 - - 0.6Caldwell 12.6 40.1 1.5 10.8 2.0 - - -Cape Fear 12.1 46.8 0.1 3.3 2.5 - - -Carteret 4.2 67.1 0.1 1.7 0.8 - - 0.6Catawba Valley 19.5 40.7 2.7 2.5 5.6 - - 0.0Central Carolina 5.2 62.2 3.9 4.7 2.3 - - -Central Piedmont 22.7 37.0 0.2 2.8 6.5 - - -Cleveland 10.5 56.1 0.7 1.9 0.6 - 1.1 -Coastal Carolina 26.9 33.9 0.9 1.8 11.0 - - -Coll. of Albemarle 23.2 30.4 0.3 7.5 6.6 - - -Craven 19.7 41.3 2.2 1.7 3.7 - - -Davidson County 23.6 32.0 2.3 1.6 1.5 - 0.1 -Durham 1.5 54.0 0.8 6.0 1.2 - - -Edgecombe 2.8 46.6 0.1 4.3 3.9 0.1 - -Fayetteville 3.7 47.3 - 6.8 8.6 - 0.6 0.1

75
Table 14a. Instruction, Research, and Public Service Subprograms
GeneralAcademic
Instruction11
VocationalTechnical
Instruction12
PreparatoryRemedial
Instruction13
GeneralStudies
14
OccupationalRelated
Instruction15
SocialRoles
Instruction16
Home &Family Life
17
PersonalLeisure
Instruction18
Forsyth 12.7 48.8 1.3 1.0 2.4 - 0.2 2.0Gaston 21.0 35.0 1.0 6.2 5.5 0.1 - -Guilford 3.7 50.3 2.0 4.1 5.1 - - 0.2Halifax 12.5 39.7 0.0 1.5 0.4 - - -Haywood 0.1 51.5 0.1 0.9 4.4 - - 3.0Isothermal 22.6 30.0 0.9 9.7 1.3 - - 0.8James Sprunt 13.4 37.2 0.5 5.8 3.1 - - -Johnston - 55.4 0.5 1.3 5.3 - - -Lenoir 15.3 33.7 3.0 11.9 1.0 - - 1.1Martin 8.1 26.5 2.1 4.1 3.4 - - 0.9Mayland 6.3 40.0 1.4 5.7 5.4 - - -McDowell 7.2 48.0 0.6 3.7 4.8 - - -Mitchell 28.2 17.3 0.1 11.1 3.5 - - 0.3Montgomery 10.3 48.9 3.6 - 2.5 - - -Nash 18.0 34.8 - 1.5 12.2 1.2 - -Pamlico 16.3 39.8 - 2.6 8.4 - - -Piedmont 2.3 46.9 1.4 5.6 2.4 - - -Pitt 17.9 46.4 1.4 2.1 2.5 0.7 - 0.1Randolph 4.1 46.2 0.2 7.8 5.7 - - -Richmond 3.5 40.4 0.1 8.0 0.3 - - -Roanoke-Chowan 7.0 30.1 1.6 0.9 3.2 0.5 - -Robeson 8.4 40.6 0.1 7.6 5.7 - - -Rockingham 26.0 32.7 1.4 0.2 6.2 - - -Rowan-Cabarrus 7.1 43.5 1.0 3.5 3.3 - - 0.2Sampson 0.6 54.1 1.8 3.9 1.7 0.8 1.1 0.1Sandhills 27.0 29.0 1.1 2.5 10.4 - - -South Piedmont 4.4 30.0 1.9 1.5 1.0 - - -Southeastern 18.2 26.0 4.8 1.5 11.0 - - -Southwestern 19.9 29.0 1.8 1.1 9.4 - - -Stanly - 46.5 4.1 0.1 12.0 - - -Surry 21.8 33.2 0.3 3.9 16.7 - - -Tri-County 9.5 53.3 1.3 0.8 3.8 - 0.0 0.6Vance-Granville 16.6 30.9 1.4 5.3 0.5 0.4 - 1.1Wake 19.0 37.8 - 5.9 7.1 - - 0.2Wayne 9.5 46.3 - 7.0 0.4 - - -Western Piedmont 22.8 17.6 - 12.0 0.5 - - -Wilkes 17.3 29.3 - 3.9 2.3 - - -Wilson 5.3 43.0 9.7 3.4 5.3 - - -Subtotal 13.2 40.8 1.1 4.3 4.7 0.1 0.1 0.3
Private InstitutionsNC Private Universities
Barton 32.7 - - - - - - -Campbell 27.8 - - - - - - -Mars Hill 29.1 - - - - - - -Pfeiffer 27.8 - - - - - - -Subtotal 28.8 - - - - - - -
Grand Total 21.3 10.6 0.3 1.2 1.3 0.0 0.0 0.1

76
Table 14a. Instruction, Research, and Public Service Subprograms
Institutes& Research
Centers21
Individualor ProjectResearch
22
DirectPatient
Care31
HealthCare
Services32
CommunityServices
33
CooperativeExtension
Services34
PublicBroadcasting
Services35
Public InstitutionsResearch Universities I
NC State 6.0 23.3 - 0.0 2.3 1.6 0.0NC State Veterinary Med - 32.4 16.5 12.9 - - -UNC-Chapel Hill 0.3 7.2 0.0 0.1 0.4 0.0 0.1UNC-Chapel Hill Hlth Aff. 2.2 44.6 4.2 5.5 0.4 0.1 -Subtotal 3.2 20.2 0.9 1.1 1.3 0.8 0.1
Doctoral Universities I and IIEast Carolina 1.2 1.1 - 0.1 0.6 - 0.0East Carolina Hlth Aff. - 21.3 20.6 10.1 0.7 - -NC A&T 2.4 4.6 - - 0.3 0.7 0.1UNC Charlotte 3.1 3.9 - - 0.3 - -UNC Greensboro - 5.9 0.3 - 0.1 - -Subtotal 1.6 4.9 1.4 0.7 0.3 0.1 0.0
Master's (Comprehensive) Universities and Colleges IAppalachian 0.2 0.5 0.4 - 2.3 - -Fayetteville - 1.8 - - 0.1 - 0.0NC Central 1.3 1.1 - - 0.2 - 0.4UNC Pembroke - 0.2 - - 0.2 - -UNC Wilmington 2.8 2.6 - - 0.9 - -Western Carolina 0.8 0.7 - - 0.2 - 0.0Winston-Salem - 1.9 - - 1.0 - 0.0Subtotal 0.9 1.2 0.1 - 0.9 - 0.1
Baccalaureate (Liberal Arts) Universities and Colleges I and IIElizabeth City - 0.3 - - 1.9 - 0.3UNC Asheville 0.3 1.3 - - 1.5 - -Subtotal 0.2 0.8 - - 1.7 - 0.2
Schools of Art, Music, and DesignUNC School of the Arts - - - - 3.4 - -Subtotal - - - - 3.4 - -
Teaching HospitalsUNC Hospitals - 0.5 33.4 48.4 - - -Subtotal - 0.5 33.4 48.4 - - -
Community CollegesAlamance - - - - 1.2 - -Asheville-Buncombe - - - - 1.3 0.7 -Beaufort Co. - - - - 3.1 - 0.0Bladen - - - - 0.6 - -Blue Ridge - - - - 0.0 - -Brunswick - - - - 1.0 - -Caldwell - - - - 0.0 - -Cape Fear - 0.0 - - 0.0 - -Carteret - - - - - - -Catawba Valley - - - - - - -Central Carolina - - - 0.6 0.4 - -Central Piedmont - - - - - - 2.3Cleveland - - - - 1.9 - -Coastal Carolina - - - - 0.1 - -Coll. of Albemarle - - - - 9.3 - -Craven - - - - 1.8 - 1.3Davidson County - - - - 2.6 - -Durham - - - - - - -Edgecombe - - - - 12.7 - -Fayetteville - - - - 1.2 - -

77
Table 14a. Instruction, Research, and Public Service Subprograms
Institutes& Research
Centers21
Individualor ProjectResearch
22
DirectPatient
Care31
HealthCare
Services32
CommunityServices
33
CooperativeExtension
Services34
PublicBroadcasting
Services35
Forsyth - - - - 0.6 - 0.8Gaston - 3.1 - - - - -Guilford - - - - 0.7 - -Halifax - - - - 13.9 - -Haywood - - - - 0.8 - -Isothermal - - - - 8.2 - 1.2James Sprunt - - - - 2.9 - -Johnston - - - - 0.4 - -Lenoir - - - - 1.4 - -Martin - - - - 1.4 - -Mayland - - - - 1.9 - -McDowell - - - - 1.7 - -Mitchell - - - - 0.1 - -Montgomery - - - - 0.3 - -Nash - - - - 0.3 - -Pamlico - - - - 0.8 - -Piedmont - - - - 4.2 - -Pitt - - - - - - -Randolph - - - - - - -Richmond - - - - 17.2 - -Roanoke-Chowan - - - - 2.3 - -Robeson - - - - 0.1 0.1 -Rockingham - - - - 1.4 - -Rowan-Cabarrus - - - - 2.1 0.2 -Sampson - - - - 0.9 - -Sandhills - - - - - - -South Piedmont - - - - 4.4 - -Southeastern - - - - 0.8 - 0.7Southwestern - - - - 2.5 - -Stanly - - - - 0.6 - -Surry - - - - - - -Tri-County - - - - 0.1 - -Vance-Granville - - - 1.4 6.8 - -Wake - - - - - - -Wayne - - - - 0.0 - -Western Piedmont - - - - - - -Wilkes - - - 0.1 0.0 - -Wilson - - - - 0.4 - -Subtotal - 0.1 - 0.0 1.5 0.0 0.2
Private InstitutionsNC Private Universities
Barton - - - - - - -Campbell - 1.1 - - - - -Mars Hill - - - - 1.3 - -Pfeiffer - - - - 0.4 - -Subtotal - 0.5 - - 0.4 - -
Grand Total 1.4 6.9 1.2 1.4 1.1 0.2 0.1

TABLE 14b:
ACADEMIC SUPPORT SUBPROGRAMS
Table 14b indicates the percentages of institutional square footage under each of the
Academic Support Subprograms.
The definitions of these subprograms follow. Subprograms which are described but
which are not included in Table 14b had no square footage assigned to them by institutions.
41 Library Services. This subprogram includes those activities that directly support the
collection, cataloging, storage, and distribution of published materials in support of one
or more of the institution's primary programs. This subprogram applies only to library
services which are separately funded; departmental libraries are included under the
appropriate Instruction Subprogram.
42 Museums and Galleries. This subprogram includes those activities related to the
collection, preservation, and exhibition of historical materials, art objects, scientific
displays, and so forth, that support one or more of the institution's primary programs.
This subprogram applies only to museums and galleries which are separately funded;
departmental exhibit areas are included under the appropriate Instruction Subprogram.
43 Educational Media Services. This subprogram includes those audio, visual, and other
technological services that have been established to provide direct support for the
institution's Instruction, Research, and Public Service Programs.
44 Academic Computer Support. This subprogram includes those computer services that
have been established to provide direct support for one or more of the institution's
primary programs. It does not include administrative data-processing services and
computing support.
45 Ancillary Support. This subprogram includes those activities that directly contribute to
the way in which instruction is delivered or research is conducted but that cannot be
appropriately classified as educational media services or academic computing support.
46 Academic Administration. This subprogram consists of those activities that provide
administrative and management support specifically for the institution's academic
programs. It includes the activities of the college deans, the administrative activities of
departmental chairpersons, and the activities of their associated support staff, but it does
not include the activities of those whose responsibilities are institution-wide and involve
duties outside of the academic realm.
78

47 Course and Curriculum Development. This subprogram includes only those formal
planning and development activities established either to improve or to add to the
institution's curriculum. Those activities that individual faculty members carry out to
update and improve their current course offerings are included under the appropriate
Instruction Subprogram.
48 Academic Personnel Development. This subprogram includes those activities that
provide the faculty with opportunities for personal and professional growth and
development, as well as those activities intended to evaluate and reward the professional
performance of the faculty.
79

80
Table 14b. Academic Support Subprograms
LibraryServices
41
Museums &Galleries
42
Educational& MediaServices
43
AcademicComputing
Support44
AncillarySupport
45
AcademicAdmin.
46
Course &Curriculum
Dev.47
AcademicPersonnel
Dev.48
Public InstitutionsResearch Universities I
NC State 3.9 0.1 0.5 0.3 0.1 2.4 - 0.0NC State Veterinary Med 2.9 - 1.0 0.4 - 2.7 - -UNC-Chapel Hill 8.4 0.5 0.1 0.5 0.1 1.3 0.0 0.2UNC-Chapel Hill Hlth Aff. 2.5 0.0 0.0 0.1 2.2 4.1 0.0 0.0Subtotal 5.4 0.2 0.3 0.4 0.4 2.2 0.0 0.1
Doctoral Universities I and IIEast Carolina 5.5 0.2 0.1 0.0 - 0.6 - -East Carolina Hlth Aff. 8.9 - 0.5 - 0.0 2.7 - -NC A&T 5.2 0.7 0.1 0.3 3.9 3.0 - -UNC Charlotte 5.7 0.0 0.2 0.5 - 3.2 0.0 -UNC Greensboro 4.3 0.9 0.4 0.3 0.7 4.0 - 0.0Subtotal 5.4 0.4 0.2 0.3 0.8 2.6 0.0 0.0
Master's (Comprehensive) Universities and Colleges IAppalachian 3.7 - 0.3 0.3 0.3 0.9 - -Fayetteville 7.4 0.2 0.5 0.7 0.7 1.6 - -NC Central 4.3 0.3 0.1 0.4 0.5 1.8 - 0.2UNC Pembroke 3.6 0.7 0.2 0.3 - 4.5 - 0.0UNC Wilmington 5.2 0.2 - 0.6 - 2.0 - 0.0Western Carolina 5.9 0.9 0.1 0.1 0.6 2.5 - 0.2Winston-Salem 3.9 1.1 0.2 0.5 0.2 2.9 - -Subtotal 4.8 0.4 0.2 0.4 0.3 2.1 - 0.1
Baccalaureate (Liberal Arts) Universities and Colleges I and IIElizabeth City 3.8 0.1 - 0.4 0.5 0.8 - -UNC Asheville 7.7 0.4 0.8 0.9 - 0.4 - 0.0Subtotal 5.7 0.2 0.4 0.6 0.3 0.6 - 0.0
Schools of Art, Music, and DesignUNC School of the Arts 2.5 0.2 0.0 0.0 0.1 1.7 - -Subtotal 2.5 0.2 0.0 0.0 0.1 1.7 - -
Teaching HospitalsUNC Hospitals - - - - - - - -Subtotal - - - - - - - -
Community CollegesAlamance 4.6 0.4 - - 1.0 1.5 - -Asheville-Buncombe 3.9 - 0.5 0.2 0.5 0.2 - -Beaufort Co. 4.7 - 0.8 0.1 - 1.2 - -Bladen 6.1 - - - - 2.5 - -Blue Ridge 4.1 0.0 0.7 - - 1.2 - 0.4Brunswick 2.4 - 0.3 0.2 - 0.6 - -Caldwell 3.8 - 0.7 - - 1.2 - -Cape Fear 4.9 0.0 0.5 0.0 0.9 0.8 - -Carteret 3.8 - - - 1.7 1.5 - -Catawba Valley 4.9 0.1 0.9 0.5 0.1 0.8 - -Central Carolina 3.5 - 0.2 - 0.1 0.4 - -Central Piedmont 4.3 0.1 0.4 0.2 - 0.7 0.0 0.2Cleveland 6.9 0.2 3.0 - - 1.4 - -Coastal Carolina 7.5 - 0.1 0.1 - 3.3 - -Coll. of Albemarle 4.3 0.3 - - - 1.5 - -Craven 7.4 - - 0.0 - 2.2 - -Davidson County 7.5 - 0.2 - 2.0 0.8 - -Durham 4.5 - 0.4 0.1 - 4.1 0.4 0.1Edgecombe 6.2 - 0.6 0.4 - 1.4 0.1 -Fayetteville 3.8 0.1 1.2 0.1 1.9 2.6 - -

81
Table 14b. Academic Support Subprograms
LibraryServices
41
Museums &Galleries
42
Educational& MediaServices
43
AcademicComputing
Support44
AncillarySupport
45
AcademicAdmin.
46
Course &Curriculum
Dev.47
AcademicPersonnel
Dev.48
Forsyth 2.7 - 0.7 0.4 - 3.4 0.1 0.3Gaston 3.2 0.5 0.4 0.1 0.7 1.4 - -Guilford 3.2 - 0.3 0.0 2.1 1.5 - -Halifax 5.4 - - - 1.6 1.2 - -Haywood 5.6 0.2 0.0 0.1 - 0.9 - -Isothermal 4.4 - - - - 2.5 - -James Sprunt 6.6 0.5 0.1 2.6 - 3.6 - 0.1Johnston 7.1 0.9 0.7 - 1.4 0.7 - -Lenoir 5.1 0.9 0.1 0.0 - 1.4 - -Martin 6.0 - - - - 1.9 - -Mayland 7.5 - 0.6 - - 1.8 - -McDowell 4.4 0.4 - - - 1.7 - -Mitchell 4.0 0.3 0.9 - - 2.2 - -Montgomery 9.0 - - - - 0.3 - -Nash 6.0 0.3 - - - 1.0 - 0.0Pamlico 8.9 - 0.3 - - 1.6 - -Piedmont 4.4 - 0.3 0.1 0.3 1.6 - -Pitt 5.7 - 0.1 0.1 0.6 2.2 - -Randolph 2.6 - 0.2 0.0 - 0.8 - -Richmond 6.0 - 0.7 0.4 - 0.9 - -Roanoke-Chowan 8.1 - - - - 1.5 - -Robeson 5.5 - 0.1 - - 1.2 - -Rockingham 4.3 0.9 - - 1.2 1.0 - -Rowan-Cabarrus 6.0 - 0.5 1.7 0.2 2.4 0.2 0.0Sampson 8.8 - - 0.1 - 1.2 - -Sandhills 5.7 0.4 0.6 - 0.5 0.4 - -South Piedmont 3.0 - 0.4 - - 0.8 - -Southeastern 5.7 0.2 1.1 0.4 1.6 0.6 - -Southwestern 4.4 - 0.4 0.4 1.4 2.9 - -Stanly 4.9 - 1.1 0.1 - 0.5 - -Surry 6.9 - 0.0 0.1 - 0.5 - -Tri-County 5.1 - - 0.1 2.3 1.2 - -Vance-Granville 4.3 - - - 2.3 2.1 - -Wake 4.5 - 0.6 - 1.1 0.4 - -Wayne 7.7 - 1.1 0.6 1.4 1.6 0.1 -Western Piedmont 5.2 - 0.2 0.1 - 2.4 - -Wilkes 6.0 0.1 0.1 - 1.0 0.8 - -Wilson 4.8 - 0.2 - - 2.2 - -Subtotal 4.8 0.1 0.4 0.1 0.6 1.4 0.0 0.0
Private InstitutionsNC Private Universities
Barton 6.9 0.7 0.4 - - 0.7 - -Campbell 4.3 0.4 0.5 0.1 0.1 1.0 0.0 0.0Mars Hill 4.7 0.8 1.1 - - 0.5 - -Pfeiffer 6.0 - 0.0 - - 0.8 - 0.1Subtotal 5.0 0.5 0.6 0.0 0.0 0.8 0.0 0.0
Grand Total 5.0 0.3 0.3 0.3 0.5 1.9 0.0 0.0

TABLE 14c:
STUDENT SERVICE AND PHYSICAL PLANT
OPERATIONS SUBPROGRAMS
Table 14c indicates the percentages of institutional square footage under the Student Service
and Physical Plant Operations Subprograms.
The definitions of these subprograms follow. Subprograms which are described but which
are not included in Table 14c had no square footage assigned to them by institutions.
51 Student Service Administration. This subprogram includes those administrative
activities that provide assistance and support (excluding academic support) to the needs
and interests of students.
52 Social and Cultural Development. This subprogram includes those activities
established to provide for the social and cultural development of the student outside of
the formal academic program. It includes those activities primarily supported and
controlled by the student body, those cultural activities provided outside the student's
educational experience, and general recreation activities for the student body.
53 Counseling and Career Guidance. This subprogram includes those formal placement,
career guidance, and personal counseling services provided for the benefit of students.
Excluded are psychiatric and psychological counseling services that are carried out as
part of the student health program.
54 Financial Aid Administration. This subprogram includes those administrative activities
carried out in support of the institution's financial aid program.
55 Student Auxiliary Services. This subprogram includes those conveniences and services
needed to maintain an on-campus, resident student body. A fee which is related to but
not necessarily equal to the cost of the service rendered is often charged for these
services.
56 Intercollegiate Athletics. This subprogram includes those team and individual sports
activities that involve competition between two or more educational institutions.
57 Student Health/Medical Services. This subprogram includes those activities carried out
for the specific purpose of providing health and medical services for the student body.
The activities included here generally are associated with a student infirmary rather than
a teaching hospital. Health and medical services provided for the institution's faculty and
staff are also included in this subprogram.
82
71 Physical Plant Administration. This subprogram consists of those administrative
activities carried out in direct support of the institution's physical plant operations. Those
activities related to the development of plans for plant expansion or modification as well
as for new construction are also included.
72 Building Maintenance. This subprogram consists of those activities related to routine
repair and maintenance of buildings and structures, including both normally recurring
repairs and preventive maintenance.
73 Custodial Services. This subprogram consists of those activities related to custodial
services in institutional buildings.
74 Utilities. This subprogram consists of those activities related to heating, cooling, light
and power, gas, water, and any other utilities necessary for the operation of the physical
plant.
75 Landscape and Ground Maintenance. This subprogram consists of those activities
related to the operation and maintenance of campus landscape and grounds.
76 Major Repairs and Renovations. This subprogram consists of those activities related to
major repairs, maintenance, and renovation projects. Major projects are generally
defined as each institution wishes. Expenditures which approximate at least 25% of a
building's estimated replacement cost should be considered major.
83
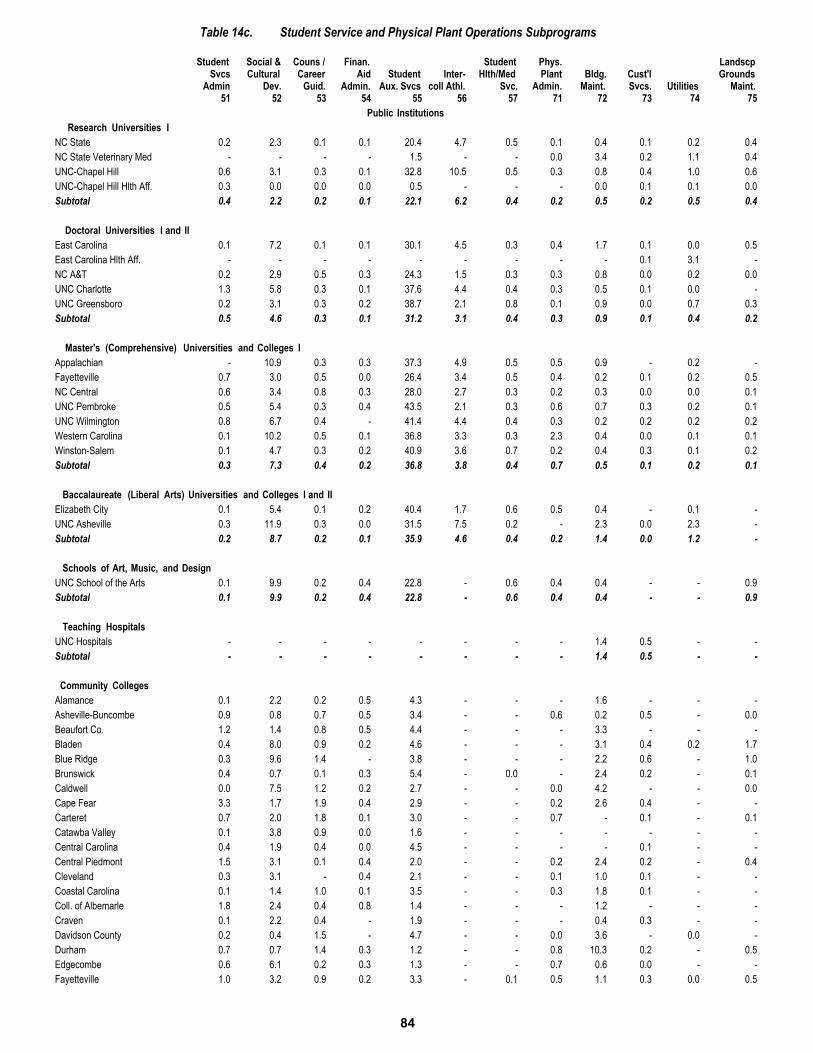
84
Table 14c. Student Service and Physical Plant Operations Subprograms
StudentSvcs
Admin51
Social &Cultural
Dev.52
Couns /Career
Guid.53
Finan.Aid
Admin.54
StudentAux. Svcs
55
Inter-coll Athl.
56
StudentHlth/Med
Svc.57
Phys.Plant
Admin.71
Bldg.Maint.
72
Cust'lSvcs.
73Utilities
74
LandscpGrounds
Maint.75
Public InstitutionsResearch Universities I
NC State 0.2 2.3 0.1 0.1 20.4 4.7 0.5 0.1 0.4 0.1 0.2 0.4NC State Veterinary Med - - - - 1.5 - - 0.0 3.4 0.2 1.1 0.4UNC-Chapel Hill 0.6 3.1 0.3 0.1 32.8 10.5 0.5 0.3 0.8 0.4 1.0 0.6UNC-Chapel Hill Hlth Aff. 0.3 0.0 0.0 0.0 0.5 - - - 0.0 0.1 0.1 0.0Subtotal 0.4 2.2 0.2 0.1 22.1 6.2 0.4 0.2 0.5 0.2 0.5 0.4
Doctoral Universities I and IIEast Carolina 0.1 7.2 0.1 0.1 30.1 4.5 0.3 0.4 1.7 0.1 0.0 0.5East Carolina Hlth Aff. - - - - - - - - - 0.1 3.1 -NC A&T 0.2 2.9 0.5 0.3 24.3 1.5 0.3 0.3 0.8 0.0 0.2 0.0UNC Charlotte 1.3 5.8 0.3 0.1 37.6 4.4 0.4 0.3 0.5 0.1 0.0 -UNC Greensboro 0.2 3.1 0.3 0.2 38.7 2.1 0.8 0.1 0.9 0.0 0.7 0.3Subtotal 0.5 4.6 0.3 0.1 31.2 3.1 0.4 0.3 0.9 0.1 0.4 0.2
Master's (Comprehensive) Universities and Colleges IAppalachian - 10.9 0.3 0.3 37.3 4.9 0.5 0.5 0.9 - 0.2 -Fayetteville 0.7 3.0 0.5 0.0 26.4 3.4 0.5 0.4 0.2 0.1 0.2 0.5NC Central 0.6 3.4 0.8 0.3 28.0 2.7 0.3 0.2 0.3 0.0 0.0 0.1UNC Pembroke 0.5 5.4 0.3 0.4 43.5 2.1 0.3 0.6 0.7 0.3 0.2 0.1UNC Wilmington 0.8 6.7 0.4 - 41.4 4.4 0.4 0.3 0.2 0.2 0.2 0.2Western Carolina 0.1 10.2 0.5 0.1 36.8 3.3 0.3 2.3 0.4 0.0 0.1 0.1Winston-Salem 0.1 4.7 0.3 0.2 40.9 3.6 0.7 0.2 0.4 0.3 0.1 0.2Subtotal 0.3 7.3 0.4 0.2 36.8 3.8 0.4 0.7 0.5 0.1 0.2 0.1
Baccalaureate (Liberal Arts) Universities and Colleges I and IIElizabeth City 0.1 5.4 0.1 0.2 40.4 1.7 0.6 0.5 0.4 - 0.1 -UNC Asheville 0.3 11.9 0.3 0.0 31.5 7.5 0.2 - 2.3 0.0 2.3 -Subtotal 0.2 8.7 0.2 0.1 35.9 4.6 0.4 0.2 1.4 0.0 1.2 -
Schools of Art, Music, and DesignUNC School of the Arts 0.1 9.9 0.2 0.4 22.8 - 0.6 0.4 0.4 - - 0.9Subtotal 0.1 9.9 0.2 0.4 22.8 - 0.6 0.4 0.4 - - 0.9
Teaching HospitalsUNC Hospitals - - - - - - - - 1.4 0.5 - -Subtotal - - - - - - - - 1.4 0.5 - -
Community CollegesAlamance 0.1 2.2 0.2 0.5 4.3 - - - 1.6 - - -Asheville-Buncombe 0.9 0.8 0.7 0.5 3.4 - - 0.6 0.2 0.5 - 0.0Beaufort Co. 1.2 1.4 0.8 0.5 4.4 - - - 3.3 - - -Bladen 0.4 8.0 0.9 0.2 4.6 - - - 3.1 0.4 0.2 1.7Blue Ridge 0.3 9.6 1.4 - 3.8 - - - 2.2 0.6 - 1.0Brunswick 0.4 0.7 0.1 0.3 5.4 - 0.0 - 2.4 0.2 - 0.1Caldwell 0.0 7.5 1.2 0.2 2.7 - - 0.0 4.2 - - 0.0Cape Fear 3.3 1.7 1.9 0.4 2.9 - - 0.2 2.6 0.4 - -Carteret 0.7 2.0 1.8 0.1 3.0 - - 0.7 - 0.1 - 0.1Catawba Valley 0.1 3.8 0.9 0.0 1.6 - - - - - - -Central Carolina 0.4 1.9 0.4 0.0 4.5 - - - - 0.1 - -Central Piedmont 1.5 3.1 0.1 0.4 2.0 - - 0.2 2.4 0.2 - 0.4Cleveland 0.3 3.1 - 0.4 2.1 - - 0.1 1.0 0.1 - -Coastal Carolina 0.1 1.4 1.0 0.1 3.5 - - 0.3 1.8 0.1 - -Coll. of Albemarle 1.8 2.4 0.4 0.8 1.4 - - - 1.2 - - -Craven 0.1 2.2 0.4 - 1.9 - - - 0.4 0.3 - -Davidson County 0.2 0.4 1.5 - 4.7 - - 0.0 3.6 - 0.0 -Durham 0.7 0.7 1.4 0.3 1.2 - - 0.8 10.3 0.2 - 0.5Edgecombe 0.6 6.1 0.2 0.3 1.3 - - 0.7 0.6 0.0 - -Fayetteville 1.0 3.2 0.9 0.2 3.3 - 0.1 0.5 1.1 0.3 0.0 0.5

85
Table 14c. Student Service and Physical Plant Operations Subprograms
StudentSvcs
Admin51
Social &Cultural
Dev.52
Couns /Career
Guid.53
Finan.Aid
Admin.54
StudentAux. Svcs
55
Inter-coll Athl.
56
StudentHlth/Med
Svc.57
Phys.Plant
Admin.71
Bldg.Maint.
72
Cust'lSvcs.
73Utilities
74
LandscpGrounds
Maint.75
Forsyth 0.4 1.6 1.0 0.3 3.8 0.0 - 0.0 0.8 0.2 0.7 0.0Gaston 0.8 3.9 0.6 0.4 3.2 - 0.0 - 0.3 0.1 0.0 0.2Guilford 0.1 2.0 0.8 0.1 2.9 0.1 0.0 0.3 1.2 0.5 0.1 0.4Halifax 0.4 2.7 0.7 0.7 4.5 - - 0.1 2.4 - - -Haywood 0.2 5.6 0.3 0.2 3.4 - - 1.0 1.6 0.2 - 1.1Isothermal 0.1 2.8 0.7 0.1 1.9 - - 0.3 2.1 0.4 0.3 -James Sprunt 1.2 2.1 2.1 1.1 3.2 - - - 3.3 0.1 - -Johnston 0.5 5.2 1.4 0.7 5.2 - - 0.0 2.5 0.2 - 0.9Lenoir - 6.5 0.1 0.3 1.9 0.7 - 0.3 2.0 - - 0.4Martin 0.8 34.1 0.5 0.2 3.0 - - 0.1 1.9 0.2 - -Mayland - 0.6 1.0 0.7 8.2 - - - 3.6 0.1 - -McDowell 0.4 - 1.3 0.1 5.4 - - - 2.9 - - 2.1Mitchell 1.1 6.3 1.5 0.5 6.1 - - 0.1 1.1 0.2 - -Montgomery 0.7 4.5 1.1 0.3 4.4 - - 0.1 1.8 0.1 - 0.3Nash 1.1 0.0 0.9 0.2 5.6 - - - 1.0 - - -Pamlico 1.5 - 1.5 0.2 4.5 - - - 3.8 - - -Piedmont 3.3 0.7 2.7 0.2 6.7 - - - 2.4 0.1 - 0.8Pitt 0.9 4.1 1.1 0.1 2.1 0.1 - 4.6 - - - -Randolph 0.9 1.3 0.8 0.6 4.9 - - 0.2 0.0 0.2 - -Richmond 0.3 2.9 1.2 0.1 1.5 - 0.1 - 0.6 0.1 - -Roanoke-Chowan - 10.2 1.2 0.2 2.7 - - - - - - 3.6Robeson 0.3 6.4 0.8 0.7 4.1 - - 0.1 0.8 0.1 - -Rockingham 0.3 4.8 1.1 0.3 2.8 - - 0.0 0.5 0.1 - 0.2Rowan-Cabarrus 1.3 0.6 2.5 0.3 5.4 - - 0.1 2.8 0.1 - -Sampson 0.1 3.1 1.0 0.1 4.7 - - 0.1 2.1 - - -Sandhills 0.1 4.9 1.0 0.3 7.1 - - - 0.4 0.1 - 0.3South Piedmont 0.5 4.2 0.8 0.1 2.1 - - 0.0 0.9 0.0 - -Southeastern - 6.8 2.7 0.3 3.1 - - 0.3 1.0 - - -Southwestern 0.2 6.9 1.5 0.6 3.5 - - - 1.4 0.0 - -Stanly 1.2 2.9 0.9 0.5 4.7 - - 0.1 2.9 - - -Surry 0.5 0.7 0.5 0.2 4.1 0.1 - 0.0 1.3 - - -Tri-County 0.5 4.4 0.9 0.2 1.8 - - - - - 0.2 -Vance-Granville 1.1 - 2.6 0.6 4.0 0.1 - 0.1 0.8 - - -Wake 0.6 1.5 2.1 0.3 4.4 0.1 - 0.3 1.9 - - -Wayne 0.2 4.3 0.6 0.4 3.0 - 0.1 - 4.6 - - -Western Piedmont 1.1 1.6 0.5 0.2 5.0 0.2 - 0.1 0.9 0.4 - 0.9Wilkes 0.2 16.4 1.2 0.3 1.6 - - 2.3 0.5 0.3 - 3.9Wilson 0.3 3.8 1.0 0.7 2.9 - - 0.7 1.5 0.2 - -Subtotal 0.7 3.6 1.0 0.3 3.4 0.0 0.0 0.3 1.7 0.2 0.0 0.3
Private InstitutionsNC Private Universities
Barton 0.6 5.5 0.5 0.3 33.8 4.2 0.5 0.4 0.8 0.1 - 0.4Campbell 0.3 4.1 0.4 0.2 41.1 8.9 0.2 0.1 2.0 0.1 - 0.1Mars Hill 0.0 11.9 0.0 0.1 37.2 2.2 0.5 0.4 1.3 - - -Pfeiffer 0.1 7.9 0.1 0.3 31.1 3.0 0.2 0.1 1.9 0.1 - -Subtotal 0.2 6.7 0.3 0.2 37.6 5.7 0.3 0.2 1.7 0.1 - 0.1
Grand Total 0.5 4.3 0.5 0.2 22.0 3.3 0.3 0.3 1.0 0.1 0.3 0.3
TABLE 14d:
INSTITUTIONAL ADMINISTRATION, INDEPENDENT
OPERATIONS, AND UNASSIGNED SUBPROGRAMS
Table 14d indicates the percentages of institutional square footage under the Institutional
Administration, Independent Operations, and Unassigned Subprograms. The definitions of these
subprograms follow.
61 Executive Management. This subprogram consists of those executive-level activities
concerned with the overall management of and long-range planning for the entire
institution. Included are the activities of the various administrators involved in policy
formulation and executive direction, including those of the governing board, the chief
executive officer, and the senior executive officers.
62 Financial Management and Operations. This subprogram consists of those activities
related to the day-to-day financial management and fiscal operations of the institution.
63 General Administration and Logistical Services. This subprogram consists of those
activities related to the general administrative operations and services of the institution
with the exception of those activities related to financial operations, to administrative
data processing, and to student records.
64 Administrative Computing Support. This subprogram includes those computer and
data processing services that have been established to provide support for institution-wide
administrative functions.
65 Faculty and Staff Auxiliary Services. This subprogram includes those support services
that have been established primarily to serve the faculty and staff. A fee which is related
to but not necessarily equal to the cost of the service rendered is often charged for these
services.
66 Public Relations/Development. This subprogram consists of those institutional
activities established to maintain relations with the local community, the institution's
alumni, governmental entities, and the public in general, as well as those activities carried
out to support institution-wide fund raising and development efforts.
67 Student Recruitment and Admissions. This subprogram consists of those activities
carried out by an institution that are related to the identification of prospective students,
the promotion of attendance at the institution, and the processing of applications for
admission to the institution.
86

68 Student Records. This subprogram includes those activities the institution carries out to
maintain, handle, and update records for currently enrolled students as well as for those
who were previously enrolled.
91 Independent Operations/Institutional. This subprogram includes those operations that
are owned or controlled by the institution but that are unrelated to or independent of the
institution's mission. Excluded are those operations managed as investments of the
institution's endowment funds.
92 Independent Operations/External Agencies. This subprogram includes those activities
that are controlled or operated by outside agencies, but that are housed or otherwise
supported in some way by the institution.
01 Capable of Use. This subprogram is limited to rooms that are not in use but are capable
of use at the time of the inventory.
02 Incapable of Use. This subprogram is limited to rooms that are not in use at the time of
the inventory because they are incapable of use. Included are rooms which are under or
in need of alteration or renovation and rooms which have been declared structurally
unsafe.
Subprogram 03 (Building Service) is not included in this table (and is not considered as part of
Program 00 in Table 14) because it applies to nonassignable area only.
87

88
Table 14d. Institutional Administration, Independent Operations and Unassigned Subprograms
Ind. Operations UnassignedExec.Mgmt
61
Fin.Mgmt
62
Gen AdLog Svc
63
AdminComp
64
Fac/StfAux. Svcs
65P.R. Devel.
66
Stud.Admiss
67
Stud.Records
68Inst.
91
Ext.Agency
92Usable
01Unusable
02Public Institutions
Research Universities INC State 0.4 0.2 2.3 1.1 0.9 0.6 0.1 0.0 0.0 2.0 0.8 2.4NC State Veterinary Med - - 0.1 0.2 0.1 - - - - 0.7 - -UNC-Chapel Hill 0.3 0.7 2.4 1.3 0.3 0.8 0.2 0.0 0.3 0.5 0.9 0.5UNC-Chapel Hill Hlth Aff. 0.1 0.3 1.4 0.2 0.1 0.0 0.0 0.0 0.9 0.6 2.6 2.1Subtotal 0.3 0.4 2.2 1.1 0.5 0.6 0.1 0.0 0.3 1.2 1.1 1.6
Doctoral Universities I and IIEast Carolina 0.7 0.8 1.9 1.2 0.3 0.5 0.2 0.1 - 1.4 0.2 9.2East Carolina Hlth Aff. - 0.2 3.1 0.5 - 0.8 - 0.1 - - 0.5 0.6NC A&T 0.6 0.5 8.5 0.7 0.5 0.4 0.2 0.1 - 0.0 0.2 0.3UNC Charlotte 0.4 0.4 1.4 0.4 0.6 0.6 0.3 0.2 - - 0.0 1.6UNC Greensboro 0.4 0.3 3.8 1.2 0.5 0.9 0.3 0.1 - 0.2 0.2 5.0Subtotal 0.5 0.5 3.4 0.8 0.4 0.6 0.2 0.1 - 0.4 0.2 4.0
Master's (Comprehensive) Universities and Colleges IAppalachian 0.3 0.4 2.1 0.4 0.5 0.5 0.3 0.2 2.0 0.2 - 0.9Fayetteville 1.1 0.8 1.5 0.1 0.9 0.3 0.1 0.1 0.1 1.1 4.8 5.6NC Central 0.7 0.4 2.9 0.7 0.8 0.6 0.3 0.1 0.2 1.1 1.2 8.5UNC Pembroke 0.5 0.5 4.7 0.1 1.2 0.6 0.2 0.2 - - - -UNC Wilmington 0.7 0.6 3.5 0.7 0.6 0.7 0.4 0.4 - - - 1.9Western Carolina 0.5 0.4 0.8 0.6 3.1 0.9 0.3 0.3 0.5 0.5 0.0 2.2Winston-Salem 0.8 0.9 2.0 0.6 1.9 0.6 0.2 0.1 0.6 0.2 0.9 2.4Subtotal 0.6 0.5 2.4 0.5 1.3 0.6 0.3 0.2 0.7 0.4 0.6 2.7
Baccalaureate (Liberal Arts) Universities and Colleges I and IIElizabeth City 0.7 0.5 1.5 0.9 2.0 0.2 0.2 0.2 - - 0.3 2.9UNC Asheville 0.8 0.8 0.5 0.0 0.8 0.4 1.1 0.0 - 2.0 0.0 -Subtotal 0.8 0.6 1.0 0.4 1.4 0.3 0.6 0.1 - 1.0 0.2 1.4
Schools of Art, Music, and DesignUNC School of the Arts 0.4 0.2 2.2 0.4 1.8 1.4 0.3 0.3 0.3 - 3.8 2.7Subtotal 0.4 0.2 2.2 0.4 1.8 1.4 0.3 0.3 0.3 - 3.8 2.7
Teaching HospitalsUNC Hospitals 0.6 3.7 4.3 1.6 0.5 0.1 - - - 1.0 0.7 2.3Subtotal 0.6 3.7 4.3 1.6 0.5 0.1 - - - 1.0 0.7 2.3
Community CollegesAlamance 1.7 1.0 3.8 0.8 1.0 0.4 0.2 0.6 - 0.1 - -Asheville-Buncombe 1.1 1.5 2.0 1.2 0.4 0.2 0.5 0.6 - 9.9 2.5 1.2Beaufort Co. 1.5 1.7 3.1 0.3 0.9 1.0 0.4 0.3 - 2.8 - -Bladen 1.4 1.8 3.0 - 0.0 0.1 - 1.5 - 0.7 - -Blue Ridge 1.4 0.7 1.1 1.1 0.2 0.1 - 0.6 - 5.9 - -Brunswick 1.4 0.9 2.9 0.7 0.4 0.2 0.3 0.3 24.0 7.7 0.0 6.4Caldwell 1.5 0.8 1.1 0.4 0.1 0.1 0.4 0.1 - 6.7 0.1 -Cape Fear 2.3 2.0 2.7 0.6 0.6 0.6 0.6 0.3 - 4.1 0.9 0.2Carteret 2.8 0.6 4.0 0.8 0.4 0.3 0.1 0.1 - 1.0 - -Catawba Valley 1.4 2.8 2.0 0.1 0.3 0.1 0.6 0.4 - 5.3 1.8 0.4Central Carolina 1.9 0.4 1.0 0.4 0.4 0.1 0.0 0.3 4.6 - 0.1 -Central Piedmont 0.6 0.8 2.7 2.2 0.1 0.4 1.1 0.3 0.1 1.1 - 2.8Cleveland 1.1 2.1 2.9 0.2 1.1 0.9 0.0 0.2 - 0.1 0.1 -Coastal Carolina 0.4 0.8 3.7 0.6 0.3 0.1 - 0.2 - - - -Coll. of Albemarle 1.0 1.1 3.0 0.9 1.1 0.5 0.5 0.2 - 0.0 0.1 -Craven 1.6 1.3 2.2 1.0 - 0.2 1.6 0.7 - 4.8 - -Davidson County 0.8 0.8 9.7 - 1.7 0.5 - 0.2 - 1.8 - -Durham 1.1 0.6 2.0 1.2 0.8 0.6 1.4 0.5 - 2.6 - -Edgecombe 1.2 0.8 2.9 0.4 0.2 0.6 0.4 0.4 0.2 3.8 - -Fayetteville 1.5 1.2 4.6 1.0 0.2 0.2 1.7 0.4 - 0.1 - -

89
Table 14d. Institutional Administration, Independent Operations and Unassigned Subprograms
Ind. Operations UnassignedExec.Mgmt
61
Fin.Mgmt
62
Gen AdLog Svc
63
AdminComp
64
Fac/StfAux. Svcs
65P.R. Devel.
66
Stud.Admiss
67
Stud.Records
68Inst.
91
Ext.Agency
92Usable
01Unusable
02Forsyth 1.3 0.9 3.1 0.9 0.7 0.3 0.5 0.3 - 2.9 1.9 1.2Gaston 0.5 0.6 3.9 1.1 0.7 0.0 0.4 0.3 - 5.0 0.1 -Guilford 0.5 1.2 4.7 0.7 0.3 0.1 0.3 0.1 - 1.1 1.2 8.3Halifax 0.9 1.6 3.6 0.9 0.4 0.2 0.8 0.5 - 3.5 - -Haywood 0.6 0.8 2.0 1.8 4.8 0.2 0.3 0.2 - 1.9 1.0 5.3Isothermal 1.0 0.8 4.6 0.5 0.1 - 0.1 0.4 - 2.2 - -James Sprunt 1.3 3.5 0.4 1.7 0.3 0.7 - 0.3 - 1.2 1.1 -Johnston 1.0 1.4 4.2 0.6 1.0 0.5 0.2 0.3 - 0.9 - -Lenoir 0.7 1.1 1.2 0.8 0.6 0.2 1.1 0.3 - 7.0 - -Martin 0.8 0.7 1.2 0.5 0.4 0.1 0.1 - - 0.6 - -Mayland 2.3 0.6 2.5 1.1 0.5 0.3 0.5 0.3 - 6.9 - 0.2McDowell 0.7 1.1 3.9 1.7 1.9 0.1 - 0.3 - 5.6 - -Mitchell 2.4 1.8 3.0 1.7 0.8 - 0.6 - - 1.9 0.3 2.7Montgomery 4.7 1.1 1.3 1.2 - 0.3 0.1 0.3 - 2.6 - -Nash 0.9 0.6 3.7 0.5 0.6 0.3 0.3 0.3 8.5 - - -Pamlico 3.6 1.9 0.8 2.3 - - - 0.2 - 1.1 - -Piedmont 2.3 1.0 7.2 0.5 1.8 0.2 0.0 0.3 - 0.2 - -Pitt 0.6 0.8 2.7 1.0 0.4 0.6 0.1 0.4 - 0.0 0.6 -Randolph 0.4 0.6 13.3 0.7 0.4 0.4 - 0.0 1.3 4.8 - 1.6Richmond 2.7 0.7 3.2 0.1 0.3 0.3 0.1 0.5 - 1.4 - 6.5Roanoke-Chowan 1.2 1.1 4.5 0.9 - - 0.5 0.4 - 18.3 - -Robeson 1.5 0.6 3.9 1.3 0.5 - 1.3 0.7 0.2 7.2 0.4 -Rockingham 1.0 0.8 2.3 1.0 1.2 0.3 0.5 0.4 - 4.8 2.2 -Rowan-Cabarrus 2.4 0.9 2.5 1.1 0.1 0.0 0.1 0.3 - 1.5 0.9 5.1Sampson 1.7 1.5 2.4 0.8 - 0.2 0.1 0.7 - 6.3 - -Sandhills 0.6 0.7 1.0 0.8 2.3 0.9 0.3 0.3 - 1.4 - -South Piedmont 2.0 0.9 2.3 0.7 0.1 0.5 0.1 0.2 - 6.1 0.1 30.9Southeastern 1.1 0.8 2.7 0.8 0.1 0.1 0.1 0.5 - 1.1 4.6 1.4Southwestern 0.9 1.0 3.5 1.8 0.2 0.8 0.8 0.4 - 2.4 1.0 -Stanly 4.5 1.3 3.1 1.3 0.2 0.1 0.9 1.0 - 4.6 0.0 0.1Surry 0.9 0.6 2.0 1.4 0.1 0.2 0.2 0.2 - 3.6 - -Tri-County 1.7 0.7 10.3 0.9 - - 0.1 0.2 - - - -Vance-Granville 0.9 0.7 3.5 0.9 0.6 0.4 0.3 0.3 - 2.9 1.8 5.3Wake 0.8 0.3 2.8 1.1 0.2 0.2 0.9 0.5 - 1.3 0.1 4.1Wayne 1.6 0.6 1.6 0.8 1.2 0.0 0.7 0.2 0.4 3.9 - -Western Piedmont 1.3 0.6 1.6 1.4 0.2 1.0 0.3 0.4 - 4.0 14.5 2.9Wilkes 1.0 0.5 3.3 0.7 - 0.2 0.7 0.2 3.0 2.3 - 0.4Wilson 3.2 1.5 5.6 0.7 2.3 0.5 0.6 0.3 - - - -Subtotal 1.3 1.0 3.2 1.0 0.6 0.3 0.5 0.3 0.6 2.9 0.7 2.1
Private InstitutionsNC Private Universities
Barton 0.9 0.7 1.4 0.7 3.9 2.2 1.0 0.4 - - 0.4 -Campbell 0.5 0.3 0.6 0.4 2.5 0.3 1.0 0.1 0.4 0.9 0.0 0.1Mars Hill 0.8 0.2 0.7 0.6 1.4 1.7 0.2 0.2 0.1 - 0.1 2.3Pfeiffer 0.5 0.7 1.9 0.6 6.8 0.4 0.6 0.2 - - 8.3 0.4Subtotal 0.6 0.4 1.0 0.5 3.1 0.9 0.8 0.2 0.2 0.4 1.4 0.6
Grand Total 0.7 0.7 2.7 0.9 0.8 0.5 0.3 0.2 0.4 1.3 0.7 2.4

TABLE 15:
ASSIGNABLE AREA BY ROOM CODE
Just as all assignable space can be categorized by program (Table 14), it can also be
classified by use of the room. A system of codes has been developed which includes virtually all
types of rooms, in terms of specific use, which can be found at a college or university. The
Room Use Code Structure is summarized on pp. 91-92; specific definitions can be found in the
Higher Education Facilities Commission's Facilities Inventory and Utilization Manual (fifth
edition). This updated manual incorporates the codes and definitions presented in the 2006
national Postsecondary Education Facilities Inventory and Classification Manual.
Table 15 provides percentage distributions among the ten major room use code divisions.
In theory, the sums of the percentages should always equal to 100.0, but they do not for some
institutions because of rounding.
The data from the 1974 HEGIS facilities survey, conducted by the National Center for
Education Statistics, serve as the basis for norms. The following chart reports these norms and
summarizes the corresponding data from Table 15. These norms are not applicable to the public
two-year institutions, which represent the Community College System, because they have almost
no residential space. For these schools, the subtotal for "Community Colleges" in Table 15 may
serve as a norm.
All N.C.
HEGIS Institutions
Room Use Code Norm (%) 2013 (%)
Classroom (Series 100) 8.0 9.8
Laboratory (Series 200) 14.5 17.0
Office(Series 300) 13.0 20.8
Study (Series 400) 6.8 5.5
Special Use (Series 500) 8.9 9.1
General Use (Series 600) 12.0 10.8
Support (Series 700) 6.5 4.8
Health Care (Series 800) 1.4 1.9
Residential (Series 900) 26.7 17.6
Unclassified (Series 000) 2.2 2.6
90

Room Use Codes
100 Classroom Facilities
110 Classroom
115 Classroom Service
200 Laboratory Facilities
210 Class Laboratory
215 Class Laboratory Service
220 Open Laboratory
225 Open Laboratory Service
250 Research/Nonclass Laboratory
255 Research/Nonclass Laboratory Service
300 Office Facilities 310 Office
315 Office Service
350 Conference Room
355 Conference Room Service
400 Study Facilities
410 Study Room
420 Stack
430 Open-Stack Study Room
440 Processing Room
455 Study Service
500 Special Use Facilities
510 Armory
515 Armory Service
520 Athletic or Physical Education
523 Athletic Facilities Spectator
Seating
525 Athletic or Physical Ed. Svc.
530 Media Production
535 Media Production Service
540 Clinic
545 Clinic Service
550 Demonstration
555 Demonstration Service
560 Field Building
570 Animal Quarters
575 Animal Quarters Service
580 Greenhouse
585 Greenhouse Service
590 Other (All Purpose)
600 General Use Facilities
610 Assembly
615 Assembly Service
620 Exhibition
625 Exhibition Service
630 Food Facility
635 Food Facility Service
640 Day Care
645 Day Care Service
650 Lounge
655 Lounge Service
660 Merchandising
665 Merchandising Service
670 Recreation
675 Recreation Service
680 Meeting Room
685 Meeting Room Service
700 Support Facilities
710 Central Computer or Telecommu-
nications
715 Central Computer or Telecommu-
nications Service
720 Shop
725 Shop Service
730 Central Storage
735 Central Storage Service
740 Vehicle Storage
745 Vehicle Storage Service
750 Central Service
755 Central Service Support
760 Hazardous Materials Storage
770 Hazardous Waste Storage
775 Hazardous Waste Storage Svc.
800 Health Care Facilities
810 Patient Bedroom
815 Patient Bedroom Service
820 Patient Bath
830 Nurse Station
91

835 Nurse Station Service
840 Surgery
845 Surgery Service
850 Treatment/Examination
855 Treatment/Examination Service
860 Diagnostic Service Laboratory
865 Diagnostic Service Laboratory
Support
870 Central Supplies
880 Public Waiting
890 Staff On-Call Facility
895 Staff On-Call Facility Service
900 Residential Facilities
910 Sleep/Study without Toilet or Bath
910X Sleep/Study without Toilet or Bath
Designed and Equipped for
Mobility Impaired
919 Toilet or Bath
919X Toilet or Bath Designed and
Equipped for Mobility
Impaired
920 Sleep/Study with Toilet or Bath
920X Sleep/Study with Toilet or
Bath Designed and Equipped
for Mobility Impaired
935 Sleep/Study Service
950 Apartment
950X Apartment Equipped for Mobility
Impaired
955 Apartment Service
970 House
000 Unclassified Facilities 010 Elevator
011 Men's Toilet Equipped for Mobility Impaired
012 Women's Toilet Equipped for
Mobility Impaired
013 Unisex Toilet Equipped for
Mobility Impaired
050 Inactive Area
060 Alteration or Conversion Area
070 Unfinished Area
92

Percentage Distribution ofAssignable Square Footage by Room Codes
Classroom Laboratory Office StudySpecial Use General Use Health Care SupportResidential Unclassified
3,976
4,963
3,412
979678
2,056
857
17,386
2,313
6,136
10,161
2,584
5,087
4,625
2,249
1,257
11,096
47,033
802
2,390
1000s ofSquare Feet
0
5,000
10,000
15,000
20,000
25,000
30,000
35,000
40,000
45,000
NC CC UNC NC Prvt
Classroom Laboratory Office StudySpecial Use General Use Health Care SupportResidential Unclassified
22.87%
28.55%
19.62%
5.63%
3.90%
11.83%
4.93%
2.60%
4.92%
13.05%
21.60%
5.49%
10.82%
9.83%
4.78%
2.67%
23.59%
3.24%
8.70%
6.81%
13.69%
6.38%
11.02%
15.44%
2.34%
33.55%1.81%
0
10
20
30
40
50
60
70
80
90
100
110
NC CC UNC NC Prvt
93

94
Table 15. Assignable Area by Room Codes
Institution
TotalAssignable
AreaClassroom Facilities
100Laboratory Facilities
200Office Facilities
300Study Facilities
400ASF % ASF % ASF % ASF %
Public InstitutionsResearch Universities I
NC State 8,683,235 262,765 3.0 1,606,003 18.5 1,840,590 21.2 348,337 4.0NC State Veterinary Med 424,851 8,139 1.9 102,754 24.2 83,162 19.6 11,186 2.6UNC-Chapel Hill 7,222,629 282,124 3.9 615,754 8.5 1,560,582 21.6 636,794 8.8UNC-Chapel Hill Hlth Aff. 2,530,262 77,021 3.0 714,002 28.2 1,078,642 42.6 76,697 3.0Subtotal 18,860,977 630,049 3.3 3,038,513 16.1 4,562,976 24.2 1,073,014 5.7
Doctoral Universities I and IIEast Carolina 3,272,813 189,011 5.8 321,066 9.8 646,646 19.8 208,647 6.4East Carolina Hlth Aff. 827,019 44,262 5.4 162,026 19.6 310,377 37.5 64,369 7.8NC A&T 2,218,401 146,166 6.6 323,014 14.6 426,690 19.2 133,315 6.0UNC Charlotte 3,493,311 230,093 6.6 541,503 15.5 744,071 21.3 224,225 6.4UNC Greensboro 2,997,367 153,508 5.1 326,763 10.9 608,588 20.3 136,819 4.6Subtotal 12,808,911 763,040 6.0 1,674,372 13.1 2,736,372 21.4 767,375 6.0
Master's (Comprehensive) Universities and Colleges IAppalachian 2,821,238 170,280 6.0 253,219 9.0 522,471 18.5 91,968 3.3Fayetteville 892,087 57,386 6.4 91,047 10.2 199,451 22.4 68,228 7.6NC Central 1,457,852 118,863 8.2 145,052 9.9 310,585 21.3 103,315 7.1UNC Pembroke 1,023,469 87,834 8.6 59,598 5.8 181,175 17.7 40,675 4.0UNC Wilmington 2,179,820 161,650 7.4 217,768 10.0 377,362 17.3 119,221 5.5Western Carolina 2,028,270 101,760 5.0 184,017 9.1 325,309 16.0 126,288 6.2Winston-Salem 1,114,239 72,171 6.5 97,410 8.7 213,908 19.2 47,024 4.2Subtotal 11,516,975 769,944 6.7 1,048,111 9.1 2,130,261 18.5 596,719 5.2
Baccalaureate (Liberal Arts) Universities and Colleges I and IIElizabeth City 862,299 65,771 7.6 80,880 9.4 112,017 13.0 43,018 5.0UNC Asheville 887,132 43,566 4.9 95,787 10.8 157,988 17.8 79,251 8.9Subtotal 1,749,431 109,337 6.2 176,667 10.1 270,005 15.4 122,269 7.0
Schools of Art, Music, and DesignUNC School of the Arts 738,551 31,175 4.2 187,379 25.4 89,693 12.1 21,245 2.9Subtotal 738,551 31,175 4.2 187,379 25.4 89,693 12.1 21,245 2.9
Teaching HospitalsUNC Hospitals 1,358,302 9,926 0.7 10,829 0.8 371,821 27.4 3,244 0.2Subtotal 1,358,302 9,926 0.7 10,829 0.8 371,821 27.4 3,244 0.2
Community CollegesAlamance 238,366 72,635 30.5 74,785 31.4 47,270 19.8 10,937 4.6Asheville-Buncombe 511,055 91,755 18.0 177,857 34.8 131,264 25.7 16,788 3.3Beaufort Co. 189,556 50,957 26.9 54,199 28.6 36,123 19.1 9,158 4.8Bladen 110,946 28,406 25.6 29,147 26.3 22,403 20.2 9,039 8.1Blue Ridge 290,314 67,396 23.2 93,661 32.3 44,116 15.2 13,885 4.8Brunswick 254,175 50,818 20.0 29,777 11.7 37,231 14.6 7,865 3.1Caldwell 340,713 88,515 26.0 82,296 24.2 62,078 18.2 19,006 5.6Cape Fear 614,635 112,559 18.3 206,836 33.7 144,580 23.5 30,844 5.0Carteret 167,124 42,637 25.5 59,058 35.3 34,627 20.7 6,761 4.0Catawba Valley 365,292 69,908 19.1 117,024 32.0 64,755 17.7 22,346 6.1Central Carolina 404,568 123,686 30.6 130,168 32.2 72,494 17.9 20,504 5.1Central Piedmont 1,289,900 338,616 26.3 347,022 26.9 274,194 21.3 64,878 5.0Cleveland 207,079 48,528 23.4 66,675 32.2 32,625 15.8 17,109 8.3Coastal Carolina 218,626 58,733 26.9 81,160 37.1 42,654 19.5 15,190 6.9Coll. of Albemarle 272,245 55,960 20.6 85,077 31.3 49,227 18.1 17,619 6.5Craven 210,443 50,838 24.2 71,837 34.1 45,217 21.5 18,954 9.0Davidson County 310,482 68,624 22.1 77,184 24.9 70,618 22.7 24,126 7.8Durham 343,071 89,855 26.2 96,980 28.3 73,870 21.5 15,221 4.4Edgecombe 169,084 35,546 21.0 44,623 26.4 30,428 18.0 12,318 7.3Fayetteville 630,851 166,618 26.4 195,439 31.0 130,893 20.7 28,030 4.4

95
Table 15. Assignable Area by Room Codes
Institution
TotalAssignable
AreaClassroom Facilities
100Laboratory Facilities
200Office Facilities
300Study Facilities
400ASF % ASF % ASF % ASF %
Forsyth 668,782 146,908 22.0 213,236 31.9 125,243 18.7 22,928 3.4Gaston 475,497 107,403 22.6 151,298 31.8 106,446 22.4 31,040 6.5Guilford 884,897 203,692 23.0 275,372 31.1 168,017 19.0 32,534 3.7Halifax 187,362 37,203 19.9 47,966 25.6 34,385 18.4 11,164 6.0Haywood 253,015 34,010 13.4 95,497 37.7 42,251 16.7 13,750 5.4Isothermal 241,215 49,883 20.7 68,009 28.2 35,717 14.8 11,156 4.6James Sprunt 117,674 27,013 23.0 23,656 20.1 36,136 30.7 10,267 8.7Johnston 338,241 87,603 25.9 82,525 24.4 63,930 18.9 26,403 7.8Lenoir 322,942 73,404 22.7 83,642 25.9 54,815 17.0 18,497 5.7Martin 170,782 24,135 14.1 37,211 21.8 18,306 10.7 14,280 8.4Mayland 113,020 31,524 27.9 26,485 23.4 21,992 19.5 10,255 9.1McDowell 117,076 24,874 21.2 34,718 29.7 23,964 20.5 6,058 5.2Mitchell 268,212 70,862 26.4 52,020 19.4 52,205 19.5 16,760 6.2Montgomery 92,421 19,206 20.8 30,658 33.2 17,192 18.6 10,566 11.4Nash 175,598 49,714 28.3 45,704 26.0 27,178 15.5 13,237 7.5Pamlico 55,243 14,141 25.6 12,280 22.2 12,181 22.0 4,549 8.2Piedmont 143,109 37,202 26.0 35,501 24.8 31,954 22.3 8,895 6.2Pitt 376,412 82,071 21.8 129,366 34.4 86,538 23.0 22,804 6.1Randolph 293,984 67,487 23.0 92,821 31.6 42,298 14.4 8,155 2.8Richmond 177,786 35,709 20.1 41,527 23.4 28,271 15.9 10,560 5.9Roanoke-Chowan 117,209 18,145 15.5 37,654 32.1 17,230 14.7 11,019 9.4Robeson 201,239 37,206 18.5 60,367 30.0 44,230 22.0 12,560 6.2Rockingham 230,981 39,311 17.0 65,770 28.5 36,975 16.0 11,606 5.0Rowan-Cabarrus 378,353 88,575 23.4 93,700 24.8 91,148 24.1 23,277 6.2Sampson 139,057 32,694 23.5 37,859 27.2 28,584 20.6 14,296 10.3Sandhills 321,663 89,219 27.7 70,125 21.8 58,765 18.3 17,584 5.5South Piedmont 322,160 40,142 12.5 51,962 16.1 49,759 15.4 11,916 3.7Southeastern 183,591 48,799 26.6 46,388 25.3 37,596 20.5 13,907 7.6Southwestern 203,835 42,990 21.1 51,161 25.1 40,747 20.0 11,142 5.5Stanly 147,199 32,864 22.3 40,153 27.3 35,315 24.0 8,885 6.0Surry 313,753 88,163 28.1 90,145 28.7 61,214 19.5 12,944 4.1Tri-County 117,608 29,709 25.3 39,639 33.7 18,010 15.3 5,961 5.1Vance-Granville 264,751 49,658 18.8 77,339 29.2 49,450 18.7 18,964 7.2Wake 848,436 205,137 24.2 229,637 27.1 190,603 22.5 58,002 6.8Wayne 255,443 36,807 14.4 83,337 32.6 51,256 20.1 19,597 7.7Western Piedmont 287,293 58,040 20.2 73,771 25.7 47,392 16.5 16,173 5.6Wilkes 298,201 59,251 19.9 76,397 25.6 46,067 15.4 16,665 5.6Wilson 143,403 42,278 29.5 37,748 26.3 31,738 22.1 9,738 6.8Subtotal 17,385,968 3,975,622 22.9 4,963,449 28.5 3,411,765 19.6 978,672 5.6
Private InstitutionsNC Private Universities
Barton 350,454 28,852 8.2 24,220 6.9 57,007 16.3 21,578 6.2Campbell 1,122,004 102,500 9.1 62,305 5.6 159,572 14.2 79,467 7.1Mars Hill 543,596 42,502 7.8 46,988 8.6 65,204 12.0 28,959 5.3Pfeiffer 373,986 34,151 9.1 29,152 7.8 45,508 12.2 22,401 6.0Subtotal 2,390,040 208,005 8.7 162,665 6.8 327,291 13.7 152,405 6.4
Grand Total 66,809,155 6,497,098 9.7 11,261,985 16.9 13,900,184 20.8 3,714,943 5.6

96
Table 15. Assignable Area by Room Codes
InstitutionSpecial Use Facilities
500
General UseFacilities
600Support Facilities
700Health Care Facilities
800Residential Facilities
900
UnclassifiedFacilities
000ASF % ASF % ASF % ASF % ASF % ASF %
Public InstitutionsResearch Universities I
NC State 1,556,487 17.9 672,771 7.7 449,453 5.2 26,391 0.3 1,635,652 18.8 284,786 3.3NC State Veterinary Med 67,218 15.8 9,885 2.3 27,756 6.5 114,572 27.0 179 0.0 0 0.0UNC-Chapel Hill 842,365 11.7 813,504 11.3 455,513 6.3 22,614 0.3 1,894,690 26.2 98,689 1.4UNC-Chapel Hill Hlth Aff. 182,231 7.2 90,516 3.6 36,962 1.5 153,013 6.0 310 0.0 120,868 4.8Subtotal 2,648,301 14.0 1,586,676 8.4 969,684 5.1 316,590 1.7 3,530,831 18.7 504,343 2.7
Doctoral Universities I and IIEast Carolina 321,209 9.8 297,794 9.1 153,441 4.7 5,345 0.2 830,000 25.4 299,654 9.2East Carolina Hlth Aff. 44,768 5.4 7,280 0.9 52,430 6.3 132,188 16.0 1,280 0.2 8,039 1.0NC A&T 320,221 14.4 229,000 10.3 194,961 8.8 6,519 0.3 429,127 19.3 9,388 0.4UNC Charlotte 250,228 7.2 313,789 9.0 58,383 1.7 7,633 0.2 1,066,087 30.5 57,299 1.6UNC Greensboro 114,104 3.8 331,692 11.1 259,148 8.6 9,654 0.3 903,709 30.2 153,382 5.1Subtotal 1,050,530 8.2 1,179,555 9.2 718,363 5.6 161,339 1.3 3,230,203 25.2 527,762 4.1
Master's (Comprehensive) Universities and Colleges IAppalachian 402,056 14.3 394,611 14.0 84,903 3.0 11,733 0.4 865,642 30.7 24,355 0.9Fayetteville 76,888 8.6 77,346 8.7 17,594 2.0 2,319 0.3 211,793 23.7 90,035 10.1NC Central 126,492 8.7 159,983 11.0 26,300 1.8 2,805 0.2 324,897 22.3 139,560 9.6UNC Pembroke 86,888 8.5 123,595 12.1 51,100 5.0 2,612 0.3 389,992 38.1 0 0.0UNC Wilmington 125,226 5.7 273,200 12.5 87,246 4.0 4,676 0.2 772,224 35.4 41,247 1.9Western Carolina 212,739 10.5 304,186 15.0 63,144 3.1 3,246 0.2 662,833 32.7 44,748 2.2Winston-Salem 71,021 6.4 123,188 11.1 31,339 2.8 5,984 0.5 415,592 37.3 36,602 3.3Subtotal 1,101,310 9.6 1,456,109 12.6 361,626 3.1 33,375 0.3 3,642,973 31.6 376,547 3.3
Baccalaureate (Liberal Arts) Universities and Colleges I and IIElizabeth City 102,551 11.9 100,402 11.6 17,804 2.1 4,862 0.6 309,324 35.9 25,670 3.0UNC Asheville 127,956 14.4 121,637 13.7 38,247 4.3 1,207 0.1 221,197 24.9 296 0.0Subtotal 230,507 13.2 222,039 12.7 56,051 3.2 6,069 0.3 530,521 30.3 25,966 1.5
Schools of Art, Music, and DesignUNC School of the Arts 23,826 3.2 118,212 16.0 58,221 7.9 3,073 0.4 158,026 21.4 47,701 6.5Subtotal 23,826 3.2 118,212 16.0 58,221 7.9 3,073 0.4 158,026 21.4 47,701 6.5
Teaching HospitalsUNC Hospitals 32,493 2.4 62,294 4.6 85,493 6.3 736,524 54.2 3,785 0.3 41,893 3.1Subtotal 32,493 2.4 62,294 4.6 85,493 6.3 736,524 54.2 3,785 0.3 41,893 3.1
Community CollegesAlamance 6,206 2.6 17,907 7.5 8,626 3.6 - - - - 0 0.0Asheville-Buncombe 16,094 3.1 51,055 10.0 19,269 3.8 751 0.1 - - 6,222 1.2Beaufort Co. 3,102 1.6 25,009 13.2 11,008 5.8 - - - - 0 0.0Bladen - - 13,863 12.5 8,088 7.3 - - - - 0 0.0Blue Ridge 6,235 2.1 52,154 18.0 12,867 4.4 - - - - 0 0.0Brunswick 29,789 11.7 69,757 27.4 12,553 4.9 112 0.0 - - 16,273 6.4Caldwell 20,026 5.9 52,572 15.4 16,146 4.7 - - - - 74 0.0Cape Fear 27,903 4.5 59,270 9.6 24,705 4.0 - - 1,033 0.2 6,905 1.1Carteret 6,930 4.1 10,248 6.1 6,863 4.1 - - - - 0 0.0Catawba Valley 38,452 10.5 41,960 11.5 2,633 0.7 - - - - 8,214 2.2Central Carolina 11,379 2.8 41,428 10.2 2,630 0.7 1,954 0.5 - - 325 0.1Central Piedmont 32,537 2.5 124,115 9.6 72,447 5.6 - - - - 36,091 2.8Cleveland 15,067 7.3 16,628 8.0 10,447 5.0 - - - - 0 0.0Coastal Carolina 3,031 1.4 11,595 5.3 6,263 2.9 - - - - 0 0.0Coll. of Albemarle 7,204 2.6 44,182 16.2 12,976 4.8 - - - - 0 0.0Craven 1,875 0.9 19,908 9.5 1,814 0.9 - - - - 0 0.0Davidson County 18,581 6.0 28,276 9.1 22,931 7.4 142 0.0 - - 0 0.0Durham 2,555 0.7 23,492 6.8 41,098 12.0 - - - - 0 0.0Edgecombe 770 0.5 37,979 22.5 7,420 4.4 - - - - 0 0.0Fayetteville 24,802 3.9 53,721 8.5 30,970 4.9 378 0.1 - - 0 0.0

97
Table 15. Assignable Area by Room Codes
InstitutionSpecial Use Facilities
500
General UseFacilities
600Support Facilities
700Health Care Facilities
800Residential Facilities
900
UnclassifiedFacilities
000ASF % ASF % ASF % ASF % ASF % ASF %
Forsyth 19,761 3.0 63,031 9.4 57,075 8.5 - - - - 20,600 3.1Gaston 13,932 2.9 53,054 11.2 11,576 2.4 748 0.2 - - 0 0.0Guilford 31,940 3.6 61,011 6.9 27,948 3.2 529 0.1 - - 83,854 9.5Halifax 7,060 3.8 41,002 21.9 8,582 4.6 - - - - 0 0.0Haywood 1,590 0.6 37,468 14.8 12,477 4.9 - - - - 15,972 6.3Isothermal 22,920 9.5 35,395 14.7 18,135 7.5 - - - - 0 0.0James Sprunt 3,795 3.2 11,716 10.0 3,811 3.2 - - - - 1,280 1.1Johnston 16,810 5.0 36,930 10.9 22,527 6.7 - - 1,513 0.4 0 0.0Lenoir 27,021 8.4 51,908 16.1 13,655 4.2 - - - - 0 0.0Martin 13,294 7.8 58,187 34.1 5,369 3.1 - - - - 0 0.0Mayland 452 0.4 16,358 14.5 5,689 5.0 - - - - 265 0.2McDowell 1,165 1.0 19,909 17.0 6,388 5.5 - - - - 0 0.0Mitchell 17,457 6.5 39,873 14.9 10,793 4.0 - - - - 8,242 3.1Montgomery 1,361 1.5 10,986 11.9 2,452 2.7 - - - - 0 0.0Nash - - 30,962 17.6 8,803 5.0 - - - - 0 0.0Pamlico 140 0.3 9,292 16.8 2,660 4.8 - - - - 0 0.0Piedmont - - 15,559 10.9 13,998 9.8 - - - - 0 0.0Pitt 20,896 5.6 16,947 4.5 17,189 4.6 - - - - 601 0.2Randolph 5,152 1.8 36,388 12.4 37,117 12.6 - - - - 4,566 1.6Richmond 989 0.6 42,030 23.6 6,959 3.9 226 0.1 - - 11,515 6.5Roanoke-Chowan 9,874 8.4 14,075 12.0 9,212 7.9 - - - - 0 0.0Robeson 1,538 0.8 38,216 19.0 7,122 3.5 - - - - 0 0.0Rockingham 30,804 13.3 34,477 14.9 7,019 3.0 - - - - 5,019 2.2Rowan-Cabarrus 3,843 1.0 37,394 9.9 19,904 5.3 - - - - 20,512 5.4Sampson 1,140 0.8 17,809 12.8 6,675 4.8 - - - - 0 0.0Sandhills 28,060 8.7 47,126 14.7 5,152 1.6 - - 5,632 1.8 0 0.0South Piedmont 1,291 0.4 49,254 15.3 18,160 5.6 - - - - 99,676 30.9Southeastern 11,272 6.1 17,915 9.8 5,055 2.8 - - - - 2,659 1.4Southwestern 18,202 8.9 28,481 14.0 9,042 4.4 - - - - 2,070 1.0Stanly 2,867 1.9 19,585 13.3 7,423 5.0 - - - - 107 0.1Surry 17,276 5.5 31,926 10.2 12,085 3.9 - - - - 0 0.0Tri-County - - 13,563 11.5 10,726 9.1 - - - - 0 0.0Vance-Granville 1,098 0.4 42,407 16.0 7,193 2.7 - - - - 18,642 7.0Wake 36,462 4.3 58,214 6.9 35,469 4.2 - - - - 34,912 4.1Wayne 9,574 3.7 27,651 10.8 26,787 10.5 434 0.2 - - 0 0.0Western Piedmont 2,250 0.8 30,767 10.7 13,478 4.7 - - - - 45,422 15.8Wilkes 24,074 8.1 51,118 17.1 23,424 7.9 - - - - 1,205 0.4Wilson 229 0.2 13,364 9.3 8,308 5.8 - - - - 0 0.0Subtotal 678,127 3.9 2,056,467 11.8 857,191 4.9 5,274 0.0 8,178 0.0 451,223 2.6
Private InstitutionsNC Private Universities
Barton 50,010 14.3 55,955 16.0 7,677 2.2 741 0.2 104,414 29.8 0 0.0Campbell 126,715 11.3 146,740 13.1 21,724 1.9 2,964 0.3 419,085 37.4 932 0.1Mars Hill 44,666 8.2 120,198 22.1 14,584 2.7 2,291 0.4 165,217 30.4 12,987 2.4Pfeiffer 41,948 11.2 46,094 12.3 11,930 3.2 338 0.1 113,088 30.2 29,376 7.9Subtotal 263,339 11.0 368,987 15.4 55,915 2.3 6,334 0.3 801,804 33.5 43,295 1.8
Grand Total 6,028,433 9.0 7,050,339 10.6 3,162,544 4.7 1,268,578 1.9 11,906,321 17.8 2,018,730 3.0

TABLE 16:
ASSIGNABLE SQUARE FEET PER STUDENT STATION
FOR CLASSROOMS
The number of students that a classroom can accommodate is an important factor in
determining how efficiently classroom space is used. This can be measured in terms of
assignable square feet per student station and the average number of stations per classroom.
The assignable square feet per student station in a classroom is largely determined by the
number and type of stations in the room. Generally, rooms with relatively large numbers of
stations require less space per station. As for types of stations, tables and chairs require more
space per station than standard student desks, which require more space than theater seating. Al-
though the space required per station can vary from less than ten assignable square feet to more
than 30, the University of North Carolina has adopted a standard of 18 square feet per station.
The Higher Education Facilities Planning and Management Manuals (page 62 of Manual
Two) list norms which are based on the number and type of station:
Assignable Square Feet Per Station Criteria
Number ASF for ASF for ASF for
of Tables and Armchair Desks Armchair Desks
Stations Chairs Small Large
10 - 19 20 - 30 18 22
20 - 29 20 - 30 16 20
30 - 39 20 - 25 15 18
40 - 59 18 - 22 14 16
60 - 99 18 - 22 13 15
100 - 149 16 - 20 11 14
150 - 299 16 - 20 10 14
300 + 16 - 18 9 12
The average number of stations per classroom tends to vary according to the size and
instructional philosophy of the institution. Graduate institutions and institutions which rely
heavily on large lecture courses will generally have large numbers of stations per classroom.
98

CLASSROOMS
0 500 1000 1500
Major Research Universities
Other Baccalaureate Institutions
Public Two-Year Institutions
Community and TechnicalColleges
University of North Carolina
Private Institutions
AVERAGE ROOM SIZE
level
control
0 10 20 30
Major Research Universities
Other Baccalaureate Institutions
Public Two-Year Institutions
Community Colleges
UNC Campuses
Private Institutions
AVERAGE SQUARE FEET PER STUDENT STATION
level
control
99

100
Table 16. Assignable Area Per Student Station for Classrooms
Institution No. of Rooms
No.of StudentStations
Ave.Stu Sta
Per RoomTotal Assignable Sq.
Ft. Sq. Ft. Per Student Station2013 2012 2011 2010 2009
Public InstitutionsResearch Universities I
NC State 238 14,735 62 250,551 17 17 17 17 16NC State Veterinary Med 6 421 70 7,731 18 18 19 20 20UNC-Chapel Hill 292 15,428 53 265,957 17 17 18 18 18UNC-Chapel Hill Hlth Aff. 84 3,964 47 73,268 18 18 18 18 17Subtotal 620 34,548 56 597,507 17 17 17 17 17
Doctoral Universities I and IIEast Carolina 207 10,483 51 184,319 18 17 17 17 17East Carolina Hlth Aff. 52 2,165 42 43,437 20 18 18 18 18NC A&T 154 7,248 47 139,525 19 19 19 19 19UNC Charlotte 215 12,420 58 221,071 18 17 17 17 17UNC Greensboro 147 8,698 59 147,059 17 17 17 17 17Subtotal 775 41,014 53 735,411 18 18 18 18 17
Master's (Comprehensive) Universities and Colleges IAppalachian 205 8,360 41 164,239 20 20 20 19 19Fayetteville 65 2,592 40 52,642 20 20 20 20 20NC Central 142 6,095 43 112,831 19 19 18 18 18UNC Pembroke 105 3,654 35 83,118 23 23 20 20 20UNC Wilmington 172 7,884 46 156,643 20 20 19 20 19Western Carolina 115 4,546 40 95,131 21 21 21 21 21Winston-Salem 84 3,581 43 69,357 19 19 19 19 19Subtotal 888 36,712 41 733,961 20 20 19 20 19
Baccalaureate (Liberal Arts) Universities and Colleges I and IIElizabeth City 83 3,319 40 62,637 19 19 18 18 18UNC Asheville 55 1,944 35 42,129 22 22 22 22 22Subtotal 138 5,263 38 104,766 20 20 19 19 19
Schools of Art, Music, and DesignUNC School of the Arts 53 1,253 24 30,971 25 26 25 25 24Subtotal 53 1,253 24 30,971 25 26 25 25 24
Community CollegesAlamance 101 3,122 31 71,253 23 23 23 23 21Asheville-Buncombe 113 3,449 31 89,138 26 26 26 26 27Beaufort Co. 62 2,443 39 48,153 20 20 20 20 23Bladen 42 1,144 27 26,856 23 23 23 23 22Blue Ridge 76 1,993 26 61,391 31 31 31 32 31Brunswick 66 1,938 29 47,350 24 24 25 22 22Caldwell 103 3,044 30 84,903 28 28 28 28 27Cape Fear 134 4,140 31 110,555 27 27 27 27 26Carteret 63 1,524 24 41,910 28 28 27 27 27Catawba Valley 84 2,655 32 66,812 25 26 25 25 26Central Carolina 180 5,118 28 121,419 24 23 23 23 23Central Piedmont 376 11,519 31 328,786 29 28 27 27 26Cleveland 65 2,066 32 46,978 23 23 22 22 22Coastal Carolina 92 2,793 30 57,907 21 21 21 21 21Coll. of Albemarle 70 1,840 26 55,467 30 30 31 30 30Craven 80 1,743 22 48,830 28 28 28 26 23Davidson County 90 2,784 31 65,464 24 24 24 22 22Durham 120 3,992 33 88,082 22 22 22 21 21Edgecombe 66 1,733 26 34,174 20 20 20 20 20Fayetteville 219 9,298 42 160,201 17 17 17 17 17Forsyth 207 6,024 29 142,986 24 24 24 24 23Gaston 132 4,457 34 102,412 23 23 23 22 23Guilford 278 8,300 30 196,158 24 24 24 25 25Halifax 47 1,279 27 36,899 29 29 29 29 29

101
Table 16. Assignable Area Per Student Station for Classrooms
Institution No. of Rooms
No.of StudentStations
Ave.Stu Sta
Per RoomTotal Assignable Sq.
Ft. Sq. Ft. Per Student Station2013 2012 2011 2010 2009
Haywood 44 1,336 30 32,303 24 23 24 25 25Isothermal 64 2,095 33 48,308 23 23 21 21 21James Sprunt 40 1,113 28 26,478 24 24 24 24 24Johnston 112 3,425 31 80,687 24 24 24 24 24Lenoir 100 2,813 28 71,270 25 26 26 27 27Martin 29 782 27 22,906 29 29 29 29 29Mayland 45 1,178 26 30,384 26 26 26 26 31McDowell 36 1,095 30 23,513 21 21 21 24 23Mitchell 103 3,041 30 69,219 23 23 23 23 22Montgomery 27 803 30 19,031 24 24 24 24 24Nash 61 2,012 33 48,242 24 24 24 24 24Pamlico 21 483 23 13,849 29 29 29 29 29Piedmont 52 1,279 25 36,087 28 28 28 28 28Pitt 98 3,286 34 81,529 25 25 25 25 25Randolph 95 2,709 29 65,166 24 23 23 23 22Richmond 50 1,684 34 35,015 21 21 20 20 20Roanoke-Chowan 33 890 27 17,887 20 20 20 20 20Robeson 49 1,447 30 35,810 25 25 21 22 22Rockingham 48 1,626 34 36,625 23 22 22 23 23Rowan-Cabarrus 110 3,378 31 82,103 24 24 23 23 23Sampson 42 1,382 33 31,401 23 23 23 23 22Sandhills 109 3,699 34 85,900 23 23 22 22 22South Piedmont 60 1,512 25 39,394 26 25 25 25 25Southeastern 54 2,122 39 46,762 22 21 21 21 20Southwestern 57 1,427 25 42,034 29 29 30 30 30Stanly 50 1,869 37 32,682 17 18 18 18 18Surry 104 3,131 30 82,450 26 26 26 26 26Tri-County 44 1,061 24 29,063 27 27 27 29 28Vance-Granville 66 2,140 32 48,436 23 23 22 22 23Wake 230 8,559 37 198,623 23 23 24 23 23Wayne 55 1,711 31 35,455 21 21 21 21 21Western Piedmont 59 1,834 31 56,070 31 31 31 31 28Wilkes 96 3,050 32 58,415 19 19 19 19 20Wilson 55 1,839 33 41,628 23 22 22 22 22Subtotal 5,164 160,209 31 3,838,809 24 24 24 24 24
Private InstitutionsNC Private Universities
Barton 40 1,678 42 27,919 17 17 17 17 17Campbell 95 5,157 54 98,812 19 19 19 19 19Mars Hill 65 1,852 28 41,586 22 22 22 22 22Pfeiffer 50 1,603 32 33,536 21 21 21 20 20Subtotal 250 10,290 41 201,853 20 20 20 19 19
Grand Total 7,888 289,289 37 6,243,278 22 21 21 21 21

TABLE 17:
ASSIGNABLE SQUARE FEET PER STUDENT STATION
FOR CLASS LABORATORIES
The square footage per student station in class laboratories varies to a greater extent than
in classrooms because of the widely differing space requirements of the various kinds of
laboratories. An automotive lab, for example, usually requires much more space per station than
a chemistry lab. In general, institutions which offer academic programs in such areas as
agriculture, engineering, or medicine, or in vocational/technical programs such as automotive
mechanics, textiles, and welding require more class lab space per station than do institutions
which focus on liberal arts, business, and education. Moreover, graduate level laboratories
usually require more space per station than undergraduate labs.
The University of North Carolina has developed ASF-per-station standards for four
discipline categories of space (see Table 11-Space Standards):
Highly Intensive - 108 ASF (Includes Engineering (including Textiles), Applied Design,
Dance, and Dramatic Arts).
Intensive - 70 ASF (Includes Architecture, Health Professions, Library Science,
and Physical Sciences).
Moderately Intensive - 50 ASF (Includes Agriculture, Biological Sciences, Communications,
Computer/Information Technologies, Education, Art, Home
Economics, Law, Psychology).
Non-Intensive - 33 ASF (Includes Business, Cinematography, Music, Languages,
Letters, Mathematics, Public Affairs, Social Sciences).
102

CLASS LABORATORIES
0 500 1000 1500
Major Research Universities
Other Baccalaureate Institutions
Public Two-Year Institutions
Community and TechnicalColleges
University of North Carolina
Private Institutions
AVERAGE ROOM SIZE
level
control
0 20 40 60
Major Research Universities
Other Baccalaureate Institutions
Public Two-Year Institutions
Community Colleges
UNC Campuses
Private Institutions
AVERAGE SQUARE FEET PER STUDENT STATION
level
control
103

104
Table 17. Assignable Area Per Student Station for Class Laboratories
Institution No. of Rooms
No.of StudentStations
Ave.Stu Sta
Per RoomTotal Assignable Sq.
Ft. Sq. Ft. Per Student Station2013 2012 2011 2010 2009
Public InstitutionsResearch Universities I
NC State 259 6,523 25 272,908 42 43 41 43 44NC State Veterinary Med 6 165 28 9,062 55 55 89 90 90UNC-Chapel Hill 101 2,301 23 86,122 37 36 39 39 40UNC-Chapel Hill Hlth Aff. 65 985 15 41,775 42 42 41 42 41Subtotal 431 9,974 23 409,867 41 41 41 42 43
Doctoral Universities I and IIEast Carolina 148 3,772 25 145,096 38 38 38 38 38East Carolina Hlth Aff. 47 787 17 35,093 45 39 39 39 39NC A&T 84 2,127 25 83,374 39 37 40 40 41UNC Charlotte 159 4,014 25 178,002 44 41 40 40 43UNC Greensboro 69 2,090 30 100,601 48 46 48 48 48Subtotal 507 12,790 25 542,166 42 40 40 41 42
Master's (Comprehensive) Universities and Colleges IAppalachian 118 2,603 22 115,595 44 45 45 45 45Fayetteville 51 1,402 27 52,143 37 36 34 32 28NC Central 62 1,292 21 54,469 42 42 40 39 39UNC Pembroke 31 689 22 28,639 42 42 41 42 42UNC Wilmington 84 2,053 24 79,757 39 39 39 43 43Western Carolina 75 1,957 26 85,451 44 45 42 42 42Winston-Salem 65 1,552 24 54,020 35 35 35 35 35Subtotal 486 11,548 24 470,074 41 41 40 40 40
Baccalaureate (Liberal Arts) Universities and Colleges I and IIElizabeth City 66 1,482 22 56,942 38 38 39 39 37UNC Asheville 34 794 23 34,785 44 42 45 48 47Subtotal 100 2,276 23 91,727 40 40 41 42 41
Schools of Art, Music, and DesignUNC School of the Arts 67 1,616 24 83,575 52 50 50 50 50Subtotal 67 1,616 24 83,575 52 50 50 50 50
Community CollegesAlamance 55 1,331 24 59,301 45 45 45 45 45Asheville-Buncombe 106 2,874 27 137,138 48 49 48 48 50Beaufort Co. 32 1,268 40 50,380 40 38 42 42 46Bladen 23 522 23 27,416 53 57 57 58 58Blue Ridge 52 1,175 23 84,102 72 72 72 73 77Brunswick 18 406 23 22,567 56 56 56 54 54Caldwell 61 1,279 21 68,743 54 54 54 55 55Cape Fear 122 2,954 24 145,062 49 49 50 50 51Carteret 44 1,012 23 52,170 52 52 52 52 52Catawba Valley 90 1,883 21 94,078 50 50 50 51 52Central Carolina 110 2,512 23 104,379 42 41 41 42 41Central Piedmont 164 3,800 23 238,108 63 64 67 66 64Cleveland 70 1,555 22 58,436 38 38 37 39 39Coastal Carolina 58 1,493 26 66,922 45 46 46 46 46Coll. of Albemarle 68 1,267 19 77,825 61 55 54 49 48Craven 43 1,010 23 58,791 58 55 55 63 49Davidson County 59 1,574 27 61,709 39 39 39 40 41Durham 77 1,807 23 82,858 46 47 47 46 50Edgecombe 41 853 21 40,792 48 48 48 48 48Fayetteville 151 3,904 26 162,573 42 42 42 42 42Forsyth 115 2,514 22 151,477 60 63 55 55 55Gaston 70 1,892 27 82,139 43 43 43 43 43Guilford 169 3,730 22 183,727 49 49 50 53 54Halifax 29 598 21 36,689 61 61 61 60 60

105
Table 17. Assignable Area Per Student Station for Class Laboratories
Institution No. of Rooms
No.of StudentStations
Ave.Stu Sta
Per RoomTotal Assignable Sq.
Ft. Sq. Ft. Per Student Station2013 2012 2011 2010 2009
Haywood 70 1,302 19 75,407 58 59 67 66 57Isothermal 47 1,040 22 50,836 49 49 49 48 48James Sprunt 21 476 23 19,605 41 40 41 40 40Johnston 54 1,350 25 65,787 49 49 49 50 50Lenoir 64 1,596 25 70,317 44 47 48 43 42Martin 25 578 23 32,022 55 55 55 55 55Mayland 17 390 23 20,443 52 53 53 53 51McDowell 23 633 28 31,089 49 49 50 49 46Mitchell 41 978 24 45,012 46 46 46 44 44Montgomery 17 317 19 17,650 56 48 47 54 56Nash 35 774 22 38,785 50 50 49 49 49Pamlico 14 257 18 10,568 41 41 41 41 41Piedmont 28 772 28 29,971 39 39 39 41 41Pitt 95 1,670 18 113,136 68 67 50 50 50Randolph 53 1,249 24 77,256 62 64 63 60 62Richmond 33 731 22 34,101 47 50 49 49 48Roanoke-Chowan 19 468 25 22,972 49 49 49 45 45Robeson 44 1,095 25 52,301 48 48 43 42 43Rockingham 46 1,081 24 56,790 53 50 50 50 51Rowan-Cabarrus 70 1,570 22 86,360 55 55 53 52 55Sampson 26 585 23 34,582 59 59 59 59 57Sandhills 57 1,246 22 53,961 43 42 42 42 43South Piedmont 37 830 22 35,830 43 43 43 44 44Southeastern 33 888 27 33,354 38 38 38 39 37Southwestern 47 735 16 41,208 56 56 55 56 56Stanly 28 1,060 38 35,082 33 33 33 33 32Surry 47 1,127 24 68,046 60 51 48 48 48Tri-County 31 616 20 33,538 54 54 54 55 61Vance-Granville 61 1,673 27 65,047 39 43 41 41 40Wake 166 3,664 22 190,084 52 51 50 50 50Wayne 56 1,564 28 60,035 38 39 39 39 39Western Piedmont 52 1,120 22 55,208 49 50 52 52 49Wilkes 48 1,406 29 59,927 43 43 41 41 42Wilson 32 737 23 34,018 46 48 48 49 51Subtotal 3,364 78,791 23 3,897,710 49 50 49 49 49
Private InstitutionsNC Private Universities
Barton 20 475 24 17,122 36 36 36 36 36Campbell 35 1,323 38 37,244 28 31 31 31 31Mars Hill 28 742 27 28,705 39 41 41 41 41Pfeiffer 22 426 19 18,599 44 44 44 42 42Subtotal 105 2,966 28 101,670 34 37 37 37 37
Grand Total 5,060 119,961 24 5,596,789 47 47 46 46 46

This Page Intentionally Left Blank
106

Coastal Studies Institute, East Carolina University
Formed in 2003, the UNC Coastal Studies Institute is an inter-university partnership that offers applied, mission based research focusing specifically on coastal processes, estuarine ecology, and coastal sustainability for the maritime counties of North Carolina. A $32.6 million facility to house the Institute was dedicated and officially opened in January 2014. The 83,791 square-foot, environmentally sustainable facility on Roanoke Island was built over two years on land surrounded by approximately 240 acres of marsh. Wastewater is treated on-site and to a high standard that allows it be used to flush toilets in the buildings. Storm water is captured and used or treated and infiltrated completely on-site. Four 12,000-gallon underground cisterns collect rainwater from the research and education building to set the stage for future research efforts for the treatment of captured rainwater for potable water. The research building has 60,000 square feet of classroom, research and teaching laboratories, and an auditorium. The 15,000 square foot marine operations building houses equipment, vehicles and vessels used in the institute’s research operations. East Carolina University was responsible for design and construction oversight and will provide maintenance at the facility.
Building Characteristics
Ownership of Buildings . . . . . . . . . . . . . . . . . . . . . . . . . . . . 109 Capital Investment in Buildings . . . . . . . . . . . . . . . . . . . . . . 112 Age of Buildings . . . . . . . . . . . . . . . . . . . . . . . . . . . . . . . . . 116 Condition of Buildings. . . . . . . . . . . . . . . . . . . . . . . . . . . . . 120 Estimated Cost to Renovate and Replace Unsatisfactory Facilities . . . . . . . . . . . . . . . . . . . . . . . . . 125
107

This Page Intentionally Left Blank
108

TABLE 18:
OWNERSHIP OF BUILDINGS
Many campus buildings are not owned by the institutions which use them. This table
provides data on the ownership status of institutional facilities. The gross square footage of each
institution has been classified under eight ownership categories:
1 Owned in fee simple.
2 Title vested in the institution and being paid for on an amortization schedule, regardless
of whether the building is shared with another institution or organization.
3 Title vested in holding company or building corporation to which payments are being
made by the institution; title will ultimately pass to the institution (includes lease-
purchase arrangements).
4 Not owned by the institution, but leased or rented to the institution at a typical local rate.
5 Not owned by the institution, but made available to the institution either at no cost or at a
nominal rate.
6 Not owned by the institution, but shared with an educational organization that is not a
postsecondary institution.
7 Not owned by the institution, but shared with another postsecondary educational
institution.
8 Other (e.g., not owned by the institution, but shared with a noneducational institution).
Ownership for institutions of the University of North Carolina represents ownership by
the State of North Carolina. Ownership of community and technical colleges represents
ownership by local trustees and reflects expenditures primarily from local fund sources which
are supplemented by state and federal funds. Ownership of the private institutions resides with
the institution's trustees.
The sums of the percentages for each institution should in theory add to exactly 100.0,
but in some cases they do not because of rounding.
109

*Other is Category 6 ***Other is Category 8*Other is Category 6 ***Other is Category 8
Table 18. Ownership of Buildings
Institution1
Owned
2Institution
Amortization
3Holding Co.
Amortization4
Leased or Rented5
Nominal Rate OtherTotal Gross
Sq. Ft.GSF % GSF % GSF % GSF % GSF % GSF %
Public InstitutionsResearch Universities I
NC State *** 12,933,152 80.3 2,536,328 15.8 782 0.0 451,660 2.8 162,687 1.0 12,926 0.1 16,097,535NC State Veterinary Med 849,240 100.0 - - - - - - - - - - 849,240UNC-Chapel Hill *** 13,004,310 98.7 - - 68,760 0.5 79,568 0.6 - - 17,732 0.1 13,170,370UNC-Chapel Hill Health Aff.** 5,405,482 84.9 537,875 8.5 129,503 2.0 279,238 4.4 - - 13,158 0.2 6,365,256Subtotal 32,192,184 88.2 3,074,203 8.4 199,045 0.5 810,466 2.2 162,687 0.4 43,816 0.1 36,482,401
Doctoral Universities I and IIEast Carolina 4,729,862 96.4 - - - - 55,055 1.1 26,090 0.5 95,460 1.9 4,906,467East Carolina Hlth Aff. 1,428,272 91.8 - - - - 95,718 6.2 32,368 2.1 - - 1,556,358NC A&T 3,146,864 99.4 - - - - 18,940 0.6 - - - - 3,165,804UNC Charlotte 4,781,127 55.1 3,751,749 43.3 137,999 1.6 - - - - - - 8,670,875UNC-Greensboro** 5,686,095 93.9 - - 1,657 0.0 317,623 5.2 10,052 0.2 38,310 0.6 6,053,737Subtotal 19,772,220 81.2 3,751,749 15.4 139,656 0.6 487,336 2.0 68,510 0.3 133,770 0.5 24,353,241
Master's (Comprehensive) Universities and Colleges IAppalachian 3,201,823 65.4 1,686,763 34.5 - - 7,010 0.1 - - - - 4,895,596Fayetteville 1,204,832 83.2 243,574 16.8 - - - - - - - - 1,448,406NC Central 2,129,441 94.1 134,292 5.9 - - - - - - - - 2,263,733UNC Pembroke 1,326,190 85.5 - - 89,078 5.7 135,766 8.8 - - - - 1,551,034UNC Wilmington 2,731,031 71.5 325,288 8.5 738,804 19.3 23,456 0.6 - - - - 3,818,579Western Carolina 2,162,569 68.1 673,451 21.2 314,227 9.9 24,975 0.8 - - - - 3,175,222Winston-Salem 1,123,462 64.8 127,536 7.4 397,407 22.9 84,525 4.9 - - - - 1,732,930Subtotal 13,879,348 73.5 3,190,904 16.9 1,539,516 8.2 275,732 1.5 - - - - 18,885,500
Baccalaureate (Liberal Arts) Universities and Colleges I and IIElizabeth City 999,982 77.0 152,476 11.7 145,678 11.2 - - - - - - 1,298,136UNC Asheville 1,119,008 73.5 404,349 26.5 - - - - - - - - 1,523,357Subtotal 2,118,990 75.1 556,825 19.7 145,678 5.2 - - - - - - 2,821,493
Schools of Art, Music, and DesignUNC School of the Arts 837,124 79.5 102,782 9.8 80,440 7.6 5,260 0.5 27,053 2.6 - - 1,052,659Subtotal 837,124 79.5 102,782 9.8 80,440 7.6 5,260 0.5 27,053 2.6 - - 1,052,659
Teaching HospitalsUNC Hospitals** 2,434,713 97.4 - - - - 57,815 2.3 - - 6,721 0.3 2,499,249Subtotal 2,434,713 97.4 - - - - 57,815 2.3 - - 6,721 0.3 2,499,249
Community CollegesAlamance 348,064 88.4 - - - - 45,648 11.6 - - - - 393,712Asheville-Buncombe 876,841 98.0 - - - - - - 18,000 2.0 - - 894,841Beaufort Co. 270,733 100.0 - - - - - - - - - - 270,733Bladen 145,808 96.6 - - - - 5,112 3.4 - - - - 150,920Blue Ridge 401,360 100.0 - - - - - - - - - - 401,360Brunswick 389,291 100.0 - - - - - - - - - - 389,291Caldwell 490,265 100.0 - - - - - - - - - - 490,265Cape Fear 1,570,195 97.2 - - - - 9,511 0.6 36,529 2.3 - - 1,616,235Carteret** 217,402 91.9 - - - - 8,078 3.4 - - 11,150 4.7 236,630Catawba Valley 482,712 85.3 63,788 11.3 - - - - 19,625 3.5 - - 566,125Central Carolina 455,332 77.7 - - - - 8,232 1.4 122,090 20.8 - - 585,654Central Piedmont 3,073,759 97.2 - - - - 90,133 2.8 - - - - 3,163,892Cleveland 293,295 97.4 - - - - - - 7,813 2.6 - - 301,108Coastal Carolina 331,906 100.0 - - - - - - - - - - 331,906Coll. of Albemarle 336,377 83.2 - - - - 4,440 1.1 63,271 15.7 - - 404,088Craven 312,947 99.3 - - - - - - 2,060 0.7 - - 315,007Davidson County 450,126 98.8 - - - - 5,329 1.2 - - - - 455,455Durham 493,195 96.6 - - - - 17,542 3.4 - - - - 510,737Edgecombe 242,914 98.8 - - - - 2,964 1.2 - - - - 245,878
**Other is Category 7
110

*Other is Category 6 **Other is Category 7 ***Other is Category 8
Table 18. Ownership of Buildings
Institution1
Owned
2Institution
Amortization
3Holding Co.
Amortization4
Leased or Rented5
Nominal Rate OtherTotal Gross
Sq. Ft.GSF % GSF % GSF % GSF % GSF % GSF %
Fayetteville* 903,797 96.6 - - - - - - 5,690 0.6 26,402 2.8 935,889Forsyth 905,748 93.9 - - - - 5,844 0.6 52,908 5.5 - - 964,500Gaston 646,608 90.5 - - - - 67,959 9.5 - - - - 714,567Guilford 1,424,945 95.4 - - - - 67,389 4.5 - - 1,057 0.1 1,493,391Halifax 268,984 97.7 - - - - 6,337 2.3 - - - - 275,321Haywood 355,826 100.0 - - - - - - - - - - 355,826Isothermal 301,583 84.7 - - - - 54,422 15.3 - - - - 356,005James Sprunt 158,986 95.4 - - - - - - 7,664 4.6 - - 166,650Johnston 391,381 83.3 - - - - 31,764 6.8 46,901 10.0 - - 470,046Lenoir 412,309 95.8 - - - - 5,940 1.4 12,000 2.8 - - 430,249Martin 229,431 100.0 - - - - - - - - - - 229,431Mayland 159,916 100.0 - - - - - - - - - - 159,916McDowell 159,319 100.0 - - - - - - - - - - 159,319Mitchell 362,262 90.4 - - - - 8,320 2.1 29,947 7.5 - - 400,529Montgomery 129,642 100.0 - - - - - - - - - - 129,642Nash 262,731 100.0 - - - - - - - - - - 262,731Pamlico 86,035 100.0 - - - - - - - - - - 86,035Piedmont 182,713 100.0 - - - - - - - - - - 182,713Pitt 582,222 100.0 - - - - - - - - - - 582,222Randolph 385,347 98.1 - - - - 7,275 1.9 - - - - 392,622Richmond 253,209 100.0 - - - - - - - - - - 253,209Roanoke-Chowan 159,042 95.0 - - 8,379 5.0 - - - - - - 167,421Robeson 265,260 94.9 - - - - - - 14,400 5.1 - - 279,660Rockingham 327,731 100.0 - - - - - - - - - - 327,731Rowan-Cabarrus 399,126 76.9 62,333 12.0 - - 19,525 3.8 37,880 7.3 - - 518,864Sampson 199,414 100.0 - - - - - - - - - - 199,414Sandhills 486,971 98.3 - - - - 8,662 1.7 - - - - 495,633South Piedmont 404,118 99.9 - - - - - - 440 0.1 - - 404,558Southeastern 247,000 100.0 - - - - - - - - - - 247,000Southwestern 290,748 98.6 - - - - - - 4,054 1.4 - - 294,802Stanly 190,474 91.3 - - - - 13,582 6.5 - - 4,600 2.2 208,656Surry 386,062 86.6 - - - - - - 59,593 13.4 - - 445,655Tri-County 138,389 89.9 - - - - - - 15,500 10.1 - - 153,889Vance-Granville 397,903 98.0 - - - - 8,306 2.0 - - - - 406,209Wake 1,588,634 93.2 - - - - 82,867 4.9 32,150 1.9 - - 1,703,651Wayne 390,816 97.0 - - - - - - 12,146 3.0 - - 402,962Western Piedmont 306,530 76.8 - - - - - - 92,382 23.2 - - 398,912Wilkes 395,843 96.4 - - - - 14,737 3.6 - - - - 410,580Wilson 206,079 98.5 - - - - - - 3,240 1.5 - - 209,319Subtotal 26,525,656 94.7 126,121 0.5 8,379 0.0 599,918 2.1 696,283 2.5 43,209 0.2 27,999,566
Private InstitutionsNC Private Universities
Barton 495,166 100.0 - - - - - - - - - - 495,166Campbell 1,649,014 100.0 - - - - - - - - - - 1,649,014Mars Hill 791,814 98.4 - - - - 13,000 1.6 - - - - 804,814Pfeiffer 450,139 80.6 108,010 19.4 - - - - - - - - 558,149Subtotal 3,386,133 96.5 108,010 3.1 - - 13,000 0.4 - - - - 3,507,143
Grand Total 101,146,368 86.0 10,910,594 9.3 2,112,714 1.8 2,249,527 1.9 954,533 0.8 227,516 0.2 117,601,252
111

TABLES 19 & 20:
CAPITAL INVESTMENT IN BUILDINGS
Building cost, as used here, refers to the institution's initial capital investment in a
building. For a facility which is built by the institution, the building cost is the cost of
construction of the structure and its fixed equipment. For buildings which are purchased,
the acquisition cost is applicable.
The replacement value of a building, on the other hand, represents the estimated
cost of constructing a new facility containing an equal amount of space which is designed
for the same use as the original building and which meets all of the current commonly-
accepted standards of construction. For institutional buildings which were in existence
prior to 1972, the replacement value was first estimated using 1972 construction cost
data. Since then, it has been increased each year using factors obtained annually from
construction cost publications. For buildings constructed since 1972, the building cost is
the base upon which these replacement value factors are applied.
From 1972-83, the replacement value factors were derived from building cost data
reported for the Atlanta region in the Engineering News Record. From 1984-1987, the
Dodge Building Cost Indexes for U. S. and Canadian Cities, published by McGraw-Hill
Cost Information Systems, was used to determine the replacement value factors. Since
1987, due to a lapse in the publishing of the Dodge publication, the R. S. Means
Construction Cost Indexes report, which follows a calculation methodology similar to the
Dodge report, has been used to construct this index. Factors calculated from the Means
publication are derived by computing an average of the construction cost increases for
Asheville, Charlotte, Durham, Fayetteville, Greensboro, Raleigh, Wilmington, and
Winston-Salem. The following are the factors which have been used to increase the
estimated replacement values each year. The construction cost factor reported by R.S.
Means reflected a negative multiplier for the 2009 building replacement costs. This
decrease in building values was a reflection of the devaluation of property both nationally
and across North Carolina during the economic downturn. Property values have
recovered, and this continued upward trend is reflected in the 2013 factor applied to the
estimated replacement values for the current year.
Annual Annual Annual
Year Increase Year Increase Year Increase
1996 2.1% 2002 2.0% 2008 7.6%
1997 1.8% 2003 1.2% 2009 -3.7%
1998 1.2% 2004 12.6% 2010 0.8%
1999 2.4% 2005 9.8% 2011 5.9%
2000 1.6% 2006 9.2% 2012 5.5%
2001 2.8% 2007 2.6% 2013 4.2%
112

RELATIVE INCREASES IN CONSTRUCTION COSTS
Because building cost represents an institution's capital investment in a facility, only
buildings which are owned by the institution (i.e., those falling under ownership
categories 1-3 on page 109) are included in calculating total cost. Replacement value, on
the other hand, is a reflection of all buildings on an institution's campus, regardless of
their ownership status.
The data are categorized as non-residential (Table 19) and residential (Table 20).
Buildings with twenty percent or more of their space in each category are considered
combination buildings and appear in both tables. The tables accurately reflect the
number of buildings with non-residential space and the number with residential space,
but the sum will exceed the total number of buildings on the campuses which have
combination buildings. Other data are distributed between the two tables on the basis of
the ratio of the assignable square feet in the category to the total assignable square feet in
the building. Thus, campus totals may be determined accurately by summing the
appropriate data in the two tables, with the exception noted.
113

114
Table 19 & 20. Capital Investment
Institution Non-Residential Buildings Residential Buildings
No. of Bldg Building CostReplacement
ValueGross Sq. Ft.
on Campus No. of Bldg Building CostReplacement
ValueGross Sq. Ft.
on CampusPublic Institutions
Research Universities INC State 1,016 $960,318,761 $3,763,782,919 13,386,919 122 $140,592,638 $521,322,938 2,710,616NC State Veterinary Med 39 $105,227,698 $286,006,834 849,240 - - - -UNC-Chapel Hill 283 $1,270,373,389 $2,846,526,464 9,829,381 91 $187,716,351 $543,955,221 3,340,989UNC-Chapel Hill Hlth Aff. 105 $658,930,266 $1,629,364,989 6,364,908 1 $8,820 $44,794 348Subtotal 1,443 $2,994,850,114 $8,525,681,206 30,430,448 214 $328,317,809 $1,065,322,953 6,051,953
Doctoral Universities I and IIEast Carolina 135 $266,072,888 $1,052,915,342 3,732,819 18 $45,170,000 $217,512,087 1,173,648East Carolina Hlth Aff. 52 $243,683,573 $466,940,173 1,556,358 - - - -NC A&T 103 $195,667,383 $691,262,646 2,575,305 15 $29,214,424 $128,494,488 590,499UNC Charlotte 75 $696,729,370 $1,290,176,808 6,892,810 33 $177,116,096 $305,148,648 1,778,065UNC Greensboro 95 $276,435,555 $1,532,283,097 4,250,236 28 $73,425,447 $637,169,026 1,803,501Subtotal 460 $1,678,588,769 $5,033,578,066 19,007,528 94 $324,925,967 $1,288,324,249 5,345,713
Master's (Comprehensive) Universities and Colleges IAppalachian 72 $389,704,135 $850,229,800 3,535,493 22 $69,745,565 $209,903,268 1,360,103Fayetteville 43 $103,830,416 $226,302,006 1,096,362 9 $27,407,381 $56,398,913 352,044NC Central 51 $174,078,332 $556,113,743 1,555,538 14 $60,025,638 $187,177,235 708,195UNC Pembroke 35 $118,490,089 $267,124,707 1,004,395 14 $40,518,198 $98,656,781 546,639UNC Wilmington 99 $305,194,869 $546,997,361 2,525,123 54 $141,227,668 $228,377,318 1,293,456Western Carolina 69 $167,734,849 $417,238,505 2,085,462 37 $93,860,515 $197,647,411 1,089,760Winston-Salem 35 $72,347,461 $213,633,688 1,068,638 14 $56,692,052 $108,361,903 664,292Subtotal 404 $1,331,380,151 $3,077,639,810 12,871,011 164 $489,477,017 $1,086,522,829 6,014,489
Baccalaureate (Liberal Arts) Universities and Colleges I and IIElizabeth City 35 $85,994,915 $219,353,282 817,051 24 $22,972,690 $65,300,304 481,085UNC Asheville 26 $128,911,580 $312,290,687 1,103,941 13 $50,092,427 $112,747,503 419,416Subtotal 61 $214,906,495 $531,643,969 1,920,992 37 $73,065,117 $178,047,807 900,501
Schools of Art, Music, and DesignUNC School of the Arts 49 $64,021,390 $187,906,200 834,053 18 $10,893,157 $30,357,745 218,606Subtotal 49 $64,021,390 $187,906,200 834,053 18 $10,893,157 $30,357,745 218,606
Teaching HospitalsUNC Hospitals 30 $456,844,106 $881,113,088 2,499,249 - - - -Subtotal 30 $456,844,106 $881,113,088 2,499,249 - - - -
Community CollegesAlamance 15 $28,900,315 $156,779,713 393,712 - - - -Asheville-Buncombe 24 $119,206,462 $211,184,877 894,841 - - - -Beaufort Co. 17 $22,638,835 $44,557,452 270,733 - - - -Bladen 24 $8,626,162 $23,282,792 150,920 - - - -Blue Ridge 15 $35,342,638 $68,889,641 401,360 - - - -Brunswick 19 $43,507,286 $71,138,693 389,291 - - - -Caldwell 22 $43,597,730 $92,981,975 490,265 - - - -Cape Fear 36 $179,428,322 $274,372,800 1,610,450 2 $474,800 $8,994,542 5,785Carteret 17 $17,478,813 $44,880,474 236,630 - - - -Catawba Valley 17 $33,898,394 $82,530,087 566,125 - - - -Central Carolina 37 $39,674,645 $100,580,310 585,654 - - - -Central Piedmont 51 $296,199,890 $560,852,430 3,163,892 - - - -Cleveland 14 $22,983,131 $68,861,998 301,108 - - - -Coastal Carolina 15 $25,802,443 $62,609,429 331,906 - - - -Coll. of Albemarle 25 $28,161,752 $150,860,844 404,088 - - - -Craven 15 $31,819,139 $61,788,392 315,007 - - - -Davidson County 29 $27,794,875 $87,741,208 455,455 - - - -Durham 18 $34,355,718 $92,271,468 510,737 - - - -Edgecombe 12 $19,385,035 $43,972,586 245,878 - - - -Fayetteville 38 $62,274,428 $141,532,736 935,889 - - - -Forsyth 36 $83,290,943 $164,180,886 964,500 - - - -
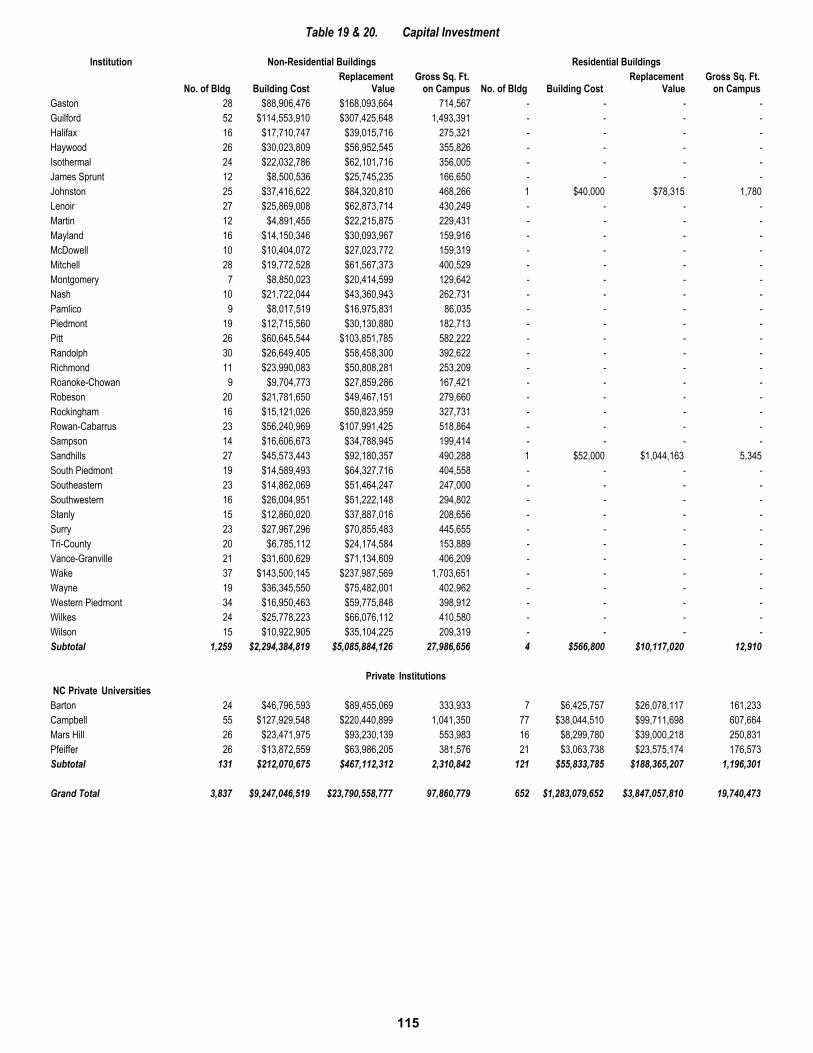
115
Table 19 & 20. Capital Investment
Institution Non-Residential Buildings Residential Buildings
No. of Bldg Building CostReplacement
ValueGross Sq. Ft.
on Campus No. of Bldg Building CostReplacement
ValueGross Sq. Ft.
on CampusGaston 28 $88,906,476 $168,093,664 714,567 - - - -Guilford 52 $114,553,910 $307,425,648 1,493,391 - - - -Halifax 16 $17,710,747 $39,015,716 275,321 - - - -Haywood 26 $30,023,809 $56,952,545 355,826 - - - -Isothermal 24 $22,032,786 $62,101,716 356,005 - - - -James Sprunt 12 $8,500,536 $25,745,235 166,650 - - - -Johnston 25 $37,416,622 $84,320,810 468,266 1 $40,000 $78,315 1,780Lenoir 27 $25,869,008 $62,873,714 430,249 - - - -Martin 12 $4,891,455 $22,215,875 229,431 - - - -Mayland 16 $14,150,346 $30,093,967 159,916 - - - -McDowell 10 $10,404,072 $27,023,772 159,319 - - - -Mitchell 28 $19,772,528 $61,567,373 400,529 - - - -Montgomery 7 $8,850,023 $20,414,599 129,642 - - - -Nash 10 $21,722,044 $43,360,943 262,731 - - - -Pamlico 9 $8,017,519 $16,975,831 86,035 - - - -Piedmont 19 $12,715,560 $30,130,880 182,713 - - - -Pitt 26 $60,645,544 $103,851,785 582,222 - - - -Randolph 30 $26,649,405 $58,458,300 392,622 - - - -Richmond 11 $23,990,083 $50,808,281 253,209 - - - -Roanoke-Chowan 9 $9,704,773 $27,859,286 167,421 - - - -Robeson 20 $21,781,650 $49,467,151 279,660 - - - -Rockingham 16 $15,121,026 $50,823,959 327,731 - - - -Rowan-Cabarrus 23 $56,240,969 $107,991,425 518,864 - - - -Sampson 14 $16,606,673 $34,788,945 199,414 - - - -Sandhills 27 $45,573,443 $92,180,357 490,288 1 $52,000 $1,044,163 5,345South Piedmont 19 $14,589,493 $64,327,716 404,558 - - - -Southeastern 23 $14,862,069 $51,464,247 247,000 - - - -Southwestern 16 $26,004,951 $51,222,148 294,802 - - - -Stanly 15 $12,860,020 $37,887,016 208,656 - - - -Surry 23 $27,967,296 $70,855,483 445,655 - - - -Tri-County 20 $6,785,112 $24,174,584 153,889 - - - -Vance-Granville 21 $31,600,629 $71,134,609 406,209 - - - -Wake 37 $143,500,145 $237,987,569 1,703,651 - - - -Wayne 19 $36,345,550 $75,482,001 402,962 - - - -Western Piedmont 34 $16,950,463 $59,775,848 398,912 - - - -Wilkes 24 $25,778,223 $66,076,112 410,580 - - - -Wilson 15 $10,922,905 $35,104,225 209,319 - - - -Subtotal 1,259 $2,294,384,819 $5,085,884,126 27,986,656 4 $566,800 $10,117,020 12,910
Private InstitutionsNC Private Universities
Barton 24 $46,796,593 $89,455,069 333,933 7 $6,425,757 $26,078,117 161,233Campbell 55 $127,929,548 $220,440,899 1,041,350 77 $38,044,510 $99,711,698 607,664Mars Hill 26 $23,471,975 $93,230,139 553,983 16 $8,299,780 $39,000,218 250,831Pfeiffer 26 $13,872,559 $63,986,205 381,576 21 $3,063,738 $23,575,174 176,573Subtotal 131 $212,070,675 $467,112,312 2,310,842 121 $55,833,785 $188,365,207 1,196,301
Grand Total 3,837 $9,247,046,519 $23,790,558,777 97,860,779 652 $1,283,079,652 $3,847,057,810 19,740,473

TABLE 21:
AGE OF BUILDINGS
This table reports the total gross square footage of North Carolina colleges and universities by year of construction categories. For purposes of this study, the year of construction is defined as the year that the building was completed regardless of any later year of occupancy.
Although this table gives some indication of how new an institution's facilities are, it does not take into account renovations. The data in this table should, therefore, be considered in conjunction with Table 22 (Condition of Buildings) and Table 23 (Estimated Cost to Renovate or Replace Unsatisfactory Facilities).
116

Percentage Distribution of Gross Areaby Age of Buildings
Pre-1900 1900-1929 1930-1949 1950-19691970-1989 1990-1999 2000+
3,364
9,475
5,059
9,321
28,000
4,420
4,143
17,719
19,327
10,352
29,884
86,095
1,286
3,507
1000s ofSquare Feet
0
10,000
20,000
30,000
40,000
50,000
60,000
70,000
80,000
NC CC UNC Campuses NC Prvt
Pre-1900 1900-1929 1930-1949 1950-19691970-1989 1990-1999 2000+
1.64%
12.01%
33.84%
18.07%
33.29%
5.13%
4.81%
20.58%
22.45%
12.02%
34.71%
6.88%
10.16%
36.66%
17.07%
8.80%
20.34%
0
10
20
30
40
50
60
70
80
90
100
NC CC UNC Campuses NC Prvt
117

118
Table 21. Age of Buildings
Institution Period of ConstructionTotal GrossSquare Feet
Pre-1900GSF
1900-1929GSF
1930-1949GSF
1950-1969GSF
1970-1989GSF
1990-1999GSF
2000-PresentGSF
Public InstitutionsResearch Universities I
NC State 16,097,535 77,273 987,990 1,360,205 3,844,226 3,172,467 2,185,425 4,469,949NC State Veterinary Med 849,240 - - 30,615 19,706 375,514 11,659 411,746UNC-Chapel Hill 13,170,370 135,326 1,346,694 901,210 2,640,112 2,209,497 1,255,394 4,682,137UNC-Chapel Hill Hlth Aff. 6,365,256 - - 130,462 932,475 1,701,026 1,216,330 2,384,963Subtotal 36,482,401 212,599 2,334,684 2,422,492 7,436,519 7,458,504 4,668,808 11,948,795
Doctoral Universities I and IIEast Carolina 4,906,467 - 640,360 206,354 2,136,412 940,865 279,964 702,512East Carolina Hlth Aff. 1,556,358 - - - 40,253 608,660 193,141 714,304NC A&T 3,165,804 - 83,209 215,322 971,367 724,072 218,657 953,177UNC Charlotte 8,670,875 - - - 495,060 2,005,462 1,478,198 4,692,155UNC Greensboro 6,053,737 35,417 850,650 262,858 1,124,950 1,121,144 942,233 1,716,485Subtotal 24,353,241 35,417 1,574,219 684,534 4,768,042 5,400,203 3,112,193 8,778,633
Master's (Comprehensive) Universities and Colleges IAppalachian 4,895,596 - 7,010 241,743 1,356,283 1,030,037 499,186 1,761,337Fayetteville 1,448,406 - 23,364 129,538 307,764 426,887 235,374 325,479NC Central 2,263,733 - 39,725 210,554 666,161 507,939 174,070 665,284UNC Pembroke 1,551,034 - - - 399,815 436,020 59,142 656,057UNC Wilmington 3,818,579 - 33,652 - 247,536 1,283,894 254,483 1,999,014Western Carolina 3,175,222 2,563 56,107 196,152 885,958 1,030,404 2,046 1,001,992Winston-Salem 1,732,930 - 71,407 56,786 311,767 402,231 310,091 580,648Subtotal 18,885,500 2,563 231,265 834,773 4,175,284 5,117,412 1,534,392 6,989,811
Baccalaureate (Liberal Arts) Universities and Colleges I and IIElizabeth City 1,298,136 - 92,594 57,955 255,429 336,100 108,377 447,681UNC Asheville 1,523,357 - - - 266,193 288,793 415,944 552,427Subtotal 2,821,493 - 92,594 57,955 521,622 624,893 524,321 1,000,108
Schools of Art, Music, and DesignUNC School of the Arts 1,052,659 - 186,850 91,608 247,393 196,426 98,095 232,287Subtotal 1,052,659 - 186,850 91,608 247,393 196,426 98,095 232,287
Teaching HospitalsUNC Hospitals 2,499,249 - - 51,256 569,995 529,579 414,366 934,053Subtotal 2,499,249 - - 51,256 569,995 529,579 414,366 934,053
Community CollegesAlamance 393,712 - - - - 192,616 51,209 149,887Asheville-Buncombe 894,841 10,161 3,785 - 208,158 270,790 148,395 253,552Beaufort Co. 270,733 - - - - 128,628 49,928 92,177Bladen 150,920 - - 2,520 - 100,175 23,114 25,111Blue Ridge 401,360 - - - - 146,613 132,770 121,977Brunswick 389,291 - - 3,732 22,989 139,256 120,851 102,463Caldwell 490,265 - - - 83,274 168,683 125,316 112,992Cape Fear 1,616,235 - - - 61,015 207,553 214,475 1,133,192Carteret 236,630 - 2,747 - 11,297 73,956 42,339 106,291Catawba Valley 566,125 - - - 92,330 247,099 63,788 162,908Central Carolina 585,654 - 23,866 30,035 64,027 108,306 147,387 212,033Central Piedmont 3,163,892 - 105,483 32,313 218,838 838,648 598,736 1,369,874Cleveland 301,108 - - - - 190,666 45,260 65,182Coastal Carolina 331,906 - - - - 216,362 60,664 54,880Coll. of Albemarle 404,088 - - 5,268 81,790 178,389 21,800 116,841Craven 315,007 - - - - 117,255 76,480 121,272Davidson County 455,455 - - 3,286 122,284 132,048 129,771 68,066Durham 510,737 - - - 163,189 140,578 89,912 117,058Edgecombe 245,878 - 20,173 - - 119,135 28,420 78,150Fayetteville 935,889 - - 3,905 202,223 224,864 245,829 259,068Forsyth 964,500 - - - 193,801 245,100 217,139 308,460

119
Table 21. Age of Buildings
Institution Period of ConstructionTotal GrossSquare Feet
Pre-1900GSF
1900-1929GSF
1930-1949GSF
1950-1969GSF
1970-1989GSF
1990-1999GSF
2000-PresentGSF
Gaston 714,567 - 63,927 64,000 153,100 140,357 79,354 213,829Guilford 1,493,391 1,931 - 11,050 125,597 362,219 326,443 666,151Halifax 275,321 - - - - 110,345 72,533 92,443Haywood 355,826 - - - 11,300 184,394 80,037 80,095Isothermal 356,005 - 3,119 - 57,962 164,503 61,000 69,421James Sprunt 166,650 - 2,064 - 23,645 92,941 28,000 20,000Johnston 470,046 - - - 4,948 220,976 91,949 152,173Lenoir 430,249 - 5,940 - 132,719 154,795 83,666 53,129Martin 229,431 - - - - 163,591 65,840 -Mayland 159,916 - - - - 79,739 48,355 31,822McDowell 159,319 - - - 30,104 78,131 18,950 32,134Mitchell 400,529 28,793 91,303 36,915 58,766 80,908 - 103,844Montgomery 129,642 - - - 600 73,986 48,678 6,378Nash 262,731 - - - - 159,068 57,099 46,564Pamlico 86,035 - - - - 40,957 8,932 36,146Piedmont 182,713 - - - - 134,984 8,705 39,024Pitt 582,222 - - - 75,365 93,027 114,221 299,609Randolph 392,622 - - - 43,991 188,850 52,683 107,098Richmond 253,209 - - 9,000 56,560 94,049 38,500 55,100Roanoke-Chowan 167,421 - - - 8,379 114,542 13,000 31,500Robeson 279,660 - - - - 184,284 19,795 75,581Rockingham 327,731 - - - 148,238 120,791 42,510 16,192Rowan-Cabarrus 518,864 - - - 136,987 84,305 144,848 152,724Sampson 199,414 - - - 4,109 115,265 36,689 43,351Sandhills 495,633 - - - 122,021 143,522 68,051 162,039South Piedmont 404,558 - 117,000 - - 125,586 81,512 80,460Southeastern 247,000 - - - 82,095 80,495 38,361 46,049Southwestern 294,802 - - - - 198,500 30,640 65,662Stanly 208,656 - 4,600 - 21,381 94,681 46,016 41,978Surry 445,655 - - - 88,195 169,885 67,162 120,413Tri-County 153,889 - - 25,130 11,758 96,669 15,600 4,732Vance-Granville 406,209 - 16,000 - 3,069 235,030 59,403 92,707Wake 1,703,651 - - - 92,808 337,280 233,204 1,040,359Wayne 402,962 - - - - 192,606 145,037 65,319Western Piedmont 398,912 - - 52,182 140,716 122,397 39,030 44,587Wilkes 410,580 - - - 113,335 168,997 49,303 78,945Wilson 209,319 - - - 90,580 86,103 10,170 22,466Subtotal 27,999,566 40,885 460,007 279,336 3,363,543 9,475,478 5,058,859 9,321,458
Private InstitutionsNC Private Universities
Barton 495,166 - 6,000 21,508 325,969 41,564 28,669 71,456Campbell 1,649,014 - 118,919 44,966 435,406 354,796 204,426 490,501Mars Hill 804,814 3,000 115,161 119,975 243,184 156,172 73,962 93,360Pfeiffer 558,149 - 1,288 170,004 281,148 46,152 1,426 58,131Subtotal 3,507,143 3,000 241,368 356,453 1,285,707 598,684 308,483 713,448
Grand Total 117,601,252 294,464 5,120,987 4,778,407 22,368,105 29,401,179 15,719,517 39,918,593

TABLE 22:
CONDITION OF BUILDINGS
The physical condition of campus buildings has been a matter of increasing concern to
college and university administrators. As institutional budgets tightened during the 1970s,
several institutions attempted to economize by deferring the maintenance of facilities. Many
institutions continued this policy through the 1980s and 1990s. As a result, some colleges and
universities now have buildings which are in such poor condition that they can no longer
satisfactorily support the programs for which they were intended. Increasing costs of new
construction have made proper maintenance of campus physical plants even more important.
The data in Table 22 are based on the assessment of building conditions by the facilities
project officers at the institutions. Although few of them are architects or engineers, they
generally have (or have access to) sufficient information about the condition of their institutions'
facilities to be able to accurately assign a condition code to each campus building. In those cases
where campus project officers do not have this information, they are encouraged to consult
qualified physical plant personnel each year for assignment of a condition code. These codes are
defined on the following page.
FCAP: Facilities Maintenance and Repair Needs
The Facilities Condition Assessment Program (FCAP), a recurring baseline study of
condition of facilities over 3,000 GSF for the institutions of the University of North Carolina and
the N.C. Community College System, provides a precise dollar assessment of deferred
maintenance and repairs for buildings and other assets. This study is conducted by the State
Construction Office, a division of the North Carolina Department of Administration, on a three-
year cycle for the UNC institutions. Figures are generated for both appropriated (fund) and non-
appropriated facilities. Table 22a presents the FCAP dollar deficiency data as of the completion
of the 2013 FCAP cycle (March, 2014), for the sixteen UNC institutions. These costs reflect
funds required to restore facilities to their original functionality and performance level. The
FCAP methodology is not intended to quantify needed or desired improvements that go
beyond the original design functionality. For example, if the air-conditioning system in a
given facility is not performing adequately because of a faulty chiller, the cost of required repairs
would be reflected in FCAP. However, if the building lacked air-conditioning altogether when
originally built, despite the need for it in order to meet contemporary standards for classroom
instruction, the cost of retrofitting air-conditioning would not be reflected in FCAP, because it
was not called for in the original design. FCAP was not intended to identify deficiencies related
to current standards of quality or suitability of space for current program purposes.
120

BUILDING CONDITION CODES
(Building Inventory File)
1. Definition. The physical status and quality of the building at the time of the inventory,
based on the best judgment of those responsible for campus development.
2. Description. This building characteristic has the following categories:
1 - Satisfactory
Suitable for continued use with normal maintenance.
2 - Remodeling A
Requires restoration to present acceptable standards without major room use
changes, alterations, or modernizations. The approximate cost of "Remodeling A"
is not greater than 25% of the estimated replacement cost of the building.
3 - Remodeling B
Requires major updating and/or modernization of the building. The approximate
cost of "Remodeling B" is greater than 25%, but not greater than 50% of the
estimated replacement cost of the building.
4 - Remodeling C
Requires major remodeling of the building. The approximate cost of
"Remodeling C" is greater than 50% of the replacement cost of the building.
5 - Demolition
Should be demolished or abandoned because the building is unsafe or structurally
unsound, irrespective of the need for the space or the availability of funds for a
replacement. This category takes precedence over categories 1-4. If a building is
scheduled for demolition, its condition code is recorded as "5-Demolition,"
regardless of its condition.
6 - Termination
Planned termination or relinquishment of occupancy of the building for reasons
other than unsafeness or structural unsoundness, such as abandonment of
temporary units or vacating of leased space. This category takes precedence over
categories 1-4. If a building is scheduled for termination, its condition code is
recorded as "6-Termination," regardless of its condition.
121

122
Table 22. Condition of Buildings: Gross Square Footage
Institution Satisfactory Remodeling A Remodeling B Remodeling C Demolition Termination Total GrossGSF % GSF % GSF % GSF % GSF % GSF % Sq. Ft.
Public InstitutionsResearch Universities I
NC State 8,679,753 53.9 3,946,360 24.5 2,108,794 13.1 1,344,475 8.4 18,153 0.1 - - 16,097,535NC State Veterinary Med 787,173 92.7 39,965 4.7 18,684 2.2 3,418 0.4 - - - - 849,240UNC-Chapel Hill 10,094,081 76.6 2,169,505 16.5 687,767 5.2 120,949 0.9 98,068 0.7 - - 13,170,370UNC-Chapel Hill Hlth Aff. 5,577,431 87.6 540,848 8.5 236,810 3.7 - - 8,928 0.1 1,239 0.0 6,365,256Subtotal 25,138,438 68.9 6,696,678 18.4 3,052,055 8.4 1,468,842 4.0 125,149 0.3 1,239 0.0 36,482,401
Doctoral Universities I and IIEast Carolina 1,425,217 29.0 962,847 19.6 492,209 10.0 2,026,047 41.3 - - 147 0.0 4,906,467East Carolina Hlth Aff. 1,009,283 64.8 32,015 2.1 493,410 31.7 8,806 0.6 - - 12,844 0.8 1,556,358NC A&T 1,594,471 50.4 130,194 4.1 431,351 13.6 1,009,788 31.9 - - - - 3,165,804UNC Charlotte 7,178,731 82.8 693,068 8.0 688,237 7.9 110,839 1.3 - - - - 8,670,875UNC Greensboro 4,299,818 71.0 1,076,666 17.8 363,376 6.0 312,781 5.2 1,096 0.0 - - 6,053,737Subtotal 15,507,520 63.7 2,894,790 11.9 2,468,583 10.1 3,468,261 14.2 1,096 0.0 12,991 0.1 24,353,241
Master's (Comprehensive) Universities and Colleges IAppalachian 4,461,405 91.1 260,551 5.3 133,000 2.7 40,640 0.8 - - - - 4,895,596Fayetteville 1,323,961 91.4 88,958 6.1 35,487 2.5 - - - - - - 1,448,406NC Central 1,924,111 85.0 130,106 5.7 121,789 5.4 81,348 3.6 6,379 0.3 - - 2,263,733UNC Pembroke 1,508,054 97.2 42,980 2.8 - - - - - - - - 1,551,034UNC Wilmington 3,783,432 99.1 5,066 0.1 - - 30,081 0.8 - - - - 3,818,579Western Carolina 1,981,700 62.4 1,021,286 32.2 137,422 4.3 34,814 1.1 - - - - 3,175,222Winston-Salem 984,144 56.8 517,090 29.8 122,057 7.0 75,516 4.4 34,123 2.0 - - 1,732,930Subtotal 15,966,807 84.5 2,066,037 10.9 549,755 2.9 262,399 1.4 40,502 0.2 - - 18,885,500
Baccalaureate (Liberal Arts) Universities and Colleges I and IIElizabeth City 861,398 66.4 333,221 25.7 85,417 6.6 18,100 1.4 - - - - 1,298,136UNC Asheville 909,453 59.7 379,516 24.9 10,715 0.7 223,673 14.7 - - - - 1,523,357Subtotal 1,770,851 62.8 712,737 25.3 96,132 3.4 241,773 8.6 - - - - 2,821,493
Schools of Art, Music, and DesignUNC School of the Arts 734,565 69.8 218,874 20.8 55,219 5.2 42,817 4.1 1,184 0.1 - - 1,052,659Subtotal 734,565 69.8 218,874 20.8 55,219 5.2 42,817 4.1 1,184 0.1 - - 1,052,659
Teaching HospitalsUNC Hospitals 2,499,249 100.0 - - - - - - - - - - 2,499,249Subtotal 2,499,249 100.0 - - - - - - - - - - 2,499,249
Community CollegesAlamance 393,712 100.0 - - - - - - - - - - 393,712Asheville-Buncombe 747,566 83.5 147,275 16.5 - - - - - - - - 894,841Beaufort Co. 270,733 100.0 - - - - - - - - - - 270,733Bladen 147,980 98.1 420 0.3 - - 2,520 1.7 - - - - 150,920Blue Ridge 338,260 84.3 - - 63,100 15.7 - - - - - - 401,360Brunswick 362,570 93.1 3,732 1.0 20,314 5.2 - - - - 2,675 0.7 389,291Caldwell 490,265 100.0 - - - - - - - - - - 490,265Cape Fear 1,385,447 85.7 159,885 9.9 7,965 0.5 26,409 1.6 - - 36,529 2.3 1,616,235Carteret 222,586 94.1 - - 5,197 2.2 8,847 3.7 - - - - 236,630Catawba Valley 566,125 100.0 - - - - - - - - - - 566,125Central Carolina 571,404 97.6 14,250 2.4 - - - - - - - - 585,654Central Piedmont 1,799,507 56.9 994,760 31.4 263,688 8.3 105,937 3.3 - - - - 3,163,892Cleveland 301,108 100.0 - - - - - - - - - - 301,108Coastal Carolina 331,906 100.0 - - - - - - - - - - 331,906Coll. of Albemarle 363,670 90.0 29,800 7.4 - - 10,618 2.6 - - - - 404,088Craven 315,007 100.0 - - - - - - - - - - 315,007Davidson County 455,455 100.0 - - - - - - - - - - 455,455Durham 510,737 100.0 - - - - - - - - - - 510,737Edgecombe 245,878 100.0 - - - - - - - - - - 245,878Fayetteville 935,690 100.0 - - - - - - - - 199 0.0 935,889Forsyth 964,500 100.0 - - - - - - - - - - 964,500Gaston 714,567 100.0 - - - - - - - - - - 714,567

123
Table 22. Condition of Buildings: Gross Square Footage
Institution Satisfactory Remodeling A Remodeling B Remodeling C Demolition Termination Total GrossGSF % GSF % GSF % GSF % GSF % GSF % Sq. Ft.
Guilford 1,057,257 70.8 177,394 11.9 157,544 10.5 99,265 6.6 - - 1,931 0.1 1,493,391Halifax 275,321 100.0 - - - - - - - - - - 275,321Haywood 314,166 88.3 39,500 11.1 - - - - - - 2,160 0.6 355,826Isothermal 356,005 100.0 - - - - - - - - - - 356,005James Sprunt 163,986 98.4 - - - - 2,664 1.6 - - - - 166,650Johnston 470,046 100.0 - - - - - - - - - - 470,046Lenoir 430,249 100.0 - - - - - - - - - - 430,249Martin 229,431 100.0 - - - - - - - - - - 229,431Mayland 159,622 99.8 - - - - - - 294 0.2 - - 159,916McDowell 159,319 100.0 - - - - - - - - - - 159,319Mitchell 196,819 49.1 37,035 9.2 55,755 13.9 110,920 27.7 - - - - 400,529Montgomery 129,642 100.0 - - - - - - - - - - 129,642Nash 262,731 100.0 - - - - - - - - - - 262,731Pamlico 84,556 98.3 - - 1,479 1.7 - - - - - - 86,035Piedmont 182,713 100.0 - - - - - - - - - - 182,713Pitt 511,349 87.8 - - - - 69,551 11.9 - - 1,322 0.2 582,222Randolph 392,622 100.0 - - - - - - - - - - 392,622Richmond 253,209 100.0 - - - - - - - - - - 253,209Roanoke-Chowan 167,421 100.0 - - - - - - - - - - 167,421Robeson 279,660 100.0 - - - - - - - - - - 279,660Rockingham 327,731 100.0 - - - - - - - - - - 327,731Rowan-Cabarrus 475,830 91.7 - - 43,034 8.3 - - - - - - 518,864Sampson 199,414 100.0 - - - - - - - - - - 199,414Sandhills 395,392 79.8 57,779 11.7 - - 42,462 8.6 - - - - 495,633South Piedmont 404,558 100.0 - - - - - - - - - - 404,558Southeastern 69,124 28.0 64,775 26.2 79,092 32.0 34,009 13.8 - - - - 247,000Southwestern 294,802 100.0 - - - - - - - - - - 294,802Stanly 208,656 100.0 - - - - - - - - - - 208,656Surry 445,655 100.0 - - - - - - - - - - 445,655Tri-County 153,025 99.4 - - - - - - - - 864 0.6 153,889Vance-Granville 390,209 96.1 - - 16,000 3.9 - - - - - - 406,209Wake 1,599,385 93.9 - - - - 104,266 6.1 - - - - 1,703,651Wayne 402,962 100.0 - - - - - - - - - - 402,962Western Piedmont 346,730 86.9 - - 51,822 13.0 360 0.1 - - - - 398,912Wilkes 407,065 99.1 - - - - - - - - 3,515 0.9 410,580Wilson 209,319 100.0 - - - - - - - - - - 209,319Subtotal 24,840,654 88.7 1,726,605 6.2 764,990 2.7 617,828 2.2 294 0.0 49,195 0.2 27,999,566
Private InstitutionsNC Private Universities
Barton 495,166 100.0 - - - - - - - - - - 495,166Campbell 1,559,535 94.6 45,196 2.7 44,283 2.7 - - - - - - 1,649,014Mars Hill 356,547 44.3 260,554 32.4 110,483 13.7 77,230 9.6 - - - - 804,814Pfeiffer 533,051 95.5 9,444 1.7 13,670 2.4 - - 1,984 0.4 - - 558,149Subtotal 2,944,299 84.0 315,194 9.0 168,436 4.8 77,230 2.2 1,984 0.1 - - 3,507,143
Grand Total 89,402,383 76.0 14,630,915 12.4 7,155,170 6.1 6,179,150 5.3 170,209 0.1 63,425 0.1 117,601,252

Table 22a. FCAP 2013: Facilities Maintenance and Repair (UNC Institutions only – Infrastructure and Buildings over 3000 GSF)
Non- Appropriated Appropriated Total
Institution Facilities Facilities Deficiency
N.C. State 399,715,261 114,606,282 514,321,543 UNC-Chapel Hill 438,498,198 235,955,844 674,454,042 East Carolina 330,010,146 111,772,601 441,782,747 UNC-Greensboro 174,654,908 177,345,414 352,000,322 Appalachian State 96,361,574 63,124,802 159,486,376 Fayetteville State 14,999,345 17,632,108 32,631,453 N.C. A&T State 72,010,766 21,066,617 93,077,383 N.C. Central 56,719,812 18,447,769 75,167,581 UNC-Charlotte 77,852,617 58,865,072 136,717,689 UNC-Pembroke 26,146,619 20,215,369 46,361,988 UNC-Wilmington 125,969,202 61,095,435 187,064,637 Western Carolina 109,841,849 91,166,239 201,008,088 Elizabeth City 34,434,027 79,719,014 114,153,041 UNC-Asheville 53,408,325 8,453,923 61,862,248 Winston-Salem State 73,201,874 38,487,210 111,689,084 N.C. School of the Arts 18,152,910 7,400,657 25,553,567 UNCCH-Health Affairs 283,399,830 237,247 283,637,077 ECU-Health Affairs 31,462,546 1,989,087 33,451,633 NCSU Vet School 15,019,578 25,549 15,045,127 UNC TOTAL 2,431,859,387 1,1,27,606,239 3,559,465,626
124
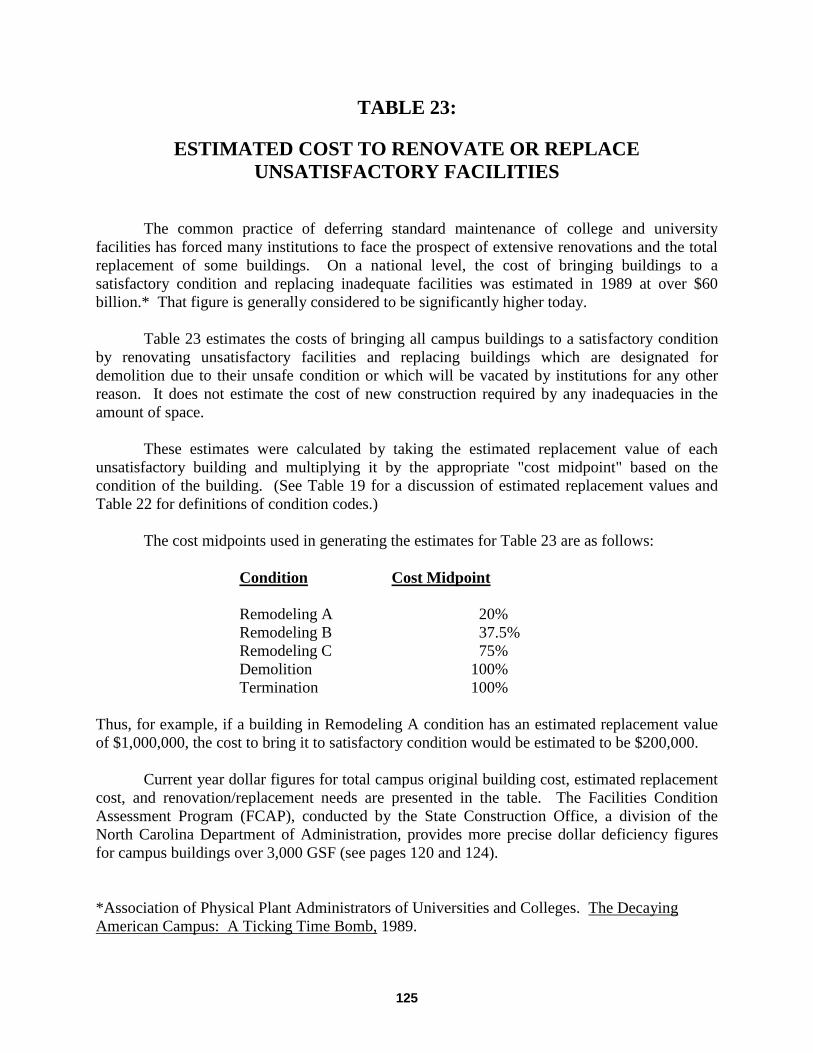
TABLE 23:
ESTIMATED COST TO RENOVATE OR REPLACE
UNSATISFACTORY FACILITIES
The common practice of deferring standard maintenance of college and university
facilities has forced many institutions to face the prospect of extensive renovations and the total
replacement of some buildings. On a national level, the cost of bringing buildings to a
satisfactory condition and replacing inadequate facilities was estimated in 1989 at over $60
billion.* That figure is generally considered to be significantly higher today.
Table 23 estimates the costs of bringing all campus buildings to a satisfactory condition
by renovating unsatisfactory facilities and replacing buildings which are designated for
demolition due to their unsafe condition or which will be vacated by institutions for any other
reason. It does not estimate the cost of new construction required by any inadequacies in the
amount of space.
These estimates were calculated by taking the estimated replacement value of each
unsatisfactory building and multiplying it by the appropriate "cost midpoint" based on the
condition of the building. (See Table 19 for a discussion of estimated replacement values and
Table 22 for definitions of condition codes.)
The cost midpoints used in generating the estimates for Table 23 are as follows:
Condition Cost Midpoint
Remodeling A 20%
Remodeling B 37.5%
Remodeling C 75%
Demolition 100%
Termination 100%
Thus, for example, if a building in Remodeling A condition has an estimated replacement value
of $1,000,000, the cost to bring it to satisfactory condition would be estimated to be $200,000.
Current year dollar figures for total campus original building cost, estimated replacement
cost, and renovation/replacement needs are presented in the table. The Facilities Condition
Assessment Program (FCAP), conducted by the State Construction Office, a division of the
North Carolina Department of Administration, provides more precise dollar deficiency figures
for campus buildings over 3,000 GSF (see pages 120 and 124).
*Association of Physical Plant Administrators of Universities and Colleges. The Decaying
American Campus: A Ticking Time Bomb, 1989.
125

126
Table 23. Estimated Cost to Renovate or Replace Less Than Satisfactory Facilities
InstitutionTotal No. of
Facilities
OriginalBuilding
Cost
EstimatedReplacement
Cost
No. ofLess Than
SatisfactoryFacilities
GSF ofLess Than
SatisfactoryFacilities
Estimated Cost ofRestoring Facilities
to SatisfactoryCondition
Public InstitutionsResearch Universities I
NC State 1,128 $1,100,911,399 $4,285,105,857 522 7,417,782 $730,379,513NC State Veterinary Med 39 $105,227,698 $286,006,834 14 62,067 $3,570,146UNC-Chapel Hill 374 $1,458,089,740 $3,390,481,685 68 3,076,289 $215,850,864UNC-Chapel Hill Hlth Aff. 105 $658,939,086 $1,629,409,783 23 787,825 $66,140,439Subtotal 1,646 $3,323,167,923 $9,591,004,159 627 11,343,963 $1,015,940,962
Doctoral Universities I and IIEast Carolina 151 $311,242,888 $1,270,427,429 104 3,481,250 $411,764,227East Carolina Hlth Aff. 52 $243,683,573 $466,940,173 21 547,075 $49,520,528NC A&T 118 $224,881,807 $819,757,134 44 1,571,333 $269,872,127UNC Charlotte 107 $873,845,466 $1,595,325,456 30 1,492,144 $99,199,388UNC Greensboro 122 $349,861,002 $2,169,452,123 37 1,753,919 $243,395,247Subtotal 550 $2,003,514,736 $6,321,902,315 236 8,845,721 $1,073,751,517
Master's (Comprehensive) Universities and Colleges IAppalachian 94 $459,449,700 $1,060,133,068 14 434,191 $26,911,266Fayetteville 52 $131,237,797 $282,700,919 10 124,445 $4,380,014NC Central 65 $234,103,970 $743,290,978 18 339,622 $39,410,206UNC Pembroke 49 $159,008,287 $365,781,488 2 42,980 $1,789,268UNC Wilmington 153 $446,422,537 $775,374,679 2 35,147 $3,667,746Western Carolina 106 $261,595,364 $614,885,916 44 1,193,522 $44,256,409Winston-Salem 49 $129,039,513 $321,995,591 25 748,786 $41,175,939Subtotal 568 $1,820,857,168 $4,164,162,639 115 2,918,693 $161,590,848
Baccalaureate (Liberal Arts) Universities and Colleges I and IIElizabeth City 59 $108,967,605 $284,653,586 25 436,738 $22,807,573UNC Asheville 38 $179,004,007 $425,038,190 17 613,904 $73,420,672Subtotal 97 $287,971,612 $709,691,776 42 1,050,642 $96,228,245
Schools of Art, Music, and DesignUNC School of the Arts 67 $74,914,547 $218,263,945 27 318,094 $14,595,566Subtotal 67 $74,914,547 $218,263,945 27 318,094 $14,595,566
Teaching HospitalsUNC Hospitals 30 $456,844,106 $881,113,088 - - -Subtotal 30 $456,844,106 $881,113,088 - - -
Community CollegesAlamance 15 $28,900,315 $156,779,713 - - -Asheville-Buncombe 24 $119,206,462 $211,184,877 1 147,275 $14,163,509Beaufort Co. 17 $22,638,835 $44,557,452 - - -Bladen 24 $8,626,162 $23,282,792 2 2,940 $258,462Blue Ridge 15 $35,342,638 $68,889,641 1 63,100 $4,195,920Brunswick 19 $43,507,286 $71,138,693 3 26,721 $1,467,970Caldwell 22 $43,597,730 $92,981,975 - - -Cape Fear 36 $179,903,122 $283,367,342 9 230,788 $16,337,589Carteret 17 $17,478,813 $44,880,474 4 14,044 $1,244,777Catawba Valley 17 $33,898,394 $82,530,087 - - -Central Carolina 37 $39,674,645 $100,580,310 1 14,250 $293,676Central Piedmont 51 $296,199,890 $560,852,430 25 1,364,385 $62,721,663Cleveland 14 $22,983,131 $68,861,998 - - -Coastal Carolina 15 $25,802,443 $62,609,429 - - -Coll. of Albemarle 25 $28,161,752 $150,860,844 5 40,418 $3,542,924Craven 15 $31,819,139 $61,788,392 - - -Davidson County 29 $27,794,875 $87,741,208 - - -Durham 18 $34,355,718 $92,271,468 - - -Edgecombe 12 $19,385,035 $43,972,586 - - -Fayetteville 38 $62,274,428 $141,532,736 1 199 $10,987
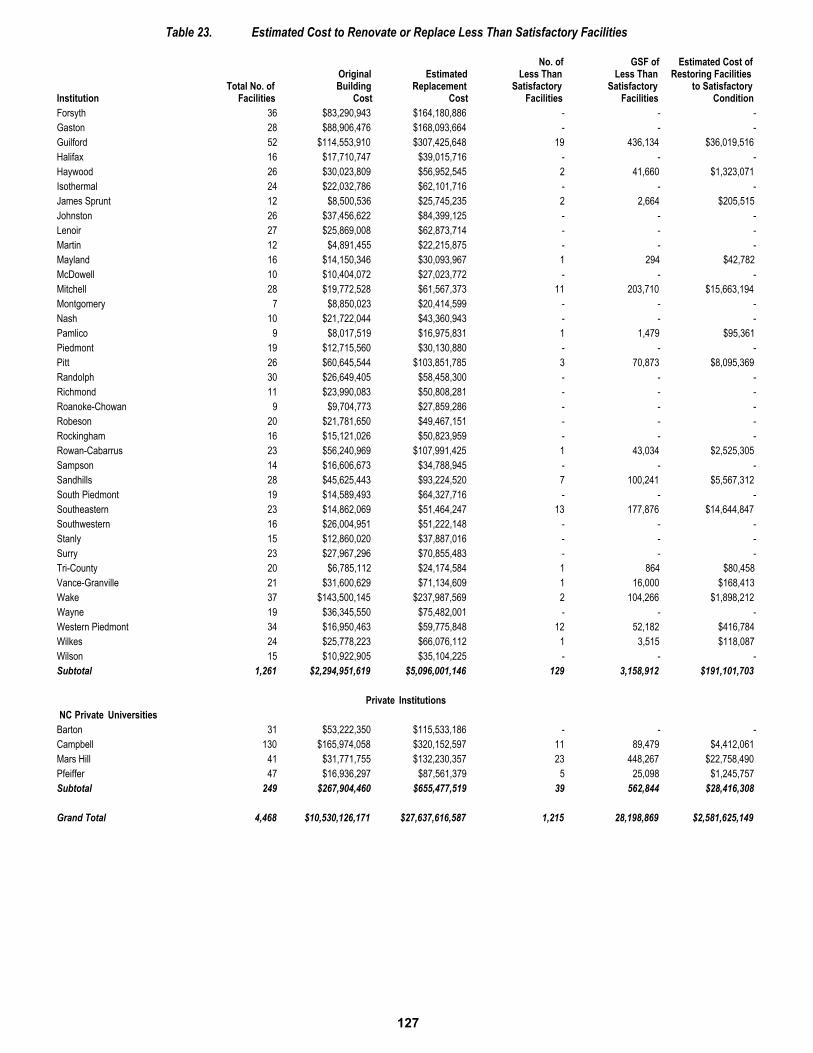
127
Table 23. Estimated Cost to Renovate or Replace Less Than Satisfactory Facilities
InstitutionTotal No. of
Facilities
OriginalBuilding
Cost
EstimatedReplacement
Cost
No. ofLess Than
SatisfactoryFacilities
GSF ofLess Than
SatisfactoryFacilities
Estimated Cost ofRestoring Facilities
to SatisfactoryCondition
Forsyth 36 $83,290,943 $164,180,886 - - -Gaston 28 $88,906,476 $168,093,664 - - -Guilford 52 $114,553,910 $307,425,648 19 436,134 $36,019,516Halifax 16 $17,710,747 $39,015,716 - - -Haywood 26 $30,023,809 $56,952,545 2 41,660 $1,323,071Isothermal 24 $22,032,786 $62,101,716 - - -James Sprunt 12 $8,500,536 $25,745,235 2 2,664 $205,515Johnston 26 $37,456,622 $84,399,125 - - -Lenoir 27 $25,869,008 $62,873,714 - - -Martin 12 $4,891,455 $22,215,875 - - -Mayland 16 $14,150,346 $30,093,967 1 294 $42,782McDowell 10 $10,404,072 $27,023,772 - - -Mitchell 28 $19,772,528 $61,567,373 11 203,710 $15,663,194Montgomery 7 $8,850,023 $20,414,599 - - -Nash 10 $21,722,044 $43,360,943 - - -Pamlico 9 $8,017,519 $16,975,831 1 1,479 $95,361Piedmont 19 $12,715,560 $30,130,880 - - -Pitt 26 $60,645,544 $103,851,785 3 70,873 $8,095,369Randolph 30 $26,649,405 $58,458,300 - - -Richmond 11 $23,990,083 $50,808,281 - - -Roanoke-Chowan 9 $9,704,773 $27,859,286 - - -Robeson 20 $21,781,650 $49,467,151 - - -Rockingham 16 $15,121,026 $50,823,959 - - -Rowan-Cabarrus 23 $56,240,969 $107,991,425 1 43,034 $2,525,305Sampson 14 $16,606,673 $34,788,945 - - -Sandhills 28 $45,625,443 $93,224,520 7 100,241 $5,567,312South Piedmont 19 $14,589,493 $64,327,716 - - -Southeastern 23 $14,862,069 $51,464,247 13 177,876 $14,644,847Southwestern 16 $26,004,951 $51,222,148 - - -Stanly 15 $12,860,020 $37,887,016 - - -Surry 23 $27,967,296 $70,855,483 - - -Tri-County 20 $6,785,112 $24,174,584 1 864 $80,458Vance-Granville 21 $31,600,629 $71,134,609 1 16,000 $168,413Wake 37 $143,500,145 $237,987,569 2 104,266 $1,898,212Wayne 19 $36,345,550 $75,482,001 - - -Western Piedmont 34 $16,950,463 $59,775,848 12 52,182 $416,784Wilkes 24 $25,778,223 $66,076,112 1 3,515 $118,087Wilson 15 $10,922,905 $35,104,225 - - -Subtotal 1,261 $2,294,951,619 $5,096,001,146 129 3,158,912 $191,101,703
Private InstitutionsNC Private Universities
Barton 31 $53,222,350 $115,533,186 - - -Campbell 130 $165,974,058 $320,152,597 11 89,479 $4,412,061Mars Hill 41 $31,771,755 $132,230,357 23 448,267 $22,758,490Pfeiffer 47 $16,936,297 $87,561,379 5 25,098 $1,245,757Subtotal 249 $267,904,460 $655,477,519 39 562,844 $28,416,308
Grand Total 4,468 $10,530,126,171 $27,637,616,587 1,215 28,198,869 $2,581,625,149

This Page Intentionally Left Blank
128

Creative Arts Building, Haywood Community College
Haywood Community College’s objective when building this new $10 million facility was to showcase its internationally recognized creative arts program and demonstrate the college’s commitment to sustainability. This 41,000 square foot building which accommodates the clay, jewelry, wood and fiber programs consists of three levels stepping down a heavily wooded, south facing hillside. Each of the four major studio spaces are arranged so they have access to ground level entry. This allowed the entire facility to be optimally oriented for solar access, provided excellent daylighting, natural ventilation, and 100 percent accessibility to the mobility impaired.
The building has a constructed wetland pond to reduce pollutants from storm water runoff and replenish local mountain streams with cleansed water. A rainwater harvesting system collected from the roof areas and utilizing a 25,000 gallon tank with UV treatment saves over 570,000 gallons of potable water each year. In addition, a 400 gallon storage tank is tied to seven solar collectors and provides the majority of domestic hot water needs. For heating, 152 solar collectors combined with a 15,000 gallon storage tank provides heat for the radiant floor heating system and 50 ton absorption chiller.
Over 85 percent of the facility’s regularly occupied spaces maximize daylighting by using fiber filled glazing with exterior lightshelves on southern exposures and north facing clerestories with clear glazing. Supplemental lighting is controlled by daylighting sensors that automatically dims light fixtures to optimum levels.
Accessibility of Facilities to the Mobility Impaired
Accessible Area as a Percentage of Assignable . . . . . . . . . . 131 Accessible Area by Programs and Subprograms . . . . . . . . . 135 Accessible Area by Room Code . . . . . . . . . . . . . . . . . . . . . . 149
129

This Page Intentionally Left Blank
130

TABLE 24:
ACCESSIBLE AREA AS A PERCENTAGE OF ASSIGNABLE
The Rehabilitation Act of 1973 focused national attention on the rights of handicapped persons. Section 504 of the Act stated that "no otherwise qualified handicapped individual in the United States . . . shall, solely by reason of his handicap, be excluded from the participation in, be denied the benefits of, or be subjected to discrimination under any program or activity receiving Federal financial assistance." The more recent 1990 Americans with Disabilities Act (ADA) reinforced this guideline while providing a very comprehensive set of regulations and definitions for addressing the special needs of people with a broad range of disabilities.
One of the groups protected by both pieces of legislation is the people who are confined to wheelchairs or whose mobility is otherwise impaired. Although neither of the Congressional Acts requires that colleges and universities make all of their facilities barrier-free, they do require that an institution's programs be made accessible to the handicapped. Although program accessibility can be partially achieved through changes other than facilities modifications, the amount of assignable space which is accessible to the mobility impaired is a factor which must be carefully considered in making programs accessible.
The National Center for Education Statistics conducted a survey in 1978 to determine the impact of the earlier Section 504 on colleges and universities. One of the findings of the survey was that about 76% of the assignable area on college and university campuses would need to be made accessible in order to comply with the program accessibility requirement of the original legislation. The survey also found, however, that this percentage varied greatly among different institutions. Since the 1978 study, total campus accessibility for institutions throughout the country has improved dramatically.
The definition of building space accessibility in the 2006 NCES Postsecondary Education Facilities Inventory and Classification Manual (and incorporated in the 2009 edition of the N.C. Manual) includes approach to a building in addition to access from a point immediately outside the building. Thus a building's site must also be accessible; i.e., there are no barriers to approach, such as lack of curb breaks or steps to a building'sentrance. These criteria apply to a mobility impaired person (i.e., confined to a wheel-chair or other support device such as a walker) who is attempting to approach and enter a building and its internal space without assistance.
131

132
Table 24. Accessible Area as a Percentage of Assignable Area
InstitutionTotal Assignable Sq.
Ft. Accessible Sq. Ft. Percent Accessible2013 2012 2011 2010 2009
Public InstitutionsResearch Universities I
NC State 8,683,235 7,105,516 81.8 80.0 73.4 71.2 69.6NC State Veterinary Med 424,851 379,336 89.3 89.3 81.0 77.4 76.9UNC-Chapel Hill 7,222,629 7,215,241 99.9 91.3 91.0 91.0 88.2UNC-Chapel Hill Hlth Aff. 2,530,262 2,527,534 99.9 98.3 98.4 98.3 93.9Subtotal 18,860,977 17,227,627 91.3 87.2 83.8 82.7 80.4
Doctoral Universities I and IIEast Carolina 3,272,813 2,766,847 84.5 97.1 88.1 100.0 52.7East Carolina Hlth Aff. 827,019 827,019 100.0 99.8 99.8 100.0 68.4NC A&T 2,218,401 2,048,691 92.3 92.2 92.3 92.0 92.0UNC Charlotte 3,493,311 3,284,067 94.0 93.0 92.7 94.5 95.8UNC Greensboro 2,997,367 2,652,612 88.5 89.4 83.8 86.3 87.2Subtotal 12,808,911 11,579,236 90.4 93.6 89.8 94.1 79.3
Master's (Comprehensive) Universities and Colleges IAppalachian 2,821,238 2,319,419 82.2 82.0 81.7 80.1 80.0Fayetteville 892,087 810,850 90.9 90.5 89.8 89.0 88.4NC Central 1,457,852 1,317,427 90.4 90.4 90.1 86.7 86.7UNC Pembroke 1,023,469 915,881 89.5 89.5 89.0 87.5 87.5UNC Wilmington 2,179,820 1,749,754 80.3 78.8 100.0 93.4 92.8Western Carolina 2,028,270 1,507,319 74.3 74.3 73.7 73.6 73.0Winston-Salem 1,114,239 935,912 84.0 84.0 83.6 83.6 81.3Subtotal 11,516,975 9,556,562 83.0 82.5 86.3 84.0 83.5
Baccalaureate (Liberal Arts) Universities and Colleges I and IIElizabeth City 862,299 718,949 83.4 83.4 83.2 82.6 81.7UNC Asheville 887,132 855,783 96.5 96.5 96.3 94.2 93.6Subtotal 1,749,431 1,574,732 90.0 90.1 89.7 88.2 87.6
Schools of Art, Music, and DesignUNC School of the Arts 738,551 612,264 82.9 79.1 77.1 77.1 77.0Subtotal 738,551 612,264 82.9 79.1 77.1 77.1 77.0
Teaching HospitalsUNC Hospitals 1,358,302 1,194,182 87.9 87.9 87.9 87.9 87.9Subtotal 1,358,302 1,194,182 87.9 87.9 87.9 87.9 87.9
Community CollegesAlamance 238,366 238,005 99.8 99.6 99.6 99.6 99.5Asheville-Buncombe 511,055 494,975 96.9 96.5 96.2 96.2 96.2Beaufort Co. 189,556 189,075 99.7 99.7 99.7 99.7 99.7Bladen 110,946 108,883 98.1 98.2 98.2 98.2 98.0Blue Ridge 290,314 290,314 100.0 100.0 100.0 100.0 100.0Brunswick 254,175 246,370 96.9 96.8 96.8 96.6 96.6Caldwell 340,713 338,030 99.2 99.2 99.2 99.2 99.2Cape Fear 614,635 606,908 98.7 98.4 98.4 99.2 99.2Carteret 167,124 157,809 94.4 94.4 94.3 94.3 94.3Catawba Valley 365,292 364,557 99.8 99.8 99.8 99.8 99.8Central Carolina 404,568 403,002 99.6 99.6 99.6 99.6 98.8Central Piedmont 1,289,900 1,274,931 98.8 98.8 98.7 98.7 98.9Cleveland 207,079 205,869 99.4 99.4 99.4 99.4 99.4Coastal Carolina 218,626 217,662 99.6 99.6 99.6 99.6 99.6Coll. of Albemarle 272,245 272,145 100.0 100.0 100.0 100.0 100.0Craven 210,443 200,230 95.1 95.1 95.0 95.0 95.7Davidson County 310,482 302,547 97.4 97.4 97.3 96.7 96.6Durham 343,071 303,207 88.4 88.4 88.3 88.1 88.4Edgecombe 169,084 161,175 95.3 95.3 95.3 95.3 95.3Fayetteville 630,851 598,317 94.8 94.5 94.2 94.1 94.4Forsyth 668,782 661,682 98.9 98.8 98.6 98.6 98.5

133
Table 24. Accessible Area as a Percentage of Assignable Area
InstitutionTotal Assignable Sq.
Ft. Accessible Sq. Ft. Percent Accessible2013 2012 2011 2010 2009
Gaston 475,497 449,552 94.5 94.5 94.4 93.6 93.6Guilford 884,897 833,985 94.2 94.2 93.6 95.0 94.6Halifax 187,362 186,839 99.7 99.7 99.7 99.7 99.7Haywood 253,015 246,311 97.4 97.1 93.0 92.7 92.9Isothermal 241,215 223,696 92.7 92.5 91.9 91.9 91.9James Sprunt 117,674 112,227 95.4 93.9 93.9 93.9 93.8Johnston 338,241 331,970 98.1 98.2 98.2 98.0 98.0Lenoir 322,942 317,299 98.3 97.4 96.4 96.9 96.9Martin 170,782 146,952 86.0 86.0 86.0 86.0 86.0Mayland 113,020 109,108 96.5 96.8 96.9 96.5 96.6McDowell 117,076 114,980 98.2 98.2 98.2 98.2 97.7Mitchell 268,212 243,571 90.8 90.8 90.8 90.1 90.1Montgomery 92,421 92,397 100.0 100.0 100.0 100.0 98.5Nash 175,598 173,877 99.0 99.0 99.0 99.0 99.0Pamlico 55,243 54,694 99.0 99.0 99.0 97.8 97.8Piedmont 143,109 141,444 98.8 98.8 98.8 98.8 98.8Pitt 376,412 376,038 99.9 99.9 99.2 99.1 99.0Randolph 293,984 293,501 99.8 99.8 99.8 99.8 99.8Richmond 177,786 166,319 93.6 93.1 93.3 93.3 92.7Roanoke-Chowan 117,209 113,541 96.9 96.9 96.9 96.9 96.9Robeson 201,239 201,215 100.0 100.0 100.0 100.0 100.0Rockingham 230,981 214,337 92.8 92.8 92.8 92.8 92.8Rowan-Cabarrus 378,353 378,326 100.0 100.0 100.0 100.0 100.0Sampson 139,057 137,870 99.1 99.1 99.1 99.1 99.1Sandhills 321,663 310,491 96.5 97.0 96.8 96.8 96.7South Piedmont 322,160 281,442 87.4 85.1 85.0 84.8 84.8Southeastern 183,591 181,938 99.1 98.9 98.1 98.2 94.7Southwestern 203,835 197,356 96.8 96.9 96.5 96.5 96.5Stanly 147,199 146,727 99.7 99.7 99.7 99.7 99.7Surry 313,753 308,023 98.2 98.1 98.1 97.8 97.8Tri-County 117,608 114,591 97.4 97.4 97.4 97.4 97.4Vance-Granville 264,751 258,282 97.6 97.3 97.3 97.3 97.3Wake 848,436 837,313 98.7 98.7 98.5 96.6 96.7Wayne 255,443 253,115 99.1 99.1 99.0 99.0 99.0Western Piedmont 287,293 244,588 85.1 83.2 83.2 83.2 83.2Wilkes 298,201 293,325 98.4 98.4 98.3 98.3 98.3Wilson 143,403 140,260 97.8 97.8 97.8 97.8 97.8Subtotal 17,385,968 16,863,193 97.0 96.8 96.6 96.5 96.4
Private InstitutionsNC Private Universities
Barton 350,454 328,517 93.7 93.8 93.8 93.8 93.8Campbell 1,122,004 820,481 73.1 71.8 71.8 72.0 71.1Mars Hill 543,596 318,610 58.6 58.2 58.2 58.2 58.2Pfeiffer 373,986 197,229 52.7 52.7 52.7 53.2 52.7Subtotal 2,390,040 1,664,837 69.7 68.9 68.9 69.0 68.4
Grand Total 66,809,155 60,272,633 90.2 89.4 88.3 88.3 84.7

This Page Intentionally Left Blank
134

TABLE 25:
ACCESSIBLE AREA BY SUMMARY PROGRAMS AND SUBPROGRAMS
The requirement that all colleges and universities make their programs accessible to handicapped persons makes careful planning on the part of campus administrators especially important. Although program accessibility does not require that a campus be barrier-free, the concepts of program accessibility and facilities accessibility are inherently interrelated. Campus administrators must therefore analyze their campus facilities in terms of accessibility, focusing particularly on the kinds of space which are accessible.
Table 25 and Tables 25a-25d indicate for each program and subprogram the percentage of assignable space which is accessible to the mobility impaired. A dash indicates that a particular institution has no assignable space under the indicated program or subprogram. A "0.0" indicates that the institution has assignable space under the program and subprogram but that none of it is accessible. Definitions of the programs and subprograms listed in these tables can be found in the narratives preceding Tables 14-14d. Subprogram 03 (Building Service) is not included in Table 25d (and is not considered as part of Program 00 in Table 25) because it applies to nonassignable area only.
It is not possible to develop standards to indicate how much accessible space in each program and subprogram is needed to achieve program accessibility. The figures would vary from institution to institution based on the kinds of programmatic changes that had been implemented to assist handicapped persons. For example, the financial aid program at a college or university would be considered accessible if a handicapped student had the same access to the financial aid and related counseling which the institution offered to other students. This could be accomplished without making the space occupied by the financial aid office accessible. Thus, a program or subprogram which has little or no accessible area is not necessarily inaccessible.
Although the data in Table 25 and Tables 25a-25d cannot be used to ascertain whether program accessibility has been achieved, the information does provide facilities planners with a detailed breakdown of the accessible space on their campuses. This will in turn assist each institution in the determination of the most practical means of achieving program accessibility.
135

136
Table 25. Percentage Distribution of Accessible Area by Summary Programs
AccessibleSq. Ft.
In-struction
10Research
20
PublicService
30
AcademicSupport
40
StudentServices
50
Inst.Admin.
60
PhysicalPlant
70
Indep.Opns.
80
Un-assigned
00Public Institutions
Research Universities INC State 7,105,516 92.6 81.0 79.2 97.7 71.3 88.6 81.7 96.2 65.2NC State Veterinary Med 379,336 68.9 92.3 98.7 100.0 100.0 100.0 90.7 100.0 -UNC-Chapel Hill 7,215,241 99.9 100.0 99.7 100.0 99.9 99.9 100.0 99.8 99.2UNC-Chapel Hill Hlth Aff. 2,527,534 99.9 99.9 99.7 99.8 99.9 100.0 99.8 100.0 99.7Subtotal 17,227,627 96.1 88.8 90.4 99.1 88.1 94.1 94.1 97.6 80.2
Doctoral Universities I and IIEast Carolina 2,766,847 94.5 59.6 95.3 98.4 97.4 87.3 35.2 100.0 2.8East Carolina Hlth Aff. 827,019 100.0 100.0 100.0 100.0 - 100.0 100.0 - 100.0NC A&T 2,048,691 98.3 99.2 100.0 98.2 78.6 99.3 78.1 100.0 100.0UNC Charlotte 3,284,067 96.9 98.9 100.0 94.4 92.3 90.6 68.4 - 98.4UNC Greensboro 2,652,612 95.8 90.7 98.9 89.6 85.0 96.0 77.9 100.0 75.3Subtotal 11,579,236 96.5 93.9 99.6 95.2 90.0 94.3 62.8 100.0 37.5
Master's (Comprehensive) Universities and Colleges IAppalachian 2,319,419 89.3 73.4 32.7 100.0 78.5 79.0 88.9 100.0 100.0Fayetteville 810,850 98.4 100.0 100.0 100.0 77.6 97.2 100.0 100.0 93.9NC Central 1,317,427 90.9 98.1 96.5 94.9 91.3 76.8 76.0 99.5 88.2UNC Pembroke 915,881 97.2 100.0 100.0 100.0 81.7 98.9 99.8 - -UNC Wilmington 1,749,754 98.0 86.9 87.6 98.3 67.6 91.3 98.8 - 88.5Western Carolina 1,507,319 94.2 91.3 100.0 95.5 60.5 54.7 98.4 100.0 89.3Winston-Salem 935,912 81.8 94.0 95.6 94.5 87.7 61.4 92.5 100.0 49.2Subtotal 9,556,562 92.6 89.7 55.7 97.5 75.3 78.0 94.7 99.9 86.7
Baccalaureate (Liberal Arts) Universities and Colleges I and IIElizabeth City 718,949 96.6 100.0 100.0 99.0 74.1 73.7 100.0 - 58.7UNC Asheville 855,783 100.0 100.0 100.0 100.0 94.1 89.4 100.0 100.0 100.0Subtotal 1,574,732 98.1 100.0 100.0 99.7 84.6 80.4 100.0 100.0 59.1
Schools of Art, Music, and DesignUNC School of the Arts 612,264 91.5 - 100.0 86.6 84.4 59.8 8.0 100.0 53.3Subtotal 612,264 91.5 - 100.0 86.6 84.4 59.8 8.0 100.0 53.3
Teaching HospitalsUNC Hospitals 1,194,182 100.0 100.0 85.3 - - 100.0 98.5 100.0 100.0Subtotal 1,194,182 100.0 100.0 85.3 - - 100.0 98.5 100.0 100.0
Community CollegesAlamance 238,005 99.8 - 100.0 100.0 100.0 100.0 100.0 100.0 -Asheville-Buncombe 494,975 97.7 - 100.0 100.0 97.9 83.4 100.0 98.1 95.8Beaufort Co. 189,075 99.9 - 100.0 100.0 99.4 98.6 100.0 100.0 -Bladen 108,883 97.3 - 100.0 98.7 100.0 99.7 100.0 100.0 -Blue Ridge 290,314 100.0 - 100.0 100.0 100.0 100.0 100.0 100.0 -Brunswick 246,370 98.6 - 100.0 100.0 100.0 97.7 100.0 92.6 100.0Caldwell 338,030 99.8 - 100.0 100.0 95.5 96.4 100.0 100.0 100.0Cape Fear 606,908 98.4 100.0 100.0 100.0 98.2 99.5 99.5 100.0 100.0Carteret 157,809 96.3 - - 71.1 91.9 97.7 100.0 100.0 -Catawba Valley 364,557 99.7 - - 100.0 100.0 100.0 - 100.0 100.0Central Carolina 403,002 99.6 - 100.0 98.5 100.0 100.0 100.0 100.0 100.0Central Piedmont 1,274,931 99.2 - 97.5 99.3 99.3 98.6 94.2 100.0 95.0Cleveland 205,869 100.0 - 100.0 100.0 100.0 93.1 100.0 100.0 100.0Coastal Carolina 217,662 100.0 - 100.0 100.0 100.0 92.8 100.0 - -Coll. of Albemarle 272,145 99.9 - 100.0 100.0 100.0 100.0 100.0 100.0 100.0Craven 200,230 99.2 - 100.0 59.2 99.6 97.4 85.1 99.6 -Davidson County 302,547 98.5 - 54.4 97.1 100.0 99.9 100.0 89.9 -Durham 303,207 99.7 - - 99.9 100.0 93.8 7.9 100.0 -Edgecombe 161,175 93.8 - 100.0 98.1 100.0 100.0 100.0 76.2 -Fayetteville 598,317 95.7 - 100.0 97.4 98.2 91.3 61.2 100.0 -Forsyth 661,682 99.4 - 100.0 99.4 100.0 99.7 66.7 100.0 100.0

137
Table 25. Percentage Distribution of Accessible Area by Summary Programs
AccessibleSq. Ft.
In-struction
10Research
20
PublicService
30
AcademicSupport
40
StudentServices
50
Inst.Admin.
60
PhysicalPlant
70
Indep.Opns.
80
Un-assigned
00Gaston 449,552 93.8 100.0 - 100.0 98.6 87.0 80.2 100.0 100.0Guilford 833,985 96.0 - 85.5 84.9 97.7 92.0 94.2 99.3 88.9Halifax 186,839 100.0 - 98.8 100.0 100.0 99.1 98.4 100.0 -Haywood 246,311 97.8 - 100.0 100.0 100.0 92.4 100.0 100.0 91.5Isothermal 223,696 95.2 - 100.0 46.2 100.0 99.5 88.0 100.0 -James Sprunt 112,227 96.0 - 100.0 100.0 100.0 100.0 66.7 100.0 0.0Johnston 331,970 99.9 - - 100.0 99.7 95.1 75.4 100.0 -Lenoir 317,299 97.5 - 100.0 98.9 100.0 99.6 100.0 100.0 -Martin 146,952 94.1 - 100.0 96.1 72.2 94.4 100.0 100.0 -Mayland 109,108 99.9 - 22.9 100.0 100.0 88.1 73.9 100.0 100.0McDowell 114,980 97.7 - 100.0 100.0 98.8 98.0 100.0 100.0 -Mitchell 243,571 95.8 - 100.0 99.1 73.8 81.8 93.6 100.0 81.4Montgomery 92,397 100.0 - 100.0 100.0 100.0 100.0 100.0 100.0 -Nash 173,877 99.5 - 100.0 100.0 99.8 91.3 100.0 100.0 -Pamlico 54,694 99.9 - 100.0 100.0 100.0 99.0 76.9 100.0 -Piedmont 141,444 98.3 - 97.6 100.0 100.0 99.7 100.0 100.0 -Pitt 376,038 100.0 - - 99.2 100.0 99.6 100.0 100.0 100.0Randolph 293,501 99.9 - - 100.0 99.8 99.5 100.0 100.0 100.0Richmond 166,319 94.6 - 99.8 100.0 50.3 97.2 45.2 100.0 100.0Roanoke-Chowan 113,541 100.0 - 100.0 100.0 100.0 63.5 100.0 100.0 -Robeson 201,215 100.0 - 100.0 100.0 100.0 100.0 100.0 100.0 100.0Rockingham 214,337 89.5 - 97.5 98.9 99.1 99.9 100.0 99.4 100.0Rowan-Cabarrus 378,326 100.0 - 100.0 100.0 100.0 99.9 100.0 100.0 100.0Sampson 137,870 98.7 - 100.0 100.0 100.0 99.5 100.0 100.0 -Sandhills 310,491 98.8 - - 99.9 99.4 73.0 6.8 100.0 -South Piedmont 281,442 100.0 - 100.0 100.0 100.0 98.1 98.5 100.0 59.7Southeastern 181,938 98.8 - 100.0 100.0 99.8 100.0 100.0 100.0 97.8Southwestern 197,356 97.3 - 100.0 100.0 100.0 98.8 2.4 100.0 100.0Stanly 146,727 100.0 - 100.0 100.0 100.0 97.4 100.0 100.0 100.0Surry 308,023 99.1 - - 100.0 97.8 91.2 100.0 85.3 -Tri-County 114,591 98.6 - 100.0 89.6 100.0 95.2 100.0 - -Vance-Granville 258,282 99.3 - 100.0 90.2 100.0 85.0 100.0 100.0 99.6Wake 837,313 99.6 - - 100.0 100.0 89.6 85.5 100.0 100.0Wayne 253,115 98.8 - 100.0 100.0 99.5 98.7 100.0 100.0 -Western Piedmont 244,588 99.9 - - 100.0 99.1 95.6 40.7 100.0 25.5Wilkes 293,325 99.0 - 92.3 100.0 94.9 99.7 100.0 98.7 100.0Wilson 140,260 98.5 - 100.0 97.3 100.0 93.1 100.0 - -Subtotal 16,863,193 98.4 100.0 97.2 97.0 97.0 95.2 83.7 98.2 80.6
Private InstitutionsNC Private Universities
Barton 328,517 99.9 - - 99.3 86.4 100.0 100.0 - 100.0Campbell 820,481 96.9 100.0 - 97.8 58.8 57.4 97.8 60.1 25.9Mars Hill 318,610 69.9 - 86.1 92.9 45.4 54.3 99.6 - 71.7Pfeiffer 197,229 85.1 - 100.0 56.0 45.1 25.6 9.0 - 28.4Subtotal 1,664,837 89.4 100.0 88.5 90.5 57.5 58.4 84.1 58.6 42.0
Grand Total 60,272,633 96.6 89.7 88.8 97.1 83.7 89.9 84.3 97.8 69.0

138
Table 25a. Accessible Area by Instruction, Research, and Public Service Subprograms
GeneralAcademic
Instruction11
VocationalTechnical
Instruction12
PreparatoryRemedial
Instruction13
GeneralStudies
14
OccupationalRelated
Instruction15
SocialRoles
Instruction16
Home &Family Life
17
PersonalLeisure
Instruction18
Public InstitutionsResearch Universities I
NC State 92.6 - - 100.0 - - - -NC State Veterinary Med 68.9 - - - - - - -UNC-Chapel Hill 99.9 - - 99.9 99.8 - - -UNC-Chapel Hill Hlth Aff. 99.9 - 100.0 99.9 100.0 - - -Subtotal 96.0 - 100.0 99.9 99.9 - - -
Doctoral Universities I and IIEast Carolina 94.5 - 100.0 - - - - -East Carolina Hlth Aff. 100.0 - 100.0 - - - - -NC A&T 98.3 - - - - - - -UNC Charlotte 96.9 - - - 100.0 - - -UNC Greensboro 95.9 - - - 100.0 - - -Subtotal 96.6 - 24.5 - 100.0 - - -
Master's (Comprehensive) Universities and Colleges IAppalachian 89.3 - - - - - - -Fayetteville 98.4 - - 100.0 - - - -NC Central 90.9 - - - - - - -UNC Pembroke 97.2 - - - - - - -UNC Wilmington 98.0 - - - - - - -Western Carolina 94.1 - - 100.0 - - - 100.0Winston-Salem 81.6 - 100.0 - - - - -Subtotal 92.5 - 100.0 99.4 - - - 100.0
Baccalaureate (Liberal Arts) Universities and Colleges I and IIElizabeth City 96.6 - 100.0 100.0 - - - -UNC Asheville 100.0 - - 100.0 - - - 100.0Subtotal 98.0 - 100.0 100.0 - - - 100.0
Schools of Art, Music, and DesignUNC School of the Arts 91.5 - - - - - - -Subtotal 91.5 - - - - - - -
Teaching HospitalsUNC Hospitals 100.0 - - 100.0 - - - -Subtotal 100.0 - - 100.0 - - - -
Community CollegesAlamance 100.0 99.7 - 100.0 100.0 100.0 - -Asheville-Buncombe 98.8 96.9 99.1 100.0 98.6 100.0 - 100.0Beaufort Co. 100.0 100.0 100.0 100.0 99.4 - - -Bladen 100.0 96.4 - 100.0 100.0 - - -Blue Ridge 100.0 100.0 100.0 100.0 100.0 - - 100.0Brunswick 100.0 98.1 - 100.0 100.0 - - 100.0Caldwell 100.0 99.7 100.0 100.0 100.0 - - -Cape Fear 98.4 99.6 100.0 100.0 75.1 - - -Carteret 100.0 96.0 100.0 96.1 100.0 - - 100.0Catawba Valley 100.0 99.5 100.0 100.0 100.0 - - 100.0Central Carolina 100.0 100.0 100.0 100.0 85.6 - - -Central Piedmont 98.2 99.7 98.2 99.3 99.4 - - -Cleveland 100.0 100.0 100.0 100.0 100.0 - 100.0 -Coastal Carolina 100.0 100.0 100.0 100.0 100.0 - - -Coll. of Albemarle 100.0 99.9 100.0 100.0 100.0 - - -Craven 100.0 98.6 100.0 100.0 100.0 - - -Davidson County 99.2 99.1 100.0 100.0 71.1 - 100.0 -Durham 91.0 99.9 100.0 100.0 100.0 - - -Edgecombe 100.0 92.3 100.0 100.0 100.0 100.0 - -Fayetteville 100.0 97.0 - 100.0 83.4 - 100.0 100.0

Table 25a. Accessible Area by Instruction, Research, and Public Service Subprograms
GeneralAcademic
Instruction11
VocationalTechnical
Instruction12
PreparatoryRemedial
Instruction13
GeneralStudies
14
OccupationalRelated
Instruction15
SocialRoles
Instruction16
Home &Family Life
17
PersonalLeisure
Instruction18
Forsyth 100.0 99.2 100.0 100.0 100.0 - 100.0 100.0Gaston 100.0 98.9 100.0 100.0 30.1 100.0 - -Guilford 100.0 95.4 100.0 98.5 95.1 - - 100.0Halifax 100.0 100.0 100.0 100.0 100.0 - - -Haywood 100.0 97.5 100.0 100.0 100.0 - - 100.0Isothermal 94.5 96.2 100.0 95.8 100.0 - - 55.4James Sprunt 100.0 93.5 100.0 100.0 100.0 - - -Johnston - 99.8 100.0 100.0 100.0 - - -Lenoir 99.8 95.2 100.0 100.0 100.0 - - 100.0Martin 100.0 90.1 100.0 100.0 98.0 - - 100.0Mayland 100.0 99.9 100.0 100.0 100.0 - - -McDowell 100.0 96.9 100.0 100.0 100.0 - - -Mitchell 92.0 99.4 100.0 99.7 100.0 - - 60.1Montgomery 100.0 100.0 100.0 - 99.0 - - -Nash 100.0 99.3 - 100.0 99.3 100.0 - -Pamlico 100.0 99.9 - 100.0 100.0 - - -Piedmont 100.0 98.0 100.0 98.7 100.0 - - -Pitt 100.0 100.0 100.0 100.0 100.0 100.0 - 100.0Randolph 100.0 99.9 100.0 100.0 100.0 - - -Richmond 100.0 99.0 100.0 69.9 100.0 - - -Roanoke-Chowan 100.0 100.0 100.0 100.0 100.0 100.0 - -Robeson 100.0 100.0 100.0 100.0 100.0 - - -Rockingham 86.9 94.0 100.0 100.0 74.2 - - -Rowan-Cabarrus 100.0 100.0 100.0 100.0 100.0 - - 100.0Sampson 100.0 98.5 100.0 100.0 100.0 100.0 100.0 100.0Sandhills 99.8 97.2 100.0 100.0 100.0 - - -South Piedmont 100.0 100.0 100.0 100.0 100.0 - - -Southeastern 98.3 100.0 91.1 100.0 100.0 - - -Southwestern 100.0 100.0 100.0 100.0 82.4 - - -Stanly - 100.0 100.0 100.0 100.0 - - -Surry 97.2 99.8 100.0 100.0 100.0 - - -Tri-County 100.0 99.8 100.0 100.0 76.1 - 100.0 100.0Vance-Granville 97.6 100.0 100.0 100.0 100.0 100.0 - 100.0Wake 100.0 99.5 - 98.3 100.0 - - 100.0Wayne 100.0 98.3 - 100.0 100.0 - - -Western Piedmont 99.9 99.7 - 100.0 100.0 - - -Wilkes 100.0 98.2 - 100.0 100.0 - - -Wilson 100.0 97.7 100.0 100.0 100.0 - - -Subtotal 98.7 98.6 99.5 99.0 94.4 100.0 100.0 97.2
Private InstitutionsNC Private Universities
Barton 99.9 - - - - - - -Campbell 96.9 - - - - - - -Mars Hill 69.9 - - - - - - -Pfeiffer 85.1 - - - - - - -Subtotal 89.4 - - - - - - -
Grand Total 95.5 98.6 99.0 99.1 94.7 100.0 100.0 97.5
139

140
Table 25a. Accessible Area by Instruction, Research, and Public Service Subprograms
Institutes& Research
Centers21
Individualor ProjectResearch
22
DirectPatient
Care31
HealthCare
Services32
CommunityServices
33
CooperativeExtension
Services34
PublicBroadcasting
Services35
Public InstitutionsResearch Universities I
NC State 58.9 86.7 - 100.0 80.2 77.6 100.0NC State Veterinary Med - 92.3 100.0 97.0 - - -UNC-Chapel Hill 99.4 100.0 100.0 100.0 99.6 100.0 99.9UNC-Chapel Hill Hlth Aff. 100.0 99.9 100.0 99.5 100.0 100.0 -Subtotal 64.4 92.6 100.0 98.8 83.1 78.3 99.9
Doctoral Universities I and IIEast Carolina 28.4 94.8 - 57.7 100.0 - 100.0East Carolina Hlth Aff. - 100.0 100.0 100.0 100.0 - -NC A&T 100.0 98.8 - - 100.0 100.0 100.0UNC Charlotte 99.2 98.7 - - 100.0 - -UNC Greensboro - 90.7 99.8 - 96.9 - -Subtotal 85.6 96.6 100.0 98.8 99.7 100.0 100.0
Master's (Comprehensive) Universities and Colleges IAppalachian 100.0 62.6 100.0 - 20.5 - -Fayetteville - 100.0 - - 100.0 - 100.0NC Central 99.0 97.1 - - 100.0 - 94.7UNC Pembroke - 100.0 - - 100.0 - -UNC Wilmington 80.1 94.1 - - 87.6 - -Western Carolina 83.7 100.0 - - 100.0 - 100.0Winston-Salem - 94.0 - - 95.4 - 100.0Subtotal 85.3 92.8 100.0 - 48.3 - 95.4
Baccalaureate (Liberal Arts) Universities and Colleges I and IIElizabeth City - 100.0 - - 100.0 - 100.0UNC Asheville 100.0 100.0 - - 100.0 - -Subtotal 100.0 100.0 - - 100.0 - 100.0
Schools of Art, Music, and DesignUNC School of the Arts - - - - 100.0 - -Subtotal - - - - 100.0 - -
Teaching HospitalsUNC Hospitals - 100.0 79.7 89.1 - - -Subtotal - 100.0 79.7 89.1 - - -
Community CollegesAlamance - - - - 100.0 - -Asheville-Buncombe - - - - 100.0 100.0 -Beaufort Co. - - - - 100.0 - 100.0Bladen - - - - 100.0 - -Blue Ridge - - - - 100.0 - -Brunswick - - - - 100.0 - -Caldwell - - - - 100.0 - -Cape Fear - 100.0 - - 100.0 - -Carteret - - - - - - -Catawba Valley - - - - - - -Central Carolina - - - 100.0 100.0 - -Central Piedmont - - - - - - 97.5Cleveland - - - - 100.0 - -Coastal Carolina - - - - 100.0 - -Coll. of Albemarle - - - - 100.0 - -Craven - - - - 100.0 - 100.0Davidson County - - - - 54.4 - -Durham - - - - - - -Edgecombe - - - - 100.0 - -Fayetteville - - - - 100.0 - -

141
Table 25a. Accessible Area by Instruction, Research, and Public Service Subprograms
Institutes& Research
Centers21
Individualor ProjectResearch
22
DirectPatient
Care31
HealthCare
Services32
CommunityServices
33
CooperativeExtension
Services34
PublicBroadcasting
Services35
Forsyth - - - - 100.0 - 100.0Gaston - 100.0 - - - - -Guilford - - - - 85.5 - -Halifax - - - - 98.8 - -Haywood - - - - 100.0 - -Isothermal - - - - 100.0 - 100.0James Sprunt - - - - 100.0 - -Johnston - - - - - - -Lenoir - - - - 100.0 - -Martin - - - - 100.0 - -Mayland - - - - 22.9 - -McDowell - - - - 100.0 - -Mitchell - - - - 100.0 - -Montgomery - - - - 100.0 - -Nash - - - - 100.0 - -Pamlico - - - - 100.0 - -Piedmont - - - - 97.6 - -Pitt - - - - - - -Randolph - - - - - - -Richmond - - - - 99.8 - -Roanoke-Chowan - - - - 100.0 - -Robeson - - - - 100.0 100.0 -Rockingham - - - - 97.5 - -Rowan-Cabarrus - - - - 100.0 100.0 -Sampson - - - - 100.0 - -Sandhills - - - - - - -South Piedmont - - - - 100.0 - -Southeastern - - - - 100.0 - 100.0Southwestern - - - - 100.0 - -Stanly - - - - 100.0 - -Surry - - - - - - -Tri-County - - - - 100.0 - -Vance-Granville - - - 100.0 100.0 - -Wake - - - - - - -Wayne - - - - 100.0 - -Western Piedmont - - - - - - -Wilkes - - - 100.0 - - -Wilson - - - - 100.0 - -Subtotal - 100.0 - 100.0 96.9 100.0 98.2
Private InstitutionsNC Private Universities
Barton - - - - - - -Campbell - 100.0 - - - - -Mars Hill - - - - 86.1 - -Pfeiffer - - - - 100.0 - -Subtotal - 100.0 - - 88.5 - -
Grand Total 71.5 93.3 88.8 92.1 85.3 81.0 98.4

142
Table 25b. Accessible Area by Academic Support Subprograms
LibraryServices
41
Museums &Galleries
42
Educational& MediaServices
43
AcademicComputing
Support44
AncillarySupport
45
AcademicAdmin.
46
Course &Curriculum
Dev.47
AcademicPersonnel
Dev.48
Public InstitutionsResearch Universities I
NC State 99.9 - 99.6 89.7 62.3 98.9 - 100.0NC State Veterinary Med 100.0 - 100.0 100.0 - 100.0 - -UNC-Chapel Hill 100.0 100.0 100.0 100.0 100.0 99.8 100.0 99.8UNC-Chapel Hill Hlth Aff. 99.9 100.0 98.5 100.0 99.7 99.8 100.0 100.0Subtotal 99.9 86.5 99.6 95.6 95.7 99.3 100.0 99.8
Doctoral Universities I and IIEast Carolina 99.7 100.0 100.0 100.0 - 85.3 - -East Carolina Hlth Aff. 100.0 - 100.0 - 100.0 100.0 - -NC A&T 100.0 100.0 100.0 100.0 95.0 98.7 - -UNC Charlotte 93.7 94.7 100.0 93.8 - 95.4 100.0 -UNC Greensboro 85.4 99.6 100.0 36.5 98.2 93.5 - 100.0Subtotal 95.4 99.6 100.0 79.1 95.6 95.1 100.0 100.0
Master's (Comprehensive) Universities and Colleges IAppalachian 100.0 - 100.0 100.0 100.0 100.0 - -Fayetteville 100.0 100.0 100.0 100.0 100.0 100.0 - -NC Central 99.3 100.0 100.0 100.0 59.1 92.5 - 100.0UNC Pembroke 100.0 100.0 100.0 100.0 - 100.0 - 100.0UNC Wilmington 99.3 100.0 - 88.3 - 98.5 - 100.0Western Carolina 100.0 82.7 57.6 18.4 100.0 93.1 - 100.0Winston-Salem 100.0 92.9 100.0 100.0 31.2 91.2 - -Subtotal 99.8 91.8 96.6 92.5 87.2 96.2 - 100.0
Baccalaureate (Liberal Arts) Universities and Colleges I and IIElizabeth City 100.0 100.0 - 100.0 90.3 100.0 - -UNC Asheville 100.0 100.0 100.0 100.0 - 100.0 - 100.0Subtotal 100.0 100.0 100.0 100.0 90.3 100.0 - 100.0
Schools of Art, Music, and DesignUNC School of the Arts 100.0 100.0 100.0 42.2 100.0 64.8 - -Subtotal 100.0 100.0 100.0 42.2 100.0 64.8 - -
Teaching HospitalsUNC Hospitals - - - - - - - -Subtotal - - - - - - - -
Community CollegesAlamance 100.0 100.0 - - 100.0 100.0 - -Asheville-Buncombe 100.0 - 100.0 100.0 100.0 100.0 - -Beaufort Co. 100.0 - 100.0 100.0 - 100.0 - -Bladen 100.0 - - - - 95.4 - -Blue Ridge 100.0 100.0 100.0 - - 100.0 - 100.0Brunswick 100.0 - 100.0 100.0 - 100.0 - -Caldwell 100.0 - 100.0 - - 100.0 - -Cape Fear 100.0 100.0 100.0 100.0 100.0 100.0 - -Carteret 100.0 - - - - 76.4 - -Catawba Valley 100.0 100.0 100.0 100.0 100.0 100.0 - -Central Carolina 98.2 - 100.0 - 100.0 100.0 - -Central Piedmont 99.8 100.0 92.7 100.0 - 99.7 100.0 100.0Cleveland 100.0 100.0 100.0 - - 100.0 - -Coastal Carolina 100.0 - 100.0 100.0 - 100.0 - -Coll. of Albemarle 100.0 100.0 - - - 100.0 - -Craven 46.9 - - 100.0 - 100.0 - -Davidson County 97.5 - 61.8 - 100.0 95.8 - -Durham 100.0 - 96.7 100.0 - 100.0 100.0 100.0Edgecombe 97.3 - 100.0 100.0 - 100.0 100.0 -Fayetteville 100.0 100.0 100.0 100.0 93.4 94.9 - -

143
Table 25b. Accessible Area by Academic Support Subprograms
LibraryServices
41
Museums &Galleries
42
Educational& MediaServices
43
AcademicComputing
Support44
AncillarySupport
45
AcademicAdmin.
46
Course &Curriculum
Dev.47
AcademicPersonnel
Dev.48
Forsyth 98.4 - 100.0 100.0 - 99.8 100.0 100.0Gaston 100.0 100.0 100.0 100.0 100.0 100.0 - -Guilford 99.7 - 100.0 - 51.5 97.3 - -Halifax 100.0 - - - 100.0 100.0 - -Haywood 100.0 100.0 100.0 100.0 - 100.0 - -Isothermal 16.2 - - - - 100.0 - -James Sprunt 100.0 100.0 100.0 100.0 - 100.0 - 100.0Johnston 100.0 100.0 100.0 - 100.0 100.0 - -Lenoir 98.4 100.0 100.0 100.0 - 100.0 - -Martin 100.0 - - - - 84.1 - -Mayland 100.0 - 100.0 - - 100.0 - -McDowell 100.0 100.0 - - - 100.0 - -Mitchell 99.7 100.0 100.0 - - 97.6 - -Montgomery 100.0 - - - - 100.0 - -Nash 100.0 100.0 - - - 100.0 - 100.0Pamlico 100.0 - 100.0 - - 100.0 - -Piedmont 100.0 - 100.0 100.0 100.0 100.0 - -Pitt 100.0 - 100.0 100.0 100.0 96.7 - -Randolph 100.0 - 100.0 100.0 - 100.0 - -Richmond 100.0 - 100.0 100.0 - 100.0 - -Roanoke-Chowan 100.0 - - - - 100.0 - -Robeson 100.0 - 100.0 - - 100.0 - -Rockingham 100.0 100.0 - - 100.0 92.2 - -Rowan-Cabarrus 100.0 - 100.0 100.0 100.0 100.0 100.0 100.0Sampson 100.0 - - 100.0 - 100.0 - -Sandhills 99.8 100.0 100.0 - 100.0 100.0 - -South Piedmont 100.0 - 100.0 - - 100.0 - -Southeastern 100.0 100.0 100.0 100.0 100.0 100.0 - -Southwestern 100.0 - 100.0 100.0 100.0 100.0 - -Stanly 100.0 - 100.0 100.0 - 100.0 - -Surry 100.0 - 100.0 100.0 - 100.0 - -Tri-County 82.3 - - 100.0 100.0 100.0 - -Vance-Granville 80.2 - - - 100.0 100.0 - -Wake 100.0 - 100.0 - 100.0 100.0 - -Wayne 100.0 - 100.0 100.0 100.0 100.0 100.0 -Western Piedmont 100.0 - 100.0 100.0 - 100.0 - -Wilkes 100.0 100.0 100.0 - 100.0 100.0 - -Wilson 99.3 - - - - 100.0 - -Subtotal 97.3 100.0 98.7 99.8 87.6 98.7 100.0 100.0
Private InstitutionsNC Private Universities
Barton 100.0 100.0 100.0 - - 91.0 - -Campbell 100.0 100.0 91.9 100.0 100.0 90.2 100.0 100.0Mars Hill 100.0 74.4 100.0 - - 44.7 - -Pfeiffer 49.1 - 100.0 - - 100.0 - 100.0Subtotal 90.6 89.9 96.7 100.0 100.0 85.0 100.0 100.0
Grand Total 98.0 93.9 98.8 92.6 92.1 96.9 100.0 99.9

144
Table 25c. Accessible Area by Student Service and Physical Plant Operations Subprograms
StudentSvcs
Admin51
Social &Cultural
Dev.52
Couns /Career
Guid.53
Finan.Aid
Admin.54
StudentAux. Svcs
55
Inter-coll Athl.
56
StudentHlth/Med
Svc.57
Phys.Plant
Admin.71
Bldg.Maint.
72
Cust'lSvcs.
73Utilities
74
LandscpGrounds
Maint.75
Public InstitutionsResearch Universities I
NC State 89.4 93.0 94.9 100.0 63.7 88.9 97.2 100.0 89.4 100.0 84.4 58.7NC State Veterinary Med - - - - 100.0 - - 100.0 99.0 100.0 100.0 -UNC-Chapel Hill 99.9 100.0 100.0 98.8 99.9 100.0 99.9 100.0 100.0 100.0 99.9 99.9UNC-Chapel Hill Hlth Aff. 99.8 100.0 100.0 100.0 99.9 - - - 100.0 99.6 100.0 100.0Subtotal 97.1 96.7 98.2 99.4 84.5 96.1 98.5 100.0 96.6 99.9 97.0 79.5
Doctoral Universities I and IIEast Carolina 53.0 86.1 78.4 100.0 100.0 99.7 96.3 69.9 17.7 100.0 - 71.3East Carolina Hlth Aff. - - - - - - - - - 100.0 100.0 -NC A&T 100.0 96.6 100.0 100.0 74.8 90.6 100.0 100.0 87.7 100.0 1.2 100.0UNC Charlotte 85.7 79.5 97.4 100.0 94.0 95.7 99.4 97.9 53.9 84.3 16.9 -UNC Greensboro 100.0 82.0 96.3 100.0 85.2 76.6 99.1 100.0 99.4 88.6 64.0 56.9Subtotal 85.8 84.3 95.5 100.0 90.3 93.7 98.8 88.7 52.3 93.5 74.7 66.2
Master's (Comprehensive) Universities and Colleges IAppalachian - 99.4 100.0 97.0 68.9 100.0 100.0 97.3 81.8 - 100.0 -Fayetteville 100.0 100.0 100.0 100.0 70.8 98.2 100.0 100.0 100.0 100.0 100.0 100.0NC Central 100.0 94.0 86.1 100.0 91.9 80.7 82.4 53.6 82.5 100.0 100.0 100.0UNC Pembroke 100.0 81.6 100.0 100.0 80.5 100.0 44.6 100.0 100.0 98.7 100.0 100.0UNC Wilmington 100.0 85.7 100.0 - 62.8 74.3 100.0 100.0 100.0 97.1 98.5 96.9Western Carolina 100.0 98.6 100.0 100.0 45.9 94.4 100.0 100.0 87.7 100.0 100.0 100.0Winston-Salem 75.1 100.0 100.0 100.0 85.5 99.0 65.4 66.2 98.8 96.3 100.0 100.0Subtotal 99.2 95.4 96.8 98.9 68.9 91.5 89.2 96.8 88.5 97.9 99.7 99.1
Baccalaureate (Liberal Arts) Universities and Colleges I and IIElizabeth City 100.0 100.0 100.0 100.0 70.6 95.0 - 100.0 100.0 - 100.0 -UNC Asheville 100.0 93.8 100.0 100.0 97.5 79.6 100.0 - 100.0 100.0 100.0 -Subtotal 100.0 95.7 100.0 100.0 82.6 82.4 29.6 100.0 100.0 100.0 100.0 -
Schools of Art, Music, and DesignUNC School of the Arts 100.0 92.3 100.0 100.0 81.5 - 44.6 37.3 - - - -Subtotal 100.0 92.3 100.0 100.0 81.5 - 44.6 37.3 - - - -
Teaching HospitalsUNC Hospitals - - - - - - - - 100.0 94.3 - -Subtotal - - - - - - - - 100.0 94.3 - -
Community CollegesAlamance 100.0 100.0 100.0 100.0 100.0 - - - 100.0 - - -Asheville-Buncombe 100.0 96.2 86.4 100.0 100.0 - - 100.0 100.0 100.0 - 100.0Beaufort Co. 100.0 100.0 100.0 90.0 100.0 - - - 100.0 - - -Bladen 100.0 100.0 100.0 100.0 100.0 - - - 100.0 100.0 100.0 100.0Blue Ridge 100.0 100.0 100.0 - 100.0 - - - 100.0 100.0 - 100.0Brunswick 100.0 100.0 100.0 100.0 100.0 - 100.0 - 100.0 100.0 - 100.0Caldwell 100.0 93.0 100.0 100.0 100.0 - - 100.0 100.0 - - 100.0Cape Fear 100.0 100.0 100.0 100.0 93.5 - - 100.0 100.0 96.0 - -Carteret 100.0 87.9 100.0 100.0 87.3 - - 100.0 - 100.0 - 100.0Catawba Valley 100.0 100.0 100.0 100.0 100.0 - - - - - - -Central Carolina 100.0 100.0 100.0 100.0 100.0 - - - - 100.0 - -Central Piedmont 98.3 99.9 100.0 98.4 99.4 - - 100.0 97.8 97.1 - 67.3Cleveland 100.0 100.0 - 100.0 100.0 - - 100.0 100.0 100.0 - -Coastal Carolina 100.0 100.0 100.0 100.0 100.0 - - 100.0 100.0 100.0 - -Coll. of Albemarle 100.0 100.0 100.0 100.0 100.0 - - - 100.0 - - -Craven 100.0 100.0 100.0 - 99.1 - - - 75.4 100.0 - -Davidson County 100.0 100.0 100.0 - 100.0 - - 100.0 100.0 - 100.0 -Durham 100.0 100.0 100.0 100.0 100.0 - - - 3.4 30.0 - 100.0Edgecombe 100.0 100.0 100.0 100.0 100.0 - - 100.0 100.0 100.0 - -Fayetteville 100.0 95.0 100.0 100.0 100.0 - 100.0 100.0 33.2 77.8 100.0 69.1

145
Table 25c. Accessible Area by Student Service and Physical Plant Operations Subprograms
StudentSvcs
Admin51
Social &Cultural
Dev.52
Couns /Career
Guid.53
Finan.Aid
Admin.54
StudentAux. Svcs
55
Inter-coll Athl.
56
StudentHlth/Med
Svc.57
Phys.Plant
Admin.71
Bldg.Maint.
72
Cust'lSvcs.
73Utilities
74
LandscpGrounds
Maint.75
Forsyth 100.0 100.0 100.0 100.0 100.0 100.0 - 100.0 100.0 100.0 11.9 100.0Gaston 100.0 97.5 100.0 100.0 99.2 - 100.0 - 72.1 100.0 100.0 76.4Guilford 100.0 93.3 100.0 100.0 99.9 100.0 100.0 100.0 93.6 100.0 51.8 100.0Halifax 100.0 100.0 100.0 100.0 100.0 - - 100.0 98.4 - - -Haywood 100.0 100.0 100.0 100.0 100.0 - - 100.0 100.0 100.0 - 100.0Isothermal 100.0 100.0 100.0 100.0 100.0 - - 100.0 82.2 100.0 100.0 -James Sprunt 100.0 100.0 100.0 100.0 100.0 - - - 65.3 100.0 - -Johnston 100.0 100.0 100.0 100.0 99.1 - - 100.0 100.0 100.0 - -Lenoir - 100.0 100.0 100.0 100.0 100.0 - 100.0 100.0 - - 100.0Martin 100.0 68.5 100.0 100.0 100.0 - - 100.0 100.0 100.0 - -Mayland - 100.0 100.0 100.0 100.0 - - - 73.5 100.0 - -McDowell 100.0 - 100.0 100.0 98.4 - - - 100.0 - - 100.0Mitchell 100.0 68.4 87.2 100.0 69.1 - - - 100.0 100.0 - -Montgomery 100.0 100.0 100.0 100.0 100.0 - - 100.0 100.0 100.0 - 100.0Nash 98.4 100.0 100.0 100.0 100.0 - - - 100.0 - - -Pamlico 100.0 - 100.0 100.0 100.0 - - - 76.9 - - -Piedmont 100.0 100.0 100.0 100.0 100.0 - - - 100.0 100.0 - 100.0Pitt 100.0 100.0 100.0 100.0 100.0 100.0 - 100.0 - - - -Randolph 100.0 100.0 100.0 100.0 99.7 - - 100.0 100.0 100.0 - -Richmond 100.0 20.9 100.0 100.0 55.6 - 100.0 - 50.7 20.7 - -Roanoke-Chowan - 100.0 100.0 100.0 100.0 - - - - - - 100.0Robeson 100.0 100.0 100.0 100.0 100.0 - - 100.0 100.0 100.0 - -Rockingham 100.0 98.7 100.0 100.0 99.3 - - 100.0 100.0 100.0 - 100.0Rowan-Cabarrus 100.0 100.0 100.0 100.0 100.0 - - 100.0 100.0 100.0 - -Sampson 100.0 100.0 100.0 100.0 100.0 - - 100.0 100.0 - - -Sandhills 100.0 98.5 100.0 100.0 100.0 - - - - 100.0 - -South Piedmont 100.0 100.0 100.0 100.0 100.0 - - 100.0 98.4 100.0 - -Southeastern - 100.0 99.1 100.0 100.0 - - 100.0 100.0 - - -Southwestern 100.0 100.0 100.0 100.0 100.0 - - - - 100.0 - -Stanly 100.0 100.0 100.0 100.0 100.0 - - 100.0 100.0 - - -Surry 100.0 80.4 100.0 100.0 100.0 100.0 - 100.0 100.0 - - -Tri-County 100.0 100.0 100.0 100.0 100.0 - - - - - 100.0 -Vance-Granville 100.0 - 100.0 100.0 100.0 100.0 - 100.0 100.0 - - -Wake 100.0 100.0 100.0 100.0 100.0 100.0 - 100.0 83.3 - - -Wayne 100.0 98.9 100.0 100.0 100.0 - 100.0 - 100.0 - - -Western Piedmont 98.3 100.0 100.0 100.0 98.8 100.0 - 100.0 51.6 100.0 - -Wilkes 100.0 93.9 100.0 100.0 100.0 - - 100.0 100.0 100.0 - 100.0Wilson 100.0 100.0 100.0 100.0 100.0 - - 100.0 100.0 100.0 - -Subtotal 99.7 94.1 99.4 99.7 98.5 100.0 100.0 94.7 82.0 95.1 36.3 81.6
Private InstitutionsNC Private Universities
Barton 100.0 100.0 100.0 100.0 81.8 100.0 100.0 100.0 100.0 100.0 - 100.0Campbell 25.9 89.6 81.9 100.0 50.4 81.0 100.0 100.0 97.4 100.0 - 100.0Mars Hill 100.0 64.8 100.0 100.0 37.1 76.6 39.8 98.4 100.0 - - -Pfeiffer 100.0 71.2 100.0 100.0 34.4 75.2 100.0 - 9.8 - - -Subtotal 62.6 77.4 87.5 100.0 49.5 82.2 78.1 93.9 82.2 82.4 - 100.0
Grand Total 95.6 91.9 98.2 99.6 79.9 93.4 92.0 94.6 80.1 96.8 89.4 76.9

146
Table 25d. Accessible Area by Institutional Administration, Independent Operations and Unassigned Subprograms
Ind. Operations UnassignedExec.Mgmt
61
Fin.Mgmt
62
Gen AdLog Svc
63
AdminComp
64
Fac/StfAux. Svcs
65P.R. Devel.
66
Stud.Admiss
67
Stud.Records
68Inst.
91
Ext.Agency
92Usable
01Unusable
02Public Institutions
Research Universities INC State 99.6 99.5 99.1 94.9 38.4 98.6 100.0 100.0 84.3 96.5 80.5 60.0NC State Veterinary Med - - 100.0 100.0 100.0 - - - - 100.0 - -UNC-Chapel Hill 99.9 100.0 99.9 100.0 100.0 99.6 99.8 100.0 100.0 99.7 99.0 99.6UNC-Chapel Hill Hlth Aff. 100.0 100.0 100.0 99.9 99.6 100.0 100.0 100.0 100.0 100.0 99.6 100.0Subtotal 99.7 99.9 99.5 97.5 52.1 99.1 99.9 100.0 98.8 97.3 92.5 71.8
Doctoral Universities I and IIEast Carolina 88.3 70.1 88.5 99.0 96.3 89.6 55.0 79.2 - 100.0 61.4 1.7East Carolina Hlth Aff. - 100.0 100.0 100.0 - 100.0 - 100.0 - - 100.0 100.0NC A&T 100.0 100.0 100.0 100.0 83.2 100.0 100.0 100.0 - 100.0 100.0 100.0UNC Charlotte 90.4 77.7 87.1 98.4 90.4 97.9 100.0 93.3 - - 100.0 98.3UNC Greensboro 99.8 100.0 96.7 99.4 75.1 96.6 96.3 100.0 - 100.0 1.4 78.4Subtotal 93.3 82.8 96.1 99.3 85.7 96.1 90.1 92.8 - 100.0 57.3 36.8
Master's (Comprehensive) Universities and Colleges IAppalachian 100.0 90.8 73.4 100.0 91.9 74.2 85.4 17.0 100.0 100.0 - 100.0Fayetteville 98.0 100.0 100.0 100.0 98.5 69.4 100.0 100.0 100.0 100.0 86.7 100.0NC Central 100.0 100.0 63.6 97.2 92.5 70.2 29.5 100.0 100.0 99.4 77.1 89.7UNC Pembroke 100.0 100.0 100.0 - 100.0 95.0 100.0 100.0 - - - -UNC Wilmington 98.9 93.7 96.1 100.0 52.5 73.9 100.0 99.4 - - - 88.5Western Carolina 78.1 100.0 100.0 98.8 7.2 80.4 100.0 100.0 100.0 100.0 100.0 89.2Winston-Salem 90.0 61.6 44.9 97.4 50.8 60.3 100.0 100.0 100.0 100.0 2.9 67.7Subtotal 94.7 90.5 83.2 97.9 45.8 75.5 87.3 79.8 100.0 99.8 72.1 90.1
Baccalaureate (Liberal Arts) Universities and Colleges I and IIElizabeth City 100.0 100.0 98.9 100.0 21.0 100.0 100.0 100.0 - - 100.0 54.7UNC Asheville 70.7 100.0 57.2 100.0 100.0 100.0 100.0 100.0 - 100.0 100.0 -Subtotal 84.3 100.0 87.4 100.0 44.5 100.0 100.0 100.0 - 100.0 100.0 54.7
Schools of Art, Music, and DesignUNC School of the Arts 72.7 100.0 17.1 100.0 100.0 35.8 100.0 100.0 100.0 - 20.6 100.0Subtotal 72.7 100.0 17.1 100.0 100.0 35.8 100.0 100.0 100.0 - 20.6 100.0
Teaching HospitalsUNC Hospitals 100.0 100.0 100.0 100.0 100.0 100.0 - - - 100.0 100.0 100.0Subtotal 100.0 100.0 100.0 100.0 100.0 100.0 - - - 100.0 100.0 100.0
Community CollegesAlamance 100.0 100.0 100.0 100.0 100.0 100.0 100.0 100.0 - 100.0 - -Asheville-Buncombe 48.8 100.0 78.7 100.0 81.8 - 100.0 100.0 - 98.1 95.4 96.4Beaufort Co. 100.0 100.0 98.4 100.0 100.0 100.0 87.3 90.2 - 100.0 - -Bladen 98.2 100.0 100.0 - 100.0 100.0 - 100.0 - 100.0 - -Blue Ridge 100.0 100.0 100.0 100.0 100.0 100.0 - 100.0 - 100.0 - -Brunswick 100.0 90.4 100.0 87.9 100.0 100.0 100.0 100.0 90.2 100.0 100.0 100.0Caldwell 100.0 100.0 85.1 100.0 100.0 100.0 100.0 100.0 - 100.0 100.0 -Cape Fear 100.0 100.0 99.2 100.0 95.3 100.0 100.0 100.0 - 100.0 100.0 100.0Carteret 92.4 100.0 100.0 100.0 100.0 100.0 100.0 100.0 - 100.0 - -Catawba Valley 100.0 100.0 100.0 100.0 100.0 100.0 100.0 100.0 - 100.0 100.0 100.0Central Carolina 100.0 100.0 100.0 100.0 100.0 100.0 100.0 100.0 100.0 - 100.0 -Central Piedmont 99.4 98.8 98.7 97.3 100.0 99.8 99.6 98.6 100.0 100.0 - 95.0Cleveland 99.0 100.0 80.4 100.0 100.0 100.0 100.0 100.0 - 100.0 100.0 -Coastal Carolina 100.0 100.0 88.2 100.0 100.0 100.0 - 100.0 - - - -Coll. of Albemarle 100.0 100.0 100.0 100.0 100.0 100.0 100.0 100.0 - 100.0 100.0 -Craven 100.0 100.0 89.8 100.0 - 100.0 100.0 100.0 - 99.6 - -Davidson County 100.0 100.0 100.0 - 99.4 100.0 - 100.0 - 89.9 - -Durham 100.0 100.0 74.4 100.0 100.0 100.0 100.0 100.0 - 100.0 - -Edgecombe 100.0 100.0 100.0 100.0 100.0 100.0 100.0 100.0 100.0 75.2 - -Fayetteville 100.0 99.6 79.6 100.0 100.0 100.0 100.0 100.0 - 100.0 - -

147
Table 25d. Accessible Area by Institutional Administration, Independent Operations and Unassigned Subprograms
Ind. Operations UnassignedExec.Mgmt
61
Fin.Mgmt
62
Gen AdLog Svc
63
AdminComp
64
Fac/StfAux. Svcs
65P.R. Devel.
66
Stud.Admiss
67
Stud.Records
68Inst.
91
Ext.Agency
92Usable
01Unusable
02Forsyth 100.0 100.0 100.0 100.0 100.0 100.0 100.0 92.2 - 100.0 100.0 100.0Gaston 42.6 100.0 82.3 100.0 100.0 100.0 100.0 100.0 - 100.0 100.0 -Guilford 100.0 94.5 94.1 75.9 65.4 100.0 94.2 100.0 - 99.3 13.4 100.0Halifax 98.3 100.0 99.2 100.0 91.5 100.0 100.0 100.0 - 100.0 - -Haywood 100.0 100.0 59.3 100.0 100.0 100.0 100.0 100.0 - 100.0 46.9 100.0Isothermal 99.1 100.0 100.0 93.6 100.0 - 100.0 100.0 - 100.0 - -James Sprunt 100.0 100.0 100.0 100.0 100.0 100.0 - 100.0 - 100.0 - -Johnston 100.0 100.0 100.0 100.0 56.6 100.0 100.0 100.0 - 100.0 - -Lenoir 100.0 100.0 98.1 100.0 100.0 100.0 100.0 100.0 - 100.0 - -Martin 83.0 94.4 100.0 100.0 87.9 100.0 100.0 - - 100.0 - -Mayland 100.0 100.0 61.8 100.0 100.0 100.0 100.0 100.0 - 100.0 - 100.0McDowell 94.8 98.0 97.7 100.0 97.4 100.0 - 100.0 - 100.0 - -Mitchell 85.4 100.0 62.2 100.0 50.5 - 100.0 - - 100.0 79.6 81.7Montgomery 100.0 100.0 100.0 100.0 - 100.0 100.0 100.0 - 100.0 - -Nash 100.0 100.0 88.6 100.0 81.6 100.0 73.1 100.0 100.0 - - -Pamlico 100.0 95.3 100.0 100.0 - - - 100.0 - 100.0 - -Piedmont 98.3 100.0 100.0 100.0 100.0 100.0 100.0 100.0 - 100.0 - -Pitt 98.6 97.6 100.0 100.0 100.0 100.0 100.0 100.0 - 100.0 100.0 -Randolph 100.0 100.0 99.4 100.0 100.0 100.0 - 100.0 100.0 100.0 - 100.0Richmond 100.0 100.0 100.0 100.0 100.0 100.0 100.0 56.5 - 100.0 - 100.0Roanoke-Chowan 98.0 100.0 31.7 100.0 - - 100.0 100.0 - 100.0 - -Robeson 100.0 100.0 100.0 100.0 100.0 - 100.0 100.0 100.0 100.0 100.0 -Rockingham 99.0 100.0 100.0 100.0 100.0 100.0 100.0 100.0 - 99.4 100.0 -Rowan-Cabarrus 100.0 100.0 99.7 100.0 100.0 100.0 100.0 100.0 - 100.0 100.0 100.0Sampson 98.0 100.0 100.0 100.0 - 100.0 100.0 100.0 - 100.0 - -Sandhills 100.0 100.0 100.0 100.0 32.3 74.9 88.9 93.6 - 100.0 - -South Piedmont 100.0 100.0 94.4 100.0 100.0 100.0 100.0 100.0 - 100.0 100.0 59.6Southeastern 100.0 100.0 100.0 100.0 100.0 100.0 100.0 100.0 - 100.0 97.2 100.0Southwestern 100.0 95.4 98.0 100.0 100.0 100.0 100.0 100.0 - 100.0 100.0 -Stanly 100.0 100.0 99.3 76.3 100.0 100.0 100.0 100.0 - 100.0 100.0 100.0Surry 100.0 96.4 100.0 70.5 60.6 100.0 100.0 100.0 - 85.3 - -Tri-County 100.0 100.0 93.5 100.0 - - 100.0 100.0 - - - -Vance-Granville 100.0 100.0 67.4 100.0 100.0 100.0 100.0 100.0 - 100.0 98.3 100.0Wake 100.0 100.0 74.4 100.0 100.0 100.0 100.0 100.0 - 100.0 100.0 100.0Wayne 98.5 100.0 96.2 100.0 100.0 100.0 100.0 100.0 100.0 100.0 - -Western Piedmont 100.0 100.0 80.9 100.0 100.0 100.0 100.0 100.0 - 100.0 30.6 -Wilkes 98.0 100.0 100.0 100.0 - 100.0 100.0 100.0 97.7 100.0 - 100.0Wilson 100.0 100.0 81.7 100.0 100.0 100.0 100.0 100.0 - - - -Subtotal 97.2 99.2 92.3 97.5 90.0 96.7 99.4 98.8 94.4 99.0 66.4 85.5
Private InstitutionsNC Private Universities
Barton 100.0 100.0 100.0 100.0 100.0 100.0 100.0 100.0 - - 100.0 -Campbell 87.1 80.3 77.3 98.6 30.6 2.4 85.5 95.7 - 88.9 100.0 -Mars Hill 100.0 100.0 85.2 100.0 10.6 19.9 100.0 100.0 - - - 73.4Pfeiffer 61.8 39.3 79.7 44.2 - 30.1 88.2 - - - 25.3 100.0Subtotal 90.1 77.1 84.3 90.1 30.7 46.4 89.6 83.1 - 88.9 28.7 71.3
Grand Total 95.9 95.4 92.9 97.8 59.3 88.3 95.4 92.8 95.2 98.6 73.4 67.7

This Page Intentionally Left Blank
148

TABLE 26:
ACCESSIBLE AREA BY ROOM CODES
Table 26 indicates for each of the ten summary room codes the amount and percentage of assignable area which is accessible to mobility impaired persons. It represents an additional source of information which, when viewed in conjunction with Tables 25-25d, creates a detailed profile of the accessible space on a campus.
Although such information can be useful to campus administrators in attempting to ensure that all programs are accessible to the mobility impaired, no absolute conclusions can be drawn from the data as to whether program accessibility has been achieved. It is clear, for example, that program accessibility does not require that an institution make all of its classrooms accessible. Instead, the institution can simply ensure that courses taken by mobility impaired students be scheduled in rooms which are accessible to them.
Dashes in Table 26 indicate that the institution in question did not have any assignable area under the indicated summary room code. A "0" in the "Sq. Ft." column (with an accompanying "0.0" in the "%" column) indicates that the institution did have assignable area under the indicated summary room code but that none of it was accessible. The chart on pp. 94-95 lists all of the room codes which comprise the summary codes used in this table.
149

150
Table 26. Accessible Area by Room Codes
InstitutionTotal Accessible
AreaClassroom Facilities
100Laboratory Facilities
200Office Facilities
300Study Facilities
400ASF % ASF % ASF % ASF %
Public InstitutionsResearch Universities I
NC State 7,105,516 261,810 99.6 1,528,757 95.2 1,799,173 97.7 342,680 98.4NC State Veterinary Med 379,336 7,986 98.1 87,113 84.8 81,494 98.0 11,186 100.0UNC-Chapel Hill 7,215,241 281,820 99.9 615,438 99.9 1,558,006 99.8 636,747 100.0UNC-Chapel Hill Hlth Aff. 2,527,534 76,943 99.9 713,636 99.9 1,077,589 99.9 76,697 100.0Subtotal 17,227,627 628,559 99.8 2,944,944 96.9 4,516,262 99.0 1,067,310 99.5
Doctoral Universities I and IIEast Carolina 2,766,847 186,356 98.6 299,163 93.2 573,750 88.7 208,077 99.7East Carolina Hlth Aff. 827,019 44,262 100.0 162,026 100.0 310,377 100.0 64,369 100.0NC A&T 2,048,691 142,064 97.2 319,089 98.8 415,575 97.4 133,315 100.0UNC Charlotte 3,284,067 211,337 91.8 535,128 98.8 703,539 94.6 212,512 94.8UNC Greensboro 2,652,612 149,779 97.6 311,858 95.4 556,018 91.4 121,434 88.8Subtotal 11,579,236 733,798 96.2 1,627,264 97.2 2,559,259 93.5 739,707 96.4
Master's (Comprehensive) Universities and Colleges IAppalachian 2,319,419 156,314 91.8 217,542 85.9 465,016 89.0 87,845 95.5Fayetteville 810,850 57,355 99.9 91,047 100.0 191,195 95.9 66,912 98.1NC Central 1,317,427 102,411 86.2 131,130 90.4 282,005 90.8 99,558 96.4UNC Pembroke 915,881 86,688 98.7 59,598 100.0 172,917 95.4 40,598 99.8UNC Wilmington 1,749,754 160,765 99.5 207,571 95.3 364,179 96.5 118,505 99.4Western Carolina 1,507,319 96,174 94.5 178,255 96.9 315,059 96.8 126,178 99.9Winston-Salem 935,912 56,253 77.9 73,902 75.9 182,344 85.2 47,024 100.0Subtotal 9,556,562 715,960 93.0 959,045 91.5 1,972,715 92.6 586,620 98.3
Baccalaureate (Liberal Arts) Universities and Colleges I and IIElizabeth City 718,949 61,688 93.8 80,804 99.9 108,845 97.2 39,922 92.8UNC Asheville 855,783 43,566 100.0 95,787 100.0 150,039 95.0 79,251 100.0Subtotal 1,574,732 105,254 96.3 176,591 100.0 258,884 95.9 119,173 97.5
Schools of Art, Music, and DesignUNC School of the Arts 612,264 20,854 66.9 176,418 94.2 70,414 78.5 21,245 100.0Subtotal 612,264 20,854 66.9 176,418 94.2 70,414 78.5 21,245 100.0
Teaching HospitalsUNC Hospitals 1,194,182 9,926 100.0 10,829 100.0 334,517 90.0 2,897 89.3Subtotal 1,194,182 9,926 100.0 10,829 100.0 334,517 90.0 2,897 89.3
Community CollegesAlamance 238,005 72,635 100.0 74,604 99.8 47,090 99.6 10,937 100.0Asheville-Buncombe 494,975 91,244 99.4 172,747 97.1 123,462 94.1 16,788 100.0Beaufort Co. 189,075 50,957 100.0 54,069 99.8 35,772 99.0 9,158 100.0Bladen 108,883 28,406 100.0 27,317 93.7 22,170 99.0 9,039 100.0Blue Ridge 290,314 67,396 100.0 93,661 100.0 44,116 100.0 13,885 100.0Brunswick 246,370 50,128 98.6 29,037 97.5 36,327 97.6 7,865 100.0Caldwell 338,030 88,515 100.0 81,936 99.6 62,078 100.0 19,006 100.0Cape Fear 606,908 111,682 99.2 202,169 97.7 143,798 99.5 30,844 100.0Carteret 157,809 40,963 96.1 58,810 99.6 33,162 95.8 6,761 100.0Catawba Valley 364,557 69,908 100.0 116,289 99.4 64,755 100.0 22,346 100.0Central Carolina 403,002 123,686 100.0 130,168 100.0 71,054 98.0 20,378 99.4Central Piedmont 1,274,931 337,563 99.7 342,166 98.6 271,600 99.1 64,781 99.9Cleveland 205,869 48,528 100.0 66,675 100.0 32,603 99.9 17,109 100.0Coastal Carolina 217,662 58,733 100.0 81,160 100.0 41,690 97.7 15,190 100.0Coll. of Albemarle 272,145 55,960 100.0 84,977 99.9 49,227 100.0 17,619 100.0Craven 200,230 50,838 100.0 70,726 98.5 45,073 99.7 10,664 56.3Davidson County 302,547 67,429 98.3 72,134 93.5 69,433 98.3 24,126 100.0Durham 303,207 89,855 100.0 96,524 99.5 70,517 95.5 15,221 100.0Edgecombe 161,175 34,950 98.3 39,311 88.1 30,272 99.5 12,038 97.7Fayetteville 598,317 154,996 93.0 189,574 97.0 127,729 97.6 28,030 100.0Forsyth 661,682 146,908 100.0 210,640 98.8 124,911 99.7 22,642 98.8

151
Table 26. Accessible Area by Room Codes
InstitutionTotal Accessible
AreaClassroom Facilities
100Laboratory Facilities
200Office Facilities
300Study Facilities
400ASF % ASF % ASF % ASF %
Gaston 449,552 107,403 100.0 131,040 86.6 104,308 98.0 31,040 100.0Guilford 833,985 196,381 96.4 263,002 95.5 162,703 96.8 32,462 99.8Halifax 186,839 37,203 100.0 47,966 100.0 34,307 99.8 11,164 100.0Haywood 246,311 31,292 92.0 95,497 100.0 41,667 98.6 13,750 100.0Isothermal 223,696 46,979 94.2 63,547 93.4 35,245 98.7 2,447 21.9James Sprunt 112,227 27,013 100.0 21,630 91.4 35,035 97.0 10,267 100.0Johnston 331,970 87,460 99.8 81,074 98.2 63,776 99.8 26,403 100.0Lenoir 317,299 73,404 100.0 78,458 93.8 54,356 99.2 18,497 100.0Martin 146,952 24,135 100.0 34,613 93.0 17,073 93.3 14,280 100.0Mayland 109,108 31,524 100.0 24,757 93.5 21,992 100.0 10,255 100.0McDowell 114,980 23,621 95.0 34,209 98.5 23,667 98.8 6,058 100.0Mitchell 243,571 69,903 98.6 50,804 97.7 47,586 91.2 16,760 100.0Montgomery 92,397 19,206 100.0 30,658 100.0 17,168 99.9 10,566 100.0Nash 173,877 49,714 100.0 45,654 99.9 26,391 97.1 13,237 100.0Pamlico 54,694 14,141 100.0 12,280 100.0 12,112 99.4 4,549 100.0Piedmont 141,444 37,037 99.6 35,466 99.9 31,798 99.5 7,732 86.9Pitt 376,038 82,071 100.0 129,366 100.0 86,164 99.6 22,804 100.0Randolph 293,501 67,294 99.7 92,821 100.0 42,008 99.3 8,155 100.0Richmond 166,319 32,970 92.3 40,146 96.7 27,070 95.8 10,433 98.8Roanoke-Chowan 113,541 18,145 100.0 37,654 100.0 17,151 99.5 11,019 100.0Robeson 201,215 37,206 100.0 60,343 100.0 44,230 100.0 12,560 100.0Rockingham 214,337 37,801 96.2 61,495 93.5 36,429 98.5 11,606 100.0Rowan-Cabarrus 378,326 88,575 100.0 93,700 100.0 91,121 100.0 23,277 100.0Sampson 137,870 32,694 100.0 37,859 100.0 28,537 99.8 14,296 100.0Sandhills 310,491 89,219 100.0 68,951 98.3 58,418 99.4 17,584 100.0South Piedmont 281,442 40,142 100.0 51,962 100.0 49,759 100.0 11,916 100.0Southeastern 181,938 48,005 98.4 45,813 98.8 37,312 99.2 13,907 100.0Southwestern 197,356 42,990 100.0 47,797 93.4 40,545 99.5 11,142 100.0Stanly 146,727 32,864 100.0 40,153 100.0 34,843 98.7 8,885 100.0Surry 308,023 87,903 99.7 90,145 100.0 58,819 96.1 12,944 100.0Tri-County 114,591 29,709 100.0 38,561 97.3 17,906 99.4 4,910 82.4Vance-Granville 258,282 48,642 98.0 77,339 100.0 49,315 99.7 16,715 88.1Wake 837,313 205,034 99.9 228,197 99.4 190,258 99.8 57,340 98.9Wayne 253,115 36,807 100.0 81,351 97.6 51,096 99.7 19,597 100.0Western Piedmont 244,588 58,040 100.0 73,733 99.9 47,175 99.5 16,173 100.0Wilkes 293,325 58,672 99.0 75,366 98.7 46,010 99.9 16,665 100.0Wilson 140,260 40,883 96.7 37,748 100.0 31,088 98.0 9,688 99.5Subtotal 16,863,193 3,933,362 98.9 4,855,849 97.8 3,361,277 98.5 955,510 97.6
Private InstitutionsNC Private Universities
Barton 328,517 28,852 100.0 24,220 100.0 56,533 99.2 21,578 100.0Campbell 820,481 100,826 98.4 62,054 99.6 138,311 86.7 79,018 99.4Mars Hill 318,610 34,323 80.8 29,002 61.7 44,804 68.7 27,357 94.5Pfeiffer 197,229 31,225 91.4 24,364 83.6 35,625 78.3 10,982 49.0Subtotal 1,664,837 195,226 93.9 139,640 85.8 275,273 84.1 138,935 91.2
Grand Total 60,272,633 6,342,939 97.6 10,890,580 96.7 13,348,601 96.0 3,631,397 97.8

152
Table 26. Accessible Area by Room Codes
InstitutionSpecial Use Facilities
500
General UseFacilities
600Support Facilities
700Health Care Facilities
800Residential Facilities
900
UnclassifiedFacilities
000ASF % ASF % ASF % ASF % ASF % ASF %
Public InstitutionsResearch Universities I
NC State 1,052,644 67.6 633,057 94.1 350,437 78.0 25,278 95.8 925,883 56.6 185,797 65.2NC State Veterinary Med 41,947 62.4 9,885 100.0 25,553 92.1 113,993 99.5 179 100.0 0 -UNC-Chapel Hill 842,268 100.0 812,829 99.9 455,494 100.0 22,594 99.9 1,892,168 99.9 97,877 99.2UNC-Chapel Hill Hlth Aff. 181,926 99.8 90,496 100.0 36,943 99.9 152,434 99.6 310 100.0 120,560 99.7Subtotal 2,118,785 80.0 1,546,267 97.5 868,427 89.6 314,299 99.3 2,818,540 79.8 404,234 80.2
Doctoral Universities I and IIEast Carolina 287,842 89.6 292,169 98.1 79,457 51.8 4,917 92.0 830,000 100.0 5,116 1.7East Carolina Hlth Aff. 44,768 100.0 7,280 100.0 52,430 100.0 132,188 100.0 1,280 100.0 8,039 100.0NC A&T 297,119 92.8 219,619 95.9 189,233 97.1 6,519 100.0 316,770 73.8 9,388 100.0UNC Charlotte 208,838 83.5 283,878 90.5 44,680 76.5 7,545 98.8 1,020,248 95.7 56,362 98.4UNC Greensboro 101,021 88.5 295,306 89.0 238,069 91.9 9,474 98.1 751,266 83.1 118,387 77.2Subtotal 939,588 89.4 1,098,252 93.1 603,869 84.1 160,643 99.6 2,919,564 90.4 197,292 37.4
Master's (Comprehensive) Universities and Colleges IAppalachian 345,185 85.9 355,619 90.1 77,177 90.9 11,733 100.0 578,633 66.8 24,355 100.0Fayetteville 76,341 99.3 76,364 98.7 17,594 100.0 2,319 100.0 147,413 69.6 84,310 93.6NC Central 116,094 91.8 155,177 97.0 11,521 43.8 2,318 82.6 293,845 90.4 123,368 88.4UNC Pembroke 86,888 100.0 113,438 91.8 51,100 100.0 1,312 50.2 303,342 77.8 0 -UNC Wilmington 89,357 71.4 248,953 91.1 76,417 87.6 4,676 100.0 442,828 57.3 36,503 88.5Western Carolina 193,105 90.8 291,605 95.9 61,376 97.2 3,246 100.0 202,409 30.5 39,912 89.2Winston-Salem 69,465 97.8 119,073 96.7 24,627 78.6 3,484 58.2 341,779 82.2 17,961 49.1Subtotal 976,435 88.7 1,360,229 93.4 319,812 88.4 29,088 87.2 2,310,249 63.4 326,409 86.7
Baccalaureate (Liberal Arts) Universities and Colleges I and IIElizabeth City 98,312 95.9 93,889 93.5 17,544 98.5 - - 203,409 65.8 14,536 56.6UNC Asheville 111,596 87.2 121,637 100.0 38,247 100.0 1,207 100.0 214,157 96.8 296 100.0Subtotal 209,908 91.1 215,526 97.1 55,791 99.5 1,207 19.9 417,566 78.7 14,832 57.1
Schools of Art, Music, and DesignUNC School of the Arts 23,826 100.0 109,249 92.4 34,697 59.6 1,259 41.0 128,881 81.6 25,421 53.3Subtotal 23,826 100.0 109,249 92.4 34,697 59.6 1,259 41.0 128,881 81.6 25,421 53.3
Teaching HospitalsUNC Hospitals 32,493 100.0 53,825 86.4 84,162 98.4 619,855 84.2 3,785 100.0 41,893 100.0Subtotal 32,493 100.0 53,825 86.4 84,162 98.4 619,855 84.2 3,785 100.0 41,893 100.0
Community CollegesAlamance 6,206 100.0 17,907 100.0 8,626 100.0 - - - - 0 -Asheville-Buncombe 16,094 100.0 50,363 98.6 17,838 92.6 751 100.0 - - 5,688 91.4Beaufort Co. 3,102 100.0 25,009 100.0 11,008 100.0 - - - - 0 -Bladen - - 13,863 100.0 8,088 100.0 - - - - 0 -Blue Ridge 6,235 100.0 52,154 100.0 12,867 100.0 - - - - 0 -Brunswick 29,789 100.0 64,286 92.2 12,553 100.0 112 100.0 - - 16,273 100.0Caldwell 20,026 100.0 50,790 96.6 15,605 96.6 - - - - 74 100.0Cape Fear 27,903 100.0 58,238 98.3 24,613 99.6 - - 756 73.2 6,905 100.0Carteret 2,052 29.6 9,198 89.8 6,863 100.0 - - - - 0 -Catawba Valley 38,452 100.0 41,960 100.0 2,633 100.0 - - - - 8,214 100.0Central Carolina 11,379 100.0 41,428 100.0 2,630 100.0 1,954 100.0 - - 325 100.0Central Piedmont 31,454 96.7 123,618 99.6 69,477 95.9 - - - - 34,272 95.0Cleveland 15,067 100.0 16,628 100.0 9,259 88.6 - - - - 0 -Coastal Carolina 3,031 100.0 11,595 100.0 6,263 100.0 - - - - 0 -Coll. of Albemarle 7,204 100.0 44,182 100.0 12,976 100.0 - - - - 0 -Craven 1,875 100.0 19,908 100.0 1,146 63.2 - - - - 0 -Davidson County 18,318 98.6 28,034 99.1 22,931 100.0 142 100.0 - - 0 -Durham 2,507 98.1 23,339 99.3 5,244 12.8 - - - - 0 -Edgecombe 770 100.0 36,414 95.9 7,420 100.0 - - - - 0 -Fayetteville 23,808 96.0 52,938 98.5 20,864 67.4 378 100.0 - - 0 -
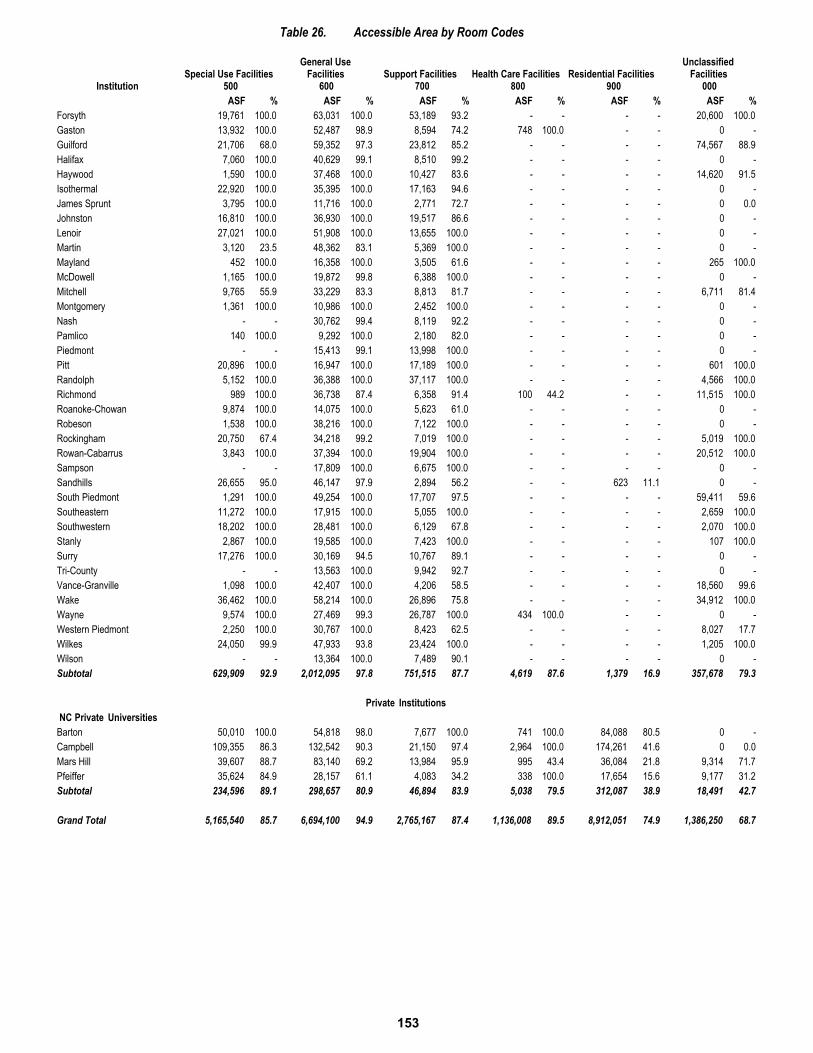
153
Table 26. Accessible Area by Room Codes
InstitutionSpecial Use Facilities
500
General UseFacilities
600Support Facilities
700Health Care Facilities
800Residential Facilities
900
UnclassifiedFacilities
000ASF % ASF % ASF % ASF % ASF % ASF %
Forsyth 19,761 100.0 63,031 100.0 53,189 93.2 - - - - 20,600 100.0Gaston 13,932 100.0 52,487 98.9 8,594 74.2 748 100.0 - - 0 -Guilford 21,706 68.0 59,352 97.3 23,812 85.2 - - - - 74,567 88.9Halifax 7,060 100.0 40,629 99.1 8,510 99.2 - - - - 0 -Haywood 1,590 100.0 37,468 100.0 10,427 83.6 - - - - 14,620 91.5Isothermal 22,920 100.0 35,395 100.0 17,163 94.6 - - - - 0 -James Sprunt 3,795 100.0 11,716 100.0 2,771 72.7 - - - - 0 0.0Johnston 16,810 100.0 36,930 100.0 19,517 86.6 - - - - 0 -Lenoir 27,021 100.0 51,908 100.0 13,655 100.0 - - - - 0 -Martin 3,120 23.5 48,362 83.1 5,369 100.0 - - - - 0 -Mayland 452 100.0 16,358 100.0 3,505 61.6 - - - - 265 100.0McDowell 1,165 100.0 19,872 99.8 6,388 100.0 - - - - 0 -Mitchell 9,765 55.9 33,229 83.3 8,813 81.7 - - - - 6,711 81.4Montgomery 1,361 100.0 10,986 100.0 2,452 100.0 - - - - 0 -Nash - - 30,762 99.4 8,119 92.2 - - - - 0 -Pamlico 140 100.0 9,292 100.0 2,180 82.0 - - - - 0 -Piedmont - - 15,413 99.1 13,998 100.0 - - - - 0 -Pitt 20,896 100.0 16,947 100.0 17,189 100.0 - - - - 601 100.0Randolph 5,152 100.0 36,388 100.0 37,117 100.0 - - - - 4,566 100.0Richmond 989 100.0 36,738 87.4 6,358 91.4 100 44.2 - - 11,515 100.0Roanoke-Chowan 9,874 100.0 14,075 100.0 5,623 61.0 - - - - 0 -Robeson 1,538 100.0 38,216 100.0 7,122 100.0 - - - - 0 -Rockingham 20,750 67.4 34,218 99.2 7,019 100.0 - - - - 5,019 100.0Rowan-Cabarrus 3,843 100.0 37,394 100.0 19,904 100.0 - - - - 20,512 100.0Sampson - - 17,809 100.0 6,675 100.0 - - - - 0 -Sandhills 26,655 95.0 46,147 97.9 2,894 56.2 - - 623 11.1 0 -South Piedmont 1,291 100.0 49,254 100.0 17,707 97.5 - - - - 59,411 59.6Southeastern 11,272 100.0 17,915 100.0 5,055 100.0 - - - - 2,659 100.0Southwestern 18,202 100.0 28,481 100.0 6,129 67.8 - - - - 2,070 100.0Stanly 2,867 100.0 19,585 100.0 7,423 100.0 - - - - 107 100.0Surry 17,276 100.0 30,169 94.5 10,767 89.1 - - - - 0 -Tri-County - - 13,563 100.0 9,942 92.7 - - - - 0 -Vance-Granville 1,098 100.0 42,407 100.0 4,206 58.5 - - - - 18,560 99.6Wake 36,462 100.0 58,214 100.0 26,896 75.8 - - - - 34,912 100.0Wayne 9,574 100.0 27,469 99.3 26,787 100.0 434 100.0 - - 0 -Western Piedmont 2,250 100.0 30,767 100.0 8,423 62.5 - - - - 8,027 17.7Wilkes 24,050 99.9 47,933 93.8 23,424 100.0 - - - - 1,205 100.0Wilson - - 13,364 100.0 7,489 90.1 - - - - 0 -Subtotal 629,909 92.9 2,012,095 97.8 751,515 87.7 4,619 87.6 1,379 16.9 357,678 79.3
Private InstitutionsNC Private Universities
Barton 50,010 100.0 54,818 98.0 7,677 100.0 741 100.0 84,088 80.5 0 -Campbell 109,355 86.3 132,542 90.3 21,150 97.4 2,964 100.0 174,261 41.6 0 0.0Mars Hill 39,607 88.7 83,140 69.2 13,984 95.9 995 43.4 36,084 21.8 9,314 71.7Pfeiffer 35,624 84.9 28,157 61.1 4,083 34.2 338 100.0 17,654 15.6 9,177 31.2Subtotal 234,596 89.1 298,657 80.9 46,894 83.9 5,038 79.5 312,087 38.9 18,491 42.7
Grand Total 5,165,540 85.7 6,694,100 94.9 2,765,167 87.4 1,136,008 89.5 8,912,051 74.9 1,386,250 68.7

This Page Intentionally Left Blank
154

*see page 157 155*see page 157 155
Johnston Community College 1-3 009336 Johnston Smithfield 27577 02
Institutional Index
Institution Type *FICE Code County City
Congr. Dist.**
Alamance Community College 1-3 005463 Alamance Graham 27253 06, 13Appalachian State University 1-2 002906 Watauga Boone 28608 05Asheville-Buncombe TCC 1-3 004033 Buncombe Asheville 28801 11Barton College 2-2 002908 Wilson Wilson 27893 01, 03Beaufort County CC 1-3 008558 Beaufort Washington 27889 01, 03Bladen Community College 1-3 007897 Bladen Dublin 28332 07Blue Ridge Community College 1-3 009684 Henderson Flat Rock 28731 11Brunswick Community College 1-3 029275 Brunswick Supply 28462 07Caldwell CC & TI 1-3 004835 Caldwell Hudson 28638-1399 10Campbell University 2-2 002913 Harnett Buies Creek 27506 02Cape Fear Community College 1-3 005320 New Hanover Wilmington 28401 07Carteret Community College 1-3 008081 Carteret Morehead City 28557 03Catawba Valley CC 1-3 005318 Catawba Hickory 28602 10Central Carolina CC 1-3 005449 Lee Sanford 27330 02Central Piedmont CC 1-3 002915 Mecklenburg Charlotte 28235 08, 09, 12Cleveland Community College 1-3 008082 Cleveland Shelby 28152 10Coastal Carolina CC 1-3 008084 Onslow Jacksonville 28546 03College of the Albemarle 1-3 002919 Pasquotank Elizabeth City 27906 01Craven Community Collegey g 1-3 008086 Craven New Bern 28562 01, 03,Davidson County CC 1-3 002919 Davidson Lexington 27293 06, 12Durham Technical CC 1-3 005448 Durham Durham 27703 04East Carolina University 1-1 002923 Pitt Greenville 27858 01, 03ECU-Health Affairs 1-1 Pitt Greenville 27858 01, 03Edgecombe Community College 1-3 008855 Edgecombe Tarboro 27886 01Elizabeth City State University 1-2 002929 Pasquotank Elizabeth City 27909 01Fayetteville State University 1-2 002928 Cumberland Fayetteville 28301 02, 07, 08Fayetteville TCC 1-3 007640 Cumberland Fayetteville 28303 02, 07, 08Forsyth TCC 1-3 005317 Forsyth Winston-Salem 27103 05, 12Gaston College 1-2 002973 Gaston Dallas 28034 09, 10Guilford Technical CC 1-3 004838 Guilford Jamestown 27282 06, 12, 13Halifax Community College 1-3 007986 Halifax Weldon 27890 01Haywood Community College 1-3 008083 Haywood Clyde 28271 11Isothermal Community College 1-3 002934 Rutherford Spindale 28160 10, 11James Sprunt Community College 1-3 007687 Duplin Kenansville 28349 03, 07

Institutional Index
Institution Type*
FICE
Code County City
Congr.
Dist.**
Lenoir Community College 1-3 002940 Lenoir Kinston 28502 01, 03
Mars Hill College 2-3 002944 Madison Mars Hill 28754 11
Martin Community College 1-3 007988 Martin Williamston 27892 01
Mayland Community College 1-3 011197 Mitchell Spruce Pine 28777 10
McDowell Technical CC 1-3 008085 McDowell Marion 28752 11
Mitchell Community College 1-3 002947 Iredell Statesville 28677 05, 10
Montgomery Community College 1-3 008087 Montgomery Troy 27371 08
Nash Community College 1-3 008557 Nash Rocky Mount 27804 01, 02
N. C. A&T State University 1-1 002905 Guilford Greensboro 27411 06, 12, 13
N. C. Central University 1-2 002950 Durham Durham 27707 04
N. C. State University 1-1 002972 Wake Raleigh 27695 02, 04, 13
NCSU Veterinary School 1-1 Wake Raleigh 27695 02, 04, 13
Pamlico Community College 1-3 007031 Pamlico Grantsboro 28529 03
Pfeiffer University 2-2 002955 Stanly Misenheimer 28109 08
Piedmont Community College 1-3 009646 Person Roxboro 27573 13
Pitt Community College 1-3 004062 Pitt Greenville 27835 01, 03
Randolph Community College 1-3 005447 Randolph Asheboro 27204 06
Richmond Community College 1-3 005464 Richmond Hamlet 28345 08
Roanoke-Chowan CC 1-3 008613 Hertford Ahoskie 27910 01
Robeson Community College 1-3 008612 Robeson Lumberton 28359 07
Rockingham Community College 1-3 002958 Rockingham Wentworth 27375 05, 13
Rowan-Cabarrus CC 1-3 005754 Rowan Salisbury 28145 06, 12
Sampson Community College 1-3 007892 Sampson Clinton 28328 02, 07
Sandhills Community College 1-3 002961 Moore Pinehurst 28374 06
South Piedmont Community College 1-3 007985 Anson Polkton 28135 08
Southeastern Community College 1-3 002964 Columbus Whiteville 28472 07
Southwestern Community College 1-3 008466 Jackson Sylva 28779 11
Stanly Community College 1-3 011194 Stanly Albemarle 28001 08
Surry Community College 1-3 002970 Surry Dobson 27017 05
Tri-County Community College 1-3 009430 Cherokee Murphy 28906 11
U. of N. C. at Asheville 1-2 002907 Buncombe Asheville 28804 11
U. of N. C. at Chapel Hill 1-1 002974 Orange Chapel Hill 27599 04
U. of N. C. at Charlotte 1-1 002975 Mecklenburg Charlotte 28223 08, 09, 12
U. of N. C. at Greensboro 1-1 002976 Guilford Greensboro 27402 06, 12, 13
U. of N. C. Health Affairs 1-1 Orange Chapel Hill 27599 04
U. of N. C. School of the Arts 1-2 003981 Forsyth Winston-Salem 27117 05, 12
156

Institutional Index
Institution Type*FICE Code County City
Congr. Dist.**
U. of N. C. at Pembroke 1-2 002954 Robeson Pembroke 28372 07U. of N. C. at Wilmington 1-2 002984 New Hanover Wilmington 28403 07Vance-Granville Community College 1-3 009903 Vance Henderson 27536 01, 02Wake Technical CC 1-3 004844 Wake Raleigh 27603 02, 04, 13Wayne Community College 1-3 002980 Wayne Goldsboro 27533 01, 03Western Carolina University 1-2 002981 Jackson Cullowhee 28723 11Western Piedmont CC 1-3 002982 Burke Morganton 28655 10Wilkes Community College 1-3 002983 Wilkes Wilkesboro 28697 05Wilson Technical CC 1-3 004845 Wilson Wilson 27893 01, 03Winston-Salem State University 1-2 002986 Forsyth Winston-Salem 27110 05, 12
*The Type Code in this index indicates the control and level of the institution. Controls are a "1" for publicand a "2" for private institutions. The level codes, which follow the dash, are a "1" for doctoral, a "2" forbaccalaureate and graduate levels less than doctoral, and a "3" for 2-year institutions.
**Based on 2010 census.
157 157
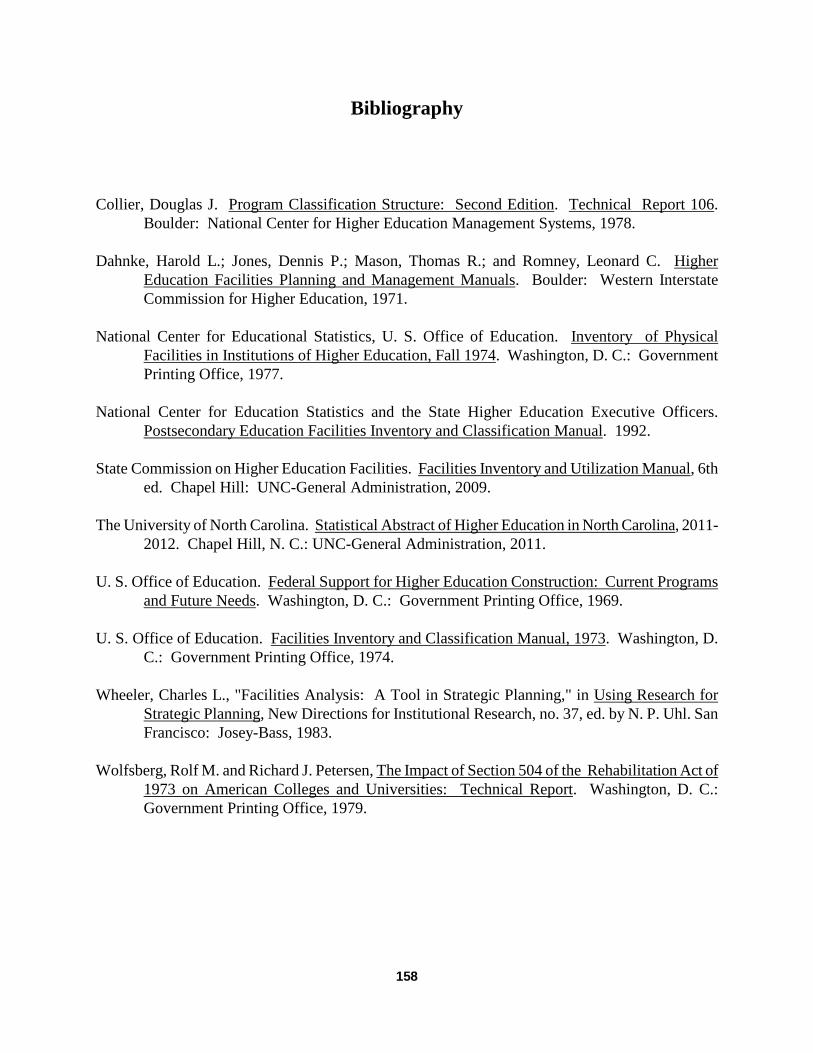
Bibliography
Collier, Douglas J. Program Classification Structure: Second Edition. Technical Report 106. Boulder: National Center for Higher Education Management Systems, 1978.
Dahnke, Harold L.; Jones, Dennis P.; Mason, Thomas R.; and Romney, Leonard C. Higher Education Facilities Planning and Management Manuals. Boulder: Western Interstate Commission for Higher Education, 1971.
National Center for Educational Statistics, U. S. Office of Education. Inventory of Physical Facilities in Institutions of Higher Education, Fall 1974. Washington, D. C.: Government Printing Office, 1977.
National Center for Education Statistics and the State Higher Education Executive Officers. Postsecondary Education Facilities Inventory and Classification Manual. 1992.
State Commission on Higher Education Facilities. Facilities Inventory and Utilization Manual, 6th ed. Chapel Hill: UNC-General Administration, 2009.
The University of North Carolina. Statistical Abstract of Higher Education in North Carolina, 2011-2012. Chapel Hill, N. C.: UNC-General Administration, 2011.
U. S. Office of Education. Federal Support for Higher Education Construction: Current Programs and Future Needs. Washington, D. C.: Government Printing Office, 1969.
U. S. Office of Education. Facilities Inventory and Classification Manual, 1973. Washington, D. C.: Government Printing Office, 1974.
Wheeler, Charles L., "Facilities Analysis: A Tool in Strategic Planning," in Using Research for Strategic Planning, New Directions for Institutional Research, no. 37, ed. by N. P. Uhl. San Francisco: Josey-Bass, 1983.
Wolfsberg, Rolf M. and Richard J. Petersen, The Impact of Section 504 of the Rehabilitation Act of 1973 on American Colleges and Universities: Technical Report. Washington, D. C.: Government Printing Office, 1979.
158

159
Index
Academic administration (subprogram), 78, 80- 81, 142-143 Academic computer support (subprogram), 78, 80-81, 142-143 Academic facilities, 15, 18-19 per FTE student, 16-19 Academic personnel development (subprogram), 79-81, 142-143 Academic support: program, 65, 67-69, 136-137 subprograms, 78-81, 142-143 Accessibility of facilities to mobility impaired, 131-133, 135-153 Address, institutional, 155-157 Administrative computer support (subprogram), 86-89, 146-147 Age of buildings, 116-119 Ancillary support (subprogram), 78, 80-81, 142- 143 Assignable square feet, 61-63, 132-133 distribution among programs, 64-89 distribution among room codes, 90-97 per student station, 50-52, 98-101 to gross square feet (ratio), 61-63 Assignable square feet of academic facilities: See “Academic facilities” Average weekly room hours of instruction: in classrooms, 20-23, 48, 50 in class labs, 24-27, 48, 51 Average weekly use of student stations: in classrooms, 28-31, 50 in class labs, 32-35, 51
Building cost, 112-115 Building maintenance (subprogram), 83-85, 144- 145 Buildings: age of, 116-119 condition of, 120-123, 125-127 number of, 114-115
Capacity/enrollment ratio, 9-13 Class laboratories: number of, 104-105
stations in, 102-105 utilization, 24-27, 32-35, 36-39, 41-47, 48,50- 51 Classrooms: accessibility to mobility impaired, 150-151 number of, 100-101 space, 90, 94-95 stations in, 98-101 utilization, 20-23, 28-31, 36-39, 41-43, 46-48, 50 Clock hours: See “Student clock hours” Community services (subprogram), 72, 76, 77, 140, 141 Condition of buildings, 120-124, 125-127 Conference rooms, 50, 52 Construction costs, 112-113 Cooperative extension services (subprogram), 73, 76-77, 140-141 Cost: of construction, 112-115 to renovate or replace, 125-127 Counseling & career guidance (subprogram), 82, 84-85, 144-145 Course & curriculum development (subprogram), 79-81, 142-143 Custodial services (subprogram), 83-85, 144-145
Daytime instruction, 20, 32 in classrooms, 22-23, 30-31 in class labs, 26-27, 34-35 Direct patient care (subprogram), 72, 76, 77, 140, 141
Educational media services (subprogram), 78, 80-81, 142-143 Enrollments: headcount, 55 full-time equivalent (FTE), 16, 18-19, 54-58 Estimated replacement cost: See “Replacement value” Executive management (subprogram) 86, 88-89, 146-147 Extension services: See “Cooperative extension service”

160
Faculty & staff auxiliary services (subprogram), 86, 88-89, 146-147 FCAP, 120, 124 Financial aid administration (subprogram), 82, 84-85, 144-145 Full-time equivalent (FTE) enrollment, 16, 18- 19, 54-58
General academic instruction (subprogram), 71, 74-75, 138-139 General studies, nondegree (subprogram), 71, 74-75, 138-139 General use facilities, 90-91, 93, 96-97, 152-153 Gross square feet, 61-63, 114-115
Headcount enrollments, 55 Health care supportive services (subprogram), 72, 75, 77, 139, 141 Home & family life instruction, nondegree (subprogram), 72, 74-75, 138-139 High school enrollments, 4, 18
Independent operations: program, 66-69, 136-137 subprograms, 87-89, 146-147 Independent operations/external agencies (subprogram), 87-89, 146-147 Independent operations/institutional (subprogram), 87-89, 146-147 Individual or project research (subprogram), 72, 76-77, 140-141 Institutes & research centers (subprogram), 72, 76-77, 140-141 Institutional administration: program, 65, 67-69, 136-137 subprograms, 86-89, 146-147 Instruction: program, 65, 67-69, 136-137 subprograms, 71-72, 74-75, 138-139 Instructional & library space, 9, 12-13 Intercollegiate athletics (subprogram), 82, 84-85, 144-145
Laboratories, 90-91, 93-95, 150-151 See also “Class laboratories) Landscape & ground maintenance (subprogram), 83-85, 144-145 Libraries, 53 Library service (subprogram), 78, 80-81, 142- 143 Limitations and special situations, 3-5
Major repairs & renovations (subprogram), 83 Medical care facilities, 90-93, 96-97, 152-153 Medical schools, 1-2, 4, 18 Museums & galleries (subprogram), 78, 80-81, 142-143
Net-to-gross ratio, 61-63 Nighttime instruction, 20, 24, 28, 32 in classrooms, 21-23, 29-31 in class labs, 25-27, 33-35
Occupation-related instruction, nondegree (subprogram), 71, 74, 75, 138-139 Offices, 52, 90-91, 93-95, 150-151 Ownership of buildings, 109-111
Parking decks, 61 Percent student station utilization, 36-39, 48 Personal interest & leisure instruction, nondegree (subprogram), 72, 74-75, 78, 138-139 Physical plant administration (subprogram), 83-85, 144-145 Physical plant operations: program, 65, 68-69, 136-137 subprograms, 83-85, 144-145 Potential student hours of instruction, 36 Program classification structure, 64-66, 71-73, 78-79, 82-83, 86-87 Public broadcasting services (subprogram), 73, 76-77, 79, 140-141 Public relations/development (subprogram), 86, 88-89, 146-147 Public services: program, 65, 67-69, 136-137 subprograms, 72-73, 76-77, 140-141

161
Renovations, 61, 125-127 Replacement value, 112-115 Requisite preparatory/remedial instruction, (subprogram), 71, 74-75, 138-139 Research: program, 65, 67-69, 136-137 subprograms, 72, 76-77, 140-141 Residential facilities, 90, 92-93, 96-97, 152-153 Room codes, 91-92 Room hours of instruction, total: in classrooms, 20-23, 48 in class labs, 24, 26-27, 48
Secondary level enrollments, 4, 18 Section 504 of the Rehabilitation Act of 1973, 131, 135, 149 Social & cultural development (subprogram), 82, 84-85, 144-145 Social roles/interaction instruction, nondegree (subprogram), 71, 74- 75, 138-139 Space factors, 44-48 Space standards, 49-53 Special use facilities, 90,91,93, 96-97, 152-153 Square feet: See “Assignable square feet,” “Gross square feet” Stations: See “Student stations” Student auxiliary services (subprograms), 82, 84-85, 144-145 Student clock hours, 10, 12-13, 41-43 Student financial support, 66 Student health/medical services (subprogram), 82, 84-85, 144-145 Student records (subprogram), 87-89, 146-147 Student recruitment & admissions (subprogram), 86, 88-89, 146-147 Student services: program, 65, 67-69, 136-137 subprograms, 82, 84-85, 144-145 Student stations, 28-31, 32-35, 100-101, 104-105 assignable square feet per, 50-51, 98-101, 102-105 Study facilities, 90-91, 93-95, 150-151 Supporting facilities, 90-91, 93, 96-97, 152-153
Unassigned space: program, 66-69, 136-137 subprogram, 87-89, 146-147 Unclassified space, 90, 92-93, 96-97, 152-153 Utilities (subprogram), 83-85, 144-145
Vocational/technical instruction (subprogram), 71, 74-75, 138-139