Embed Size (px)
Citation preview

Facilitator’s Guide
To Leading the Scoring
Session Level 3 An In-Depth Training for High
School Math Teachers
This packet contains the following:Facilitator's Guide to Leading the Scoring Session Student work with commentaries
Oregon Department of Education 2012-13 Office of Assessment and Information Services

This page is
intentionally left blank.
Mathematics Problem Solving Scoring Guide Training Level 3 – In-depth Training
Suggestions for Use of Student Papers The purpose of this level of training is to discern the difference between the score points for Mathematics Essential Skills evaluation. We want the raters to clearly recognize what meets and what does not meet the standard. This section of the training has 19 papers from three tasks: Safe-Keeping Security, Pony Ride, and Bamboo Plant. There is a commentary page for each student paper with specifics on why that score was given. Use the commentary to direct discussion to key points for clarifying scoring questions or issues. To prepare for the discussions that follow, the facilitator should read the paper commentaries included as a separate document and make notes on their copies of the student papers. A separate Key is also included with all of the scores for the training papers for all tasks. Part 1: Safe-Keeping Security Company (originally Gopher Security) The purpose for this task is to re-acquaint teachers with the scoring guide and to be a “warm-up” for the more complex Pony Rides and Safe-Keeping Security tasks.
Mathematics Content Standard Assessed by This Task: H.1G.4: Use trigonometric ratios (sine, cosine and tangent) and the Pythagorean Theorem to solve for unknown lengths in right triangles. Achievement Level Descriptor: Use coordinate geometry to justify properties, explain conjectures, and solve problems involving two dimensional figures with numeric coordinates.
Work the Task (slides 19 & 20)
Score as many papers as time allows and as you feel the group needs for further practice and to solidify their understanding.
Encourage participants to use the blank tasks with their classes as appropriate and practice scoring papers again while this experience is still fresh in their minds.
Part 2: Pony Ride The purpose of Level 3 training is twofold: 1) to provide teachers with the opportunity to score larger numbers of student papers to increase their accuracy in matching student work with the scoring guide; 2) to provide the opportunity to review and discuss more complex tasks. The tasks presented in Level 2 training have solutions that are whole numbers, whereas in Level 3, that’s not necessarily the case. The use of non-integer solutions can introduce another level of complexity for certain tasks, since solutions may fall between whole number values. For math teachers, the Pony Rides problem will generate quite a discussion about what is an acceptable answer and why. It will also have to be agreed upon what “supports” a slightly less than accurate answer. The question asks (1) What price per ride should they charge to achieve the maximum amount of revenue? (2) What is the maximum revenue amount? Compare the solution of Paper MS3_H6 to that of Paper MS3_H7. Both show the use of a quadratic equation. In Paper H6, the maximum point shown on the graph is (10.75, 2311.25) and student discusses both 10.75 and 11.00 as solutions, depending on whether the solution needs to

be limited to a whole number or not. In Paper H7, the student also states the solution as $11 and the graph shows the maximum is (5, 2310). In reality, his equation he/she has written on the front would result in a maximum of (4.75, 2311.25), had he/she solved the equation instead of focusing on whole number dollar amounts in the table. Had the student shown an understanding of this, his answer of $11 would have been acceptable. There are student samples with scores of 4 MS and 3 RE vs 3 MS and 4 RE scores. So, in Pony Rides Paper M53_H7, what did the student not understand? Why is the Making Sense of the Task only partially developed? Was the strategy only partially effective? Making Sense of the Task (3): The student has shown a correct interpretation of the price increase and the decrease in number of riders by using the same variable: y = (6+x) ∙ (310 – 20x). The fact that the product of those two is the revenue and a table with values are also shown. However, the interpretation is only partially developed because the task is represented using only discrete increments of whole dollar amounts. The interpretation is not adequate (not a 4) because the student does not consider fractions of dollars, and there is no evidence that the student understands how to apply the properties of quadratic functions (the vertex representing the maximum). Representing and Solving the Task (4): The strategy of generating a table (probably from the equation) is complete, although only whole dollar increases are considered (this is addressed in the “Making Sense” dimension). Had the student used the table or equation to find the maximum value for the equation (or considered the possibility that the maximum can be generated from other than a whole dollar amount), this paper may have scored a 5.
Mathematics Content Standard Assessed by This Task: H.3A: Use quadratic equations and exponential equations and functions to represent relationships Achievement Level Descriptor: Solve quadratic equations graphically and algebraically and explain the relationship between the two strategies.
Work the Task (slides 22 & 23)
Work the Pony Ride task independently; then pair/share solutions - followed by a group discussion – including examples of a variety of approaches (preferably provided by participants), possible student approaches, and the key concepts indicated by the task. Most of the time and discussion for scoring practice should be on Pony Rides. Discuss what the correct answer is. Will you accept a whole number solution? For math teachers, the Pony Rides problem will generate quite a discussion about what is an acceptable answer and why. It will also have to be agreed upon what “supports” a slightly less than accurate answer. The question asks (1) What price per ride should they charge to achieve the maximum amount of revenue? (2) What is the maximum revenue amount? Begin with scoring and discussing Paper M3HS_6. (Scores are MS 5 RS 6 CR 5 AC 5 RE 6) This paper will help solidify the correct answer. This will also solidify the notion of getting a 6 without having to meet every bullet.

Next, score papers M3HS_7, M3HS_8, and M3HS_9 by having the participants read and score all three tasks independently and then discuss with partners or tables before large group discussion. M3HS_7: Scores MS 3 RS 4 CR4 AC 3 RE 2 M3HS_8: Scores MS 3 RS 3 CR 3 AC 2 RE 2 M3HS_9: Scores MS 3 RS 4 CR 5 AC 3 RE 3 Compare the solution of Paper MS3_H6 to that of Paper MS3_H7. Both show the use of a quadratic equation. In Paper H6, the maximum point shown on the graph is (10.75, 2311.25) and student discusses both 10.75 and 11.00 as solutions, depending on whether the solution needs to be limited to a whole number or not. In Paper H7, the student also states the solution as $11 and the graph shows the maximum is (5, 2310). In reality, his equation he/she has written on the front would result in a maximum of (4.75, 2311.25), had he/she solved the equation instead of focusing on whole number dollar amounts in the table. Had the student shown an understanding of this, his answer of $11 would have been acceptable. Be prepared for a LIVELY discussion of the dilemma of separating the two dimensions Making Sense of the Problem and Representing and Solving the Task. This is especially true when the scores are Making Sense of the Problem -- 3 and Representing and Solving the Task -- 4 versus Making Sense of the Problem -- 4 and Representing and Solving the Task -- 3. To help teachers feel more confident about a potential 4/3 or 3/4, remind them that students are allowed to make revisions to their papers and resubmit them for scoring. Refer participants to the Official Scoring Form in their packet and discuss how to use the form and communicate to students what may be lacking here. There are student samples with scores of 4 MS and 3 RS vs 3 MS and 4 RS scores. Sometimes the scores are 3 MS and 3RS. (Note: An example of 4 MS and 3 RS is shown in the Bamboo Plant task.) So, in Pony Rides Paper M53_H7, what did the student not understand? Why is the Making Sense of the Task only partially developed? Was the strategy only partially effective? These are important questions to ask the group and have them dialogue about. Making Sense of the Task (3): The student has shown a correct interpretation of the price increase and the decrease in number of riders by using the same variable: y = (6+x) ∙ (310 – 20x). The fact that the product of those two is the revenue and a table with values are also shown. However, the interpretation is only partially developed because the task is represented using only discrete increments of whole dollar amounts. The interpretation is not adequate (not a 4) because the student does not consider fractions of dollars, and there is no evidence that the student understands how to apply the properties of quadratic functions (the vertex representing the maximum). Representing and Solving the Task (4): The strategy of generating a table (probably from the equation) is complete, although only whole dollar increases are considered (this is addressed in the “Making Sense” dimension). Had the student used the table or equation to find the maximum value for the equation (or considered the possibility that the maximum can be generated from other than a whole dollar amount), this paper may have scored a 5. Next, score and discuss paper M3HS_10 (which is a composite paper created from several student responses to serve as a model). This points out that a “6” paper does not need to be more than one page in length.

Finally, have participants score the rest of the papers (M3HS_11, M3HS_12, M3HS_13, M3HS_14, M3HS_15 – these are in sequence in the packets). Discuss as a group, reaching consensus on scores, and discuss how feedback could be given to students for revision by either highlighting the official scoring guide or using the feedback form. Suggested Activity: Have participants pair up and find another pair from a different table (ones they have not worked with previously during scoring). Each person should share one thing they learned today and identify any things that are still not clear about scoring student papers. Have the small groups report out to the whole group. Use the information from this activity to assist you in focusing discussion for the final round of scoring student papers. Part 3: Bamboo Plant The purpose of the Bamboo Plant scoring activity is to re-calibrate scorers and to focus on the language of the scoring guide.
Mathematics Content Standard Assessed by This Task: H.2A.2: Given a rule, a context, two points, a table of values, a graph, or a linear equation in either slope intercept or standard form, identify the slope of the line, determine the x and/or y intercept(s), and interpret the meaning of each. Achievement Level Descriptors: Distinguish between, manipulate, and apply linear, quadratic, and exponential functions in routine and non-routine situations using tables, graphs, and equations. Identify the domain and range from a table, graph, or equation.
Work the Task (slides 25 & 26)
Work the Bamboo Plant task independently; then pair/share solutions - followed by a group discussion – including examples of a variety of approaches (preferably provided by participants), possible student approaches, and the key concepts indicated by the task. Scoring of Student Papers Read, score and discuss the 4 student papers for Bamboo Plant in the sequence presented in the packet. Emphasize terms adequate, partially developed and enhanced, capturing thoughts on chart paper or using document camera.
•Participants review scoring guide 4 for Each Dimension •They should identify words and phrases that distinguish a four for each dimension •Facilitator then clarifies the factors that usually differentiate a 3 from a 4 in each dimension
Return to PowerPoint for final information and closing of workshop.
Math Level 3 Key
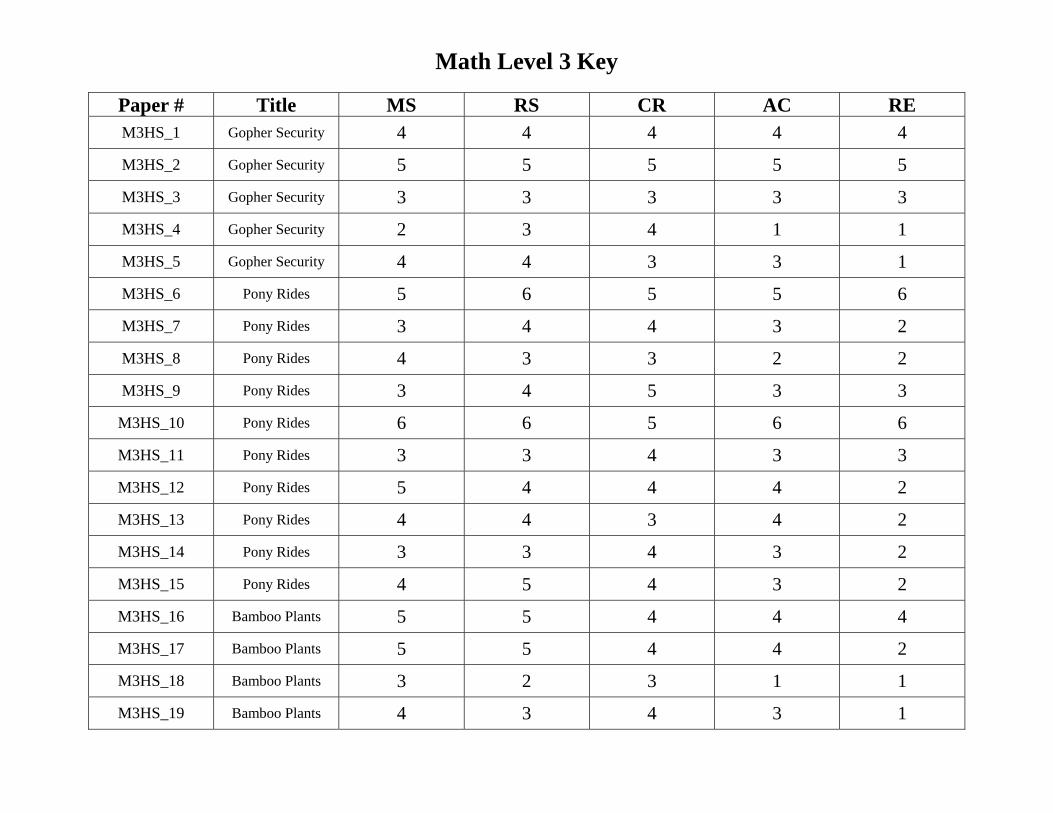
Paper # Title MS RS CR AC REM3HS_1 Gopher Security 4 4 4 4 4
M3HS_2 Gopher Security 5 5 5 5 5
M3HS_3 Gopher Security 3 3 3 3 3
M3HS_4 Gopher Security 2 3 4 1 1
M3HS_5 Gopher Security 4 4 3 3 1
M3HS_6 Pony Rides 5 6 5 5 6
M3HS_7 Pony Rides 3 4 4 3 2
M3HS_8 Pony Rides 4 3 3 2 2
M3HS_9 Pony Rides 3 4 5 3 3
M3HS_10 Pony Rides 6 6 5 6 6
M3HS_11 Pony Rides 3 3 4 3 3
M3HS_12 Pony Rides 5 4 4 4 2
M3HS_13 Pony Rides 4 4 3 4 2
M3HS_14 Pony Rides 3 3 4 3 2
M3HS_15 Pony Rides 4 5 4 3 2
M3HS_16 Bamboo Plants 5 5 4 4 4
M3HS_17 Bamboo Plants 5 5 4 4 2
M3HS_18 Bamboo Plants 3 2 3 1 1
M3HS_19 Bamboo Plants 4 3 4 3 1

Math Level 3 Score Recording Sheet
Paper # Title MS RS CR AC RE M3HS_1 Gopher Security
M3HS_2 Gopher Security
M3HS_3 Gopher Security
M3HS_4 Gopher Security
M3HS_5 Gopher Security
M3HS_6 Pony Rides
M3HS_7 Pony Rides
M3HS_8 Pony Rides
M3HS_9 Pony Rides
M3HS_10 Pony Rides
M3HS_11 Pony Rides
M3HS_12 Pony Rides
M3HS_13 Pony Rides
M3HS_14 Pony Rides
M3HS_15 Pony Rides
M3HS_16 Bamboo Plants
M3HS_17 Bamboo Plants
M3HS_18 Bamboo Plants
M3HS_19 Bamboo Plants

Mathematics Work Sample High School 2011 – 2012 – Safe-Keeping Security Company
Use the information provided to solve the problem listed below. Be sure to show your work at all phases of problem-solving. Refer to the Student Problem Solving Tips to receive the highest score in each of the five areas.
Algebra Geometry Statistics Content Standard: H.1G.4: Use trigonometric ratios (sine, cosine and tangent) and the Pythagorean Theorem to solve
for unknown lengths in right triangles. Achievement level descriptor: Use coordinate geometry to justify properties, explain conjectures, and solve problems involving two dimensional figures with numeric coordinates. Name: ______________________________________
School: _____________________________________
Teacher: ____________________________________
The Safe-Keeping Security Company has been hired to create a security system for the Smithsonian Museum where the famous Hope Diamond is displayed. They will be installing a laser beam triggered security system. You will help them determine the distance the beam will travel around the room to protect the diamond. If the beam is broken, the alarm will be triggered.
The display box will be placed in the center of the room
The beam travels from the sensor at point A to sensor B to sensor C to sensor D and back to sensor A.
What is the total distance the beam will travel around the room?
Show all work and reasoning to complete the task.
Each square on the grid represents 1 foot by 1 foot.

This page is
intentionally left blank.

M3HS_1

M3HS_1

Mathematics: Essential Skills Scores and Commentary
Work Sample Title: Gopher Security Paper Number: M3HS_1 Algebra Geometry
Statistics High School Content Standard: H.1G.4: Use trigonometric ratios (sine, cosine and tangent) and the Pythagorean Theorem to solve for unknown lengths in right triangles.
Achievement Level Descriptor: Use coordinate geometry to justify properties, explain conjectures, and solve problems involving two dimensional figures with numeric coordinates.
Making Sense of the Task
Representing and Solving the Task
Communicating Reasoning
Accuracy Reflecting and Evaluating
4 4 4 4 4
Making Sense of the Task (4): The student made sense of the task by using the given angles to create equivalent ratios using sine and cosine, finding the lengths of the individual segments, and then adding them together. The development and display of this understanding is adequate, but mechanical. There is no evidence of any enhancements or connections to other ideas.
Representing and Solving the Task (4): The strategy of using trig ratios to find the side lengths is effective and complete. It could be argued that the use of trig functions makes the representation more complex, but the routine use of both sine and cosine without exploring other strategies leaves the reader wondering if the student is able to use other representations.
Communicating Reasoning (4): The work follows a clear and coherent path all the way to a clearly identified solution. The paper is not enhanced with graphics or examples. Had the student elaborated on their choice of cosine for the check and how it relates to their original method, or elaborated on their decision to use sine for the first solution, this paper may have earned a 5 in communication.
Accuracy (4): The solution of 26.3 (circled twice on the paper) is correct, mathematically justified, and supported by the work. The paper does not contain extensions, connections, or generalizations (except the use of x + y + z + w, which is minimal).
Reflecting and Evaluating (4): The reflection justifies the solution completely by reviewing all aspects of the work. In order to use cosine, the student needed to re-examine the diagram to determine the length of a different side and re-do all calculations. The student also shows evidence of re-adding the 4 side lengths. Though the student used cosine instead of sine as a reflection, it is debatable whether that is a different strategy. If a scorer felt that the two solutions were sufficiently different to warrant a score of 5 here, the higher score could certainly be defended.

This page is
intentionally left blank.

M3HS_2

M3HS_2

Mathematics: Essential Skills Scores and Commentary
Work Sample Title: Gopher Security Paper Number: M3HS_2 Algebra Geometry
Statistics High School Content Standard: H.1G.4: Use trigonometric ratios (sine, cosine and tangent) and the Pythagorean Theorem to solve for unknown lengths in right triangles.
Achievement Level Descriptor: Use coordinate geometry to justify properties, explain conjectures, and solve problems involving two dimensional figures with numeric coordinates.
Making Sense of the Task
Representing and Solving the Task
Communicating Reasoning
Accuracy Reflecting and Evaluating
5 5 5 5 5
Making Sense of the Task (5): The student made sense of the task by using the given angles to create equivalent ratios using sine and cosine, finding the lengths of the individual segments, and then adding them together. In addition, the diagram and explanation to the right provides evidence of how the student makes sense of the relationship between the given angles and the outer triangles outlined by the student in their diagram. The student also shows his/her thinking about each side length as it relates to the particular ratio they’ve set up through the individual triangles. The use of the distance formula to check their work shows that this student can make sense of the task in more than one way. All this leads to the score of 5 in this dimension.
Representing and Solving the Task (5): The strategy of using trig ratios to find the side lengths is effective and complete. This dimension is enhanced through the use of labeled diagrams (top of the page and the individual triangles for each ratio) and the well developed use of symbols to explain the strategy used.
Communicating Reasoning (5): The work follows a clear and coherent path all the way to a clearly identified solution. The communication is enhanced with additional graphics and explanations that help the reader move easily from one thought to another.
Accuracy (5): The solution of 26.3 (boxed in on each page) is correct, mathematically justified, and supported by the work. The student enhances their accuracy score by providing a generalized procedure for each method they used. The first is summarized in the bottom, right corner and the second is summarized near the top of the second page.
Reflecting and Evaluating (5): The reflection justifies the solution completely by reviewing all aspects of the work. The student reworks the task using a completely different method (the distance formula), which bumps the score in this dimension to a 5.

This page is
intentionally left blank.

M3HS_3

M3HS_3

M3HS_3

Mathematics: Essential Skills Scores and Commentary
Work Sample Title: Gopher Security Paper Number: M3HS_3 Algebra Geometry
Statistics High School Content Standard: H.1G.4: Use trigonometric ratios (sine, cosine and tangent) and the Pythagorean Theorem to solve for unknown lengths in right triangles.
Achievement Level Descriptor: Use coordinate geometry to justify properties, explain conjectures, and solve problems involving two dimensional figures with numeric coordinates.
Making Sense of the Task
Representing and Solving the Task
Communicating Reasoning
Accuracy Reflecting and Evaluating
3 3 3 3 3
Making Sense of the Task (3): The student attempts to find the length of the individual segments by using the Pythagorean Theorem and the Distance Formula, although their values for side AB and side AD are incorrect. The student does not show an understanding of finding the total distance the beam will travel. This makes the interpretation and translation partially developed. Had the student showed evidence of trying to arrive at a total distance, he/she may have been able to receive a 4 in this dimension.
Representing and Solving the Task (3): The strategy of the finding the length of the individual segments by using the Pythagorean Theorem and the Distance Formula was a good start, but the strategy was incomplete because they never found the total distance. They completed their strategy of using the Pythagorean Theorem and the Distance Formula to find the individual lengths, but these strategies were only partially effective because they did not completely solve the task.
Communicating Reasoning (3): The communication does not clearly lead to a solution. The student also states “I saw that it was in cubics so I counted off the cubes to the distance of the outside of the triangle,” which is an unclear use of mathematical language.
Accuracy (3): The student used a value of 32 for 6 squared, which would have resulted in an incorrect answer even if he/she had added the 4 side lengths together. The error on side AB and the lack of a total make the solution incorrect due to two minor errors.
Reflecting and Evaluating (3): Although the student calculates the segment lengths again using the distance formula, it is apparent they did not check their calculations (they made the same mistake twice in using 32 as the square of 6) or reflect on what was asked for in the original problem (a total distance). Therefore, the reflection only partially justifies the outcome.

M3HS_4
Mathematics: Essential Skills Scores and Commentary
Work Sample Title: Gopher Security Paper Number: M3HS_4 Algebra Geometry
Statistics High School Content Standard: H.1G.4: Use trigonometric ratios (sine, cosine and tangent) and the Pythagorean Theorem to solve for unknown lengths in right triangles.
Achievement Level Descriptor: Use coordinate geometry to justify properties, explain conjectures, and solve problems involving two dimensional figures with numeric coordinates.
Making Sense of the Task
Representing and Solving the Task
Communicating Reasoning
Accuracy Reflecting and Evaluating
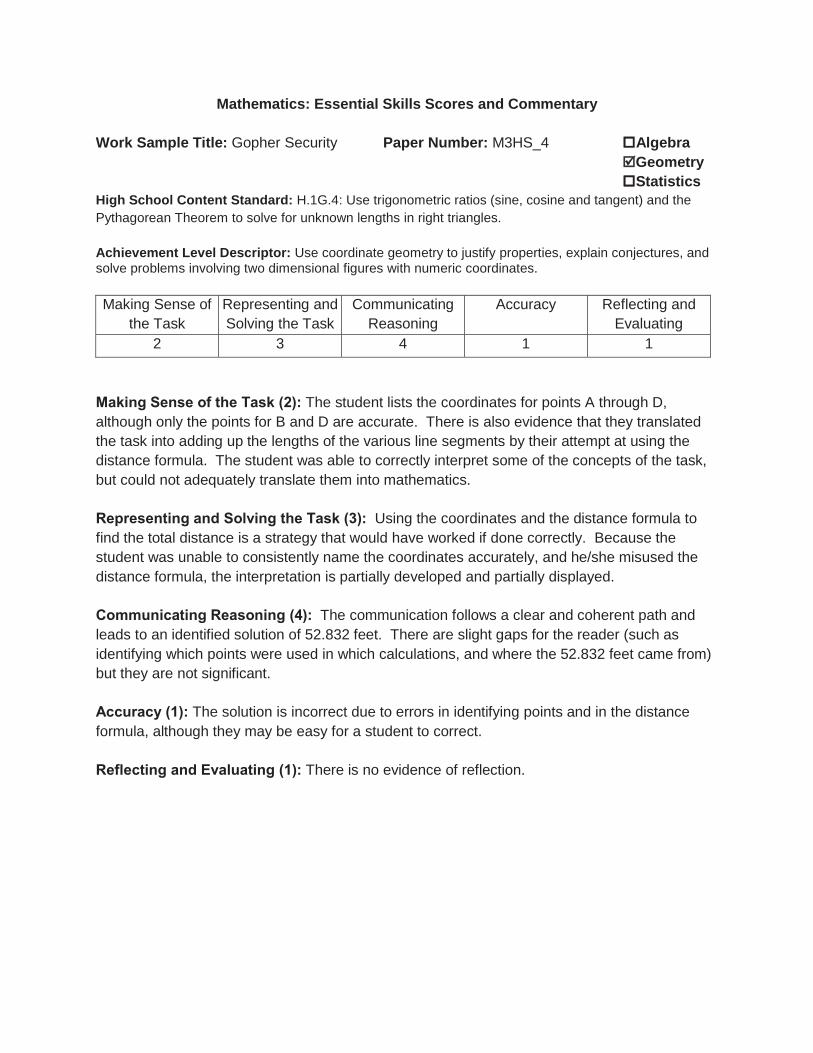
2 3 4 1 1
Making Sense of the Task (2): The student lists the coordinates for points A through D, although only the points for B and D are accurate. There is also evidence that they translated the task into adding up the lengths of the various line segments by their attempt at using the distance formula. The student was able to correctly interpret some of the concepts of the task, but could not adequately translate them into mathematics.
Representing and Solving the Task (3): Using the coordinates and the distance formula to find the total distance is a strategy that would have worked if done correctly. Because the student was unable to consistently name the coordinates accurately, and he/she misused the distance formula, the interpretation is partially developed and partially displayed.
Communicating Reasoning (4): The communication follows a clear and coherent path and leads to an identified solution of 52.832 feet. There are slight gaps for the reader (such as identifying which points were used in which calculations, and where the 52.832 feet came from) but they are not significant.
Accuracy (1): The solution is incorrect due to errors in identifying points and in the distance formula, although they may be easy for a student to correct.
Reflecting and Evaluating (1): There is no evidence of reflection.

M3HS_5

M3HS_5

Mathematics: Essential Skills Scores and Commentary
Work Sample Title: Gopher Security Paper Number: M3HS_5 Algebra Geometry
Statistics High School Content Standard: H.1G.4: Use trigonometric ratios (sine, cosine and tangent) and the Pythagorean Theorem to solve for unknown lengths in right triangles.
Achievement Level Descriptor: Use coordinate geometry to justify properties, explain conjectures, and solve problems involving two dimensional figures with numeric coordinates.
Making Sense of the Task
Representing and Solving the Task
Communicating Reasoning
Accuracy Reflecting and Evaluating
4 4 3 3 1
Making Sense of the Task (4): The translation of the task into finding the total distance using the Pythagorean Theorem is fully developed and displayed. Undertaking the second method using cosine is where the student ran into trouble, but the work shows that the student makes sense of the problem in the context of the Pythagorean Theorem.
Representing and Solving the Task (4): The strategy of using the Pythagorean Theorem to find the side lengths and then adding them together is effective and complete. Again, the second method was not effective, but could have been if the student had been able to find the cosine of each angle.
Communicating Reasoning (3): The communication follows a clear and coherent path through the first part of the work, and even the second attempt is easy to follow, although the student misuses cosine to solve their proportions, Since the work does not lead to a clear solution the communication cannot be a 4. The student does not know how to resolve the discrepancy between the two solutions and is unable to decide which, if either, is correct.
Accuracy (3): There is a correct solution on the paper, but there is also an incorrect solution on the paper. Since the student is unable to decide which is correct, the solution is considered partially correct and partially complete.
Reflecting and Evaluating (1): A solution is not clearly identified and although the student attempts to justify their first solution they are unable to do so. This makes their justification ineffective.

This page is
intentionally left blank.

Mathematics Work Sample High School 2011 – 2012 – Pony Rides
Use the information provided to solve the problem listed below. Be sure to show your work at all phases of problem-solving. Refer to the Student Problem Solving Tips to receive the highest score in each of the five areas.
Algebra Geometry Statistics Content Standard: H.3A Algebra: Use quadratic and exponential equations and functions to represent relationships. Achievement level descriptor: Solve quadratic equations graphically and algebraically and explain the relationship between the two strategies. Name: ______________________________________
School: _____________________________________
Teacher: ____________________________________
Ben and Sarah own lots of ponies and often take them to fairs and other gatherings and sell pony rides. They have found that when they charge $6.00 per ride, they average 310 riders a day. Ben has been perfectly satisfied traveling around the countryside and bringing in that daily average revenue of $1860.00. Sarah, however, wants to bring in more money. She says that if they charge $12 per ride, their daily revenue will be $3720.00. Ben doesn’t agree. He says they won’t be able to attract an average of 310 riders each day at that price, so their daily revenue won’t increase that much. Each one sees the point the other is trying to make. They finally agree that for every dollar they increase the price of a ride, they will probably lose 20 customers daily. Based on that assumption, what price per ride should they charge to achieve the maximum amount of revenue? What is that maximum revenue amount?

This page is
intentionally left blank.

M3HS_6

M3HS_6

Mathematics: Essential Skills Scores and Commentary
Work Sample Title: Pony Rides Paper Number: M3HS_6 Algebra
Geometry
Statistics High School Content Standard: H.3A: Use quadratic and exponential equations and functions to
represent relationships.
Achievement Level Descriptor: Solve quadratic equations graphically and algebraically and explain the
relationship between the two strategies.
MS RS CR AC RE
5 6 5 5 6
Making Sense of the Task: 5
Details in the first paragraph such as the rate of loss being 1/20 and the realization that he/she needed to represent both an increase of money and a decrease of people, show a strong understanding of the task. The mathematical understanding is thoroughly developed through the justifications for their representations (“...because every dollar you add you lose 20 people” and “...because ‘m’ both determines the increase of money and the decrease of people.”). Had the mathematical connection between the narrative in paragraph 1 and their final equation of f(x) = x(310-(x-6)20) been stronger, this paper could have scored a 6. Representing and Solving the Task: 6 The student writes an appropriate quadratic equation, simplifies it, and then checks the equation by substituting 6 for x and 1860 for y to make sure it checks. After considering values of 7 and 8 in the equation, the student finds the maximum algebraically, using more complex mathematics. The student also represents the task using a graph and accurately identifies the maximum. Their strategy is enhanced through the commentary comparing the algebraic method to the graphic method. Communicating Reasoning: 5 The work on the front page (the narrative paragraph, the creation of an equation and then the check of the equation, and the testing of 7 and 8) appear to be a brainstorming session for the student. For the most part it is easy to follow, but it is unclear exactly how the equation f(x) = x(310-(x-6)20) connects to the narrative. The student eventually uses a strategy (on the back) that leads to a strong solution. Had the student more clearly identified the parts of the original function, this paper may have been scored a “6.” Accuracy: 5 The student correctly identifies the maximized value of the quadratic equation. The student also comments on whether or not the answer should be $10.75 or $11.00 depending on whether only whole number answers are acceptable. This shows a generalization about “money problems” being different and the decimal answer being acceptable, and gives this paper a score of 5 instead of 4. Reflecting and Evaluating: 6 The student recognizes the “realism” of whole dollar amount versus the fact that dollars and cents are possible answers used in the problem. Additionally, the student evaluates the potential loss of profit based on a theoretical loss of customers, actually figuring out how many customers might be lost due to the increase in price by $0.75. The student has articulated an evaluation and critique of the method used to solve the problem (“In truth I found the algebraic solving way easier because without the formula….”), providing evidence of considering other possible solutions (see step 8) and/or interpretations.

This page is
intentionally left blank.

M3HS_7

M3HS_7

Mathematics: Essential Skills Scores and Commentary
Work Sample Title: Pony Rides Paper Number: M3HS_7 Algebra Geometry Statistics
High School Content Standard: H.3A: Use quadratic and exponential equations and functions to represent relationships.
Achievement Level Descriptor: Solve quadratic equations graphically and algebraically and explain the relationship between the two strategies.
MS RS CR AC RE3 4 4 3 2
Making Sense of the Task (3): The student has shown a correct interpretation of the price increase and the decrease in number of riders by using the same variable: y = (6+x) (310 – 20x).The fact that the product of those two is the revenue and a table with values are also shown.However, the interpretation is only partially developed because the task is represented using only discrete increments of whole dollar amounts. The interpretation is not adequate (not a 4) because the student does not consider fractions of dollars, and there is no evidence that the student understands how to apply the properties of quadratic functions (the vertex representing the maximum).
Representing and Solving the Task (4): The strategy of generating a table (probably from the equation) is complete, although only whole dollar increases are considered (this is addressed in the “Making Sense” dimension). Had the student used the table or equation to find the maximum value for the equation (or considered the possibility that the maximum can be generated from other than a whole dollar amount), this paper may have scored a 5.
Communicating Reasoning (4): The student has created a clear path to the solution, which is circled in the chart and explained to the right. The use of labels and arrows on the components of the equation: y = (6+x) (310 – 20x) and the commentary to the left, “These two individual equations…” help to create a coherent path throughout the paper. Mathematical language is used to clarify the equation and the table.
Accuracy (3): An answer of $11 does not represent the ticket price for maximum revenue. It may show either that the student doesn’t know how to find the maximum or has determined that only whole dollar amounts are reasonable. Without further clarification, via revision, the solution is partially correct.
Reflecting and Evaluating (2): The student reflection (on back) is minimal. The student plots the points from the table, but fails to recognize that the circled point on the graph is not the maximum. There is no evidence of further reflection or justification (i.e. calculations).
NOTE: This is a good example of a paper which, with revision, would likely earn passing scores.

This page is
intentionally left blank.

M3HS_8
M3HS_8

Mathematics: Essential Skills Scores and Commentary
Work Sample Title: Pony Rides Paper Number: M3HS_8 Algebra Geometry
Statistics High School Content Standard: H.3A: Use quadratic and exponential equations and functions to represent relationships. Achievement Level Descriptor: Solve quadratic equations graphically and algebraically and explain the relationship between the two strategies.
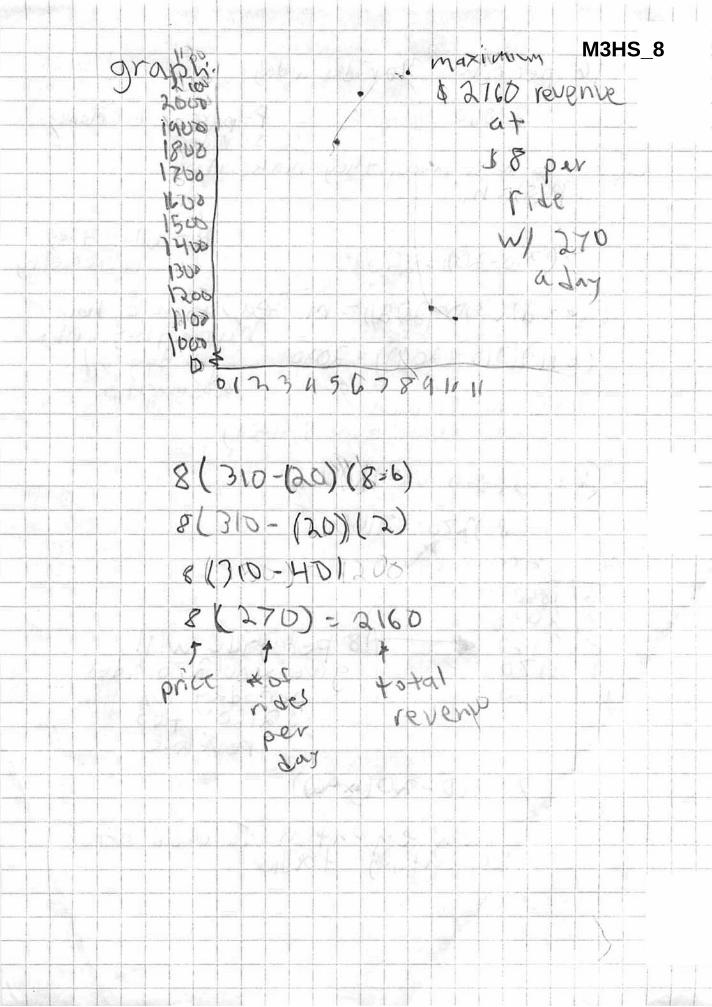
MS RS CR AC RE 3 3 3 2 2
Making Sense of the Task: 3 The student translates the given information into relationships which lead to a quadratic equation. The student clearly understands that two things are being varied in the task; the number of riders and the cost per rider. The equations are relevant to the problem, and can be used to derive the solution. The interpretation is not adequate (not a 4) because the student does not consider fractions of dollars, and there is no evidence that the student understands how to apply the properties of quadratic functions. The graph on page two shows discrete points with evidence that they may have been connected but have been erased. The equation from page one is used to substitute their answer of $8 per ride but is never solved algebraically to find the maximum value. Representing and Solving the Task: 3 The student chooses a table to represent the task, based on calculations representing how much is charged and the estimated number of rides that will be lost due to the increased fee. The chart is only partially effective at leading the student to the proper solution.
Communicating Reasoning: 3 The equation the student derives is not used consistently throughout the table calculations. It is only partially effective in providing accurate information on which to base a conclusion. There are gaps in the calculations above a charge of $8.00 per ride that ultimately lead the student to draw an inaccurate conclusion. Accuracy: 2 The given solution of “$8.00 per ride given 270 rides per day with $2160 top revenue” is not correct. It does not provide for the possibility of non-integer revenues, nor does the graph on the back page provide reasonable support of the accuracy of the conclusion. Reflecting and Evaluating: 2 There is minimal evidence that the student has re-examined the data; while the equation at the bottom of page one clearly indicates a quadratic equation, the student’s graph on page two does not reflect this. The random points demonstrate a “maximum” value, but this is just a confirmation of the chart shown on page one, not an effective consideration of the accuracy of the solution. *Note: What would have helped this paper would have been consistent arithmetic in filling out the table once the student derived the relationship. There is rudimentary understanding of the task at hand; the solution got lost in the details of the actual calculations.

This page is
intentionally left blank.

M3HS_9

Mathematics: Essential Skills Scores and Commentary
Work Sample Title: Pony Rides Paper Number: M3HS_9 Algebra
Geometry
Statistics High School Content Standard: H.3A: Use quadratic and exponential equations and functions to
represent relationships.
Achievement Level Descriptor: Solve quadratic equations graphically and algebraically and explain the
relationship between the two strategies.
MS RS CR AC RE
3 4 5 3 3
Making Sense of the Task: 3 The student has correctly translated the concept of increasing ticket price and its effect on ticket sales and revenue. The student has not, however, considered that a ticket price may be something other than a whole dollar amount. The student has also interpreted the task algebraically using two separate linear equations and has therefore not demonstrated an ability to interpret the task into a quadratic representation. Representing and Solving the Task: 4 The equation to determine the number of riders, “r = -20p + 430” and solve for the corresponding income, “I = r(p)” is effective and would have led to the maximum value of the quadratic function had the student not limited it to whole dollar amounts.
Communicating Reasoning: 5 The use of the table, the accompanying dialogue and the well labeled equations with examples and explanations makes the communication enhanced. The reader is able to move easily from one thought to another.
Accuracy: 3 The solution of an $11 ticket price resulting in revenue of $2310 is not correct; it does not represent the ticket price for maximum value ($10.75 for revenue of $2311.25) Reflecting and Evaluating: 3 The student has done a nice job of reflecting on the calculations that yielded the solution, but has not reviewed the task situation or the reasonableness of the answer. The solution is, therefore, only partially justified. *Note: This is an example of a paper that would likely earn passing scores in all dimensions if revised.

M3HS_10

Mathematics: Essential Skills Scores and Commentary
Work Sample Title: Pony Rides Paper Number: M3HS_10 Algebra Geometry
Statistics High School Content Standard: H.3A: Use quadratic and exponential equations and functions to represent relationships.
Achievement Level Descriptor: Solve quadratic equations graphically and algebraically and explain the relationship between the two strategies.
MS RS CR AC RE6 6 5 6 6
Making Sense of the Task: 6The translation is thoroughly developed by generalizing the situation as two quadratic equations. The first uses the increase in ticket price as the independent variable, while the second uses the ticket price as the independent variable. The student’s proficiency with quadratics (understanding that the vertex provides the maximum) precludes the necessity to provide a detailed graph.
Representing and Solving the Task: 6 The strategy of solving the first quadratic by quickly finding and interpreting the meaning of the
vertex is insightful and elegant. The second strategy of finding the quadratic and using matrix algebra enhances the work by providing a different mathematical representation of the solution.
Communicating Reasoning: 5 The use of mathematical language is precise and accurate. The elegantly efficient first solution
allows the reader to move easily through the work. The check in the middle of the paper supports the solution. Then, the second strategy provides a completely different and proficient approach, enhancing the entire paper.
Accuracy: 6 The correct answer (a ticket price of $10.75 resulting in the maximum revenue of $2311.25) is arrived at by two completely different methods and supported by the check in the middle of the paper. Even though the student does not ask any new questions which lead to new problems, every other bullet in the **6/5 category is addressed.
Reflecting and Evaluating: 6The student has reworked the task using a different method and by so doing, has evaluated the effectiveness of the first solution. The reasonableness of the first answer is addressed in the initial check and the second strategy provides the opportunity to consider another possible solution.

M3HS_11

Mathematics: Essential Skills Scores and Commentary
Work Sample Title: Pony Rides Paper Number: M3HS_11 Algebra Geometry
Statistics High School Content Standard: H.3A: Use quadratic and exponential equations and functions to represent relationships.
Achievement Level Descriptor: Solve quadratic equations graphically and algebraically and explain the relationship between the two strategies.
MS RS CR AC RE3 3 4 3 3
Making Sense of the Task: 3The student has adequately translated the task into mathematics by correctly showing the result that raising the ticket price would have on ticket sales and, subsequently, revenue. The student has not, however, considered the possibility that the maximum revenue be achieved by a ticket price other than a whole or half dollar amount. The student also seems satisfied with two maximum values when the situation lends itself to only one.
Representing and Solving the Task: 3The strategy chosen is partially effective. The student clearly shows the connections between the key elements of the problem and supports them with mathematics. The student does not, however, use the table to find the true maximum, thus not applying the properties of quadratic functions (the vertex representing the maximum).
Communicating Reasoning: 4The mathematics is clearly shown and supports the solution, which is clearly identified. By circling both possibilities, the student is pointing out the “tie.” The only stated solution is $11 and $2310.
Accuracy: 3 The solution is partially complete and, therefore, partially correct. The student does not recognize the need to split the “tie” choosing, instead, one of the two, and doesn’t find the correct maximum.
Reflecting and Evaluating: 3 The reflection evident revisits the calculations, making it only partial. The student does not review the task situation or the strategy chosen. It could also be argued that the student doesn’t review the reasonableness of the solution by not questioning the two prices yielding the same “maximum” revenue.
*Note: This is an example of a paper that would most likely receive passing scores in all dimensions if revised.

M3HS_12

Mathematics: Essential Skills Scores and Commentary
Work Sample Title: Pony Rides Paper Number: M3HS_12 Algebra Geometry
Statistics High School Content Standard: H.3A: Use quadratic and exponential equations and functions to represent relationships.
Achievement Level Descriptor: Solve quadratic equations graphically and algebraically and explain the relationship between the two strategies.
MS RS CR AC RE5 4 4 4 2
Making Sense of the Task: 5 The interpretation and translation of the task are thoroughly developed. The table, graphs, and equations show the student clearly understands the relationships between price, customers, and revenue, even noting that one is linear and one is quadratic. The notation “maximum is between 10 and 11” and the small table appear to show that the student understands the symmetry of quadratics. The student doesn’t simply assume that the maximum is halfway between 10 and 11, possibly because, in the original table, the revenues at prices of $10 and $12 are not equidistant from the revenue at $11. For whatever reason, the table with 25 cent increments displays symmetry about the identified maximum. Had the student actually found the vertex of the written quadratic equation, the paper could have scored a 6.
Representing and Solving the Task: 4 The applied strategy of making a table and graphing its points is effective and complete. The student is able to use the table and graphs to bracket the maximum, as evidenced by the notation on the graph that “maximum is between 10 and 11.” Another table, this one with increments of 25 cents instead of whole dollar amounts allows the student to find the exact maximum. The student recognizes that “customers” is linear and “revenue” is quadratic and represents each with an equation. However, the student does not use these symbolic representations to find the maximum. Had the student done so, this paper would have scored a 5 in this dimension.
Communicating Reasoning: 4 The communication follows a clear and coherent path from the generation of the table to symbolic representations of the relationships and through to the graphs. The graphs lead to a more refined table that yields the clearly identified answer of a $10.75 price. The maximum amount is clearly marked in the small table as the “apex.” The paper was not scored a 5 because the communication is not particularly elegant or insightful and not enhanced with graphics or examples (the penguin doesn’t count).

Accuracy: 4 The solution is correct, mathematically justified, and supported by the work. Though the equations might be interpreted as generalizations, the student does not use them to solve the task and makes no real connection between them and the solution. Therefore, this dimension was not scored a 5.
Reflecting and Evaluating: 2 There is minimal evidence of any review or evaluation of the work. If the student had discussed the symmetry apparent in the second table and noted that it proved $10.75 was the desired price or if the student had used the quadratic function on the paper to find the vertex, a higher score in this dimension could have been achieved.

This page is
intentionally left blank.

M3HS_13

Mathematics: Essential Skills Scores and Commentary
Work Sample Title: Pony Rides Paper Number: M3HS_13 Algebra
Geometry
Statistics High School Content Standard: H.3A: Use quadratic and exponential equations and functions to
represent relationships.
Achievement Level Descriptor: Solve quadratic equations graphically and algebraically and explain the
relationship between the two strategies.
MS RS CR AC RE
4 4 3 4 2
Making Sense of the Task: 4
The key concepts of the task are all addressed. The student has translated the task correctly by
showing the connection between increased ticket price and its effect on ridership and revenue.
The student also acknowledges the possibility of a ticket price other than a whole dollar amount
in order to achieve maximum revenue.
Representing and Solving the Task: 4
The strategy chosen is effective. The table represents the result of raising ticket prices by one
dollar at a time, while the calculations below the table shows further refinement. It is unclear
why the student stopped at $10.75 and did not look for other potential maximum values but this
is dealt with in Communicating Reasoning.
Communicating Reasoning: 3
The work leads to a clearly identified solution. There is a gap in the communication of the
reasoning. Why does the student stop at $10.75 instead of looking closer for a better
maximum? Is it obvious that the correct solution has been found due to the symmetric nature of
the results? This is left to the reader to guess.
Accuracy: 4
The solution is correct. The maximum revenue possible for the situation is $2311.25 with a
ticket price of $10.75. Even though there are gaps in the communication, the solution is
mathematically justified and supported by the work.
Reflecting and Evaluating: 2
There is little evidence that the student has reviewed the process or the reasonableness of the
answer, making the review underdeveloped. There is some inherent reflection in the table and
subsequent computations, but not enough to warrant a score of 3.
*Note: This is an example of a paper that would likely earn passing scores in all dimensions
with revision.

M3HS_14

M3HS_14
Mathematics: Essential Skills Scores and Commentary
Work Sample Title: Pony Rides Paper Number: M3HS_14 Algebra Geometry
Statistics High School Content Standard: H.3A: Use quadratic and exponential equations and functions to represent relationships.
Achievement Level Descriptor: Solve quadratic equations graphically and algebraically and explain the relationship between the two strategies.
MS RS CR AC RE3 3 4 3 2
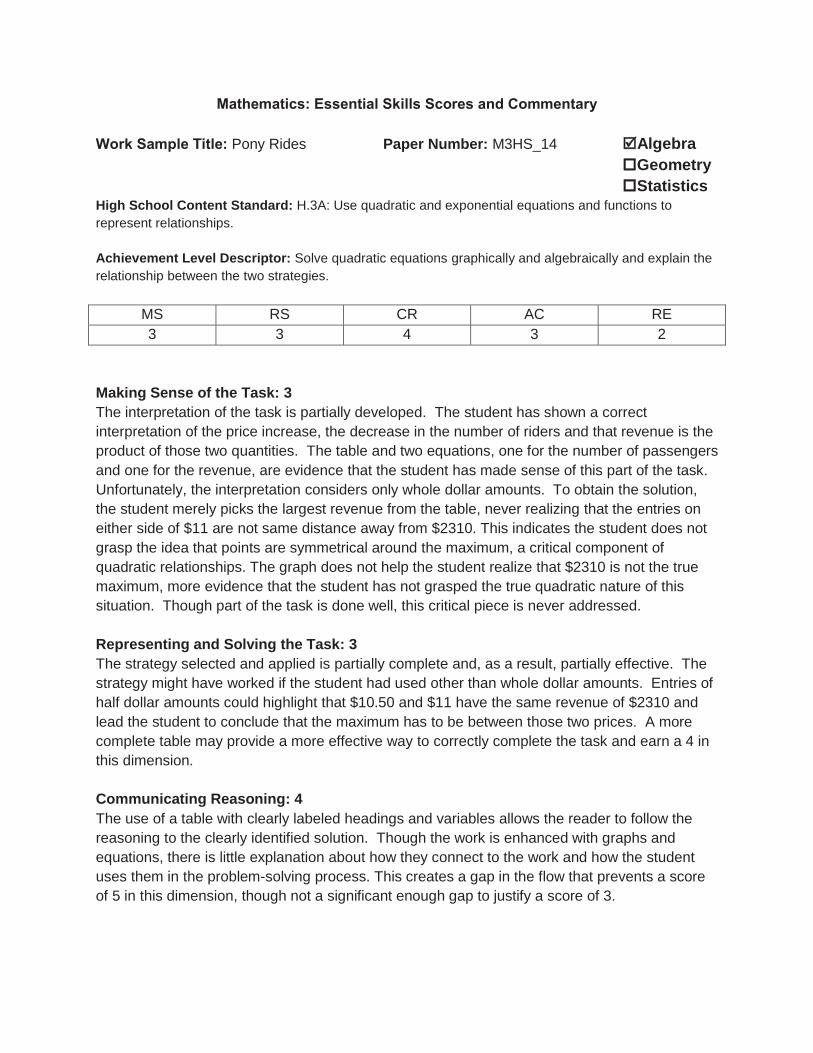
Making Sense of the Task: 3The interpretation of the task is partially developed. The student has shown a correct interpretation of the price increase, the decrease in the number of riders and that revenue is the product of those two quantities. The table and two equations, one for the number of passengers and one for the revenue, are evidence that the student has made sense of this part of the task. Unfortunately, the interpretation considers only whole dollar amounts. To obtain the solution, the student merely picks the largest revenue from the table, never realizing that the entries on either side of $11 are not same distance away from $2310. This indicates the student does not grasp the idea that points are symmetrical around the maximum, a critical component of quadratic relationships. The graph does not help the student realize that $2310 is not the true maximum, more evidence that the student has not grasped the true quadratic nature of this situation. Though part of the task is done well, this critical piece is never addressed.
Representing and Solving the Task: 3The strategy selected and applied is partially complete and, as a result, partially effective. The strategy might have worked if the student had used other than whole dollar amounts. Entries of half dollar amounts could highlight that $10.50 and $11 have the same revenue of $2310 and lead the student to conclude that the maximum has to be between those two prices. A more complete table may provide a more effective way to correctly complete the task and earn a 4 in this dimension.
Communicating Reasoning: 4The use of a table with clearly labeled headings and variables allows the reader to follow the reasoning to the clearly identified solution. Though the work is enhanced with graphs and equations, there is little explanation about how they connect to the work and how the student uses them in the problem-solving process. This creates a gap in the flow that prevents a score of 5 in this dimension, though not a significant enough gap to justify a score of 3.

Accuracy: 3 The solution is incorrect due to the error of not recognizing, from the table, where the true maximum lies. The vertical scale of the carefully constructed graph misleads the student to conclude that it is symmetrical about 11. Because this is more of a mechanical error than an error in understanding, it is minor, justifying a score of 3.
Reflecting and Evaluating: 2 The reflection is underdeveloped and sketchy. Though the graph has the potential to help the student recognize 11 does not generate the true maximum, the scale prevents it. Further reflection is not evident.

M3HS_15

M3HS_15

Mathematics: Essential Skills Scores and Commentary
Work Sample Title: Pony Rides Paper Number: M3HS_15 Algebra Geometry
Statistics High School Content Standard: H.3A: Use quadratic and exponential equations and functions to represent relationships.
Achievement Level Descriptor: Solve quadratic equations graphically and algebraically and explain the relationship between the two strategies.
MS RS CR AC RE
4 5 4 3 2
Making Sense of the Task (4): The student has shown a correct interpretation of the price increase and the decrease in the number of riders by creating a quadratic equation. He/she has also demonstrated how to find the maximum for a quadratic equation. However, the student interprets x as ticket price instead of additional cost above the original $6. Had the student correctly interpreted the meaning of the variable this paper may have been a 5.
Representing and Solving the Task (5): The strategy of representing the number of riders and the price per ticket as a quadratic equation shows an ability to generalize the situation. In addition, the student demonstrates ability to simplify the equation into a format in which he/she can calculate the maximum point algebraically, making the representation more complex. Had the student made connections to other representations (such as a graph or table) he/she may have caught the misuse of the $4.75.
Communicating and Reasoning (4): The student has created a clear path to the solution, which is stated on the back of the paper. There is a slight gap created from the listing of the facts to the part labeled “solve” because the student does not indicate what the various terms of the equation represent (the labels “price charge” and “# of people” do not seem to refer to the equation). The student shows the mechanics of how to simplify the equation and find the maximum but does not enhance the communication for the reader.
Accuracy (3): The answer given is partially correct. The maximum revenue is $2311.25 but charging $4.75 per ticket will not result in this. It is reasonable that this student, if given the opportunity to revise the paper, would realize the mistake and easily correct it.
Reflecting and Evaluating (2): The student reflection (plugging 4.75 into the original equation) is minimal. There is not evidence the student checked his/her original equation or reflected on the meaning of x in the equation. Had the student reflected on the reasonableness of charging LESS than the original $6 ticket price, the error may have been caught.

This page is
intentionally left blank.

Mathematics Work Sample High School 2011 – 2012 – The Bamboo Plant Problem
Use the information provided to solve the problem listed below. Be sure to show your work at all phases of problem-solving. Refer to the Student Problem Solving Tips to receive the highest score in each of the five areas.
Algebra Geometry Statistics Content Standard: H.2A.2:Given a rule, a context, two points, a table of values, a graph, or a linear equation in either slope intercept or standard form, identify the slope of the line, determine the x and/or y intercept(s), and interpret the meaning of each. Achievement level descriptor: Distinguish between, manipulate, and apply linear, quadratic, and exponential functions in routine and non-routine situations using tables, graphs, and equations. Identify the domain and range from a table, graph, or equation. Name: ______________________________________
School: _____________________________________
Teacher: ____________________________________
Julie helped her mother plant a garden in her back yard. Two weeks later, she noticed the bamboo shoot was growing very fast, and she began to keep a chart of its height. Assuming the bamboo grew at a constant rate, how tall was it when it was planted?
# of days since being
planted
Height (in inches)
14 10.5
20 13.5
21 14
35 21

This page is
intentionally left blank.

M3HS_16

Mathematics: Essential Skills Scores and Commentary
Work Sample Title: Bamboo Plant Paper Number: M3HS_16 Algebra
Geometry
Statistics
High School Content Standard: H.2A.2: Given a rule, a context, two points, a table of values, a graph,
or a linear equation in either slope intercept or standard form, identify the slope of the line, determine the
x and/or y intercept(s), and interpret the meaning of each.
Achievement Level Descriptor: Distinguish between, manipulate, and apply linear, quadratic, and exponential functions in routine and non-routine situations using tables, graphs, and equations. Identify the domain and range from a table, graph, or equation.
Making Sense of
the Task
Representing and
Solving the Task
Communicating
Reasoning
Accuracy Reflecting and
Evaluating
5 5 4 4 4
Making Sense of the Task (5): The student interpreted the plant growing at a constant rate by
using two points from the chart in the slope intercept formula (twice) to find the y-intercept. The
student correctly interprets the y-intercept as the height of the tree when planted. He/she also
makes sense of the 0.5 in/day growth rate by making a table. This shows a thoroughly
developed interpretation of the slope and y-intercept in the context of the problem.
Representing and Solving the Task (5): The strategy of using two points from the given table
in the slope intercept formula is effective and enhanced. It demonstrates a more generalized
approach to the task and a strategy that would work in other situations.
Communicating Reasoning (4): The work follows a clear, coherent path all the way to their
clearly identified solution. It is not enhanced by additional graphics or examples.
Accuracy (4): The solution is correct, justified and supported by the work. This paper does not
include extensions or connections to new questions or problems.
Reflecting and Evaluating (4): The solution is stated within the context of the task (written at
the top next to the original question). The reflection occurs throughout the paper and
completely reviews all aspects of the work. The student calculates the slope twice at the top of
the paper using two different points, and then calculates the y-intercept twice and checks both
of those. Though it appears at first glance that the table is a second method of solution, on
close inspection, one can see that it is simply a check that starts with 3.5 and adds 0.5 until day
14, where a height of 10.5 inches is confirmed. This is not a 5 because the student did not
rework the task using a different method, did not evaluate the effectiveness of their approach, or
provide evidence of other possible solutions.

M3HS_17

Mathematics: Essential Skills Scores and Commentary
Work Sample Title: Bamboo Plant Paper Number: M3HS_17 Algebra
Geometry
Statistics High School Content Standard: H.2A.2: Given a rule, a context, two points, a table of values, a graph,
or a linear equation in either slope intercept or standard form, identify the slope of the line, determine the
x and/or y intercept(s), and interpret the meaning of each.
Achievement Level Descriptor: Distinguish between, manipulate, and apply linear, quadratic, and exponential functions in routine and non-routine situations using tables, graphs, and equations. Identify the domain and range from a table, graph, or equation.
Making Sense of
the Task
Representing and
Solving the Task
Communicating
Reasoning
Accuracy Reflecting and
Evaluating
5 5 4 4 2
Making Sense of the Task (5): The interpretation of the task is thoroughly developed. The
student understood the mechanics of using 2 points from the table to find the slope and then
using the slope and one of the points to find the y-intercept. He/she correctly interpreted the
value of the y-intercept as the height at 0 days, showing their ability to connect the mathematical
process of finding the y-intercept to its meaning in the task.
Representing and Solving the Task (5): The strategy of using two points from the table in the
slope intercept formula is effective and enhanced. It demonstrates a more generalized
approach to the task and a strategy that would work in other situations.
Communicating Reasoning (4): The work follows a clear, coherent path all the way to their
clearly identified solution. Had the student made the connection between why 3.5 = b means
that the plant was 3.5 inches tall when it was planted, this may have been a 5 paper.
Accuracy (4): The solution is correct, justified and supported by the work. This paper does not
include extensions or connections to new questions or problems.
Reflecting and Evaluating (2): The justification is underdeveloped. The student comments on
the reasonableness of the answer, but only that it should be “less than when it was 14 days.”
There is no attempt at checking any calculations or the interpretation of 3.5 as the height at 0
days.

M3HS_18

Mathematics: Essential Skills Scores and Commentary
Work Sample Title: Bamboo Plant Paper Number: M3HS_18 Algebra
Geometry
Statistics
High School Content Standard: H.2A.2: Given a rule, a context, two points, a table of values, a graph,
or a linear equation in either slope intercept or standard form, identify the slope of the line, determine the
x and/or y intercept(s), and interpret the meaning of each.
Achievement Level Descriptor: Distinguish between, manipulate, and apply linear, quadratic, and exponential functions in routine and non-routine situations using tables, graphs, and equations. Identify the domain and range from a table, graph, or equation.
Making Sense of
the Task
Representing and
Solving the Task
Communicating
Reasoning
Accuracy Reflecting and
Evaluating
3 2 3 1 1
Making Sense of the Task (3): The translation of the task is partially developed and displayed.
The concept of slope seems to be hinted at by the differences between successive data points
noted next to the table. However, the student has written “y = .5x + 6” and shown no evidence
of understanding y-intercept. To further confuse matters, the numbers in the student’s table do
not match the numbers given in the task. The “b=3.5” at the bottom of the page does not
connect to the table or the equation y = .5x + 6.
Representing and Solving the Task (2): The representations used are not useful and conflict
with the solution. The student has paired 14 days with 10 inches in the table (should be 10.5).
Then the student omitted day 6 from the chart. Was this somehow connected to the “+6” to the
left of the chart and the “+6” in the equation? If so, this piece of the strategy was
underdeveloped. If the student had included day 6 in the chart, their solution would have been
incorrect. The equation for the line y = .5x + 6 is a misrepresentation of the situation given.
Communicating Reasoning (3): There are significant gaps in the communication of the work.
Where exactly did .5 come from? How does y = .5x + 6 connect to the problem? Why are 14
days and 10 inches associated with each other? Why is 6 omitted from the chart? How did the
numbers written next to the original table connect with the student table on the right? Where did
b = 3.5 come from (and if the student really thought 3.5 was “b”, why wasn’t it used in the
equation? Was it because “b” stood for bamboo and not the y-intercept?).
Accuracy (1): There is no solution identified, although b = 3.5 is written at the bottom of the
paper. 3.5 is a correct answer but is not supported by the work.
Reflecting and Evaluating (1): A reflection is not evident.

M3HS_19

Mathematics: Essential Skills Scores and Commentary
Work Sample Title: Bamboo Plant Paper Number: M3HS_19 Algebra Geometry
Statistics High School Content Standard: H.2A.2: Given a rule, a context, two points, a table of values, a graph, or a linear equation in either slope intercept or standard form, identify the slope of the line, determine the x and/or y intercept(s), and interpret the meaning of each.
Achievement Level Descriptor: Distinguish between, manipulate, and apply linear, quadratic, and exponential functions in routine and non-routine situations using tables, graphs, and equations. Identify the domain and range from a table, graph, or equation.
Making Sense of the Task
Representing and Solving the Task
Communicating Reasoning
Accuracy Reflecting and Evaluating
4 3 4 3 1
Making Sense of the Task (4): The interpretation and translation of the task are adequately developed and displayed. The student correctly found the rate of change using values from the chart, and then used this information to work backwards from 14 days. The mathematical understanding is not enhanced by other connections or extensions.
Representing and Solving the Task (3): The strategy used is partially effective. The strategy of making a table and subtracting one-half inch each day could have worked, except that the student omitted part of the table and did not adjust the table when the omission was discovered.
Communicating Reasoning (4): The mathematical language and communication of the reasoning follows a clear, coherent path all the way to their clearly identified solution.
Accuracy (3): The solution is incorrect due to a minor error.
Reflecting and Evaluating (1): No reflection is evident, unless one considers the “6” with the arrow written off to the side of the table some evidence of reflection. Even so, the reflection is minimal, which translates to a score of 1.


![Tabletop Exercise Facilitator Handbook Template · Web viewFOR OFFICIAL USE ONLYAbout this Facilitator Guide FACILITATOR HANDBOOK [Exercise Name]Facilitator Handbook FACILITATOR HANDBOOK](https://img.dokumen.tips/doc/110x75/5ae2303b7f8b9a0d7d8bfd35/tabletop-exercise-facilitator-handbook-viewfor-official-use-onlyabout-this-facilitator.jpg)


![Leading group walks: an introduction [Facilitator name]](https://img.dokumen.tips/doc/110x75/56649dbe5503460f94ab0c76/leading-group-walks-an-introduction-facilitator-name.jpg)