Embed Size (px)
Citation preview

FINANCIAL STATEMENT ANALISISBy: Yoseph Kaburuan,MBA.
www.yosephkaburuan.com

WHAT IS FINANCIAL STATEMENT ANALISIS :
Non-accounting majors, especially, should relate well to this chapter
It looks at accounting information from users’ perspective
Relates very closely to topics you will study in your finance course
Therefore, we will use a somewhat broader brush on this chapter
What is financial statement analysis?”Tearing apart” the financial statements and looking at the relationships.

WHO ANALYZES FINANCIAL STATEMENTS?
1. Internal users (i.e., management)
2. External users (emphasis of chapter)Examples? Investors, creditors, regulatory agencies & … Stock market analysts and Auditors

FINANCIAL STATEMENT ANALISIS
What do internal users use it for? Planning, evaluating and controlling
company operations What do external users use it for?
Assessing past performance and current financial position and making predictions about the future profitability and solvency of the company as well as evaluating the effectiveness of management

THE PURPOSE AND BENEFITS OF FINANCIAL STATEMENT ANALYSIS :
To determine the financial position of the company within a certain period, both assets, liabilities, capital, and operating results have been achieved for some period.
To find out what are the weaknesses of the company deficiency (kekurangan).
To determine the strength of the company. To determine the corrective measures that need to be
done in the future relating to the company's current position .
To assess the performance of management , whether it needs improvement or not.
A comparison with other similar companies. Achievement of results.
STEPS AND PROCEDURES IN FINANCIAL ANALYSIS :
Collect data on the company 's financial statements.
Take measurements and calculations with a certain formula.
Provide interpretation of the results have been calculated.
Provide recommendations which needed to the results of the analysis.

METHODS OFFINANCIAL STATEMENT ANALYSIS
1. Horizontal Analisis2. Vertical Analisis3. Common-Size
Statements4. Trend Percentages5. Ratio Analysis

1. HORIZONTAL ANALYSIS
Using comparative financial statements to calculate dollar
or percentage changes in a financial statement item from
one period to the next

2. VERTICAL ANALISIS :
For a single financial statement, each item is expressed as a percentage of a significant total, e.g., all income statement items are expressed as a percentage of sales

3. COMMON-SIZE STATEMENTS
Financial statements that show only percentages and no absolute dollar (rupiah)
amounts

4. TREND PERCENTAGES
Show changes over time in given financial statement
items (can help evaluate financial information of several years)

5. RATIO ANALYSIS
Expression of logical relationships between items in a financial statement of a single
period (e.g., percentage relationship
between revenue and net income)

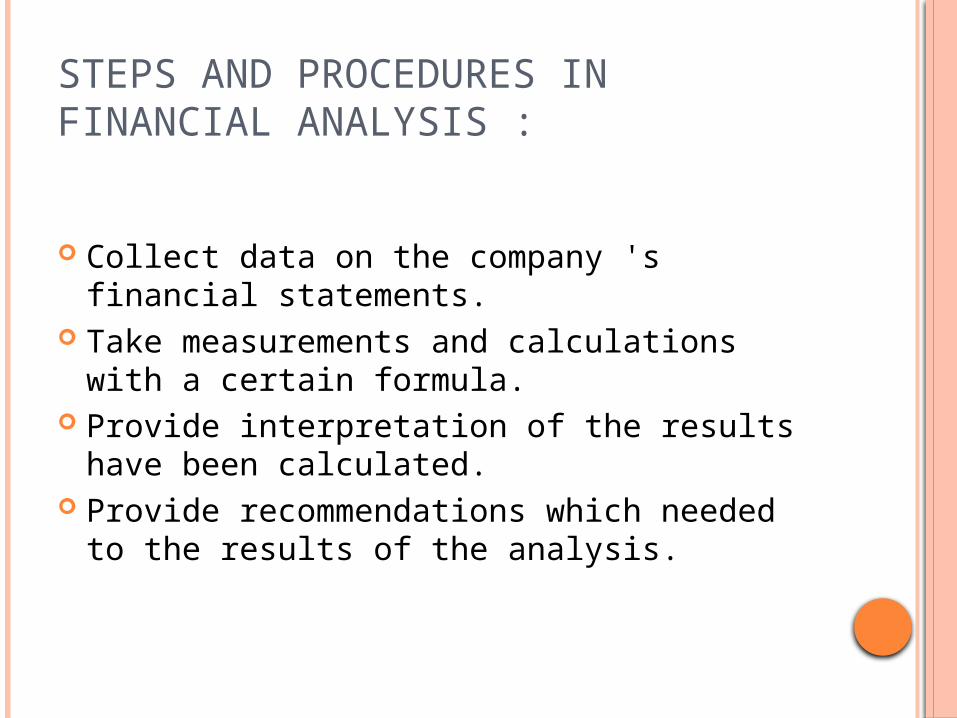
HORIZONTAL ANALYSIS EXAMPLE
The management of Clover Company provides you with comparative balance
sheets of the years ended December 31, 1999 and 1998. Management asks you to prepare a horizontal analysis on the
information.
CLOVER CORPORATION Comparative Balance Sheets December 31, 1999 and 1998
Increase (Decrease)1999 1998 Amount %
Assets
Current assets:
Cash 12,000$ 23,500$
Accounts receivable, net 60,000 40,000
Inventory 80,000 100,000
Prepaid expenses 3,000 1,200
Total current assets 155,000 164,700
Property and equipment:
Land 40,000 40,000
Buildings and equipment, net 120,000 85,000
Total property and equipment 160,000 125,000
Total assets 315,000$ 289,700$

Calculating Change in Dollar Amounts
HORIZONTAL ANALYSIS EXAMPLE
DollarChang
e
Current YearFigure
Base
YearFigure

HORIZONTAL ANALYSIS EXAMPLE
Since we are measuring the amount of the change between 1998 and 1999, the dollar amounts for 1998 become the “base” year figures.
Dollar
Change
Current YearFigur
e
Base YearFigure
Calculating Change in Dollar Amounts

Calculating Change as a Percentage
HORIZONTAL ANALYSIS EXAMPLE
Percentage
Change
Dollar Change
Base Year
Figure
100%

CLOVER CORPORATIONComparative Balance SheetsDecember 31, 1999 and 1998
Increase (Decrease)1999 1998 Amount %
AssetsCurrent assets: Cash 12,000$ 23,500$ (11,500)$ Accounts receivable, net 60,000 40,000 Inventory 80,000 100,000 Prepaid expenses 3,000 1,200 Total current assets 155,000 164,700 Property and equipment: Land 40,000 40,000 Buildings and equipment, net 120,000 85,000 Total property and equipment 160,000 125,000 Total assets 315,000$ 289,700$
$12,000 – $23,500 = $(11,500)
HORIZONTAL ANALYSIS EXAMPLE

CLOVER CORPORATIONComparative Balance SheetsDecember 31, 1999 and 1998
Increase (Decrease)1999 1998 Amount %
AssetsCurrent assets: Cash 12,000$ 23,500$ (11,500)$ (48.9) Accounts receivable, net 60,000 40,000 Inventory 80,000 100,000 Prepaid expenses 3,000 1,200 Total current assets 155,000 164,700 Property and equipment: Land 40,000 40,000 Buildings and equipment, net 120,000 85,000 Total property and equipment 160,000 125,000 Total assets 315,000$ 289,700$
($11,500 ÷ $23,500) × 100% = 48.9%
HORIZONTAL ANALYSIS EXAMPLE

CLOVER CORPORATIONComparative Balance SheetsDecember 31, 1999 and 1998
Increase (Decrease)1999 1998 Amount %
AssetsCurrent assets: Cash 12,000$ 23,500$ (11,500)$ (48.9) Accounts receivable, net 60,000 40,000 20,000 50.0 Inventory 80,000 100,000 (20,000) (20.0) Prepaid expenses 3,000 1,200 1,800 150.0 Total current assets 155,000 164,700 (9,700) (5.9)Property and equipment: Land 40,000 40,000 - 0.0 Buildings and equipment, net 120,000 85,000 35,000 41.2 Total property and equipment 160,000 125,000 35,000 28.0Total assets 315,000$ 289,700$ 25,300$ 8.7
HORIZONTAL ANALYSIS EXAMPLE

Let’s apply the sameprocedures to theliability and stockholders’equity sections of thebalance sheet.

CLOVER CORPORATIONComparative Balance SheetsDecember 31, 1999 and 1998
Increase (Decrease)1999 1998 Amount %
Liabilities and Stockholders' EquityCurrent liabilities: Accounts payable 67,000$ 44,000$ 23,000$ 52.3 Notes payable 3,000 6,000 (3,000) (50.0) Total current liabilities 70,000 50,000 20,000 40.0Long-term liabilities: Bonds payable, 8% 75,000 80,000 (5,000) (6.3) Total liabilities 145,000 130,000 15,000 11.5Stockholders' equity: Preferred stock 20,000 20,000 - 0.0 Common stock 60,000 60,000 - 0.0 Additional paid-in capital 10,000 10,000 - 0.0 Total paid-in capital 90,000 90,000 - 0.0Retained earnings 80,000 69,700 10,300 14.8 Total stockholders' equity 170,000 159,700 10,300 6.4Total liabilities and stockholders' equity 315,000$ 289,700$ 25,300$ 8.7

Now, let’s apply the procedures to theincome statement.
HORIZONTAL ANALYSIS EXAMPLENow, let’s apply the procedures to theincome statement.

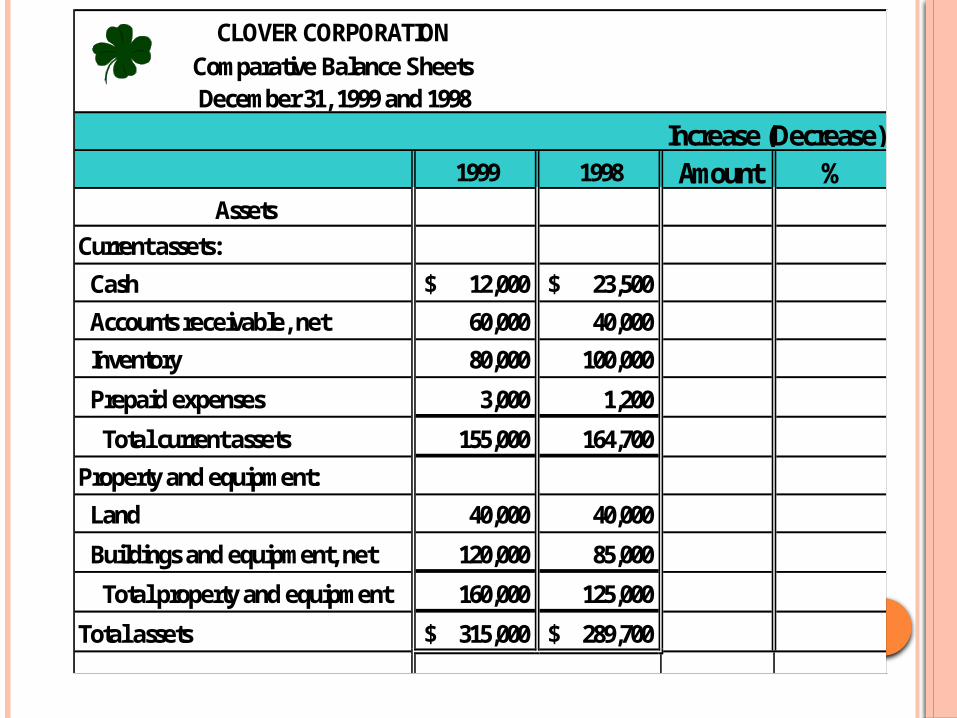
CLOVER CORPORATIONComparative Income Statements
For the Years Ended December 31, 1999 and 1998Increase (Decrease)
1999 1998 Amount %Net sales 520,000$ 480,000$ 40,000$ 8.3Cost of goods sold 360,000 315,000 45,000 14.3Gross margin 160,000 165,000 (5,000) (3.0)Operating expenses 128,600 126,000 2,600 2.1Net operating income 31,400 39,000 (7,600) (19.5)Interest expense 6,400 7,000 (600) (8.6)Net income before taxes 25,000 32,000 (7,000) (21.9)Less income taxes (30%) 7,500 9,600 (2,100) (21.9)Net income 17,500$ 22,400$ (4,900)$ (21.9)
Sales increased by 8.3% while net income decreased by 21.9%.

CLOVER CORPORATIONComparative Income Statements
For the Years Ended December 31, 1999 and 1998Increase (Decrease)
1999 1998 Amount %Net sales 520,000$ 480,000$ 40,000$ 8.3Cost of goods sold 360,000 315,000 45,000 14.3Gross margin 160,000 165,000 (5,000) (3.0)Operating expenses 128,600 126,000 2,600 2.1Net operating income 31,400 39,000 (7,600) (19.5)Interest expense 6,400 7,000 (600) (8.6)Net income before taxes 25,000 32,000 (7,000) (21.9)Less income taxes (30%) 7,500 9,600 (2,100) (21.9)Net income 17,500$ 22,400$ (4,900)$ (21.9)
There were increases in both cost of goods sold (14.3%) and operating expenses (2.1%). These increased costs more than offset the increase in sales, yielding an overall decrease in net income.

VERTICAL ANALYSIS EXAMPLE
The management of Sample Company asks you to prepare a vertical analysis for the comparative balance sheets of
the company.

Sample CompanyBalance Sheet (Assets)
At December 31, 1999 and 1998% of Total Assets
1999 1998 1999 1998Cash 82,000$ 30,000$ 17% 8%Accts. Rec. 120,000 100,000 25% 26%Inventory 87,000 82,000 18% 21%Land 101,000 90,000 21% 23%Equipment 110,000 100,000 23% 26%Accum. Depr. (17,000) (15,000) -4% -4% Total 483,000$ 387,000$ 100% 100%
VERTICAL ANALYSIS EXAMPLE

VERTICAL ANALYSIS EXAMPLE
Sample CompanyBalance Sheet (Assets)
At December 31, 1999 and 1998% of Total Assets
1999 1998 1999 1998Cash 82,000$ 30,000$ 17% 8%Accts. Rec. 120,000 100,000 25% 26%Inventory 87,000 82,000 18% 21%Land 101,000 90,000 21% 23%Equipment 110,000 100,000 23% 26%Accum. Depr. (17,000) (15,000) -4% -4% Total 483,000$ 387,000$ 100% 100%
$82,000 ÷ $483,000 = 17% rounded$30,000 ÷ $387,000 = 8% rounded

Sample CompanyBalance Sheet (Liabilities & Stockholders' Equity)
At December 31, 1999 and 1998% of Total Assets
1999 1998 1999 1998Acts. Payable 76,000$ 60,000$ 16% 16%Wages Payable 33,000 17,000 7% 4%Notes Payable 50,000 50,000 10% 13%Common Stock 170,000 160,000 35% 41%Retained Earnings 154,000 100,000 32% 26% Total 483,000$ 387,000$ 100% 100%
VERTICAL ANALYSIS EXAMPLE
$76,000 ÷ $483,000 = 16% rounded