Embed Size (px)
Citation preview

1

<Insert Picture Here>
Best Practices for Extreme Performance with Data Warehousing on
Oracle Database
Rekha Balwada
Principal Product Manager
3
Agenda
Parallel Execution
• Workload Management on Data Warehouse
• Oracle Exadata Database Machine

4
Best Practices for Data Warehousing3 Ps - Power, Partitioning, Parallelism
Power – A Balanced Hardware Configuration
Weakest link defines the throughput
Partition larger tables or fact tables
Facilitates data load, data elimination and join performance
Enables easier Information Lifecycle Management
Parallel Execution should be used
Instead of one process doing all the work multiple processes
working concurrently on smaller units
Parallel degree should be power of 2
Goal is to minimize the amount of data accessed and use the most efficient joins

5
<Insert Picture Here>
Agenda
Parallel Execution
• Workload Management on a Data Warehouse
• Oracle Exadata Database Machine
6
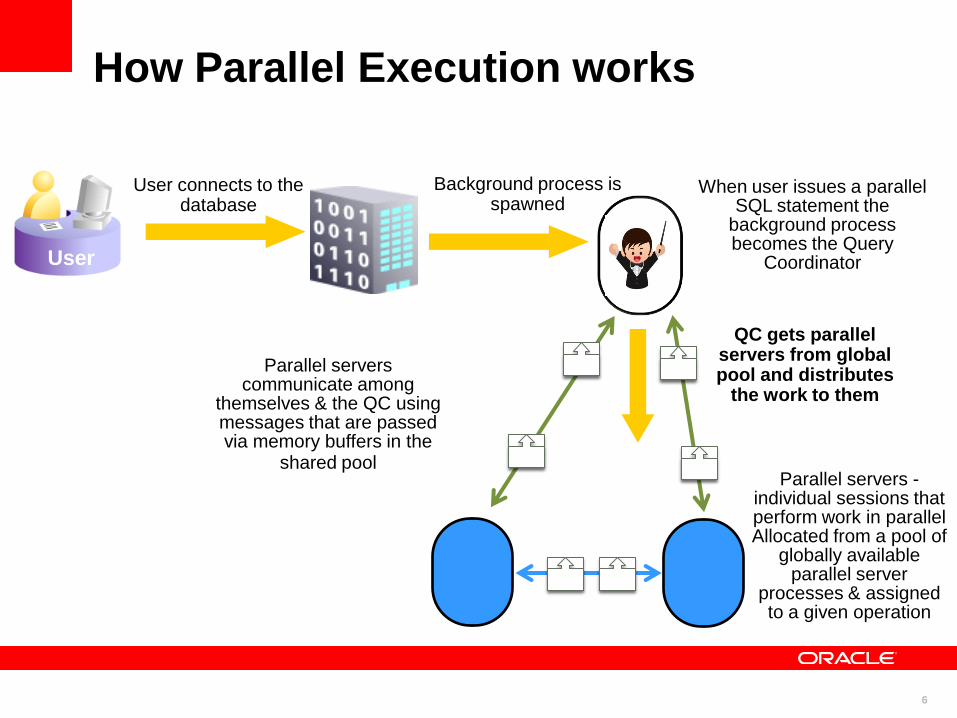
How Parallel Execution works
User connects to the database
User
Background process is spawned
When user issues a parallel SQL statement the
background process becomes the Query
Coordinator
QC gets parallel servers from global pool and distributes
the work to them
Parallel servers -individual sessions that perform work in parallel Allocated from a pool of
globally available parallel server
processes & assigned to a given operation
Parallel servers communicate among
themselves & the QC using messages that are passed via memory buffers in the
shared pool

7
Parallel Servers
do majority of the work
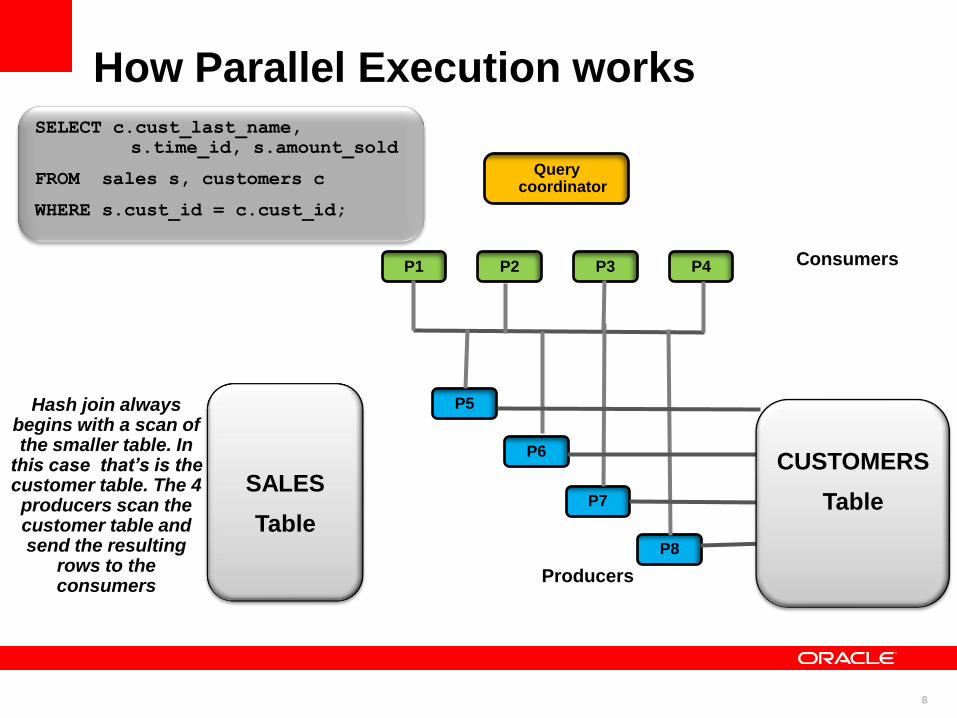
Monitoring Parallel ExecutionSELECT c.cust_last_name, s.time_id, s.amount_sold
FROM sales s, customers c
WHERE s.cust_id = c.cust_id;
Query Coordinator
8
Producers
Consumers
Query coordinator
P1 P2 P3 P4
Hash join always begins with a scan of the smaller table. In
this case that’s is the customer table. The 4 producers scan the customer table and send the resulting
rows to the consumers
P8
P7
P6
P5
SALES
Table
CUSTOMERS
Table
SELECT c.cust_last_name,
s.time_id, s.amount_sold
FROM sales s, customers c
WHERE s.cust_id = c.cust_id;
How Parallel Execution works

9
Producers
Consumers
Query coordinator
P1 P2 P3 P4
Once the 4 producers finish scanning the customer table, they
start to scan the Sales table and send the resulting rows to
the consumersP8
P7
P6
P5
SALES
Table
CUSTOMERS
Table
SELECT c.cust_last_name,
s.time_id, s.amount_sold
FROM sales s, customers c
WHERE s.cust_id = c.cust_id;
How Parallel Execution works

10
Producers
Consumers
P1 P2 P3 P4
P8
P7
P6
P5
Once the consumers receive the rows from the sales table they begin to
do the join. Once completed they return the results to the QC
Query coordinator
SALES
Table
CUSTOMERS
Table
SELECT c.cust_last_name,
s.time_id, s.amount_sold
FROM sales s, customers c
WHERE s.cust_id = c.cust_id;
How Parallel Execution works
11
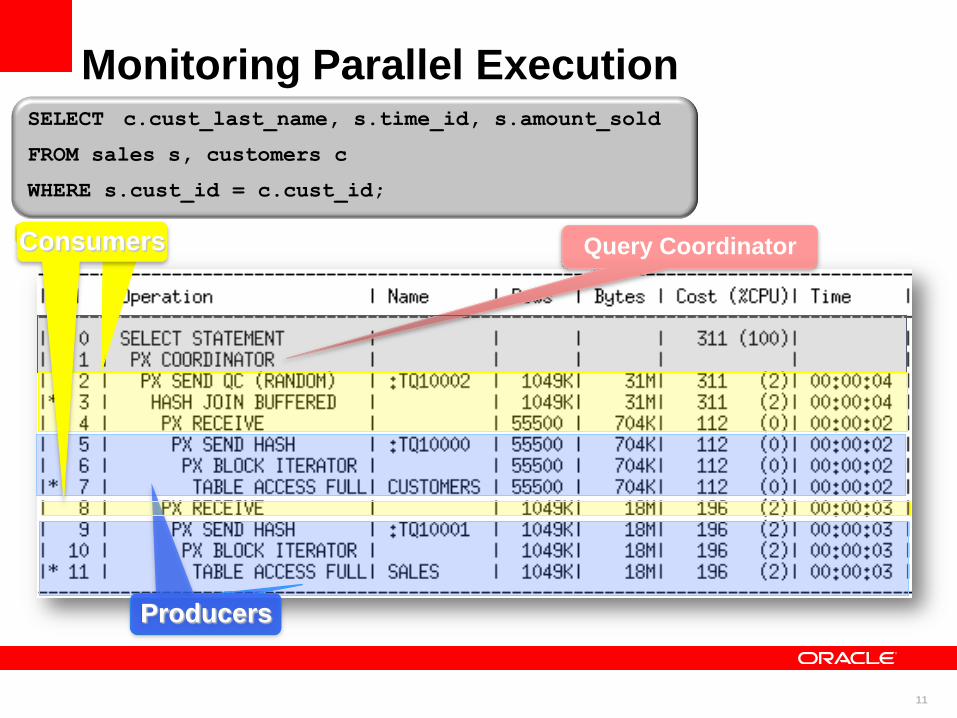
SELECT c.cust_last_name, s.time_id, s.amount_sold
FROM sales s, customers c
WHERE s.cust_id = c.cust_id;
Query Coordinator
ProducersProducers
ConsumersConsumers
Monitoring Parallel Execution

12
Oracle Parallel Query: Scanning a Table
Data is divided into Granules
Block range or partition
Each Parallel Server is assigned one or more Granules
No two Parallel Servers ever contend for the same Granule
Granules are assigned so that the load is balanced across all Parallel Servers
Dynamic Granules chosen by the optimizer
Granule decision is visible in execution plan
. . .
Parallel server # 1
Parallel server # 2
Parallel server # 3

Identifying Granules of Parallelism during
Scans in the Plan
14
Best Practices for using Parallel Execution
Current Issues
Difficult to determine ideal DOP for each table without manual tuning
One DOP does not fit all queries touching an object
Not enough PX server processes can result in statement running serial
Too many PX server processes can thrash the system
Only uses IO resources
Solution
• Oracle automatically decides if a statement
–Executes in parallel or not and what DOP it will use
–Can execute immediately or will be queued
–Will take advantage of aggregated cluster memory or not
15
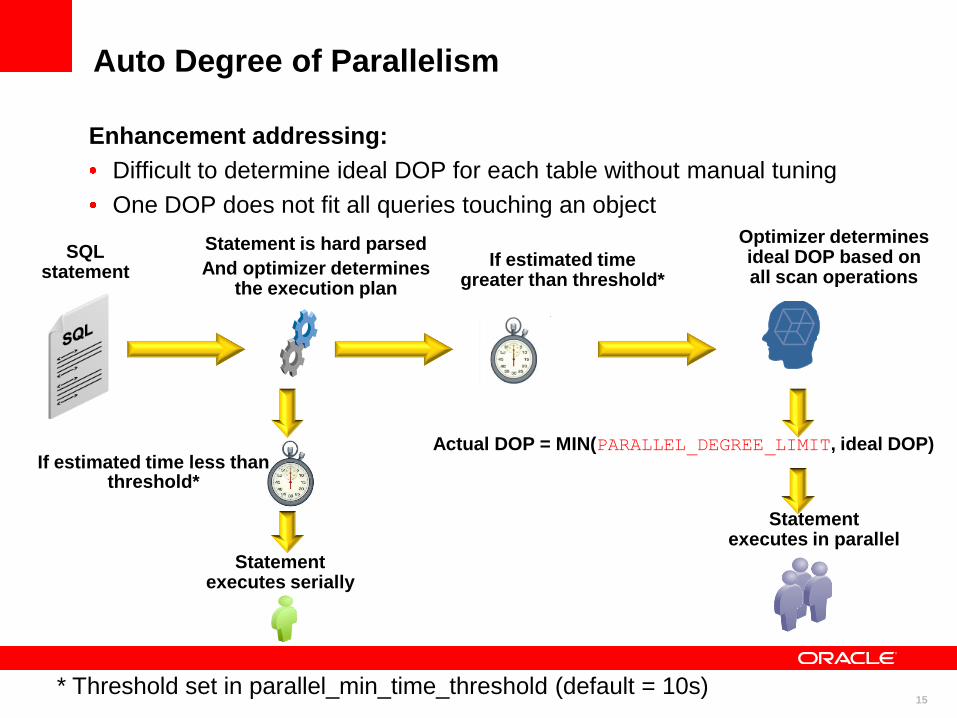
Auto Degree of Parallelism
Enhancement addressing:
Difficult to determine ideal DOP for each table without manual tuning
One DOP does not fit all queries touching an object
SQLstatement
Statement is hard parsed
And optimizer determines the execution plan
Statement executes in parallel
Actual DOP = MIN(PARALLEL_DEGREE_LIMIT, ideal DOP)
Statement executes serially
If estimated time less than threshold*
Optimizer determines ideal DOP based on all scan operations
If estimated time greater than threshold*
* Threshold set in parallel_min_time_threshold (default = 10s)
16
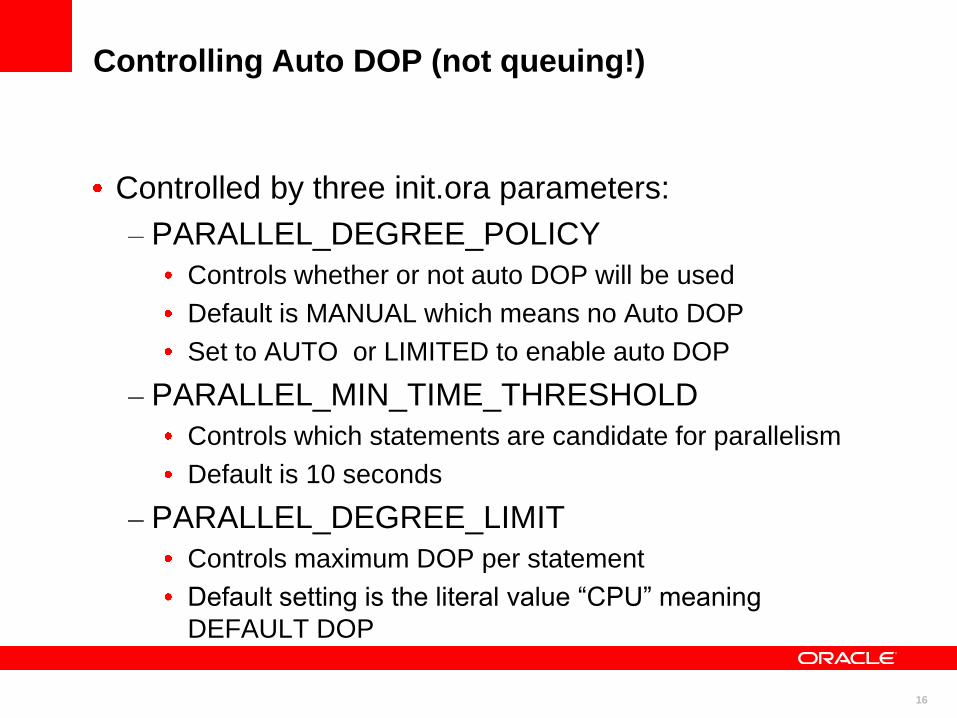
Controlling Auto DOP (not queuing!)
Controlled by three init.ora parameters:
PARALLEL_DEGREE_POLICY
Controls whether or not auto DOP will be used
Default is MANUAL which means no Auto DOP
Set to AUTO or LIMITED to enable auto DOP
PARALLEL_MIN_TIME_THRESHOLD
Controls which statements are candidate for parallelism
Default is 10 seconds
PARALLEL_DEGREE_LIMIT
Controls maximum DOP per statement
Default setting is the literal value “CPU” meaning
DEFAULT DOP
17
<Insert Picture Here>
What does this really mean?
Working with Statement Queuing
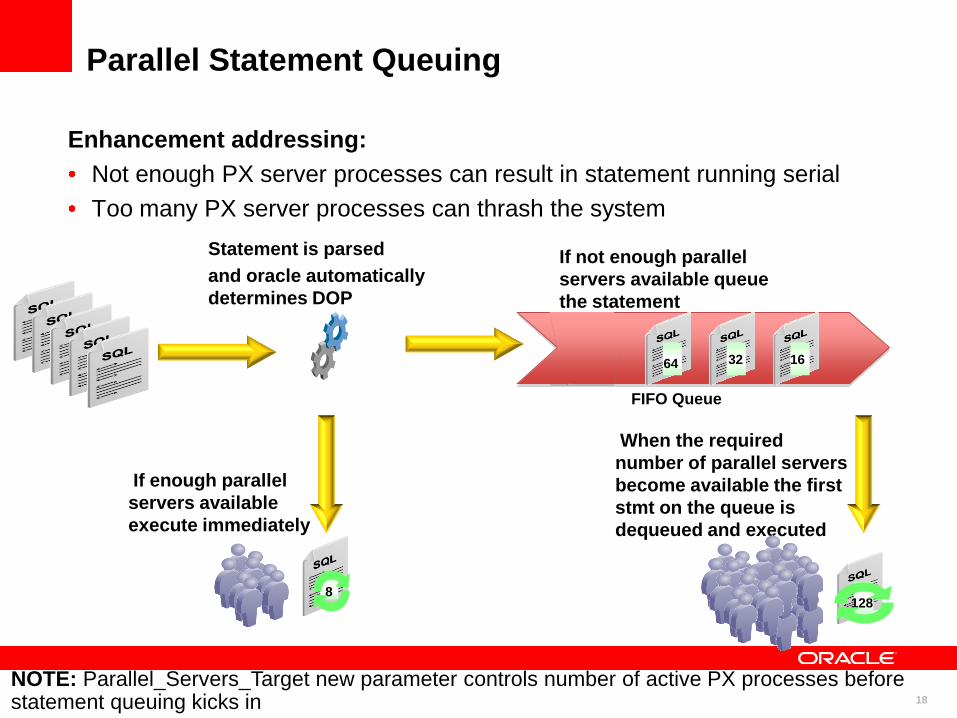
18
SQL
statements
Statement is parsed
and oracle automatically
determines DOP
If enough parallel
servers available
execute immediately
If not enough parallel
servers available queue
the statement
128163264
8
FIFO Queue
When the required
number of parallel servers
become available the first
stmt on the queue is
dequeued and executed
128
163264
Parallel Statement Queuing
Enhancement addressing:
Not enough PX server processes can result in statement running serial
Too many PX server processes can thrash the system
NOTE: Parallel_Servers_Target new parameter controls number of active PX processes before statement queuing kicks in
19
Parallel Statement Queuing
Benefits:
Allows for higher DOPs per statement without thrashing the
system
Allows a set of queries to run at roughly the same aggregate
time by allowing the optimal DOP to be used all the time
Potential Costs:
Adds delay to your execution time if your statement is queued
making elapse times more unpredictable
Goal:
Find the optimal queuing point based on desired concurrency
20
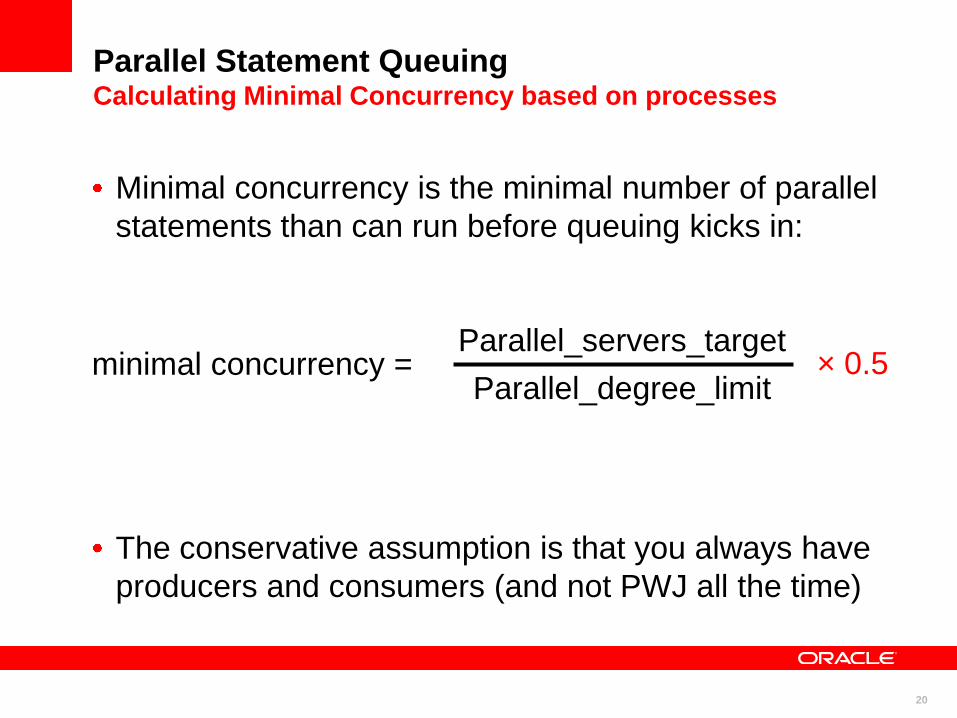
Parallel Statement QueuingCalculating Minimal Concurrency based on processes
Minimal concurrency is the minimal number of parallel
statements than can run before queuing kicks in:
minimal concurrency =
The conservative assumption is that you always have
producers and consumers (and not PWJ all the time)
Parallel_servers_target
Parallel_degree_limit× 0.5
21
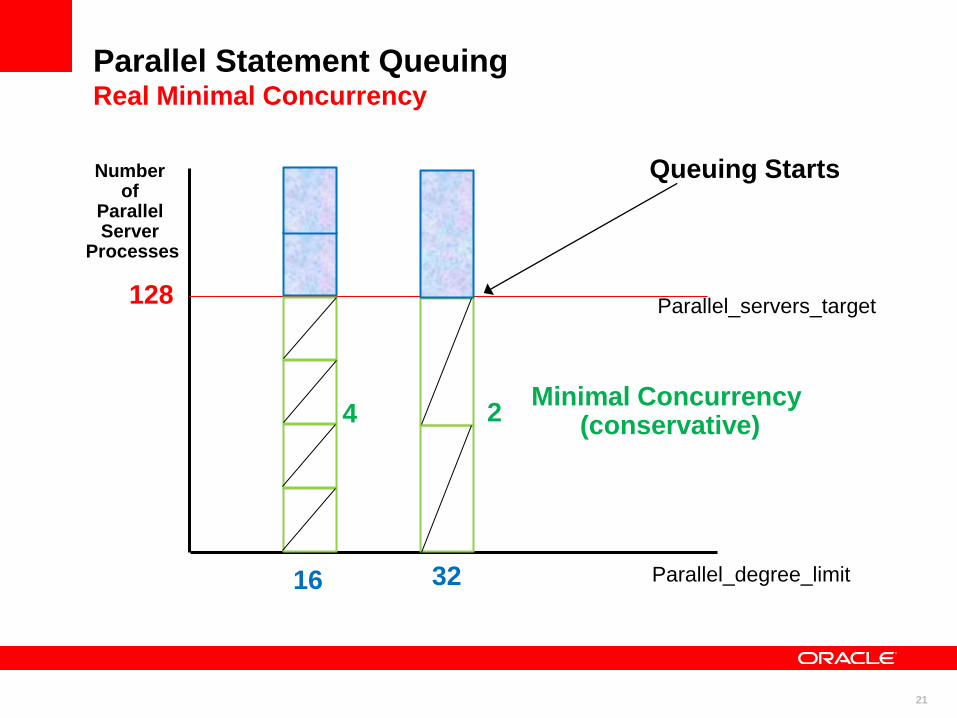
Parallel Statement QueuingReal Minimal Concurrency
Parallel_servers_target
Number of
Parallel Server
Processes
128
16 Parallel_degree_limit32
Queuing Starts
Minimal Concurrency (conservative)4 2

22
Crucial for “all” 11g R2 PX features
Parameter Default Value Description
PARALLEL_DEGREE_LIMIT “CPU” Max DOP that can be
granted with Auto DOP
PARALLEL_DEGREE_POLICY “MANUAL” Specifies if Auto DOP,
Queuing, & In-memory PE
are enabled
PARALLEL_MIN_TIME_THRESHOLD “AUTO” Specifies min execution
time a statement should
have before AUTO DOP
will kick in
PARALLEL_SERVERS_TARGET 4*CPU_COUNT*
PARALLEL_THREAD
S_PER_CPU *
ACTIVE_INSTANCES
Specifies # of parallel
processes allowed to run
parallel stmts before
queuing will be use

23
Enabling the 11g Features
INIT.ORA parameter PARALLEL_DEGREE_POLICY
Three possible modes:• Manual
– As before, DBA must manually specify all aspects of parallelism
– No new features enabled
• Limited
– Restricted AUTO DOP for queries with tables decorated with default PARALLEL
– No Statement Queuing, No In-Memory Parallel Execution
• Auto
– All qualifying statements subject to executing in parallel
– DOP set on tables are ignored
– Statements can be queued
– In-memory PQ available

24
Parameter Hierarchy
1. Parallel_degree_policy = Manual
a) None of the parameters have any impact
2. Parallel_degree_policy = Limited
a) Parallel_min_time_threshold = 10s
b) Parallel_degree_limit = CPU
3. Parallel_degree_policy = Auto
a) Parallel_min_time_threshold = 10s
b) Parallel_degree_limit = CPU
c) Parallel_servers_target = Set to Default DOP on Exadata
PX Features:
• Auto DOP
• Queuing
• In-Memory
PX Features:
• Auto DOP
PX Features:
• NONE
25
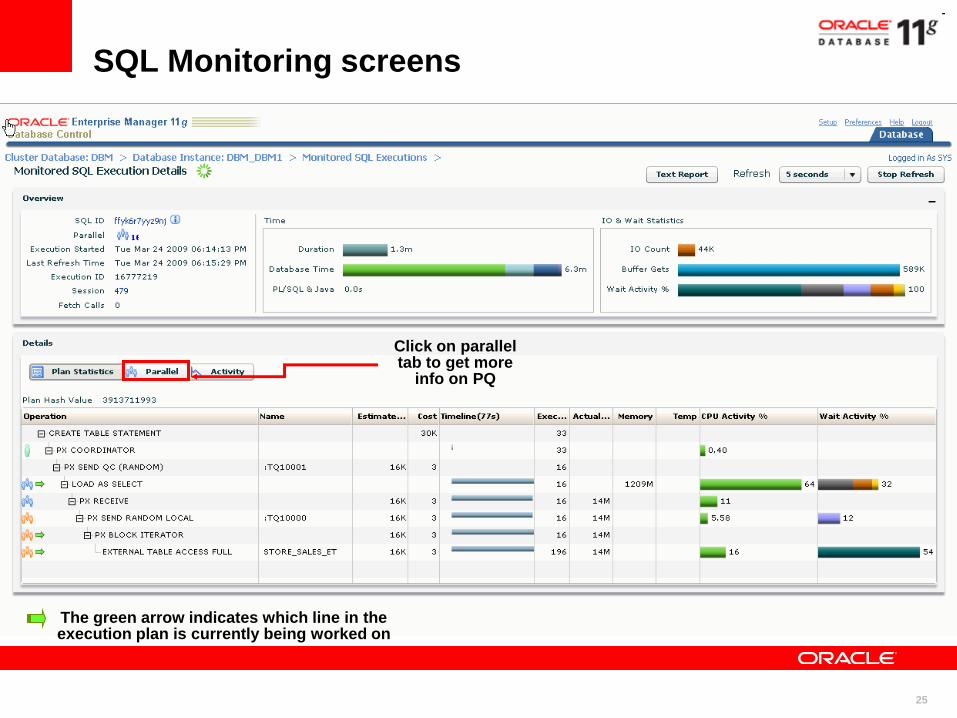
SQL Monitoring screens
The green arrow indicates which line in the execution plan is currently being worked on
Click on parallel tab to get more
info on PQ
26
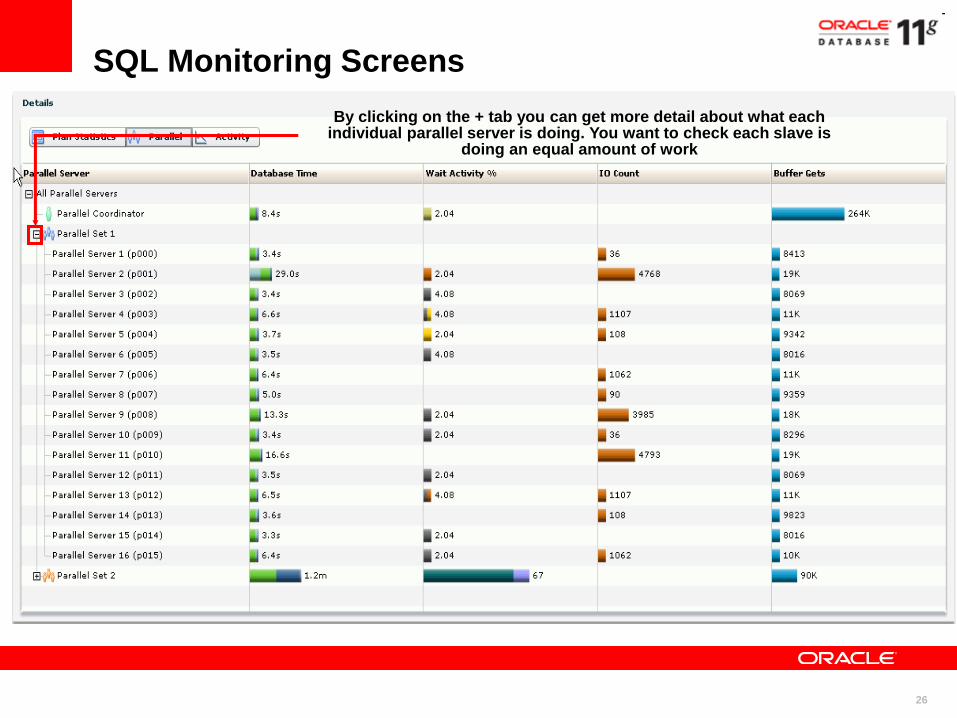
SQL Monitoring Screens
By clicking on the + tab you can get more detail about what each individual parallel server is doing. You want to check each slave is
doing an equal amount of work
27
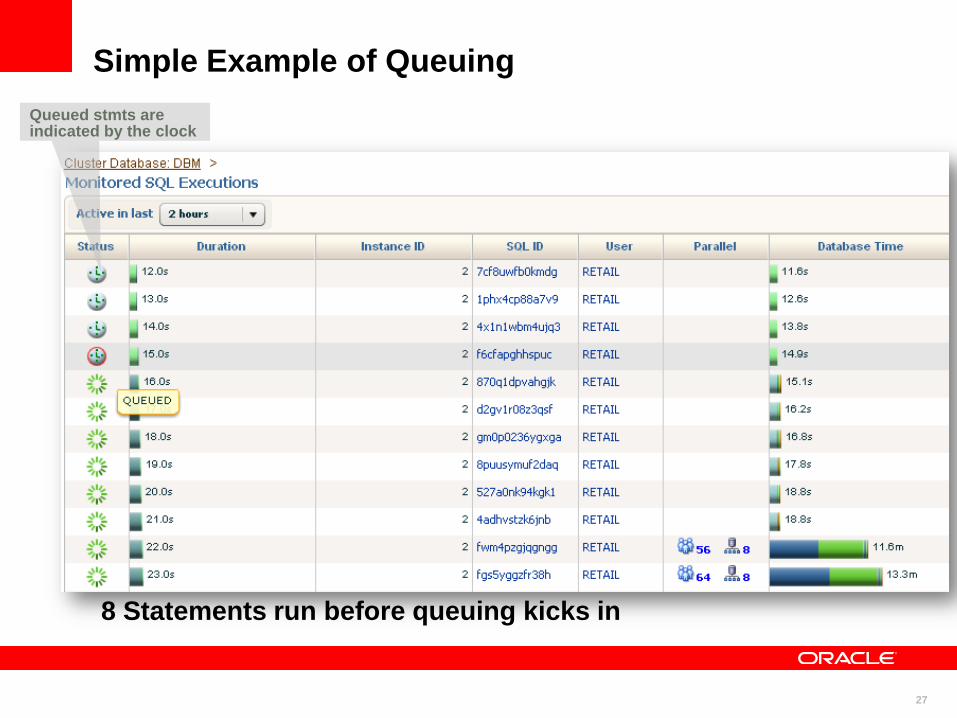
Simple Example of Queuing
8 Statements run before queuing kicks in
Queued stmts are indicated by the clock
28
Preventing Extreme DOPsSetting a system wide parameter
By setting parallel_degree_limit you CAP the
maximum degree ANY statement can run with on the
system
Default setting is Default DOP which means no
statement ever runs at a higher DOP than Default
DOP
Think of this as your safety net for when the magic
fails and Auto DOP is reaching extreme levels of DOP
Note: EM will not show a downgrade for capped DOPs!

30
In-Memory Parallel ExecutionEfficient use of memory on clustered servers
© 2010 Oracle Corporation
• Compress more data into available memory on cluster
• Intelligent algorithm
– Places table fragments in memory on different nodes
• Reduces disk IO and speeds query execution
In-Memory Parallel Query in Database Tier
31
<Insert Picture Here>
Agenda
Parallel Execution
• Workload Management on a Data Warehouse
• Oracle Exadata Database machine

32
MIXED WORKLOAD: what does it mean?
Diverse workload running on a Data Warehouse
system concurrently.
Examples:
Continuous data loads while end users are querying data
OLTP like activities (both queries and trickle data loads)
mixed in with more classic ad-hoc data intensive query
patterns.
34
Step 1: Understand the Workload
Review the customer workload to find out:
Who is doing the work?
What types of work are done on the system?
When are certain types being done?
Where are performance problem areas?
What are the priorities, and do they change during a time
window?
Are there priority conflicts?
35
Step 2: Map the Workload to the System
Create the resource groups:
Map to users
Map to estimated execution time
Etc
Create the required Resource Plans:
For example: Nighttime vs. daytime, online vs. offline
Set the overall priorities
Which resource group gets most resources
Cap max utilizations
Drill down into parallelism, queuing and session
throttles

36
Why use Resource Manager?
Manage workloads contending for CPU
Prevent excessive CPU load, destabilizing server
Manage parallel query processes, queuing and
concurrency
Prevent runaway queries
Manage workloads contending for I/O

37
Resource Manager User Interface
New!
38
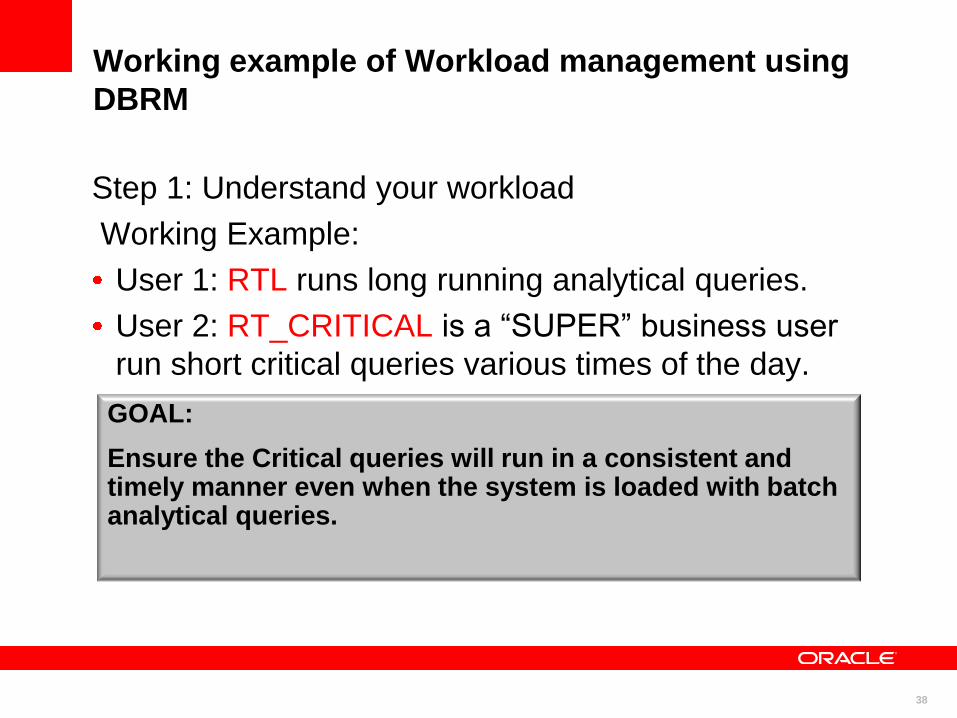
Working example of Workload management using
DBRM
Step 1: Understand your workload
Working Example:
User 1: RTL runs long running analytical queries.
User 2: RT_CRITICAL is a “SUPER” business user
run short critical queries various times of the day.
GOAL:
Ensure the Critical queries will run in a consistent and timely manner even when the system is loaded with batch analytical queries.

39
DBRM – RESOURCE GROUP
CRITICAL SHORT QUERIES STEP 1
TWO CONSUMER GROUPS :
•RT_CRITICAL
•RT_ANALYSIS
40
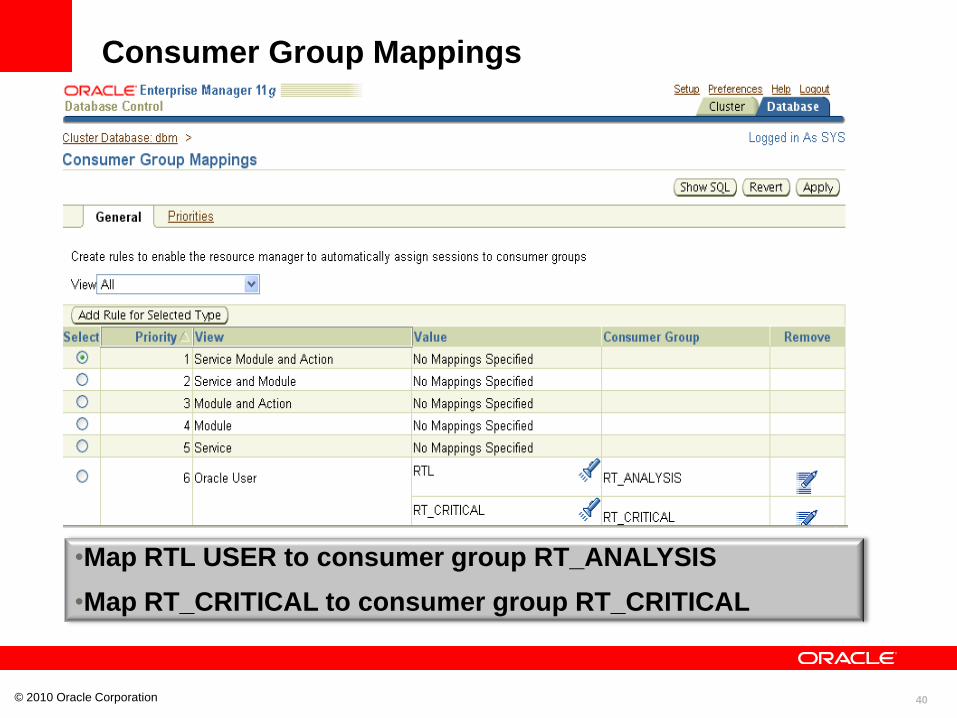
Consumer Group Mappings
© 2010 Oracle Corporation
•Map RTL USER to consumer group RT_ANALYSIS
•Map RT_CRITICAL to consumer group RT_CRITICAL
41
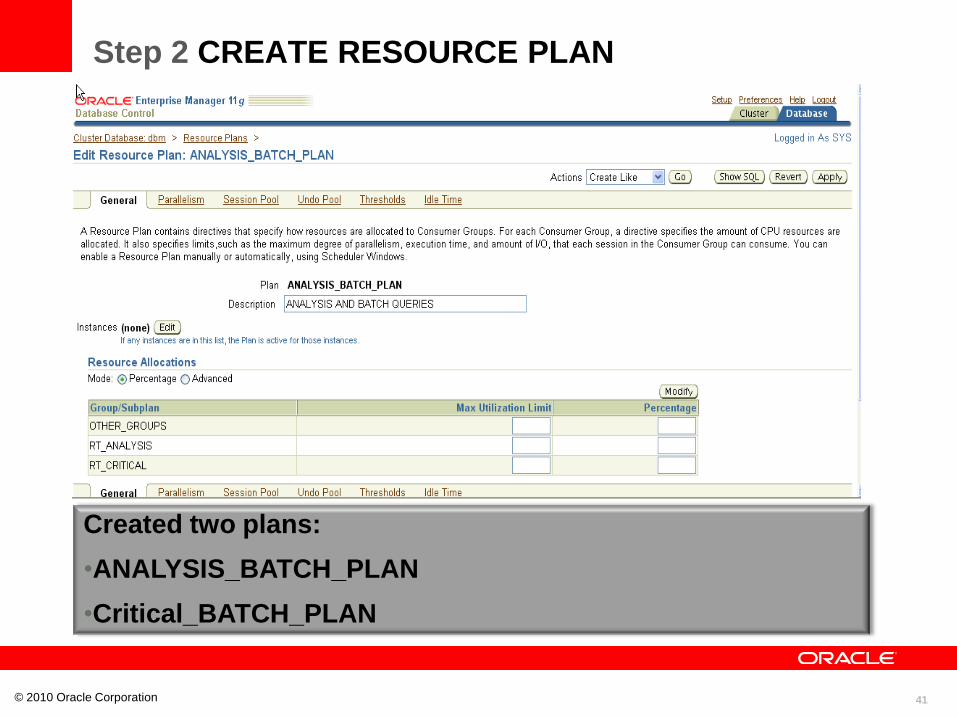
Step 2 CREATE RESOURCE PLAN
© 2010 Oracle Corporation
Created two plans:
•ANALYSIS_BATCH_PLAN
•Critical_BATCH_PLAN
42© 2010 Oracle Corporation
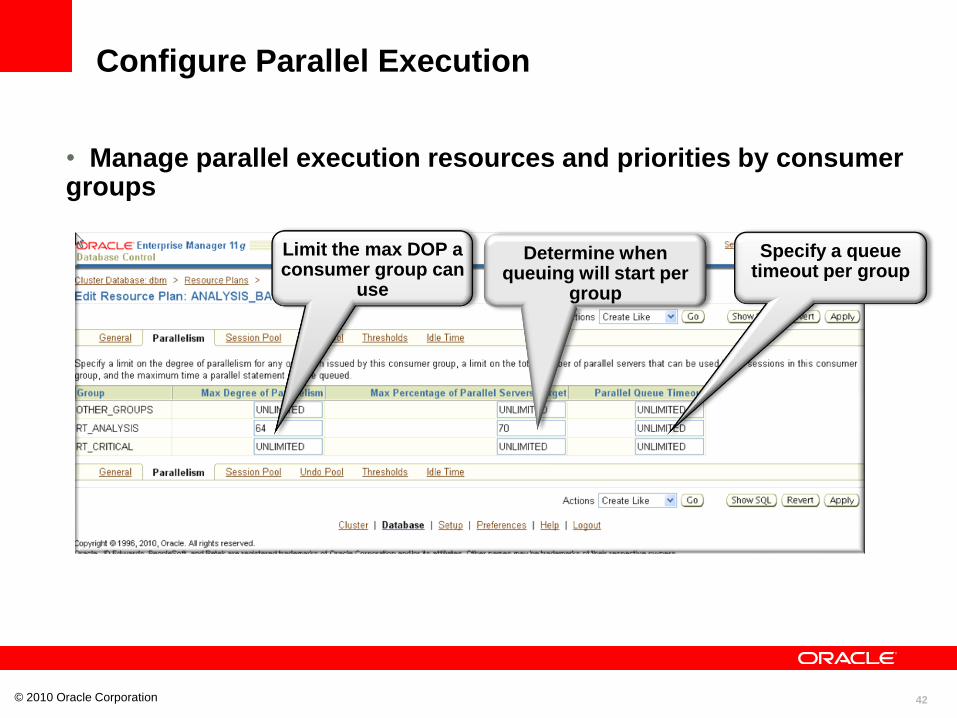
Limit the max DOP a consumer group can
use
Determine when queuing will start per
group
Specify a queue timeout per group
Configure Parallel Execution
• Manage parallel execution resources and priorities by consumer groups

43
Allocate resources DAYTIME_CRITICAL_QUERIES_PLAN
Statements issued by RTL_ANALYSIS:
DOP is capped at 16
Statements will queue once the number of Max parallel processes 204= 20/100* 1024( 1024).
44
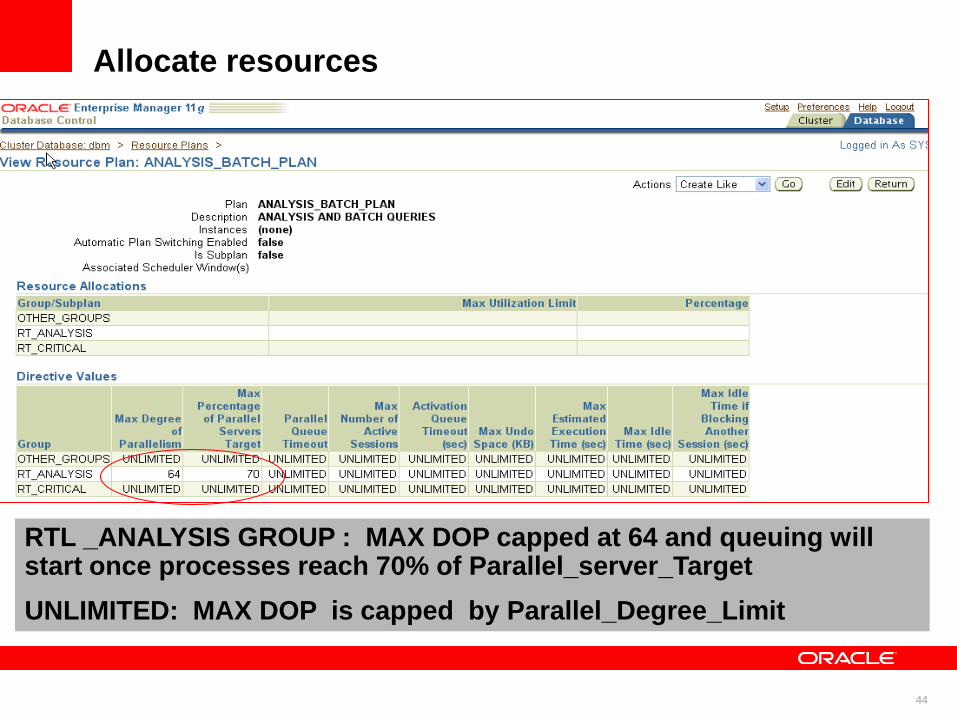
Allocate resources
RTL _ANALYSIS GROUP : MAX DOP capped at 64 and queuing will start once processes reach 70% of Parallel_server_Target
UNLIMITED: MAX DOP is capped by Parallel_Degree_Limit
45
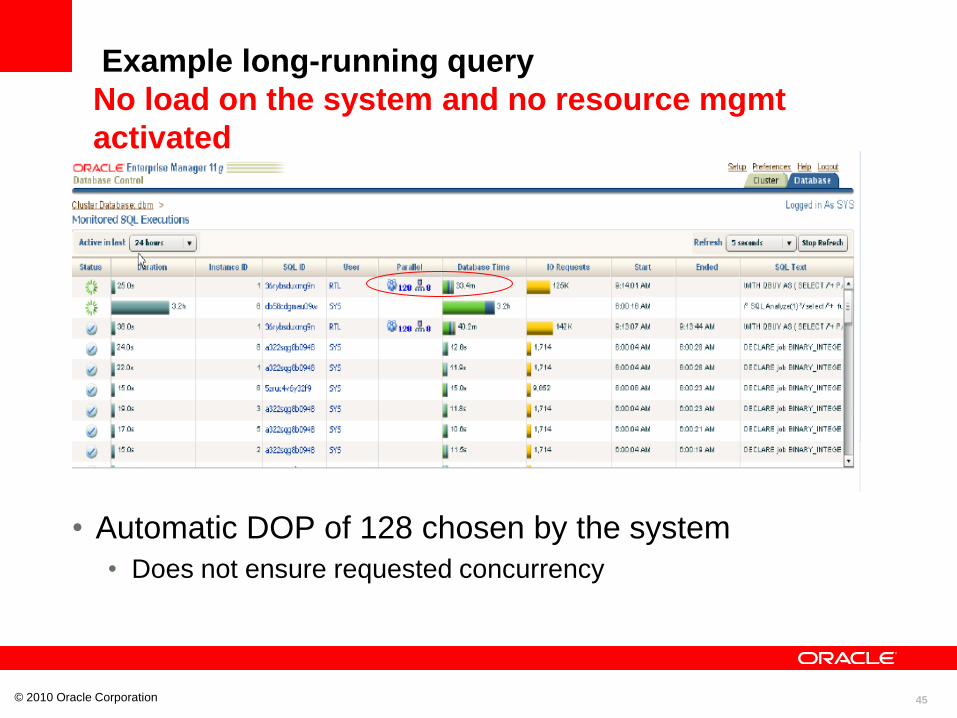
Example long-running query
No load on the system and no resource mgmt
activated
© 2010 Oracle Corporation
• Automatic DOP of 128 chosen by the system
• Does not ensure requested concurrency
46
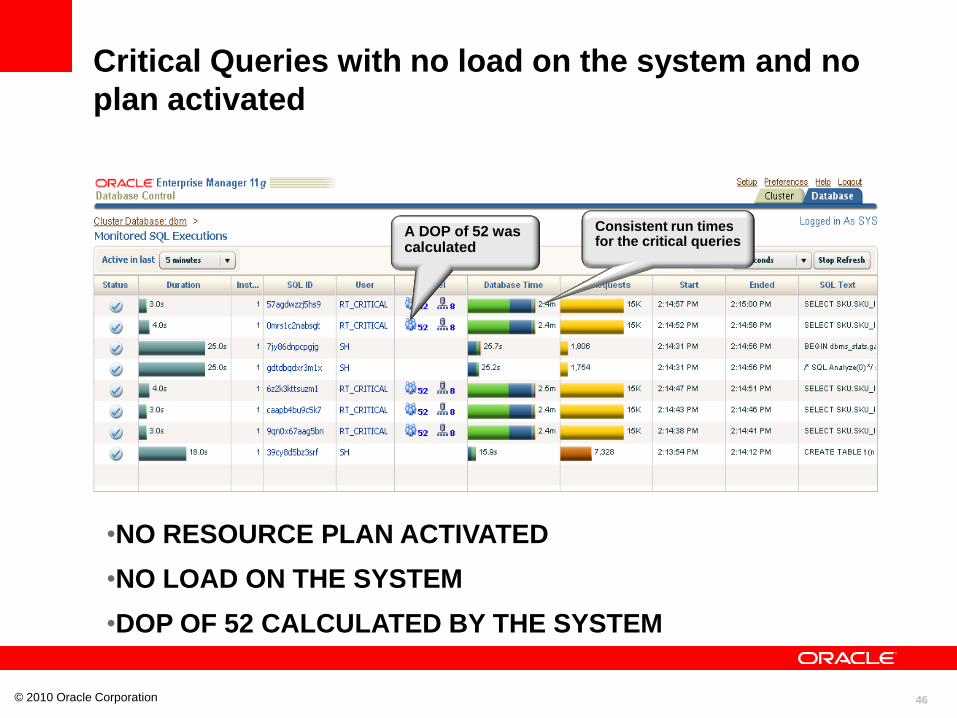
Critical Queries with no load on the system and no
plan activated
© 2010 Oracle Corporation
A DOP of 52 was calculated
Consistent run times for the critical queries
•NO RESOURCE PLAN ACTIVATED
•NO LOAD ON THE SYSTEM
•DOP OF 52 CALCULATED BY THE SYSTEM
47
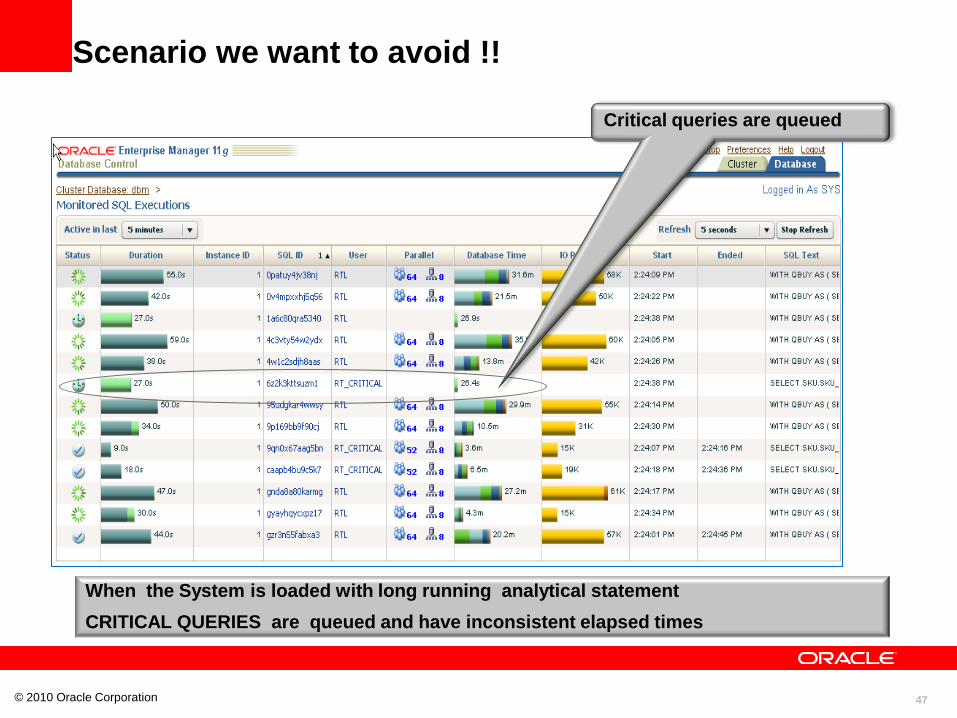
Scenario we want to avoid !!
© 2010 Oracle Corporation
Critical queries are queued
When the System is loaded with long running analytical statement
CRITICAL QUERIES are queued and have inconsistent elapsed times
48
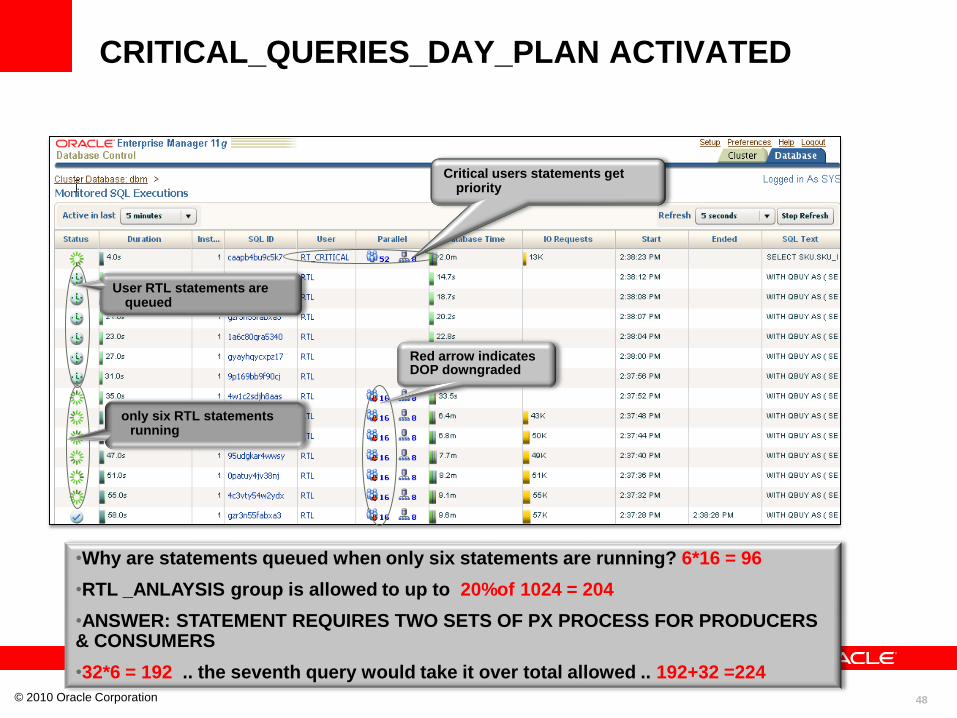
CRITICAL_QUERIES_DAY_PLAN ACTIVATED
© 2010 Oracle Corporation
Critical users statements get priority
User RTL statements are queued
only six RTL statements running
Red arrow indicates DOP downgraded
•Why are statements queued when only six statements are running? 6*16 = 96
•RTL _ANLAYSIS group is allowed to up to 20%of 1024 = 204
•ANSWER: STATEMENT REQUIRES TWO SETS OF PX PROCESS FOR PRODUCERS & CONSUMERS
•32*6 = 192 .. the seventh query would take it over total allowed .. 192+32 =224

49
Analysis Batch Plan
RT_Analaysis group : Max Percentage of parallel
servers target =70% = 70*1024/100 =719
© 2010 Oracle Corporation
64* 2 =128 ( in most cases double for producers and consumers). 128 *5 (statements) result in 640 parallel processes
Statements queue are max % of parallel servers target reached
50
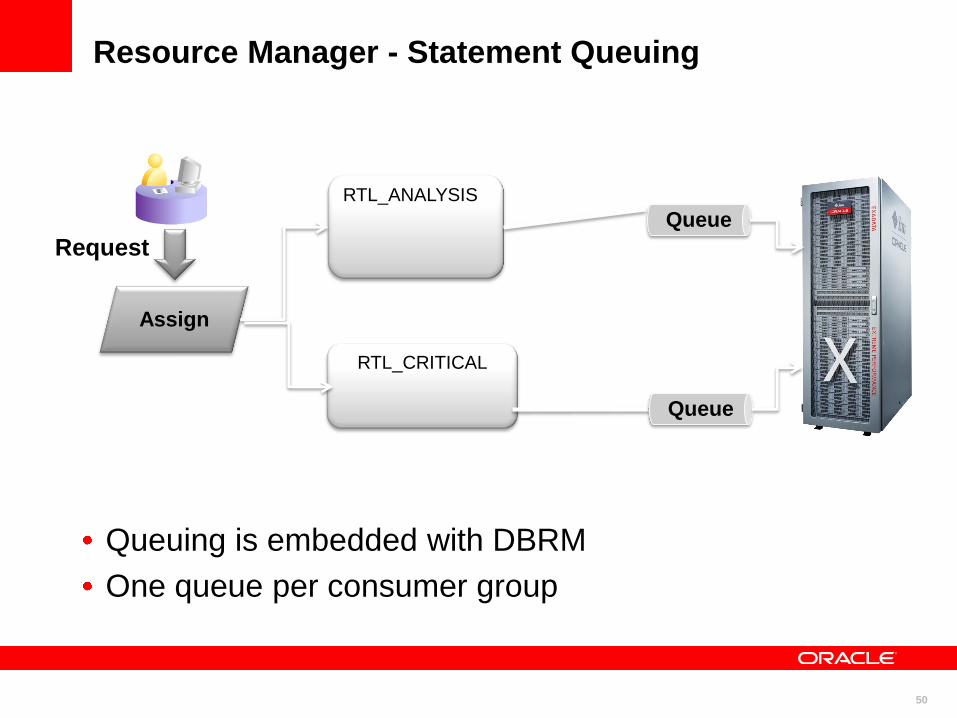
Resource Manager - Statement Queuing
Request
Assign
RTL_ANALYSIS
RTL_CRITICAL
Queue
Queue
Queuing is embedded with DBRM
One queue per consumer group
51
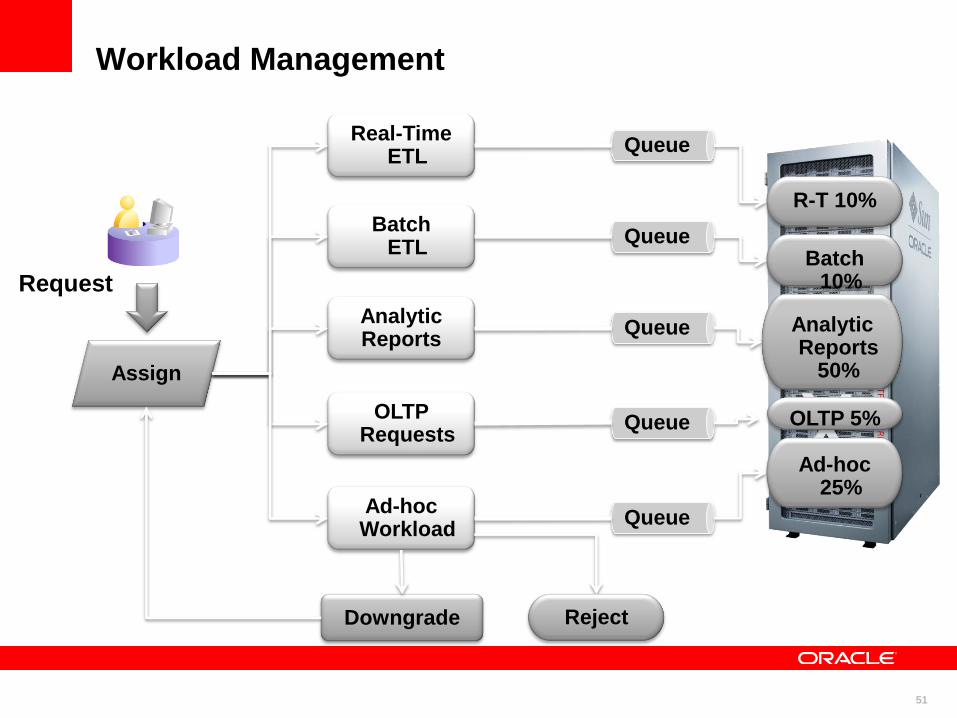
Request
Real-TimeETL
Batch ETL
AnalyticReports
OLTP Requests
Ad-hocWorkload
Assign
RejectDowngrade
Queue
Ad-hoc 25%
Analytic Reports
50%
OLTP 5%
Batch 10%
R-T 10%
Queue
Queue
Queue
Queue
Workload Management
52
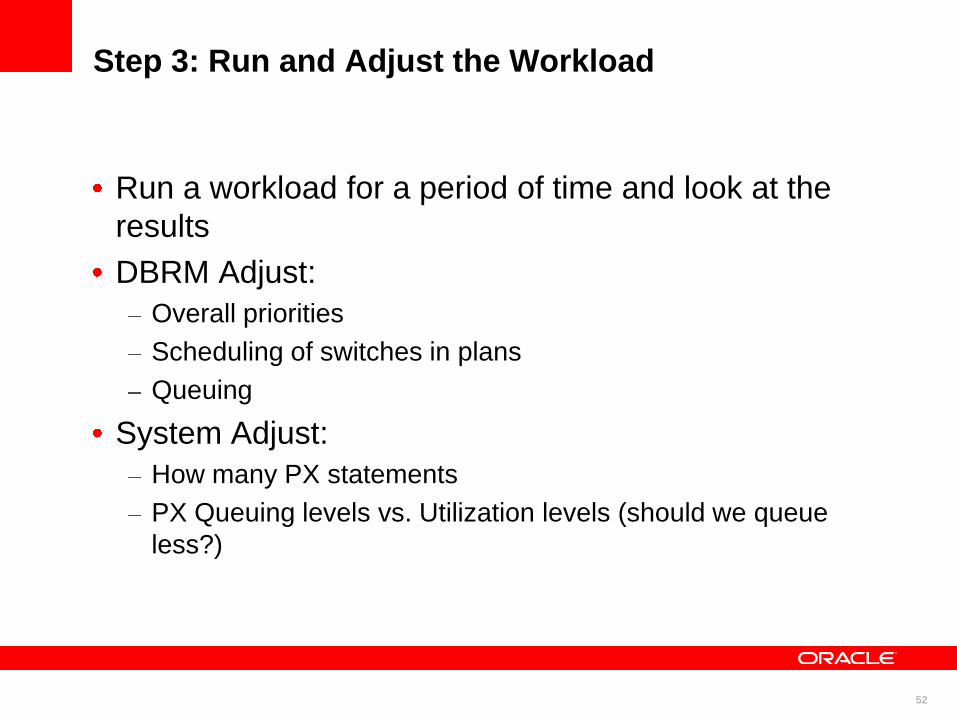
Step 3: Run and Adjust the Workload
Run a workload for a period of time and look at the
results
DBRM Adjust:
Overall priorities
Scheduling of switches in plans
Queuing
System Adjust:
How many PX statements
PX Queuing levels vs. Utilization levels (should we queue
less?)
53
<Insert Picture Here>
Agenda
Parallel Execution
• Workload Management on a Data Warehouse
• Oracle Exadata Database machine
54
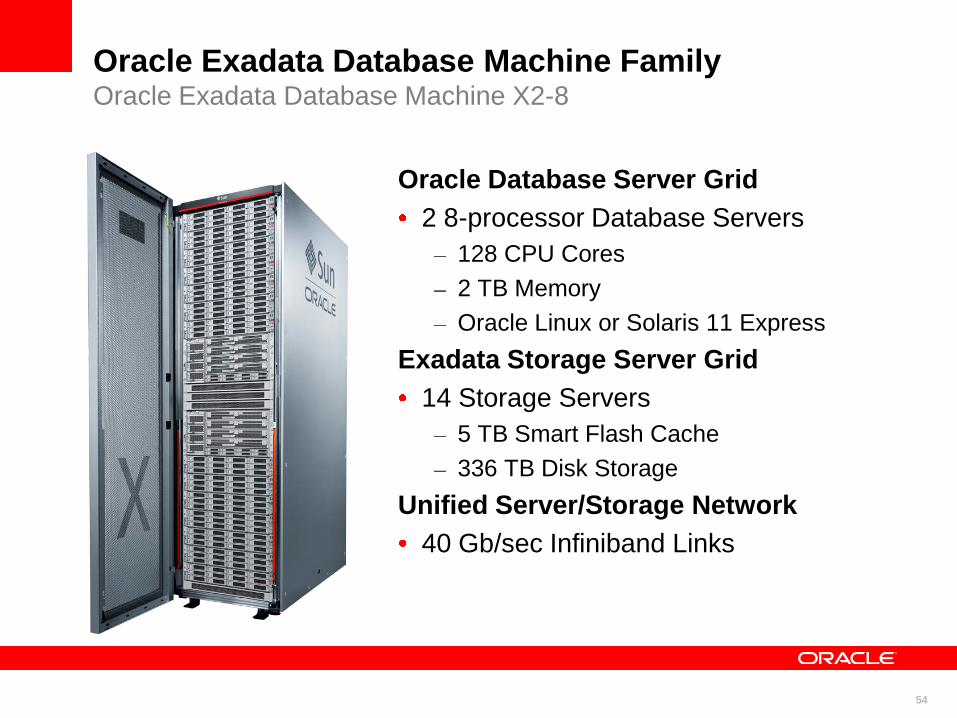
Oracle Exadata Database Machine FamilyOracle Exadata Database Machine X2-8
Oracle Database Server Grid
2 8-processor Database Servers
128 CPU Cores
2 TB Memory
Oracle Linux or Solaris 11 Express
Exadata Storage Server Grid
14 Storage Servers
5 TB Smart Flash Cache
336 TB Disk Storage
Unified Server/Storage Network
40 Gb/sec Infiniband Links

55
Select sum(sales)where salesdate=„22-Jan-2010‟…
Sum
Return entire Sales table
What Were Yesterday‟s
Sales?
• Data is pushed to database server for processing
• I/O rates are limited by speed and number of disk drives
• Network bandwidth is strained, limiting performance and concurrency
Discard most of
sales table
Traditional Query Problem
56
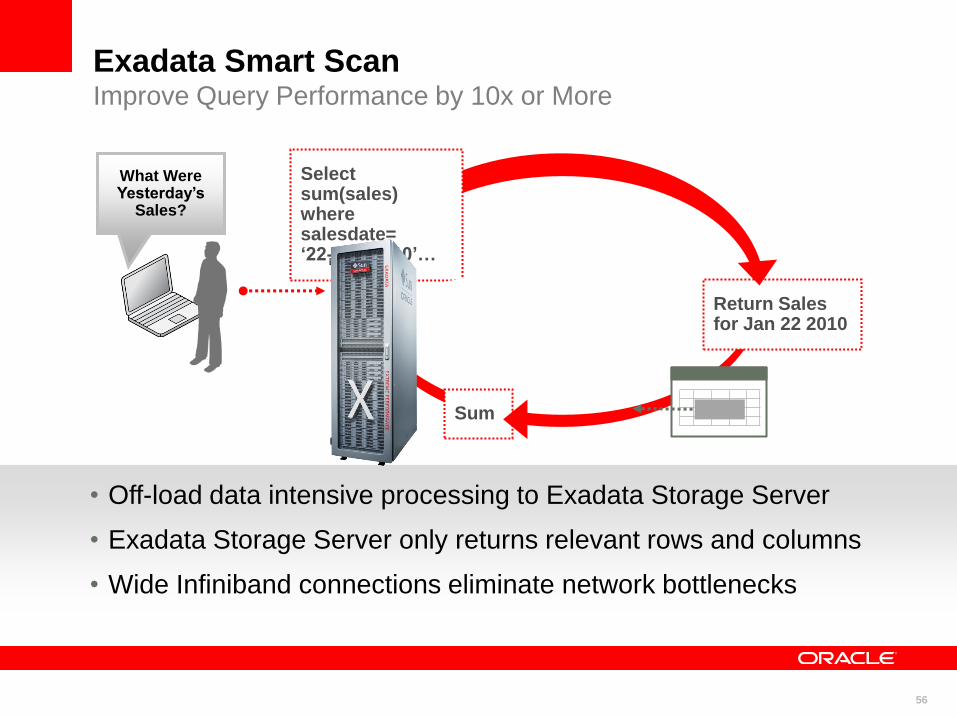
Select sum(sales)where salesdate=„22-Jan-2010‟…
Sum
Return Sales for Jan 22 2010
What Were Yesterday‟s
Sales?
• Off-load data intensive processing to Exadata Storage Server
• Exadata Storage Server only returns relevant rows and columns
• Wide Infiniband connections eliminate network bottlenecks
Exadata Smart ScanImprove Query Performance by 10x or More
57
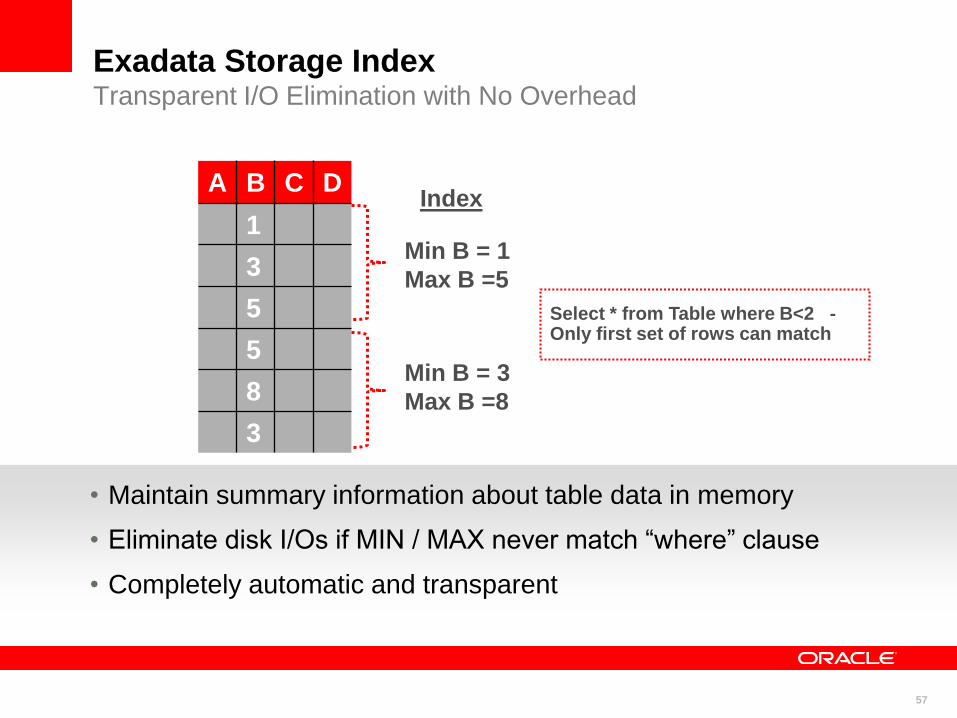
• Maintain summary information about table data in memory
• Eliminate disk I/Os if MIN / MAX never match “where” clause
• Completely automatic and transparent
A B C D
1
3
5
5
8
3
Min B = 1
Max B =5
Index
Min B = 3
Max B =8
Select * from Table where B<2 -Only first set of rows can match
Exadata Storage IndexTransparent I/O Elimination with No Overhead

58
0
10
20
30
40
50
60
70
80
90
100D
ata
–Te
rab
yte
s
3x
10x 15x
1.4x
2.5 x
UncompressedData
Data Warehouse Appliances
OLTP Data
DW Data
Archive Data
Oracle
Exadata Hybrid Columnar CompressionReduce Disk Space Requirements

59
Built-in Analytics Secure, Scalable Platform for Advanced Analytics
• Complex and predictive analytics embedded into Oracle Database 11g
• Reduce cost of additional hardware, management resources
• Improve performance by eliminating data movement and duplication
Oracle Data MiningUncover and predict
Oracle OLAPAnalyze and summarize

60
• Automatically caches frequently-accessed „hot‟ data in flash storage
• Assigns the rest to less expensive disk drives
• Know when to avoid trying to cache data that will never be reused
• Process data at 50GB/sec and up to 1million I/Os per second
Infrequently Used Data
Frequently Used Data
Exadata Smart Flash CacheExtreme Performance for OLTP Applications
61
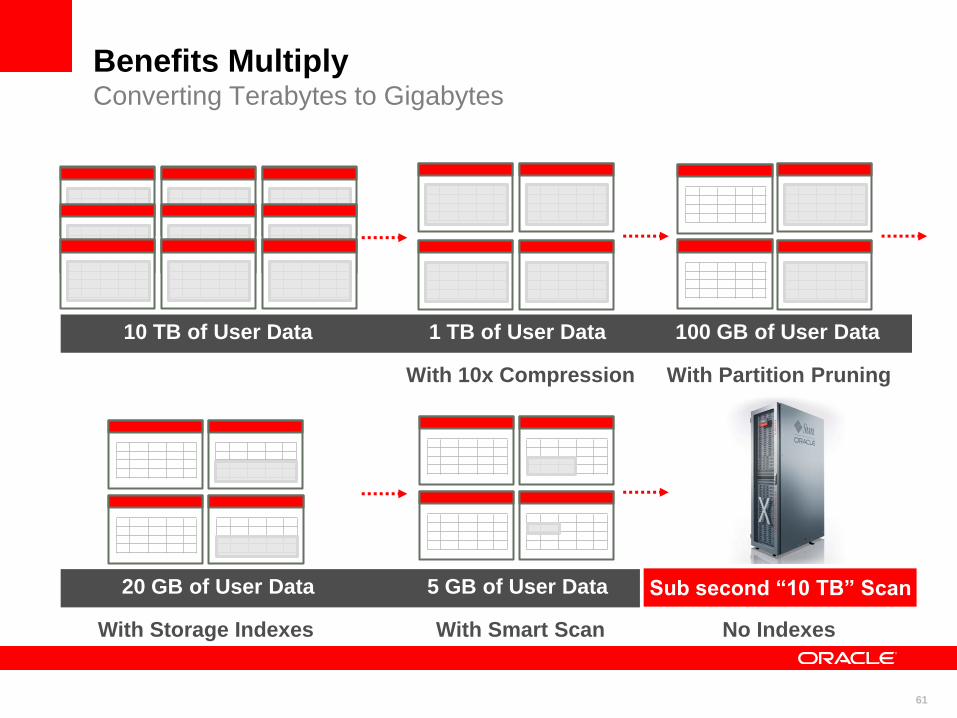
10 TB of User Data
20 GB of User Data 5 GB of User Data
No IndexesWith Storage Indexes
100 GB of User Data
10 TB of User Data
10 TB of User Data 1 TB of User Data
With Partition PruningWith 10x Compression
With Smart Scan
Sub second “10 TB” Scan
Benefits MultiplyConverting Terabytes to Gigabytes
62
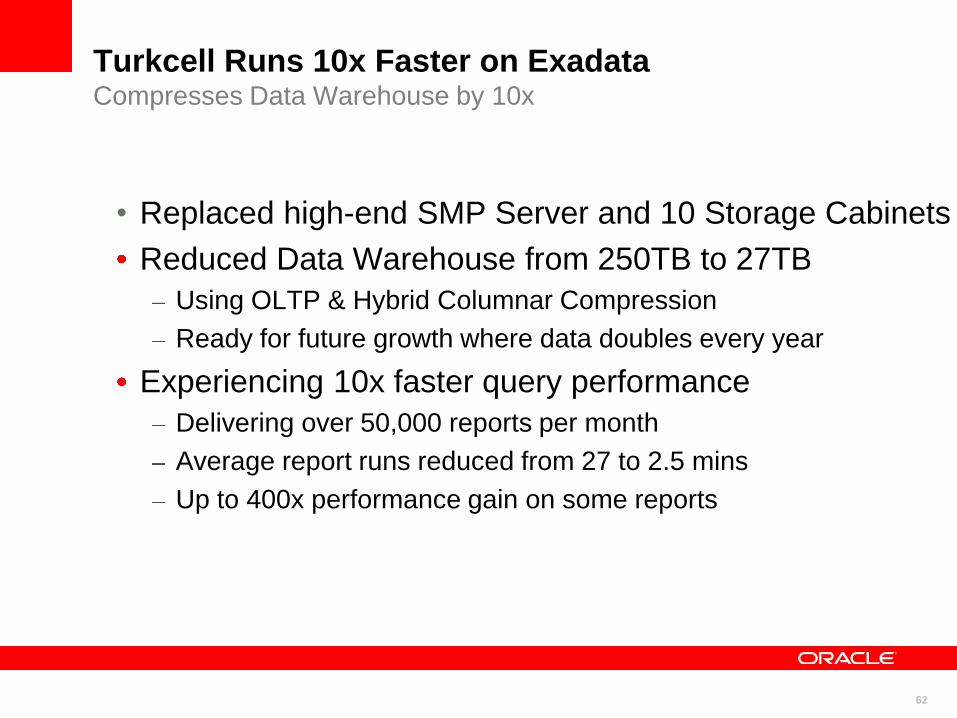
Turkcell Runs 10x Faster on ExadataCompresses Data Warehouse by 10x
• Replaced high-end SMP Server and 10 Storage Cabinets
Reduced Data Warehouse from 250TB to 27TB
Using OLTP & Hybrid Columnar Compression
Ready for future growth where data doubles every year
Experiencing 10x faster query performance
Delivering over 50,000 reports per month
Average report runs reduced from 27 to 2.5 mins
Up to 400x performance gain on some reports
<Insert Picture Here>
Summary
• Implement the three Ps of Data Warehousing• Power – balanced hardware configuration
• Make sure the system can deliver your SLA
• Partitioning – Performance, Manageability, ILM
• Make sure partition pruning and partition-wise joins occur
• Parallel – Maximize the number of processes working
• Make sure the system is not flooded using DOP limits & queuing
• Workload Management on a Data Warehouse• Use Database Resource Manager
• Control maximum DOP each user can have
• Control when statements should begin queue
• Control what happens to “run away” queries
Learn More Parallel Execution
• Oracle University Class
• Choose between live virtual class or instructor-led
• http://education.oracle.com/pls/web_prod-plq-
dad/db_pages.getCourseDesc?dc=D71882GC10
Read our blogs:
http://blogs.oracle.com/optimizer
http://blogs.oracle.com/datawarehousing
Best practices papers can be found here:
http://www.oracle.com/technetwork/database/focu
s-areas/bi-datawarehousing/index.html

Q & A