Embed Size (px)
Citation preview

1
ASCE Seminar, San Antonio, Jan., 2009
Dan Brown, P.E., Ph.D.
Design of Drilled ShaftsDesign of Drilled Shafts
for Extreme Eventsfor Extreme Events
By: Dan Brown, P.E., Ph.D.Dept. of Civil Engineering, Auburn UniversityDan Brown and Associates, PLLC
Overview of Extreme EventsOverview of Extreme Events
Overall Design ApproachScourVessel CollisionSeismic Loadings

2
ASCE Seminar, San Antonio, Jan., 2009
Dan Brown, P.E., Ph.D.
LRFD Design ApproachLRFD Design Approach
∑∑ ≥ iiii QR γφ
LnLDnDbnbsns QQRR γγφφ +≥+
where: φi = resistance factor for resistance component iRi = nominal value of resistance component iγi = load factor for load component iQi = nominal value of load component i
General Form of Equation:
For axial resistance to DL + LL:
FSRQ n
all =
> Fn
ASD approach:
Load and ResistanceLoad and Resistance
Load and Resistance Factors for Extreme Events:Lower probability that the load will occurResistance to transient load may exceed nominalLoad > resistance for transient condition may be tolerated in some cases

3
ASCE Seminar, San Antonio, Jan., 2009
Dan Brown, P.E., Ph.D.
TABLE 10-1 AASHTO (2007) LIMIT STATES FOR BRIDGE DESIGN
Repetitive gravitational vehicular live load and dynamic responses under the effects of a single design truck Fatigue
Tension in prestressed concrete columns with the objective of crack controlIV
Longitudinal analysis relating to tension in prestressed concrete superstructures with the objective of crack control and to principal tension in the webs of segmental concrete girders
III
Intended to control yielding of steel structures and slip of slip-critical connections due to vehicular live load
II
Normal operational use of the bridge with a 55 mph wind and all loads taken at their nominal valuesI
Service
Ice load, collision by vessels and vehicles, and certainhydraulic events with a reduced live load other thanthat which is part of the vehicular collision load, CT
II
Load combination including earthquakeIExtreme
Event
Normal vehicular use of the bridge with wind of 55 mphV
Very high dead load to live load force effect ratiosIV
Bridge exposed to wind velocity exceeding 55 mphIII
Use of the bridge by Owner-specified special vehicles, evaluation permit vehicles, or both, without windII
Normal vehicular use of the bridge without windI
Strength
Load CombinationCaseLimit State Type
MR
VR
QR
MV
Q
Reactions at fixed-end column supports obtained from structural analysis model of superstructure are taken as axial, shear, and moment force effects applied to top of the foundation
Bridge subjected to load combination corresponding to one of the limit states in Table 10-2
Load Factors (AASHTO)Load Factors (AASHTO)TABLE 10-2 LOAD COMBINATIONS AND LOAD FACTORS
(AFTER AASHTO 2007, TABLE 3.4.1-1)
-----------0.75-Fatigue
----1.00-1.00/1.201.00-0.701.00-1.00Service IV
----γSEγTG1.00/1.201.00--1.000.801.00Service III
------1.00/1.201.00--1.001.301.00Service II
----γSEγTG1.00/1.201.001.000.301.001.001.00Service I
1.001.001.00----1.00--1.000.50γpExtreme Event II
---1.00---1.00--1.00γEQγpExtreme Event I
----γSEγTG0.50/1.201.001.000.401.001.35γpStrength V
------0.50/1.201.00--1.00-γpStrength IV
----γSEγTG0.50/1.201.00-1.401.00-γpStrength III
----γSEγTG0.50/1.201.00--1.001.35γpStrength II
----γSEγTG0.50/1.201.00--1.001.75γpStrength I
CVCTICEQ
Use one of these at a time
SETGTCSFRWLWSWALLPLLoad Combination
Limit State
Live load factor for earthquakeγEQLoad factor for permanent loadsγp
uniform temperature, creep, and shrinkageTCS
vessel collision forceCVsettlementSEwind load on structureWS
vehicular collision forceCTtemperature gradientTGwater load and stream pressureWA
ice loadICfrictionFRlive loadLL
earthquakeEQwind on live load WLpermanent loadPL
4
ASCE Seminar, San Antonio, Jan., 2009
Dan Brown, P.E., Ph.D.
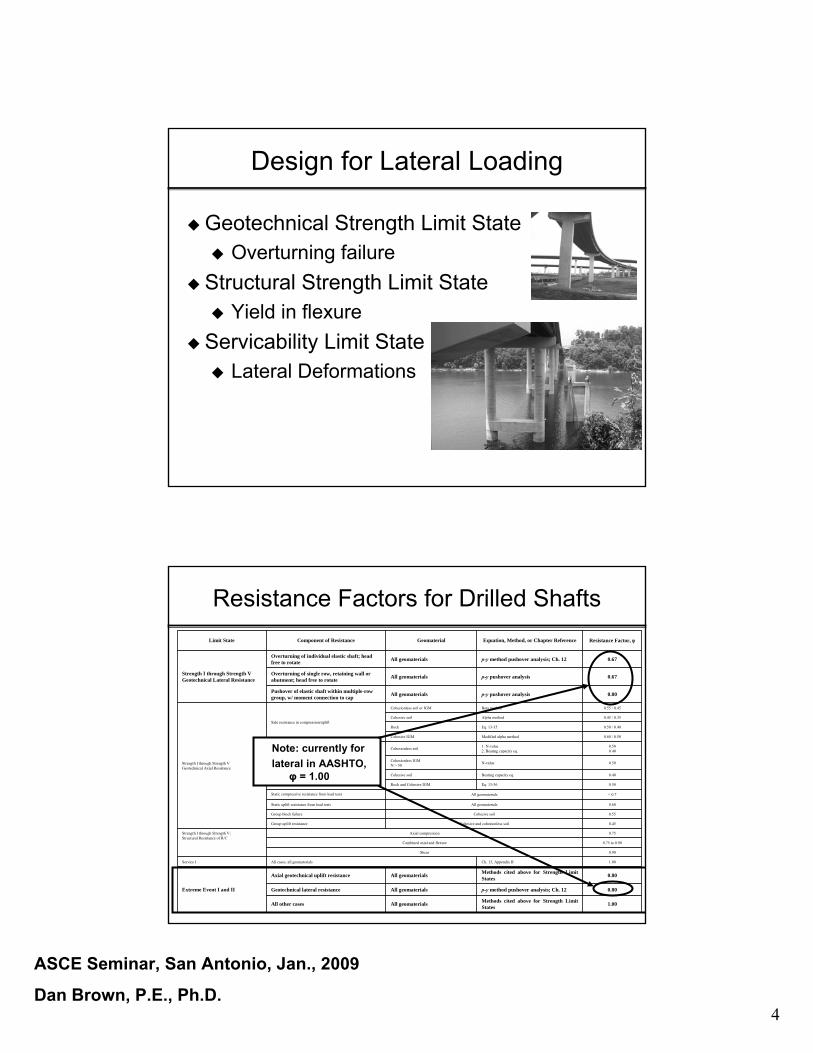
Design for Lateral LoadingDesign for Lateral Loading
Geotechnical Strength Limit StateOverturning failure
Structural Strength Limit StateYield in flexure
Servicability Limit StateLateral Deformations
Resistance Factors for Drilled ShaftsResistance Factors for Drilled Shafts
1.00Methods cited above for Strength Limit StatesAll geomaterialsAll other cases
0.80p-y method pushover analysis; Ch. 12All geomaterialsGeotechnical lateral resistance
0.80Methods cited above for Strength Limit StatesAll geomaterialsAxial geotechnical uplift resistance
Extreme Event I and II
1.00Ch. 13, Appendix BAll cases, all geomaterialsService I
0.90Shear
0.75 to 0.90Combined axial and flexure
0.75Axial compressionStrength I through Strength V;Structural Resistance of R/C
0.45Cohesive and cohesionless soilGroup uplift resistance
0.55Cohesive soilGroup block failure
0.60All geomaterialsStatic uplift resistance from load tests
< 0.7All geomaterialsStatic compressive resistance from load tests
0.50Eq. 13-36Rock and Cohesive IGM
0.40Bearing capacity eq.Cohesive soil
0.50N-valueCohesionless IGMN > 50
0.500.40
1. N-value2. Bearing capacity eq.Cohesionless soil
Base resistance in compression
0.60 / 0.50Modified alpha methodCohesive IGM
0.50 / 0.40Eq. 13-35Rock
0.45 / 0.35Alpha methodCohesive soil
0.55 / 0.45Beta method Cohesionless soil or IGM
Side resistance in compression/uplift
Strength I through Strength VGeotechnical Axial Resistance
0.80p-y pushover analysisAll geomaterialsPushover of elastic shaft within multiple-row group, w/ moment connection to cap
0.67p-y pushover analysisAll geomaterialsOverturning of single row, retaining wall or abutment; head free to rotate
0.67p-y method pushover analysis; Ch. 12All geomaterialsOverturning of individual elastic shaft; head free to rotate
Strength I through Strength VGeotechnical Lateral Resistance
Resistance Factor, ϕEquation, Method, or Chapter ReferenceGeomaterialComponent of ResistanceLimit State
Note: currently forlateral in AASHTO,
φ = 1.00

5
ASCE Seminar, San Antonio, Jan., 2009
Dan Brown, P.E., Ph.D.
ScourScour
Long-term aggradation and degradation of the river bedGeneral scour at the bridge
Contraction scourOther general scour
Local scour at piers or abutments
Degradation + general scour
Local (pier) scour
Local (abutment)scour
Bridge Deck
Original streambed
Drilled Shafts
Scour Design PhilosophyScour Design Philosophy
Design Flood: 100 year recurrence intervalStrength limit conditions apply
Check Flood: 500 year recurrence intervalNominal resistance (φ = 1) should exceed unfactored loads (incl debris) for strength limit stateFor uplift, φ = 0.8

6
ASCE Seminar, San Antonio, Jan., 2009
Dan Brown, P.E., Ph.D.
Effect of Scour on Axial ResistanceEffect of Scour on Axial Resistance
Pre-scour streambed elevation
ys
W = 2 ys
1.5ys
Below this depth, compute stresses based on streambed elevation B
CVary stress from zero at C to stress controlled by streambed elevation B at depth = 1.5 ys
B
Scour Prism
Degradation + general scour
Drilled shaft embedment depth after scour
A
Total scour line
For Granular Soils:Vertical stress is reduced butOCR is increased, thereforehorizontal stress at shaft/soilinterface is reduced as much
For Cohesive Soils:Estimate the effect ofΔσ΄v on Su, then: fS = αSu
For Rock:Effect of Δσ΄v on resistanceis considered insignificant
Effect of Scour on Side ResistanceEffect of Scour on Side Resistance
scourpostv
scourprevOCR−
−=,
,
σσ
( ) φφ sinOCRsin1K −=
( )δσ tanKf vS ′=
For Granular Soils:
βTherefore: σ΄v post-scour = (σ΄v pre-scour)/OCR(K post-scour / K pre-scour) = OCRsinφ
(fs post-scour / fs pre-scour) = OCRsinφ/OCR = OCR(sinφ-1)
0
0.2
0.4
0.6
0.8
1
0 0.2 0.4 0.6 0.8 1
vert stress after scour / before scour
side
resi
stan
ce a
fter s
cour
/ be
fore
sco
ur
phi=40phi=38phi=36phi=341:1

7
ASCE Seminar, San Antonio, Jan., 2009
Dan Brown, P.E., Ph.D.
Vessel CollisionVessel Collision
Vessel Collision ForcesVessel Collision Forces
Consider as equivalent static loadMax load at piers adjacent to channel, lesser magnitude load away from channelFull barge tow under power with ½ scour (FDOT)Drifting barge with full design (100yr) scour (FDOT)
vesselPS
Mean Water Level

8
ASCE Seminar, San Antonio, Jan., 2009
Dan Brown, P.E., Ph.D.
Design Approach for Vessel Collisions Design Approach for Vessel Collisions
Some damage may be permitted: depends on structureDesign for strength; large lateral deflections may be tolerablePushover analysis of groups
Group effects on p-y curvesPile to cap connection is importantNominal axial resistance of some piles or shafts may be fully mobilized
Design for Vessel Collisions Design for Vessel Collisions
Use longer spans fewer (or zero) exposed foundations
Large diameter shafts advantages due to flexural strength
Consider protective barrier deep water and/or large vessels
Consider alternative layouts

9
ASCE Seminar, San Antonio, Jan., 2009
Dan Brown, P.E., Ph.D.
Bond Memorial Bridge, Kansas CityBond Memorial Bridge, Kansas City
SeismicSeismic
Inertial force effects from structureLiquefactionLateral spreading

10
ASCE Seminar, San Antonio, Jan., 2009
Dan Brown, P.E., Ph.D.
Seismic DesignSeismic Design
Expected Earthquake (EE)50% probability of exceedance in 75yrsImmediate service, minimal to no damage
Maximum Considered Earthquake (MCE)3% probability of exceedance in 75yrsService disrupted, significant damage (Life Safety)Immediate service, minimal damage (Operational)
Foundation Force EffectsFoundation Force Effects
Establish the design response spectrum for the bridge site
Calculate the equivalent horizontal static load, Pe(x), acting on the superstructure
Elastic structural analysis of bridge model under Extreme Event Load Combination I to determine foundation force effects
Limit state evaluation of drilled shafts under EQ force effects
4.
1.
3.
2.
Design Response SpectrumEnvelope of all the possibilities
(so far as we know)Ss, S1, PGA from seismic hazard maps
Fa, Fv = site coefficients
Pe(x) = Csm W

11
ASCE Seminar, San Antonio, Jan., 2009
Dan Brown, P.E., Ph.D.
Site Effects on Design Response SpectrumSite Effects on Design Response Spectrum
Table 15-1 Seismic Site Classification Based on Subsurface Profile
> 10 ft of peat or highly organic clays (OH)> 25 ft of high plasticity clay (PI > 75)> 120 ft of soft-mdm stiff clay
Soil profiles requiring site-specific evaluationF
> 10 ft of soft clay(1)< 1.0< 15< 600Soil profileE
1.0 – 2.015 - 50600 – 1,200Stiff soil profileD
> 2.0> 501,200 – 2,500Very dense soil and soil rockC
2,500 – 5,000RockB
> 5,000Hard rockA
Additional Criteriacu (ksf)SPT N-valueVs (ft/sec)Soil Type and ProfileSite Class
Vs = average shear wave velocity, upper 100 ft of the subsurface profileN = average SPT N-value (blows/ft), upper 100 ft of the subsurface profilecu = average undrained shear strength, upper 100 ft. of subsurface profile(1) soft clay defined as soil with PI > 20, w% > 40, and cu < 0.5 ksf
Fa, Fv
generallyincreasing
Seismic Risk ZoneSeismic Risk Zone
40.50 < SD1
30.30 < SD1 < 0.50
20.15 < SD1 < 0.30
1SD1 < 0.15
Seismic ZoneAcceleration Coefficient
Zone 1, Seismic analysis not req’d
Leq
Leq = Equivalent Depthof fixity, zones 2 or 3,Site class A-D
KxKz
KΨ
Kx,z,Ψ = EquivalentLinear Spring Constants

12
ASCE Seminar, San Antonio, Jan., 2009
Dan Brown, P.E., Ph.D.
Drilled Shaft Design for Seismic ForcesDrilled Shaft Design for Seismic Forces
Type IExtension of column below grade
Type IIDrilled shaft designed to remain elasticShaft designed for seismic force to produce plastic hinge moment in column above
LPILE Analyses of a Type II DesignLPILE Analyses of a Type II Design
7ft Dia by 30ft High Column1.5% Reinf
-80
-70
-60
-50
-40
-30
-20
-10
0
0.00 0.20 0.40 0.60 0.80 1.00M/M_ult
Dep
th, f
t
20ft Soft Clay, 8.5ft Shaft20ft Soft Clay, 9ft Shaft30ft V_So Clay, 8.5ft Shaft30ft V_So Clay, 9ft Shaft
soft clay
hard clay
M_ult Col-Shaft Transition
20ft
30ft

13
ASCE Seminar, San Antonio, Jan., 2009
Dan Brown, P.E., Ph.D.
Constructability Issues with Type II Constructability Issues with Type II ConnectionsConnections
Difficult to hold or position column reinforcement during placementProblems with tremie-placed concrete flow through 2 concentric cages
slurry
soil
tremie
concrete
SolutionsSolutions
Use pea gravel concrete mixBundle the bars, including hoopsPour shaft, then stick column cage into the fluid concrete
Best Solution:Best Solution:Use surface casing with cold joint, place concrete in the dry

14
ASCE Seminar, San Antonio, Jan., 2009
Dan Brown, P.E., Ph.D.
SlipSlip--in Surface Casingin Surface Casing
LiquefactionLiquefaction
Temporary loss of strength & stiffness in liquefied zoneMay occur during seismic loadingMay trigger lateral spreadingPost-event downdrag

15
ASCE Seminar, San Antonio, Jan., 2009
Dan Brown, P.E., Ph.D.
Lateral Resistance of Liquefied SoilLateral Resistance of Liquefied Soil
Typically model with p-y curve having reduced resistance
Soft clay with SuSand with P-multiplier Reduced effective stressSpecific p-y formulation
Undrained Shear StrengthUndrained Shear Strength
(N1)60-cs = (N1)60 - Ncorr

16
ASCE Seminar, San Antonio, Jan., 2009
Dan Brown, P.E., Ph.D.
PP--multiplier Approachmultiplier Approach
From centrifuge testing at UC Davis
Reduced Effective StressReduced Effective Stress
Brown & Camp (2002) Based on field tests of 8ft dia shafts with blast-induced liquefaction

17
ASCE Seminar, San Antonio, Jan., 2009
Dan Brown, P.E., Ph.D.
Lateral Lateral StatnamicStatnamic w/ Liquefactionw/ Liquefaction
Lateral Lateral StatnamicStatnamic w/ Liquefactionw/ Liquefaction

18
ASCE Seminar, San Antonio, Jan., 2009
Dan Brown, P.E., Ph.D.
Lateral Static (cyclic) Test w/ Lateral Static (cyclic) Test w/ LiquefactionLiquefaction

19
ASCE Seminar, San Antonio, Jan., 2009
Dan Brown, P.E., Ph.D.
CPT Data at Liquefaction SiteCPT Data at Liquefaction SiteTip Resistance
0
1
2
3
4
5
6
7
8
9
0 2 4 6 8 10 12
qT (MPa)
Dep
th (m
)
Pre-Blast
Blast 2
PostBlast
Peak Strain DataPeak Strain Data

20
ASCE Seminar, San Antonio, Jan., 2009
Dan Brown, P.E., Ph.D.
Peak Displacement Peak Displacement vsvs DepthDepth
Lateral Static (cyclic) ResultsLateral Static (cyclic) Results

21
ASCE Seminar, San Antonio, Jan., 2009
Dan Brown, P.E., Ph.D.
Modeling Liquefaction pModeling Liquefaction p--y Response, MP1y Response, MP1
Modeling Liquefaction pModeling Liquefaction p--y Response, MP3y Response, MP3

22
ASCE Seminar, San Antonio, Jan., 2009
Dan Brown, P.E., Ph.D.
Rollins, Pipe Pile Group TestsRollins, Pipe Pile Group TestsEmpirical p-y relationship from Treasure Island site
Rollins, et al, ASCE GT Journal, Jan05
Lateral SpreadingLateral Spreading
De-coupled from inertial forcesStatic LPILE analysis with offset p-y curvesLiquefied p-y soil, but may include crust of non-liquefied soil
Spread Non-Liquefiable
Material (Crust)
Liquefiable Material
Non-Liquefiable Material Drilled
Shaft
Displaced Shape of Soil
Displaced Shape of Pile

23
ASCE Seminar, San Antonio, Jan., 2009
Dan Brown, P.E., Ph.D.
II--15 Bridge, Salt Lake City15 Bridge, Salt Lake City
-140
-120
-100
-80
-60
-40
-20
0
20-2000 0 2000 4000 6000 8000 10000
Moment, kip-ft
Dep
th b
elow
Gro
und,
ft
-140
-120
-100
-80
-60
-40
-20
0
20-1 0 1 2 3 4
Deflection, inches
Dep
th b
elow
Gro
und,
ft
Loose sand & silt
Dense sand & gravel& clay
9ftDiashaft
Estimated lateral spread of up to 7ft
Large, heavy cages pose construction challenge
Concrete FlowLiftingSplicingTime
Design of Reinforcement for Design of Reinforcement for ConstructabilityConstructability

24
ASCE Seminar, San Antonio, Jan., 2009
Dan Brown, P.E., Ph.D.
Design of Reinforcement for Design of Reinforcement for ConstructabilityConstructability
Effect of permanent steel liner
Use of permanent steel liner (CISS) for design offers advantages:
Increased StrengthIncreased DuctilityReduce rebar
Design of Reinforcement for Design of Reinforcement for ConstructabilityConstructability

25
ASCE Seminar, San Antonio, Jan., 2009
Dan Brown, P.E., Ph.D.
Need for Passing AbilityNeed for Passing Ability
Slump Flow (left) and LSlump Flow (left) and L--Box (right) Measurements of Box (right) Measurements of Workability and Passing AbilityWorkability and Passing Ability

26
ASCE Seminar, San Antonio, Jan., 2009
Dan Brown, P.E., Ph.D.
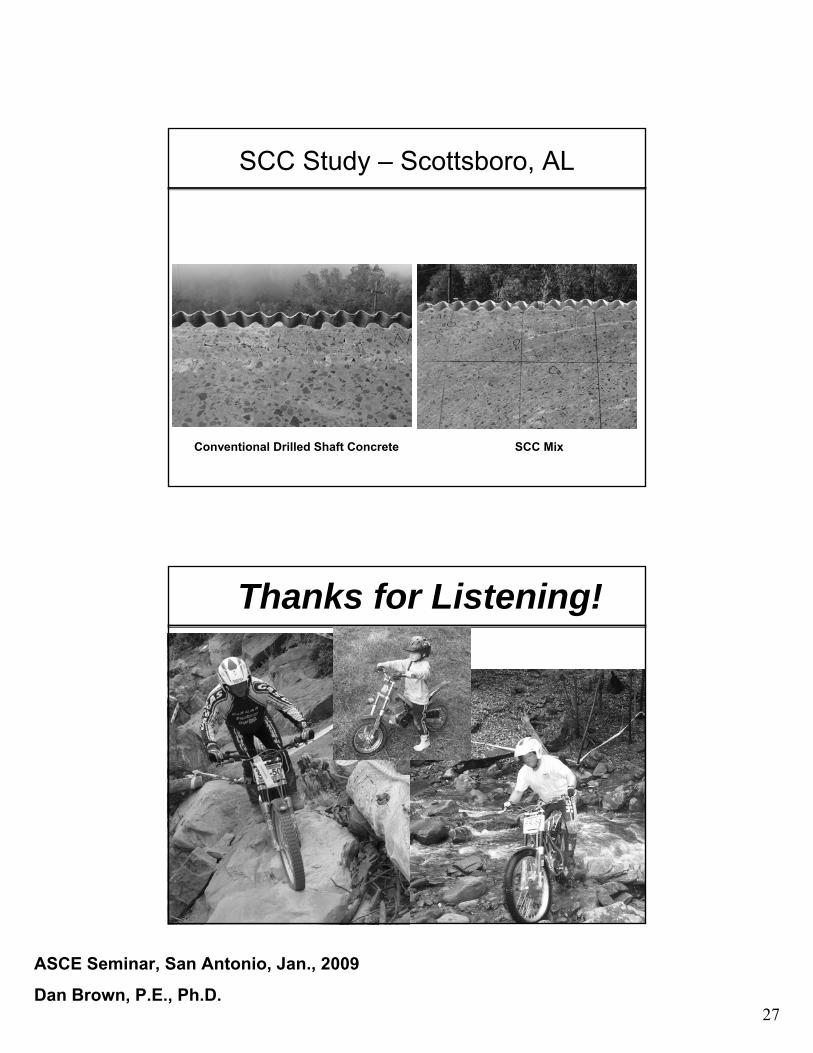
SCC Study SCC Study –– Scottsboro, ALScottsboro, AL
SCC Study SCC Study –– Scottsboro, ALScottsboro, AL
27
ASCE Seminar, San Antonio, Jan., 2009
Dan Brown, P.E., Ph.D.
SCC Study SCC Study –– Scottsboro, ALScottsboro, AL
Conventional Drilled Shaft Concrete SCC Mix
Thanks for Listening!Thanks for Listening!