Embed Size (px)
Citation preview

Extinction‐to‐backscatter ratios of Saharan dust layers derivedfrom in situ measurements and CALIPSO overflightsduring NAMMA
Ali Omar,1 Zhaoyan Liu,2 Mark Vaughan,1 Kenneth Thornhill,3 Chieko Kittaka,4
Syed Ismail,1 Yongxiang Hu,1 Gao Chen,1 Kathleen Powell,1 David Winker,1
Charles Trepte,1 Edward Winstead,3 and Bruce Anderson1
Received 25 March 2010; revised 22 June 2010; accepted 10 August 2010; published 31 December 2010.
[1] We determine the extinction‐to‐backscatter (Sa) ratios of dust using (1) airborne in situmeasurements of microphysical properties, (2) modeling studies, and (3) the Cloud‐AerosolLidar and Infrared Pathfinder Satellite Observations (CALIPSO) observations recordedduring the NASA African Monsoon Multidisciplinary Analyses (NAMMA) fieldexperiment conducted from Sal, Cape Verde during August to September 2006. UsingCALIPSO measurements of the attenuated backscatter of lofted Saharan dust layers, weapply the transmittance technique to estimate dust Sa ratios at 532 nm and a two‐colormethod to determine the corresponding 1064 nm Sa. This method yielded dust Sa ratios of39.8 ± 1.4 and 51.8 ± 3.6 sr at 532 and 1064 nm, respectively. Second, Sa at both wavelengthsis independently calculated using size distributions measured aboard the NASA DC‐8 andestimates of Saharan dust complex refractive indices applied in a T‐Matrix scheme. Wefound Sa ratios of 39.1 ± 3.5 and 50.0 ± 4 sr at 532 and 1064 nm, respectively, usingthe T‐Matrix calculations applied to measured size spectra. Finally, in situmeasurements of the total scattering (550 nm) and absorption coefficients (532 nm) areused to generate an extinction profile that is used to constrain the CALIPSO 532 nmextinction profile and thus generate a stratified 532 nm Sa. This method yielded an Sa ratioat 532 nm of 35.7 sr in the dust layer and 25 sr in the marine boundary layer consistentwith a predominantly sea‐salt aerosol near the ocean surface. Combinatorial simulationsusing noisy size spectra and refractive indices were used to estimate the mean anduncertainty (one standard deviation) of these Sa ratios. These simulations produced amean (± uncertainty) of 39.4 (±5.9) and 56.5 (±16.5) sr at 532 and 1064 nm,respectively, corresponding to percentage uncertainties of 15% and 29%. These resultswill provide a measurements‐based estimate of the dust Sa for use in backscatter lidarinversion algorithms such as CALIOP (Cloud‐Aerosol Lidar With OrthogonalPolarization).
Citation: Omar, A., et al. (2010), Extinction‐to‐backscatter ratios of Saharan dust layers derived from in situ measurements andCALIPSO overflights during NAMMA, J. Geophys. Res., 115, D24217, doi:10.1029/2010JD014223.
1. Introduction
[2] Lidar is a powerful tool for studying the verticaldistribution of aerosols and clouds in the atmosphere. Ofparticular importance is the distribution and transport ofSaharan dust systems. The deployment of CALIPSO(Cloud‐Aerosol Lidar and Infrared Pathfinder Satellite
Observations), a joint NASA‐CNES satellite mission, hasenabled vertically resolved measurements of Sahara airlayer(s) (SAL), which will provide significant insights intoproperties of Sahara dust aerosols. CALIPSO is designedto provide measurements to advance our understanding ofthe role of aerosols and clouds in the climate system[Winker et al., 2009]. The Cloud‐Aerosol LIdar WithOrthogonal Polarization (CALIOP) [Winker et al., 2007] isthe primary instrument on the CALIPSO satellite. CALIOPis designed to acquire vertical profiles of elastic backscatterat two wavelengths (1064 and 532 nm) from a near‐nadir‐viewing geometry during both day and night phasesof the orbit. In addition to the total backscatter at the twowavelengths, CALIOP also provides profiles of lineardepolarization at 532 nm. Accurate aerosol and cloud heightsand retrievals of extinction coefficient profiles are derived
1NASA Langley Research Center, Hampton, Virginia, USA.2National Institute of Aerospace, NASA Langley Research Center,
Hampton, Virginia, USA.3Science Applications International Corp., NASA Langley Research
Center, Hampton, Virginia, USA.4Deceased 17 March 2009.
Copyright 2010 by the American Geophysical Union.0148‐0227/10/2010JD014223
JOURNAL OF GEOPHYSICAL RESEARCH, VOL. 115, D24217, doi:10.1029/2010JD014223, 2010
D24217 1 of 21

from the total backscatter measurements [Vaughan et al.,2009]. The depolarization measurements enable the dis-crimination between ice clouds and water clouds [Hu et al.,2009] and the identification of nonspherical aerosol parti-cles [Liu et al., 2009]. Additional information, such as esti-mates of particle size for the purpose of discriminatingbetween clouds and aerosols, are obtained from the ratios ofthe signals obtained at the two wavelengths. On 28 April2006, the CALIPSO satellite was launched into a low EarthSun‐synchronous orbit at a 705 km altitude and an incli-nation of 98.2°. A few months later, in August 2006, theNASA African Monsoon Multidisciplinary Analyses(NAMMA) campaign commenced at the Cape Verde Is-lands, 350 miles off the coast of Senegal in West Africa.NAMMA was designed to study the evolution of precipi-tating convective systems largely as this evolution per-tained to the SAL and its role in the tropical cyclogenesis.Several aircraft flights were dedicated to nearly coincidentmeasurements with NASA’s orbiting satellites (includingAqua, TRMM, and CloudSat/CALIPSO). For this study,we use data collected aboard NASA’s DC‐8 mediumaltitude research aircraft outfitted with, among other in-struments, a full suite of sensors and probes designed tomeasure aerosol microphysical and optical properties.Relevant parameters include high spatial‐resolution scat-tering and absorption coefficients at multiple wavelengthsin the visible spectrum and dry particle size distributionsover the 0.08–10 mm diameter range (G. Chen et al.,Observations of Saharan dust microphysical and opticalproperties from the eastern Atlantic during NAMMA air-borne field campaign, submitted to Atmospheric Chemistryand Physics, 2010).[3] Depending on the mineralogical composition, the
SAL can have a significant impact on both the radiationbalance and cloud processes. Dust particles scatter in theshortwave regime (cooling the planet) and absorb bothshortwave and longwave radiation (heating the planet). Bysome estimates, the anthropogenic forcing due to dust, i.e.,dust generated by human activity such as land clearing, iscomparable to the forcing by all other anthropogenicaerosols combined [Sokolik and Toon, 1996]. Saharan dustinfluences cyclone activity and convection in the region offthe west coast of Africa and air quality as far west as theU.S. east coast and Gulf of Mexico. There have been re-ports of causal links between cyclone activity and dustloading suggesting that perhaps the Sahara dust layer actsto inhibit cyclone development [Dunion and Velden, 2004]and more generally convection [Wong and Dessler, 2005].Sahara dust is unique in its ability to maintain layer integ-rity as it is transported over long distances (∼7500 km) tothe Americas [Liu et al., 2008; Maring et al., 2003; Savoieand Prospero, 1976]. The presence of Sahara dust layershave been found to perturb ice nuclei (IN) concentrations asfar away as in Florida. During CRYSTAL‐FACE (CirrusRegional Study of Tropical Anvils and Cirrus Layers‐Florida Area Cirrus Experiment), DeMott et al. [2003]found that IN concentrations were significantly enhancedin heterogeneous ice nucleation regimes warmer than −38°C, when Saharan dust layers are present. It is thereforeimportant to study the distribution and optical properties ofSahara dust.
[4] In order to estimate the optical depth of the Saharadust layers from elastic backscatter lidar measurements, theSa ratio must be known or prescribed. Given aerosol freeregions above and below a lofted dust aerosol layer, Sa canbe calculated from the attenuated backscatter profile of aspace‐based lidar return [Young, 1995]. Sa for dust aero-sols is dependent on the mineral composition, size dis-tribution, and shape parameters (e.g., aspect ratio andcomplexity factor). All of these are highly variable andfor the most part not well known. For these reasons, Saobtained from scattering models have larger uncertaintiesthan models of the nearly spherical urban pollution ormarine aerosols.[5] There have been several studies and measurements of
dust Sa at 532 nm [Ackermann, 1998; Anderson et al.,2000; Berthier et al., 2006; Di Iorio et al., 2003, 2009;Muller et al., 2007; Müller et al., 2000; Tesche et al.,2009] and relatively few such measurements or studiesof dust Sa at 1064 nm [Ackermann, 1998; Liu et al., 2008;Tesche et al., 2009]. Prior to NAMMA, there were anumber of vertically resolved measurements of Saharandust microphysical and optical properties including AfricanMonsoon Multidisciplinary Analysis (AMMA) [Chazetteet al., 2007; Haywood et al., 2008]. NAMMA studiesalong with CALIPSO measurements provide a uniqueopportunity to compare extinction measurements derivedfrom in situ profile measurements of total scattering andabsorption aboard the NASADC‐8 and CALIPSO extinctionprofiles estimated from two wavelength retrieval methods.These profiles by extension provide the constraints fromwhich the lidar ratios can be determined as explained in thefollowing sections. Section 2 discusses the CALIPSO lidardata and its analysis. The NAMMA data and analyses arediscussed in section 3, and coincident CALIPSO‐NAMMAmeasurements are presented in section 4. In section 5, the sizedistributions measured during NAMMA aboard the DC‐8 areimplemented in a T‐Matrix scheme to estimate profiles ofSa ratios. Section 6 discusses the uncertainty in Sa using acombinatorial method.
2. CALIPSO Lidar Data andExtinction‐to‐Backscatter Ratio Retrieval Methods
[6] The CALIPSO lidar data used for these studies are theversion 2.01 lidar level 1 attenuated backscatter returns at the532 nm perpendicular and parallel channels and 1064 nmtotal attenuated backscatter. The volume depolarizationratio is determined from the perpendicular and parallelchannels and used to identify dust aerosols [Liu et al.,2009; Omar et al., 2009]. For NAMMA underflights ofCALIPSO and near spatial coincidences where both mis-sions observed dust layers of optical depths greater thanabout 0.3, we compare the extinction profiles from in situmeasurements to CALIPSO profiles. In such cases, wecalculate the extinction using Sa that was determined usingthe transmittance method or an Sa ratio constrained by thein situ extinction profiles. In both cases, we use the two‐color methods to retrieve the 1064 nm Sa, after determiningthe 532 nm Sa. These two methods, transmittance and two‐color, are discussed below.
OMAR ET AL.: EXTINCTION‐TO‐BACKSCATTER RATIOS OF DUST D24217D24217
2 of 21

2.1. Transmittance Methods
[7] The transmittance method uses the following equa-tion describing the relationship between optical depth andintegrated attenuated backscatter, as in the work of Platt[1973],
g0 ¼ 1
2hSa1� exp �2htð Þð Þ: ð1Þ
[8] Here g′ is the integrated (from layer base to top)attenuated backscatter,
�0 ¼
Z top
base�a rð ÞT 2
a rð Þdr: ð2Þ
[9] t is optical depth, h is a multiple scattering parameter,T2 = exp(−2ht) is the layer‐effective two‐way transmit-tance, and Sa = sa/ba, where ba is the aerosol backscattercoefficient and sa is the aerosol extinction coefficient. Thisratio is assumed constant throughout a feature. Note that thequantities Sa, g′, and t describe characteristics of an aerosollayer, i.e., they are associated with the backscatter andextinction of aerosol particles only. If we define an effectiveSa ratio, S* = hSa, we can rewrite equation (1) as follows,
S* ¼ 1� T2
2� 0 : ð3Þ
[10] The effective two‐way transmittance is typically ob-tained by fitting the returns both above and below a featureto a reference clear air scattering profile obtained from localrawinsonde measurements or meteorological model data[Young, 1995]. In this study, the transmittance method isused to determine S* from the 532 nm CALIPSO mea-surements whenever clear air scattering signals are availableboth above and below an aerosol layer. However, the samemethod is not applicable to the 1064 nm CALIPSO mea-surements, because a reliable measurement of the clear airscattering at 1064 nm, which is about 16 times smaller thanthat at 532 nm, is not available. To determine S* at 1064nm, the two‐color method described in section 2.2 is used.
2.2. The Two‐Color Method
[11] The two‐color or two‐wavelength method was firstproposed by Sasano and Browell [1989] and adapted tospaceborne lidar measurements using an optimization tech-nique by Vaughan et al. [2004]. The method requires apriori knowledge of Sa at 532 nm and a suitable profile of532 nm attenuated backscatter amenable to the calculationof 532 nm aerosol backscatter coefficient profiles. For theNAMMA cases described below, these preconditions weresatisfied. Whenever a suitable region of clear air was iden-tified both above and below an aerosol layer, the Sa at532 nm was determined using the transmittance methoddescribed above. A clear air layer is defined as a regionof low attenuated scattering ratios with a mean value equal toor less than 1 and a slope with respect to altitude ofapproximately zero. This is further confirmed by low volumedepolarization ratios in a small region (∼1/2 km) below theaerosol layer. In cases where coincident NAMMA mea-
surements are available, the Sa ratio at 532 nm is the valuethat provides the best fit between the retrieved CALIPSOextinction profiles and the NAMMA in situ extinction pro-files obtained by summing the total scattering and absorptionmeasured by a nephelometer and a Particle Soot/AbsorptionPhotometer (PSAP), respectively, aboard the DC‐8.[12] Once Sa ratio is determined at 532 nm, the value at
1064 nm can be calculated using the two‐color method.Note that this technique can be used to derive Sa at 532 nm ifthe value at 1064 nm is known. Given a solution of theparticulate backscatter at 532 nm (b532,p) the two‐colormethod uses a least squares method to minimize the dif-ference between the measured attenuated total backscatter at1064 nm (B1064) and the attenuated backscatter at 1064 nm(right‐hand side of equation (4)) reconstructed from theextinction and backscatter coefficients at 532 nm,
B1064 rð Þ ¼ �m;1064 rð Þ þ �p;1064
� �� T2p;1064 rð Þ
¼ �m;1064 rð Þ þ � � �p;532 rð Þ� �
� exp �2S1064� � � �532 rð Þ� � :
ð4Þ
[13] The only unknowns (underlined) in equation (4) arethe Sa ratio at 1064 nm (S1064) and the backscatter color ratioc (defined as b1064,p/b532,p). These are both intensiveaerosol properties defined by the layer composition, sizedistribution, and shape of its constituent particles. Assumingthese characteristics do not vary substantially in a givenaerosol layer, we can infer that S1064 and c are constantwithin the layer. The algorithm details and optimizationtechniques are discussed at length by Vaughan et al. [2004].
3. Numerical Calculation Based on NAMMAIn situ Measurements
3.1. Aerosol Microphysical Properties
[14] We use measurements of the aerosol size distribu-tions based on number concentrations from the Aerody-namic Particle Sizer (APS, TSI, Inc., Shoreview, MN) andthe Ultra‐High Sensitivity Aerosol Spectrometer (UHSAS,Droplet Measuring Systems, Boulder, CO). The UHSASmeasures the fine mode aerosol size distributions with par-ticle diameters from 0.06 to 0.98 mm, and the APS measuresthe coarse mode size distributions from 0.6 to 5.5 mm indiameter. The two instruments drew samples from a window‐mounted, shrouded inlet, which was maintained isokinetic bycontinually adjusting downstream flow in response to chan-ges in aircraft speed and ambient air density. The inlet wascharacterized during a series of tower flybys [McNaughtonet al., 2007] and found to efficiently transmit particlessmaller than 4 mm in diameter under flight conditions similarto those encountered during NAMMA. Our calculationssuggest that the short sample lines (<1 m) leading fromthe inlet to the instruments had a negligible effect onmeasured size distributions. Possible errors associated withthe UHSAS and APS measurements are discussed by Chenet al. (submitted manuscript, 2010). We use the size dis-tributions to identify the presence of aerosol dust layers. Inmany cases, these intense dust layers were visually identi-fied by the instrument operators and in some cases specifi-cally targeted by the DC‐8 operators for sampling. Additional
OMAR ET AL.: EXTINCTION‐TO‐BACKSCATTER RATIOS OF DUST D24217D24217
3 of 21

information about the composition of these layers is availablefrom the NAMMA data archives (http://namma.msfc.nasa.gov/). For each size distribution sampled during a 5 s interval,we fit the discrete measurements to the best continuousbimodal lognormal size distribution, as shown in Figure 1.The geometric mean radius and standard deviation of a fineand coarse mode derived from the in situ measurements areused in the numerical calculations.[15] On 25 August 2008, the DC‐8 flew through a dense
elevated dust layer measuring nearly 1 km in thickness at a
mean altitude of about 2.3 km in an hour‐long mostlystraight and level flight. The APS and UHSAS measuredcoarse and fine size distributions, respectively, through thedust layer at intervals of 5 s. Figure 2 shows the probabilitydistributions of the geometric mean fine and coarse radii ofthe dust layer. Figure 2 is generated by taking the discrete5 s size distribution measurements and fitting these to abimodal lognormal distribution as described above. For thisdust layer, the microphysical properties of mean, median,and standard deviations of the fine (coarse) radius distribu-tions, as shown in Figures 2a and 2b, are 0.059, 0.061, and0.0064 mm (0.54, 0.57, and 0.083 mm), respectively. Themean, median, and standard deviations shown in Figures 2cand 2d for the fine (coarse) geometric standard deviationdistributions are 1.613, 1.630, and 0.101 (1.495, 1.545, and0.151), respectively.[16] The distributions in Figure 2 show that Saharan dust
properties after lofting of these layers remain relativelyunchanged within the plume. Other studies [Liu et al., 2008;Maring et al., 2003; Prospero and Carlson, 1971, 1972]have shown the same consistency in properties after longrange transport of dust. In each case, the means and mediansof the size distribution descriptors are close, i.e., the sizedescriptors are nearly normally distributed. The standarddeviation is a small fraction (<0.16) of the means, i.e., thevariance of the data is small and thus the layer is quitehomogenous with respect to size across the 1 km verticalextent of the dust plume.
3.2. Scattering Models
[17] Mie scattering calculations [Mie, 1908], when appliedto dust, are adequate for total scattering, albedo, and otherflux‐related quantities, but result in large errors when usedto retrieve optical depth from satellite reflectance measure-ments. In particular and central to the theme of this paper,are Sa ratios calculated from measured size distributions.Mie calculations underestimate Sa by up to a factor of 2.0leading to substantial errors in the lidar‐derived aerosoloptical depths [Kalashnikova and Sokolik, 2002]. This hasbeen known experimentally for quite some time: laboratorymeasurements by Perry et al. [1978] showed nonsphericalparticles, when compared to spherical particles having thesame equivalent volume, enhance side scattering and sup-press backscattering. To account for nonsphericity of dustparticles, we use T‐matrix calculations with the assumptionthat the dust shapes can be modeled by randomly orientedprolate spheroids. T‐Matrix is a matrix formulation ofelectromagnetic scattering first proposed by Waterman[1971] and subsequently improved and extended to muchlarger sizes and aspect ratios by Mishchenko et al. in a seriesof papers [Mishchenko, 1991, 1993;Mishchenko and Travis,1994; Mishchenko et al., 1996a, 1996b; Mishchenko andTravis, 1998]. The T‐Matrix code used in these calcula-tions is described in detail by Mishchenko and Travis[1998]. This method is particularly suitable for light scat-tering calculations of nonspherical, polydisperse, randomlyoriented particles of identical axially symmetric shape withsize parameter, x (x = pdp/l, dp is particle diameter and l isthe wavelength), smaller than 30.[18] It is challenging to determine representative statistics
of the mean shape for dust particles because of their com-plexity and variety in shape. These particles are not only
Figure 1. (a) A Two‐dimensional probability plot ofNAMMA in situ size distributions measured in a dust layerover a 22 min period (∼260 size distributions) during Flight4 on 19 August 2006. The mean measured size distributionis denoted by the yellow line. (b) The best approximatebimodal lognormal particle size distribution (blue squares)with fine (coarse) mean radius of 0.0648 (0.5627) mm and afine (coarse) geometric standard deviation of 1.696 (1.572)fitted to the average measured size distribution (red squares).
OMAR ET AL.: EXTINCTION‐TO‐BACKSCATTER RATIOS OF DUST D24217D24217
4 of 21

Figure 2. The distributions of the (a) fine and (b) coarse geometric mean radii and the (c) fine and(d) coarse geometric standard deviations for a dense elevated dust layer measured during a flight on25 August 2006.
Table 1. Summary of Complex Dust Refractive Indices From Previous Studies
Wavelength (nm) Real Part Imaginary Part Source
500 1.50 0.0045 Volz [1973]1000 1.53 0.008 d’Almeida et al. [1991], dust‐like550 1.53 0.0055 d’Almeida et al. [1991], mineral dust1000 1.53 0.001 d’Almeida et al. [1991], mineral dust532 1.53 0.0043 Ackermann [1998], dust1064 1.53 0.0063 Ackermann [1998], dust670 1.55 ± 0.03 0.0014 ± 0.001 Dubovik et al. [2002], Bahrain dust1020 1.55 ± 0.03 0.003 ± 0.001 Dubovik et al. [2002], Bahrain dust670 1.56 ± 0.03 0.0013 ± 0.001 Dubovik et al. [2002], Solar Village dust1020 1.56 ± 0.03 0.001 ± 0.001 Dubovik et al. [2002], Solar Village dust532 1.52–1.58 0.005–0.007 Di Iorio et al. [2003], Saharan dust500 1.42 0.003 Israelevich et al. [2003], Sede Boker dust860 1.51 0.0032 Kalashnikova and Sokolik [2004], Saharan dust550 1.51 0.002 Kalashnikova and Sokolik [2004], Asian dust860 1.51 0.0007 Kalashnikova and Sokolik [2004], Asian dust670 1.45 0.0036 Omar et al. [2005], dust cluster550 1.53 0.0015 Cattrall et al. [2005], mineral dust1020 1.53 0.0005 Cattrall et al. [2005], mineral dust300–700 1.60–1.67 0.009–0.0104 Eidhammer et al. [2008], Wyoming dust355 1.52 ± 0.004 0.008 ± 0.001 Raut and Chazette [2008], Saharan dust537 1.53 0.0041 Schladitz et al. [2009], Saharan dust637 1.53 0.0031 Schladitz et al. [2009], Saharan dust450 1.55–1.56 0.0003–0.0052 Petzold et al. [2009], Saharan dust700 1.55–1.56 0.0003–0.0025 Petzold et al. [2009], Saharan dust530 1.55 0.0028–0.0037 Kandler et al. [2009], Saharan dust
OMAR ET AL.: EXTINCTION‐TO‐BACKSCATTER RATIOS OF DUST D24217D24217
5 of 21
confined to desert regions but are ubiquitous in conti-nental areas where they contribute quite significantly tothe extinction budget [Omar et al., 1999]. Fortunately,however, randomly oriented prolate and oblate spheroidscan adequately represent the scattering properties of non-spherical particles of the same aspect ratio [cf. Mishchenkoet al., 1995; Mishchenko and Travis, 1994]. The aspectratio is the ratio of the largest to the smallest particledimension. A prolate (oblate) spheroid is a rotationallysymmetric ellipsoid with a polar diameter greater (smaller)than the equatorial diameter.[19] There have been several studies of aspect ratio dis-
tributions representative of dust aerosols. From an analysisof scanning electron microscope images of yellow sandparticles, Nakajima et al. [1989] found that the distributionof the minor to major particle radius ratio peaked around0.6, equivalent to an aspect ratio of 1.67. An investigation ofmineral dust particle shapes using electron microscopy byOkada et al. [1987] found a mean aspect ratio of 1.4 rangingfrom 1.0 to 2.3. Hill et al. [1984] compared the measured
scattering properties of 312 samples of soil dust with thesimulated scattering properties of randomly oriented prolatespheroids using T‐matrix. They found the distributions ofthe aspect ratio of prolate spheroids centered near 2.3 mostclosely reproduced the measured scattering properties. Forthis study, we use a mean aspect ratio of 2.0 based on theabove studies and investigate the sensitivity of the Sa ratio toaspect ratios ranging from 1.7 to 2.3 partly to account for thedependence of the aspect ratio on size as discussed byKalashnikova and Sokolik [2004].[20] There is quite a wide range of estimated and mea-
sured mineral dust complex refractive indices (m – ik). Forwavelengths of 550 and 1000 nm, d’Almeida et al. [1991]estimate the real part (m) of 1.53 and 1.52, respectively,and a spectrally invariant imaginary part (k) of 0.008 fordust‐like aerosols, and 1.53 – i0.0055 and 1.53 – i0.001,respectively, for mineral dust. Ackerman [1998] used valuesof 1.53 – i0.0043 and 1.53 – i0.0063 to calculate dust Saratios of 19–23 and 17–18 sr at 532 and 1064 nm, respec-tively. These values are much lower than more recent532 nm dust Sa ratios of 40–60 sr [Cattrall et al., 2005; DiIorio et al., 2003;Muller et al., 2007;Murayama et al., 2003;Voss et al., 2001] because the Ackerman study assumedspherical particles.[21] Retrievals from radiances measured by ground‐based
Sun‐sky scanning radiometers of the Aerosol Robotic Net-work (AERONET) over a 2 year period yielded dust com-plex refractive index values of 1.55 ± 0.03 – i0.0014 ± 0.001at 670 nm and 1.55 ± 0.03 – i0.001 ± 0.001 at 1020 nm atBahrain (Persian Gulf) and 1.56 ± 0.03 – i0.0013 ± 0.001at 670 nm and 1.56 ± 0.03 – i0.001 ± 0.001 at 1020 nm atSolar Village in Saudi Arabia [Dubovik et al., 2002]. Usingvertically resolved aerosol size distributions in a scatteringmodel constrained by lidar measurements of aerosol back-scattering coefficient at 532 nm, Di Iorio et al. [2003]estimated dust refractive indices of 1.52–1.58 (real part)and 0.005–0.007 (imaginary part). Kalashnikova andSokolik [2004] calculated effective refractive indices fromcomponent mixtures and found values of 1.61 – i0.0213 and1.59 – i0.0032 for Saharan dust at wavelengths of 550 and
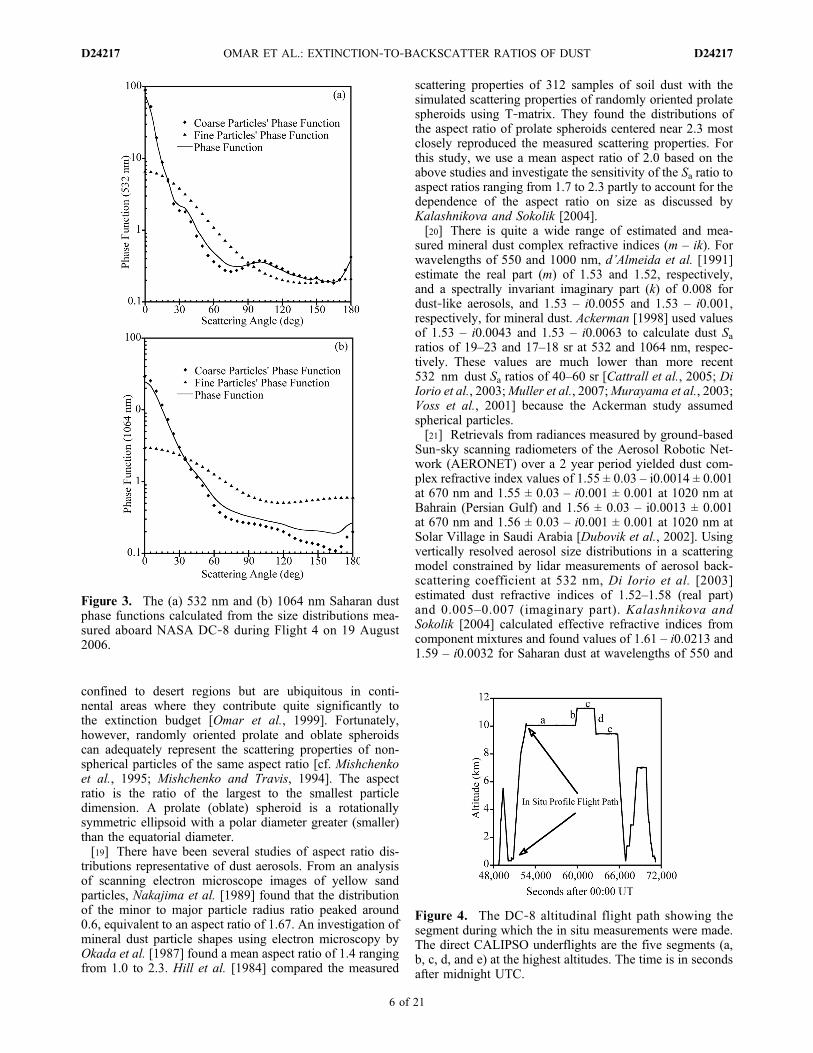
Figure 3. The (a) 532 nm and (b) 1064 nm Saharan dustphase functions calculated from the size distributions mea-sured aboard NASA DC‐8 during Flight 4 on 19 August2006.
Figure 4. The DC‐8 altitudinal flight path showing thesegment during which the in situ measurements were made.The direct CALIPSO underflights are the five segments (a,b, c, d, and e) at the highest altitudes. The time is in secondsafter midnight UTC.
OMAR ET AL.: EXTINCTION‐TO‐BACKSCATTER RATIOS OF DUST D24217D24217
6 of 21

860 nm, respectively. The values for Asian dust, from thesame monograph, are 1.51 – i0.0021 and 1.51 – i0.0007 at550 and 860 nm, respectively. Using a twin angle opticalcounter, Eidhammer et al. [2008] estimated the indices ofrefraction to be in the range 1.60–1.67 for the real part and0.009–0.0104 for the imaginary part.[22] The Saharan Mineral Dust Experiment (SAMUM)
[Heintzenberg, 2009; Rodhe, 2009] based in Morocco in2006 produced several independent estimates of the com-plex refractive indices of Saharan dust. Kandler et al. [2009]determined Saharan dust aerosol complex refractive indexfrom chemical/mineralogical composition of 1.55 – i0.0028and 1.57 – i0.0037 at 530 nm for small (diameter < 500 nm)and large particles (diameter > 500 nm), respectively.
Schladitz et al. [2009] derived mean refractive indices of1.53 – i0.0041 at 537 nm and 1.53 – i0.0031 at 637 nm frommeasurements of scattering and absorption coefficients, andparticle size distributions. Using similar methods duringSAMUM, Petzold et al. [2009] found real parts of therefractive indices of Saharan dust ranging from 1.55 to 1.56and imaginary parts ranging from 0.0003 to 0.0052. Someof the estimates of refractive indices reported in the literatureare summarized in Table 1.[23] To perform the sensitivity study described in section 6,
we use values of the real part of the refractive index rangingfrom 1.45 to 1.55 (normally distributed) and the imaginarypart ranging from 0.00067 to 0.006 (log normally distrib-uted) with a central value of 1.50 – i0.002. For the scattering
Figure 5. CALIPSO flight tracks superimposed on (a) the MODIS optical depth and (b) the MOPPITTCO concentrations. The DC‐8 flight track for 19 August 2006 is shown by the black lines in the middle ofboth figures. The blue dots in Figure 5a denote the portion of the DC‐8 flight segment during which the insitu measurements were taken. Daytime CALIPSO tracks run from the southeast to the northwest whilethe nighttime tracks run from northeast to the southwest.
Figure 6. Browse image of the CALIPSO flight track on 19 August 2006 shown in blue in the insetmap and the location of the near coincidence of the CALIPSO flight track and the DC‐8 flight 4 duringNAMMA is denoted by the two white lines near 15°N, 19°W. In the image, colors above the surfaceare coded as follows: blue indicates clear sky, white indicates clouds, and warm colors (green, yellow,orange, and red) indicate aerosols. The white parallel lines bound the CALIPSO profiles closest to thein situ measurements.
OMAR ET AL.: EXTINCTION‐TO‐BACKSCATTER RATIOS OF DUST D24217D24217
7 of 21

calculations using NAMMA size distributions, we use thecentral values of the refractive indices along with the nearlyinstantaneous (5 s interval) size distribution measurements togenerate profiles of the aerosol properties. Figure 3 is a plotof the fine mode, coarse mode, and total phase function of thedust plume encountered on 19 August 2006. The fine modeand coarse mode phase functions are computed from themean of the instantaneous size distributions, and the totalphase function is the area‐weighted composite of the fine andcoarse mode phase functions. The phase functions are drivenlargely by the coarse mode, especially at 532 nm, and exhibita more pronounced peak in the backscattering direction at532 nm than 1064 nm.
4. Data Analyses of CALIPSO NAMMACoincident Measurements
[24] For this study, we analyzed coincident measure-ments of the CALIOP 532 nm extinction profiles and insitu extinction profiles measured at wavelengths near theCALIOP green channel. The in situ extinction coefficient isobtained by summing the scattering (550 nm) and absorption(532 nm) coefficients measured by a nephelometer and aPSAP, respectively. Data from the nephelometer and PSAPhave been corrected for errors associated with the limiteddetector viewing angle [Anderson and Ogren, 1998] andscattering from the filter media [Virkkula et al., 2005],respectively. We make the assumption that the scatteringproperties are invariant over the 532–550 nm range for theselarge dust particle sizes.We chose 3 days onwhich there werenear collocated CALIPSO and NAMMA measurements ofnearly the same air mass.
4.1. 19 August 2006 NAMMA Flight 4
[25] 19 August was one of the days the DC‐8 performedan under flight of CALIPSO. Figure 4 shows the time‐altitude flight track of the DC‐8. A nearly coincident in situprofile was obtained during the second ascent leg shown inFigure 4. In this segment, the DC‐8 climbed from 300 m at
Figure 7. Aerosol scattering ratio (ba/bm at 815 nm) image measured by the Lidar Atmospheric SensingExperiment (LASE) aboard DC‐8 during the ascending segment passing through a Sahara Air Layer(SAL) and the underflight of CALIPSO as shown in Figure 4. The DC‐8 point of nearest approach tothe CALIPSO flight track is near 15°N–19°W.
Figure 8. A comparison of the profiles of the in situ extinc-tion coefficient derived during the DC‐8 ascending segmentas shown in Figure 4 and the extinction coefficient retrievedfrom the CALIPSO measurement averaged over the regionindicated by the two white lines in Figure 6. The Sa ratioswere determined using the in situ extinction as an additionalconstraint.
OMAR ET AL.: EXTINCTION‐TO‐BACKSCATTER RATIOS OF DUST D24217D24217
8 of 21

50,460 s to 10 km at 52,575 s after UTC. The climb flighttime was 2115 s (∼35 min) at a rate slightly lower than theDC‐8’s nominal rate of climb of 4.8 m s−1. Atmosphericcontext for this flight is given by Figures 5a and 5b, inwhich both the DC‐8 and CALIPSO flight tracks are su-perimposed on images of measurements made by theModerate Resolution Imaging Spectroradiometer (MODIS)and Measurements of Pollution in the Troposphere (MO-PITT), respectively. The DC‐8 flight tracks are the blackirregular octagons, and the CALIPSO orbit tracks are thestraight lines in both images. The underflights in Figures 5aand 5b are segments where the DC‐8 flies under theCALIPSO satellite and the two are momentarily both tem-porally and spatially collocated. Unfortunately, the directunderflight of CALIPSO by the DC‐8 was a nearly levelflight with no in situ profile information. In fact theDC‐8 was at a high altitude near Flight Level 330 (∼10 km)throughout the underflight and therefore did not encounterany significant aerosol layer at this altitude to sample. Weused the ascending leg of the DC‐8 flight, which correspondsto the flight segment during ascent to the CALIPSO under-flight portion denoted by blue dots in Figure 5a. The in situprofile segment is shown in Figure 4.[26] The MODIS optical depth near the coincident flight
segment is about 0.5. The MOPPITT image shows moderateCO concentrations in the vicinity of the coincident flight
track and therefore indicates that most of the aerosol is dustand not continental pollution or biomass burning. This canalso be confirmed by the CALIPSO depolarization mea-surements. The image also shows high CO concentrations(>2.5 × 10¹⁸ molecules/cm2) to the south of the DC‐8 flighttracks most likely due to biomass burning and identified assuch by the CALIPSO aerosol subtyping scheme illustratedlater in this section.[27] The CALIPSO browse images (e.g., Figure 6) are
plots of the attenuated backscatter color coded by intensityvarying from blue (weak) to white (very strong). A hori-zontal line near the 0 km mark denotes the surface. TheCALIPSO data used for comparison with the in situ datacome from the 80 profiles (∼27 km horizontal average)between the white lines in the browse image (Figure 6). Todetermine the optimal 532 nm Sa ratio for these data, weiteratively adjust Sa until the difference, in a least squaressense, between the retrieved CALIPSO profile, sa,532 nm,and the measured NAMMA profile, sa,550 nm, is minimized.This is analogous to the CALIOP validation efforts ofChazette et al. [2010] using ground based and airbornemeasurements.[28] Figure 7 is an image of the aerosol scattering ratios
measured by the Lidar Atmospheric Sensing Experiment(LASE) on board the DC‐8 during the ascent leg of Flight 4on 19 August 2006 as indicated in Figure 4. The measure-
Figure 9. Products of the CALIPSO (a) cloud‐aerosol discrimination and (b) aerosol classificationschemes for the data in the browse image shown in Figure 6. The cloud aerosol discrimination showsthe extensive aerosol layer at 3 km and the aerosol classification image shows that this aerosol is aSaharan dust layer to the north and a polluted dust and smoke layer to the south.
OMAR ET AL.: EXTINCTION‐TO‐BACKSCATTER RATIOS OF DUST D24217D24217
9 of 21

ments were made at 815 nm, and the extinction calculationwas performed using an Sa ratio of 36 sr [Ismail et al.,2010]. The DC‐8 flight track is shown by the solid line inFigure 7 during which the in situ measurements shown inFigure 8 were made. Figure 7 also shows the regionnearest to the CALIPSO overpass where measurements ofthe CALIPSO profiles shown in Figure 8 were made.LASE observed a dust layer extending to an altitude of6 km at the coincident point. This dust layer is opticallyand geometrically thick and is lofted over a layer oflower optical depth (aerosol scattering ratio ∼1) in themarine boundary layer. Some differences in altitude andextent of the layer between the CALIPSO and LASEmeasurements can be attributed to temporal and spatialmismatch.[29] Figure 8 is a plot of the extinction profiles retrieved
from CALIPSO’s 532 nm backscatter profiles and the pro-files of the sum of scattering (550 nm) and absorption (532
nm) measured by the nephelometer and the PSAP aboardthe NASA DC‐8, respectively. These profiles were takenduring the ascent leg shown in Figure 4 corresponding to theflight tracks shown in Figure 5a. As in the LASE observa-tion in Figure 7, the aerosol is stratified into two layers. Theboundary between the two layers is determined by theincrease in the extinction coefficient near 2 km. The two Saratios are values that provide the best fit in a least squaressense of the CALIPSO data to the NAMMA in situ mea-surements. The 532 nm Sa ratios are consistent with a dustplume (Sa = 35.7 sr) above sea salt in the marine boundarylayer (Sa = 25 sr). The root mean square (rms) of the dif-ferences between the CALIPSO and the NAMMA in situextinction coefficient profiles are 20.2 and 47.4 Mm−1 forthe marine and dust layers, respectively. The rms of thedifferences in the extinction coefficients in the clear region(4–8.5 km) above the dust layer in Figure 6 is 12.3 Mm−1.Some differences between the two extinction profiles in
Figure 10. (a) Browse image of the orbit segment denoted by the blue track in the inset map and (b) anexpansion of the dust layer region of the plot marked by yellow dots in Figure 10a. In both cases, the colorcode is as in Figure 6. The red dashed oval shows the elevated (layer top ∼ 5km) dust layer. Aerosoloptical depths at 532 nm for all five segments are shown and are near 0.3. The range corrected mean totalattenuated backscatter (red lines) and molecular backscatter (blue lines) profiles are shown in Figure 10cfor the five segments of the dust layer analyzed in Figure 10b.
OMAR ET AL.: EXTINCTION‐TO‐BACKSCATTER RATIOS OF DUST D24217D24217
10 of 21

Figure 8 are likely due to the temporal and spatial mis-matches of 30 min and 160 km, respectively, betweenDC‐8 and CALIPSO.[30] Figure 9 is a plot of the results of (Figure 9a) the
cloud‐aerosol discrimination and (Figure 9b) aerosolclassification algorithms applied to the data shown in thebrowse image including the NAMMA underflight (Flight4 of 19 August 2006). The CALIPSO level 2 algorithmsfirst discriminate between aerosol and clouds [Liu et al.,2009] and then classify the aerosol layers into aerosolsubtypes [Omar et al., 2009]. Figure 9a shows that someof the optically thick aerosol near 15°N was misclassifiedas clouds and thus was not examined by the aerosolsubtyping algorithm. The presence of biomass burningsmoke and polluted dust (mixture of dust and smoke)
during the first part of the flight depicted in Figure 9b isborne out by the high CO concentrations in the MOP-PITT data to the south of the DC‐8 flight tracks shown inFigure 5b. Although the small lump of aerosol at thesurface near 15°N is classified as pure dust, it is morelikely a mixture of dust and marine aerosol. The whiteline in the Figure is the midpoint of the 80 profilesaveraged for the retrieval of the extinction profile dis-cussed above.[31] CALIPSO also measured a dense Saharan dust layer
to the southwest of the coincident measurements during anighttime orbit on the same day (19 August 2006). Thebrowse images of attenuated backscatter at 532 nm for thismeasurement are shown in Figure 10. The inset map inFigure 10 shows the CALIPSO ground track in blue. This
Figure 11. CALIPSO flight tracks superimposed on (a) the MODIS optical depth and (b) the MOPPITTCO concentrations. The CALIPSO flight tracks are colored cyan and gray in the MODIS and MOPPITTimages, respectively. The DC‐8 flight track for 26 August 2006 is shown by the heart‐shaped drawing inthe middle of both figures. The CALIPSO underflight segment is the portion of the flight track in align-ment with the CALIPSO flight track in cyan or gray in Figures 11a and 11b, respectively. The DC‐8 insitu data for this obtained during the descent flight segment are shown by a red dashed tilted oval inFigure 11a.
Figure 12. Browse image of the CALIPSO flight track shown in green in the inset map and the locationof the near coincidence (in space) of the CALIPSO flight track and the DC‐8 flight 8 on 26 August 2006.The color code is as in Figure 6. The white lines denote the CALIPSO data used for comparison with theDC‐8 measurements.
OMAR ET AL.: EXTINCTION‐TO‐BACKSCATTER RATIOS OF DUST D24217D24217
11 of 21

dust layer appears to be a more robust part of the same dustplume observed during the coincident measurement.[32] As shown (by the red dotted oval) in Figure 10a, the
layer exceeds 1000 km in horizontal extent (from 18.3°N to10.3°N). The 532 nm aerosol optical depth (AOD) is greaterthan about 0.3 across most of the 1000 km orbital segmentshown in Figure 10a. Figure 10b is a magnified illustrationof the region in Figure 9a subtended by the yellow dottedline. We divided the layer into five segments and appliedthe transmittance method of section 2.1 to the meanbackscatter of 100 profiles of each segment (about 34 km)to calculate a 532 nm Sa and the two‐color method ofsection 2.2 to calculate a 1064 nm Sa ratio. These values
are shown in green (532 nm) and red (1064 nm) in Figure 10b.Clear air regions above and below each dust layer wereidentified manually by inspection of the profiles. Note thatfor this mesoscale layer the 532 nm Sa ratios range from 38 to41 sr with an average of 40.1 sr and the 1064 nm Sa ratiosrange from 45.8 to 54.2 with an average of 50.9 sr.[33] Figure 10 shows that the Sahara dust layers once
elevated are consistent both geometrically (the layer isconfined to 3–5 km altitude band) and optically (Sa variationat both wavelengths is small and the layer optical depth isnear 0.3). The Sa ratio is an intensive aerosol property thatdepends on the composition, size distributions, and particleshape of the aerosol and its consistency is an indication thatthese layers stay intact over very long distances. Otherstudies have shown the transport of relatively unmixed Sa-haran mineral dust to the south American rainforest[Ansmann et al., 2009; Graham et al., 2003] and westernAtlantic Ocean [Formenti et al., 2003; Kaufman et al.,2005], including the U.S. eastern seaboard [cf. Liu et al.,2008].
4.2. 26 August 2006
[34] The 26 August DC‐8 flight included an underflight ofCALIPSO. As is the case with the coincident CALIPSO‐NAMMA measurements on 19 August, the collocatedmeasurements are at one level and lack in situ profilemeasurements. In situ profiles of the size distributionswere estimated from the DC‐8 data obtained during thedescent flight segment shown by a red dashed tilted ovalin Figure 11a and flown about 2 h earlier than the CA-LIPSO underflight. The MOPITT CO levels (Figure 11b)for this period are slightly elevated. The extinction com-parison shows that the layer observed by CALIPSO ismore elevated than the one encountered by the DC‐8.Figure 12 is a browse image of the CALIPSO 532 nmattenuated backscatter coefficients measured during theorbital segment corresponding to Flight 8 of the DC‐8. TheCALIPSO data used for comparison with the in situ extinc-
Figure 13. A comparison of the NAMMA in situ extinctionprofile and the extinction profile calculated from CALIPSO’sattenuated backscatter measurement using 532 nm Sa ratio of38.2 sr obtained using the transmittance method. The twomeasurements both taken on 26 August 2006 are offset by2 h and ∼1250 km.
Figure 14. CALIPSO flight tracks superimposed on (a) the MODIS optical depth and (b) the MOPPITTCO concentrations. The CALIPSO flight tracks are colored cyan and gray in the MODIS and MOPPITTimages. The DC‐8 flight track for 1 September 2006 is shown by the black lines in the middle of bothfigures.
OMAR ET AL.: EXTINCTION‐TO‐BACKSCATTER RATIOS OF DUST D24217D24217
12 of 21

tion profiles were extracted from the region between the twowhite lines shown in Figure 12.[35] Figure 13 compares the CALIPSO extinction profile
with a profile of the extinction derived from in situ mea-surements (i.e., the sum of the absorption and scatteringcoefficients). The maximum extinction coefficients of 160and 140 Mm−1 by CALIPSO and the DC‐8, respectively,are comparable, showing that the layer is intact after 2 h.The altitudes of the maximum layer extinctions for theCALIPSO and NAMMA measurements are offset by at least1 km. The in situ measurements and CALIPSO observationsare far removed from each other in this case (2 h and1250 km). The data shown in Figure 12 are north of theNAMMA flight segment. These differences are shown by
the mismatch in layer heights shown in Figure 13.Because of the relatively large mismatch, the constraintmethod, which requires good coincidence, is not applicableto this case to derive Sa. However, the transmittancetechnique can be applied using the CALIPSO measurementaveraged over the region bounded by two white lines inFigure 12. Note that the dust layer overlies a streak ofmarine stratus just above the marine boundary layer. At532 nm, the dust layer has an optical thickness of 0.41 andan Sa ratio of 38.2 sr. Although the Saharan layers canhave horizontal extents of thousands of kilometers, it ispossible that the layer observed by CALIPSO is not the
Figure 15. Browse image of the CALIPSO flight track shown in cyan in the inset map and the locationof the near coincidence (in space) of the CALIPSO and the DC‐8 flight tracks on 1 September duringNAMMA. The color code is as in Figure 6. The white lines subtend the region averaged for theextinction comparison.
Figure 16. The NAMMA/CALIPSO extinction compari-son for Flight 10 on 1 September 2006. Note that the cen-troid of the layer has shifted upward by about 1.5 km inbetween the CALIPSO measurement and NAMMA sam-pling. The CALIPSO measurement is ∼15 h earlier andnearly 750 km away.
Figure 17. A profile of the 1064 and 532 nm Sa ratios andintegrated number distribution of coarse particles (0.583–6.264 mm) taken from a 20 min segment of the APS mea-surements during Flight 4 on 19 August 2006. The dust baseand top are shown by the lines at altitudes of 2.5 and 4.6 km,respectively. The mean 532 and 1064 nm Sa ratios for thelayer is 34.3 ± 2.0 and 50.2 ± 5.7 sr, respectively.
OMAR ET AL.: EXTINCTION‐TO‐BACKSCATTER RATIOS OF DUST D24217D24217
13 of 21
same as the one measured by the in situ instrumentsaboard the DC‐8. Notwithstanding this possibility, theproperties measured by the two methods provide inde-pendent characterization of the Saharan dust and polluteddust layers.
4.3. 1 September 2006
[36] Flight 10 of the DC‐8 on 1 September 2006 neitherdirectly underflew nor intercepted the CALIPSO orbittracks. However, this flight sampled some of the sameaerosol layers measured during a CALIPSO orbit track, asshown in the MODIS aerosol optical depth image inFigure 14a. The region of interest is denoted by the redcircle. The DC‐8 flight segment most relevant and ofclosest proximity is the descending leg located in thisregion. The MOPPITT CO concentrations are low (1.5–2 ×10¹⁸ molecules/cm2) in the comparison region. It is there-fore likely that most of the aerosol mass is Saharan dust.CALIPSO preceded the DC‐8 by 14 h. As in the previousflight of 26 August, the observed layers by CALIPSO andthe in situ measurements may be different.[37] The CALIPSO browse image (Figure 15) shows the
layers of interest marked by two white lines and comprisingof 80 profiles. Note that though there are low clouds imme-diately above the marine boundary layer, there exists a smallregion above the clouds of relatively clean air. The trans-mittance and two‐color methods yielded Sa ratios of 39.8 and
56 sr at 532 and 1064 nm, respectively. The optical depthdetermined from the inversion of the CALIOP attenuatedbackscatter using this lidar ratio (39.8 sr at 532 nm) is 0.55. InFigure 14a, the MODIS AOD is about 0.5 in this region.[38] It is a general transport pattern that Saharan dust
aerosol goes through a phase of rising motion near thesource then relative horizontal transport culminating indescent and deposition near the Americas [Ansmann et al.,2009; Formenti et al., 2003; Graham et al., 2003;Kaufman et al., 2005; Okin et al., 2004]. If the layerobserved on 1 September 2006 by CALIPSO is the same asthe one observed by the in situ measurements, then it wasin the rising phase at a rate of approximately 0.1 km/h. Therate of ascent is based on the time difference between theCALIPSO overpass (3:30 am Local Time) and DC‐8 flighttrack (6:30 pm Local Time) of nearest approach. Theextinction profiles’ comparison (Figure 16) between the DC‐8 in situ measurements and the CALIPSO measurementsshows an offset of 1.5 km in the altitude of maximumextinction coefficient. The layer shown at the same locationhas been elevated by 1.5 km since CALIPSO sampled it.During this rising phase, there is no evidence of significantdeposition, since the maximum extinction coefficient, aproperty of the aerosol loading, does not decay appreciably.
5. Extinction‐to‐Backscatter (Sa) RatiosCalculation Based on NAMMA In situMeasurements
[39] To determine profiles of Sa ratios and validate theretrieved values, we perform numerical calculations forSaharan dust based on NAMMA in situ size distributionmeasurements. We use the DC‐8 APS and UHSAS mea-surements (Chen et al., submitted manuscript, 2010) todetermine coarse and fine size distributions and then cal-
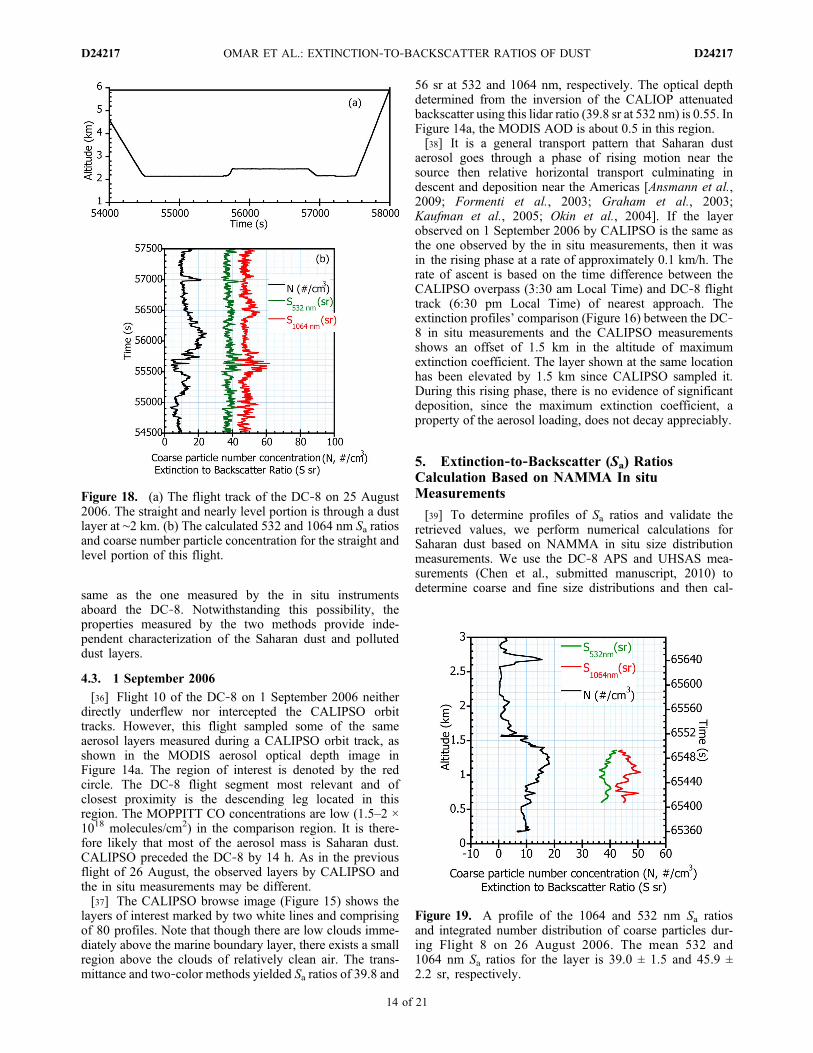
Figure 18. (a) The flight track of the DC‐8 on 25 August2006. The straight and nearly level portion is through a dustlayer at ∼2 km. (b) The calculated 532 and 1064 nm Sa ratiosand coarse number particle concentration for the straight andlevel portion of this flight.
Figure 19. A profile of the 1064 and 532 nm Sa ratiosand integrated number distribution of coarse particles dur-ing Flight 8 on 26 August 2006. The mean 532 and1064 nm Sa ratios for the layer is 39.0 ± 1.5 and 45.9 ±2.2 sr, respectively.
OMAR ET AL.: EXTINCTION‐TO‐BACKSCATTER RATIOS OF DUST D24217D24217
14 of 21

culate coarse and fine mode phase functions, as in Figure 3,using a T‐Matrix scheme. The Sa ratio of the aerosol isderived from an area‐weighted integral of the two modes.Figure 17 is a plot of the profile of Sa ratios of the 2 km dustlayer encountered by NAMMA Flight 4 on 19 August 2006.Figure 17 shows a profile of the coarse number concentra-tion, which marks the bottom and top of the layer at 2.5 and4.6 km, respectively. This is very similar to the coincidentCALIPSO extinction profile shown in Figure 8. The 532and 1064 nm Sa ratios calculated by this method are 34.3 ±2.0 and 50.2 ± 5.7 sr, respectively. These are in goodagreement with Sa ratios of 38–41 sr at 532 nm indepen-dently determined from CALIPSO measurements using thetransmittance technique (Figure 10) on the same day, albeitfurther downfield. The values are also in good agreementwith 45.8–54.2 sr at 1064 nm found using the two‐colormethod shown in Figure 10.[40] Part of the flight on 25 August 2006 was dedicated to
an intercomparison of the in situ measurements on theNASA DC‐8 and the British BAe146. The DC‐8 made anearly straight and level flight through a dust cloud near2 km. Figures 18a and 18b show the DC‐8 altitudinalflight tracks and the calculated Sa ratios (and the coarsenumber concentration) for this flight, respectively. Thedust layer is quite tenuous with maximum coarse numberconcentrations ∼20 cm−3. Scattering coefficients variedfrom 50 to 75 Mm−1 on intercomparison legs near 19°Nlatitude. The condensation nuclei (CN) concentration in thedust layers on this flight was fairly low, around 300 cm−3,while CO mixing ratio was 85 parts per billion by volume(ppbv) and the relative humidity was ∼50%–60%. Both the
CN and CO concentrations infer the predominance of dust inthe aerosol layer. The profiles of the 532 and 1064 nm Saratios shown in Figure 18 for this dust layer are quite con-sistent with means of 38.0 ± 2.5 and 48.7 ± 3.2 sr, respec-tively. The small standard deviations in both Sa ratiosindicate that the layer remains very uniform with respect tocomposition, size distribution, and shape.[41] Size distribution measurements were made during the
NAMMA DC‐8 Flight 8 on 26 August 2006 of a low‐density dust layer between 0.6 and 1.6 km during thedescent phase of the flight. This phase includes one stairstep with the straight and level segment near 1.6 km. Pro-files of Sa ratios calculated from these measurements areshown in Figure 19. The calculated values are 39.0 ± 1.5and 45.9 ± 2.2 sr at 532 and 1064 nm, respectively.[42] This layer is optically thinner than the dust layer
encountered on 19 August 2006. Nevertheless, the Sa ratiosdetermined by T‐Matrix calculation for this layer and thedirect measurement for the denser layer on 19 August 2006(40.1 and 50.9 sr at 532 and 1064 nm, respectively) are quiteclose. The calculated Sa ratio at 532 nm is also consistentwith the value (38.2 sr) retrieved from the CALIPSO mea-surements on the same day.[43] During the return flight on 26 August 2006, the DC‐
8 performed a stair‐step descent flight consisting of twolevel sections and two descent sections. The first straightand level section (Leg 1 in Figure 20a.) was flown at analtitude of ∼2.25 km in a dense dust plume with coarsenumber concentrations near 35 particles cm−3. The mean Saratios are 42.4 ± 1.3 and 53.3 ± 2.0 sr at 532 and 1064 nm,respectively. The plume is fairly consistent as shown by the
Figure 20. (a) Flight path and Sa ratios and the particle number concentration for the return flight on 26August 2006. The figures are plotted by temporal profiles for the straight and level legs and vertical pro-files for descent legs: (b) temporal profile of straight and level leg 1, (c) vertical profiles of descent legs 2and 4, and (d) temporal profile of straight and level leg 3.
OMAR ET AL.: EXTINCTION‐TO‐BACKSCATTER RATIOS OF DUST D24217D24217
15 of 21

small standard deviations in the Sa ratios at both wave-lengths. Figure 20b are profile plots of the two descent legs(legs 2 and 4 shown in Figure 20a the flight path). The breakin ordinate demarcates the straight and level section (leg 3)of the flight. The 532 and 1064 nm Sa ratios for leg 2 are46.6 ± 1.3 and 52.6 ± 1.7 sr, respectively. In leg 4, theaircraft has begun its descent into the marine boundarylayer, and there is a sharp decline in the coarse numberconcentration. The Sa ratio at 532 nm has also droppedconsiderably signifying a change in the aerosol composition.The calculated Sa ratios for leg 4 are 32.8 ± 1.5 and 51.4 ±10.8 sr at 532 and 1064 nm, respectively. Note that for leg 4,the 532 nm Sa ratios are fairly consistent while the 1064 nm
values are quite noisy and decrease at lower altitudes. From1.84 to 1.52 km, the decreasing trend in lidar ratios at 1064nm with altitude corresponds to a decrease in the aerosolcoarse mode number concentration. Since the aerosol coarsemode has a disproportionate impact on the 1064 nm Sa andthe coarse mode number concentrations below 1.52 km areso low (<2/cm3), the calculated 1064 nm Sa is quite noisycompared to the 532 nm values.[44] Figure 21 shows the flight path for the in situ
measurements on 20 August 2006. The time is in secondsafter midnight UTC. Figure 21b shows a profile plot of the532 and 1064 nm Sa ratios observed during the descentphase through a dust layer extending from an altitude of1.6–4.8 km. The 532 and 1064 nm Sa ratios for this dustlayer are 40.8 ± 3.2 and 51.6 ± 3.8 sr, respectively. Figure21c shows the profiles of the 532 and 1064 nm Sa ratiosobserved during the ascent phase through the dust layer.The 532 and 1064 nm Sa ratios for this dust layer are 42.8 ±3.0 and 51.8 ± 3.4 sr, respectively. The similarity of thevertical extent and the Sa ratios at each wavelength suggeststhat the same dust layer was sampled during both the ascentand descent legs of the flight. As noted before, these layershave spatially and temporally uniform Sa ratios and perhaps,by inference, fairly constant compositions and are geomet-rically quite stable.[45] Figure 22 is a histogram of all the 532 and 1064 nm
Sa ratios (∼1100 points) determined using the size distribu-tions measured during NAMMA for this study. There isvery little overlap of the two nearly normally distributed Saratios. The 532 and 1064 nm mean Sa ratios (±1 standarddeviation) are 39.1 ± 3.5 and 50.0 ± 4.0 sr, respectively. The532 nm values ranged from 30 to 53 sr and the 1064 nmvalues ranged from 32 to 66 sr, in both cases within theestimated ranges of 10–110 sr for all aerosol types[Ackermann, 1998; Anderson et al., 2000; Barnaba andGobbi, 2004]. Figure 23 is a plot of the frequency dis-tribution of the ratio of Sa ratios, i.e., Sa (1064 nm)/Sa(532 nm), a parameter used in the lidar ratio determina-tion scheme outlined by Cattrall et al. [2005]. The plotshows that for the Sahara dust sampled during NAMMA
Figure 21. The (a) flight path of the DC‐8 and Sa ratiosand the particle number concentrations for the (b) descentleg and (c) the ascent leg of the flight of 20 August 2006.
Figure 22. An ensemble of all the Sa ratio estimates(∼1100 records) based on the NAMMA in situ size distribu-tions of dust layers and T‐Matrix calculations. The averageSa ratios are 39.1 ± 3.5 and 50.0 ± 4 sr at 532 and 1064 nm,respectively.
OMAR ET AL.: EXTINCTION‐TO‐BACKSCATTER RATIOS OF DUST D24217D24217
16 of 21

there is very little spread in the ratio of Sa values. Themean 1064 nm Sa ratio is about 30% larger than the mean532 nm value for this Saharan dust with a standarddeviation of 10%, i.e., Sa (1064 nm)/Sa (532 nm) = 1.3 ± 0.13.Since the Sa ratio is an intensive property of the aerosol, itsratio is also an intensive property. The small spread in theratios of Sa denotes that the Saharan dust aerosol observedduring this period is quite consistent at least in its size dis-tributions. To explore the effects of varying composition(refractive indices) and shape (aspect ratios) on the T‐Matrixcalculations, both of which were not directly measured forthis study, we use the uncertainty analysis described insection 6.[46] Table 2 summarizes the Sa ratios obtained for
Saharan dust aerosols during NAMMA using the threemethods. The 532 nm values are fairly consistent, whilethere is a somewhat wider spread in the 1064 nm va-lues. This is particularly interesting because these mea-
surements were made on various days and at variouslocations.
6. Uncertainty Analysis of the Modeled Sa Ratios
[47] In this section, we attempt to propagate the uncer-tainty in the input variables to the calculated Sa ratio anddetermine the overall uncertainty in the calculated dust 532and 1064 nm Sa ratios using a generalized analyticaluncertainty equation. The uncertainty equation is given bythe Taylor series of the deviations (y–yo) of the output (y)from its nominal value (yo) and is expressed in terms of thedeviations of the i inputs (x–xi
o) from their nominal values.As in the work of Morgan and Henrion [1990], for the firstthree terms, the uncertainty is
y� y0 ¼XNi¼0
xi � x0i� � @y
@xi
�����X 0
þ I
1
2
XNi¼1
XNj¼1
xi � x0i� �
xj � x0j
� � @2y
@xi@xj
�����X 0
þ II
1
3!
XNi¼1
XNj¼1
XNk¼1
xi � xoi� �
xj � xoj
� �xk � xok� � @3y
@xi@xj@xk
�����X 0
þ � � � III
ð5Þ[48] The subscripts Xo denote derivatives evaluated at
the nominal values. Assuming that there are no covar-Table 2. Summary of Sa Ratio Measurements and Calculations
Sa (532 nm) sr Sa (1064 nm) sr
Constrained Method19 Aug 2006 35.7 NATransmittance + Two‐Color Methods19 Aug 2006 38.9 53.519 Aug 2006 41.4 50.919 Aug 2006 38.1 54.219 Aug 2006 41.0 45.819 Aug 2006 41.0 50.226 Aug 2006 38.2 NA1 Sep 2006 39.8 56.0Mean 39.8 ± 1.4 51.8 ± 3.6T‐Matrix Using NAMMA Size Distribution Measurements19 Aug 2006 34.3 ± 2.0 50.2 ± 5.725 Aug 2006 38.0 ± 2.5 48.7 ± 3.226 Aug 2006 39.0 ± 1.5 45.9 ± 2.226 Aug 2006 42.4 ± 1.3 53.3 ± 2.026 Aug 2006 46.6 ± 1.3 52.6 ± 1.726 Aug 2006 32.8 ± 1.5 51.4 ± 10.820 Aug 2006 40.8 ± 3.2 51.8 ± 3.420 Aug 2006 42.8 ± 3.0 51.8 ± 3.4Mean 39.1 ± 3.5 50.0 ± 4.0Noise Laden T‐Matrix SimulationMean 39.4 ± 5.9 56.5 ± 16.5
Table 3. Ranges of the Variables Used to Generate 500 RandomCombinations of Inputs for T‐Matrix Calculationsa
Parameter Minimum Maximum
Geometric Fine Radius 0.0216 0.194Geometric Coarse Radius 0.188 1.69Fine GSD 1.60 1.80Coarse GSD 1.50 1.70Real Refractive Index 1.45 1.55Imaginary Refractive Index 0.00067 0.006Aspect Ratio 1.70 2.30
aThe central values of the size distributions are based on the mean valuesof the dust layer observed on 19 August 2006 during the NAMMAcampaign.
Figure 24. The distribution of the Sa ratio calculated from aLatin Hypercube Sampling (LHS) of 500 events bounded bythe ranges shown in Table 3. The normal means (±1 stan-dard deviation) of the 532 and 1064 nm Sa ratios are 39.4 ±5.9 and 56.5 ± 16.5 sr, respectively.
Figure 23. The ratio of the Sa ratios [Sa (1064 nm)/Sa(532 nm)] derived from the size distribution data used forthis study.
OMAR ET AL.: EXTINCTION‐TO‐BACKSCATTER RATIOS OF DUST D24217D24217
17 of 21

iances between the input variables, all the mixed deriva-tives in equation (5) would equal zero. The only termsthat would not be zero are the first term and the termswith i = j and i = j = k in summations II and III, i.e.,second and third derivatives of the variables, respectively.Since the covariances are not known, we cannot make theassumption that they are negligible. Given the un-certainties in the variables from which the Sa ratio iscalculated, the uncertainty in Sa can be estimated withoutmaking any assumptions about covariances between inputs.To accomplish this, we use Latin Hypercube Sampling(LHS) [Iman and Conover, 1980], a statistical samplingmethod in which a distribution of plausible scenarios ofparameter values is generated from a multidimensional dis-tribution. Unlike classical Monte Carlo sampling methods,LHS precludes duplication by requiring that each square gridcontaining sample positions has only one sample in each rowand each column. For this study, we generate 500 variables
for each of the seven uncertain parameters used in the cal-culation of Sa. We then randomly combine these variables toyield 500 instances or events. Each of these events has a veryhigh probability of yielding a unique Sa ratio. We then per-form standard descriptive statistics on the Sa values.[49] The mean and standard deviations of these values is
an estimate of the nominal value and uncertainty of dust Sa.We use the nominal (or central) values in Table 3, suggestedby the studies referenced in section 2, to generate the ran-dom scenarios. The fine mode radii, coarse mode radii, andimaginary refractive indices are log normally distributed.The fine and coarse geometric standard deviations (GSD),the real refractive indices, and the aspect ratios are normallydistributed.[50] The results obtained by using this method do not
assume that the input variables are independent of eachother or that Sa ratio is linear in the individual input vari-ables, i.e., the second‐ and higher‐order derivatives in
Figure 25. Two‐dimensional frequency plots showing the variation of the 532 and 1064 nm lidar ratioswith (a, b) imaginary and (c, d) real parts of the complex refractive indices for 500 randomly generatedevents discussed in section 6.
OMAR ET AL.: EXTINCTION‐TO‐BACKSCATTER RATIOS OF DUST D24217D24217
18 of 21

equation (5) are not necessarily equal to zero. The statisticsof the resulting Sa ratios provide an uncertainty envelop ofthe Sa ratio estimates based on the uncertainty of the inputs.Moreover, the results can be used to explore the sensitivityof the Sa ratios at each wavelength to the various aerosolproperties. In Figure 24, the 532 nm Sa ratios are wellconstrained with a standard deviation of 15% of the meanafter perturbing nominal input values shown in Table 3 andsimilar to the distribution shown in Figure 22. The 1064 nmSa ratios are much more sensitive to the addition of noise asshown by the wide spread of 1064 nm Sa ratios in Figure 24.A parameter that has a significant impact on the Sa ratios isthe complex refractive index. Figure 25 is a 2‐D histogramof the 532 and 1064 nm Sa ratios as functions of the real andimaginary parts of the refractive indices. The range of thesevalues is from 0.00067 to 0.006 for the imaginary part and1.45–1.55 for the real part. The 1064 nm Sa ratios are sen-sitive to changes in the refractive index throughout theranges of these variables. The 532 nm Sa ratio is sensitive tochanges in the complex refractive index at the lower ranges(Figures 25a and 25c). The highest density of 532 nm Saratios are found in midranges of both the real and imaginarypart, and these values are insensitive to changes in thecomplex refractive index. Note that this variation is a totalderivative, i.e., all parameters are allowed to vary indepen-dently for the scenarios. The 1064 nm Sa ratios decreasewith the complex index of refraction almost monotonicallythrough the range of values (Figures 25b and 25d). Savariations with the complex refractive indices at the twowavelengths reflect the sensitivity of these values to thesize distributions used in this study. Note that for theseuncertainty analyses we used the size distributions of thedust layer observed on 19 August 2006. Since these aredominated by the coarse mode, any changes in the phy-sico‐chemical properties show a greater impact on the1064 nm Sa than the 532 nm Sa.
7. Conclusion
[51] We have determined the Sa ratios of Saharan dustlayers using three methods: transmittance constraint tech-nique for lofted layers, in situ extinction profile constraintmethod, and T‐Matrix calculations. We found quite robustSa ratios at 532 nm and a slightly wider spread at 1064 nm.The three methods yielded 532 and 1064 nm Sa ratios thatare quite close. Sa ratios of 39.8 ± 1.4 and 51.8 ± 3.6 sr at532 and 1064 nm, respectively, were found using thetransmittance and two‐color methods applied to CALIPSOmeasurements of Saharan dust lofted layers. T‐Matrix cal-culations applied to size distributions measured aboard theNASA DC‐8 during NAMMA yielded Sa ratios of 39.1 ±3.5 and 50.0 ± 4 sr at 532 and 1064 nm, respectively. Themeasured extinction profile obtained by the aggregate ofnephelometer measurements of total scattering coefficientand the PSAP measurements of the absorption coefficientwas used to constrain the inversion of the CALIPSO mea-surements. This technique yielded a 532 nm Sa ratio of 35.7sr for a dust layer and 25 sr for the aerosol in the marineboundary layer. We perturbed seven microphysical andchemical properties of the dust aerosol and computed the Saratios by randomly combining distributions of these para-meters to assess the uncertainty in the Sa calculation. This
uncertainty simulation generated a mean (±uncertainty) Sa of39.4 (±5.9) and 56.5 (±16.5) sr at 532 and 1064 nm,respectively, corresponding to percentage uncertainties of15% and 29%. The ratio of the Sa ratios, Sa (1064 nm)/Sa(532 nm) = 1.3 ± 0.13, and is nearly normally distributed.The simulation revealed that Sa is insensitive to the middlerange of refractive indices at 532 nm and nearly monoton-ically dependent on the refractive indices at 1064 nm. Thisexplains the observed robust Sa ratios at 532 nm and rela-tively wide spread of Sa at 1064 nm.[52] This study examined a wide range of dust loadings in
various locations within ∼1250 km of Saharan Desert sourceregions on different days. The Sa ratios do not change sig-nificantly with dust loading, suggesting the dust micro-physical and chemical properties do not vary appreciably.The profile of Sa ratios at 532 nm are very close to 40 srusing different methods and on different days. There is awider variation in the 1064 nm Sa ratios for all methods. It ispossible that the variation of Sa at 1064 nm is driven by ahigher sensitivity to changes in the complex index ofrefraction at the 1064 nm wavelength.
[53] Acknowledgments. We thank the relevant DC‐8 instrument PIsfor the NAMMA data, the MODIS and MOPPITT teams for their data, andthe CALIPSO team for data, guidance, and many useful discussions. Weacknowledge the use of the public‐domain T‐matrix code by MichaelMishchenko and thank Kam Pui Lee, Susan Kooi, and Sharon Burton forthe CALIPSO and LASE images. We gratefully acknowledge funding sup-port from the NASA Radiation Sciences and Atmospheric CompositionPrograms, respectively, managed by Hal Maring and Bruce Doddridge.
ReferencesAckermann, J. (1998), The extinction‐to‐backscatter ratio of troposphericaerosol: A numerical study, J. Atmos. Ocean. Tech., 15, 1043–1050.
Anderson, T. L., and J. A. Ogren (1998), Determining aerosol radiativeproperties using the TSI 3563 integrating nephelometer, Aerosol Sci.Tech., 29(1), 57–69.
Anderson, T. L., S. J. Masonis, D. S. Covert, and R. J. Charlson (2000), Insitu measurements of the aerosol extinction‐to‐backscatter ratio at a pol-luted continental site, J. Geophys. Res., 105(D22), 26,907–26,915,doi:10.1029/2000JD900400.
Ansmann, A., H. Baars, M. Tesche, D. Muller, D. Althausen, R. Engelmann,T. Pauliquevis, and P. Artaxo (2009), Dust and smoke transport fromAfrica to South America: Lidar profiling over Cape Verde and theAmazon rainforest, Geophys. Res. Lett., 36, L11802, doi:10.1029/2009GL037923.
Barnaba, F., and G. P. Gobbi (2004), Modeling the aerosol extinctionversus backscatter relationship for lidar applications: Maritime andcontinental conditions, J. Atmos. Ocean. Tech., 21(3), 428–442.
Berthier, S., P. Chazette, P. Couvert, J. Pelon, F. Dulac, F. Thieuleux, C.Moulin, and T. Pain (2006), Desert dust aerosol columnar properties overocean and continental Africa from Lidar in‐Space Technology Experi-ment (LITE) and Meteosat synergy, J. Geophys. Res., 111, D21202,doi:10.1029/2005JD006999.
Cattrall, C., J. Reagan, K. Thome, and O. Dubovik (2005), Variability ofaerosol and spectral lidar and backscatter and extinction ratios of keyaerosol types derived from selected Aerosol Robotic Network locations,J. Geophys. Res., 110, D10S11, doi:10.1029/2004JD005124.
Chazette, P., J. Sanak, and F. Dulac (2007), New Approach for AerosolProfiling with a Lidar Onboard an Ultralight Aircraft: Application tothe African Monsoon Multidisciplinary Analysis, Environ. Sci. Technol.,41(24), 8335–8341.
Chazette, P., J.‐C. Raut, F. Dulac, S. Berthier, S.‐W. Kim, P. Royer, J.Sanak, S. Loaëc, and H. Grigaut‐Desbrosses (2010), Simultaneous obser-vations of lower tropospheric continental aerosols with a ground‐based,an airborne, and the spaceborne CALIOP lidar systems, J. Geophys.Res., 115, D00431, doi:10.1029/2009JD012341.
d’Almeida, G. A., P. Koepke, and E. P. Shettle (1991), AtmosphericAerosols: Global Climatology and Radiative Characteristics, 561 pp.,A. Deepak, Hampton, Va.
OMAR ET AL.: EXTINCTION‐TO‐BACKSCATTER RATIOS OF DUST D24217D24217
19 of 21

DeMott, P. J., K. Sassen, M. R. Poellot, D. Baumgardner, D. C. Rogers,S. D. Brooks, A. J. Prenni, and S. M. Kreidenweis (2003), African dustaerosols as atmospheric ice nuclei, Geophys. Res. Lett., 30(14), 1732,doi:10.1029/2003GL017410.
Di Iorio, T., A. di Sarra, W. Junkermann, M. Cacciani, G. Fiocco, andD. Fua (2003), Tropospheric aerosols in the Mediterranean: 1. Micro-physical and optical properties, J. Geophys. Res., 108(D10), 4316,doi:10.1029/2002JD002815.
Di Iorio, T., A. di Sarra, D. M. Sferlazzo, M. Cacciani, D. Meloni,F. Monteleone, D. Fua, and G. Fiocco (2009), Seasonal evolution of thetropospheric aerosol vertical profile in the central Mediterranean androle of desert dust, J. Geophys. Res., 114, D02201, doi:10.1029/2008JD010593.
Dubovik, O., B. N. Holben, T. F. Eck, A. Smirnov, Y. J. Kaufman, M. D.King, D. Tanre, and I. Slutsker (2002), Variability of absorption andoptical properties of key aerosol types observed in worldwide locations,J. Atmos. Sci., 59(3), 590–608.
Dunion, J. P., and C. S. Velden (2004), The impact of the Saharan air layeron Atlantic tropical cyclone activity, Bull. Am. Meteorol. Soc., 85(3),353–365.
Eidhammer, T., D. C. Montague, and T. Deshler (2008), Determination ofindex of refraction and size of supermicrometer particles from light scat-tering measurements at two angles, J. Geophys. Res., 113, D16206,doi:10.1029/2007JD009607.
Formenti, P., W. Elbert, W. Maenhaut, J. Haywood, and M. O. Andreae(2003), Chemical composition of mineral dust aerosol during the SaharanDust Experiment (SHADE) airborne campaign in the Cape Verde region,September 2000, J. Geophys. Res., 108(D18), 8576, doi:10.1029/2002JD002648.
Graham, B., et al. (2003), Composition and diurnal variability of the naturalAmazonian aerosol, J. Geophys. Res., 108(D24), 4765, doi:10.1029/2003JD004049.
Haywood, J. M., et al. (2008), Overview of the dust and biomass‐burningexperiment and african monsoon multidisciplinary analysis specialobserving period‐0, J. Geophys. Res., 113, D00C17, doi:10.1029/2008JD010077.
Heintzenberg, J. (2009), The SAMUM‐1 experiment over SouthernMorocco: Overview and introduction, Tellus B, 61(1), 2–11.
Hill, S. C., A. C. Hill, and P. W. Barber (1984), Light‐scattering by sizeshape distributions of soil particles and spheroids, Appl. Opt., 23(7),1025–1031.
Hu, Y., et al. (2009), CALIPSO/CALIOP Cloud phase discrimination algo-rithm, J. Atmos. Ocean. Tech., 26, 2293–2309.
Iman, R. L., and W. J. Conover (1980), Small sample sensitivity analysistechniques for computer‐models, with an application to risk assessment,Commun. Stat. Part A, 9(17), 1749–1842.
Ismail, S., et al. (2010), LASE measurements of water vapor, aerosol, andcloud distributions in Saharan air layers and Tropical disturbances, J.Atmos. Sci., in press.
Israelevich, P. L., E. Ganor, Z. Levin, and J. H. Joseph (2003), Annualvariations of physical properties of desert dust over Israel, J. Geophys.Res., 108(D13), 4381, doi:10.1029/2002JD003163.
Kalashnikova, O. V., and I. N. Sokolik (2002), Importance of shapes andcompositions of wind‐blown dust particles for remote sensing at solarwavelengths, Geophys. Res. Lett. , 29(10), 1398, doi:10.1029/2002GL014947.
Kalashnikova, O. V., and I. N. Sokolik (2004), Modeling the radiativeproperties of nonspherical soil‐derived mineral aerosols, J. Quant. Spec-trosc. Radiat. Transfer, 87(2), 137–166.
Kandler, K., et al. (2009), Size distribution, mass concentration, chemicaland mineralogical composition and derived optical parameters of theboundary layer aerosol at Tinfou, Morocco, during SAMUM 2006,Tellus B, 61(1), 32–50.
Kaufman, Y. J., I. Koren, L. A. Remer, D. Tanre, P. Ginoux, and S. Fan(2005), Dust transport and deposition observed from the Terra‐ModerateResolution Imaging Spectroradiometer (MODIS) spacecraft over theAtlantic Ocean, J. Geophys. Res., 110, D10S12, doi:10.1029/2003JD004436.
Liu, Z., et al. (2008), CALIPSO lidar observations of the optical propertiesof Saharan dust: A case study of long‐range transport, J. Geophys. Res.,113, D07207, doi:10.1029/2007JD008878.
Liu, Z. Y., M. Vaughan, D. Winker, C. Kittaka, B. Getzewich, R. Kuehn,A. Omar, K. Powell, C. Trepte, and C. Hostetler (2009), The CALIPSOlidar cloud and aerosol discrimination: Version 2 algorithm and initialassessment of performance, J. Atmos. Ocean. Tech., 26(7), 1198–1213.
Maring, H., D. L. Savoie, M. A. Izaguirre, L. Custals, and J. S. Reid (2003),Mineral dust aerosol size distribution change during atmospheric trans-port, J. Geophys. Res., 108(D19), 8592, doi:10.1029/2002JD002536.
McNaughton, C. S., et al. (2007), Results from the DC‐8 inlet characteriza-tion experiment (DICE): Airborne versus surface sampling of mineraldust and sea salt aerosols, Aerosol Sci. Tech., 41, 136–159.
Mie, G. (1908), Beigrade zur optik trüber medien, speziell kolloidaler me-tallösungen, Ann. Physik, 25(4), 337–445.
Mishchenko, M. I., A. A. Lacis, B. E. Carlson, and L. D. Travis (1995),Nonsphericity of dust‐like tropospheric aerosols: Implications for aero-sol remote sensing and climate modeling, Geophys. Res. Lett., 22(9),1077–1080, doi:10.1029/95GL00798.
Mishchenko, M. I. (1991), Light‐scattering by randomly oriented axiallysymmetrical particles, J. Opt. Soc. Am., 8(6), 871–882.
Mishchenko, M. I. (1993), Light‐scattering by size shape distributions ofrandomly oriented axially‐symmetrical particles of a size comparableto a wavelength, Appl. Opt., 32(24), 4652–4666.
Mishchenko, M. I., and L. D. Travis (1994), T‐matrix computations oflight‐scattering by large spheroidal particle, Opt. Commun., 109(1–2),16–21.
Mishchenko, M. I., L. D. Travis, and A. Macke (1996a), Scattering of lightby polydisperse, randomly oriented, finite circular cylinders, Appl. Opt.,35(24), 4927–4940.
Mishchenko, M. I., L. D. Travis, and D. W. Mackowski (1996b), T‐matrixcomputations of light scattering by nonspherical particles: A review,J. Quant. Spectrosc. Radiat. Transfer, 55(5), 535–575.
Mishchenko, M. I., and L. D. Travis (1998), Capabilities and limitations ofa current FORTRAN implementation of the T‐matrix method for ran-domly oriented, rotationally symmetric scatterers, J. Quant. Spectrosc.Radiat. Transfer, 60(3), 309–324.
Morgan, M. G., and M. Henrion (1990), Uncertainty: A Guide to DealingWith Uncertainty in Quantitative Risk and Policy Analysis, 2nd ed.,332 pp., Cambridge Univ. Press, Cambridge.
Muller, D., A. Ansmann, I. Mattis, M. Tesche, U. Wandinger, D. Althausen,and G. Pisani (2007), Aerosol‐type‐dependent lidar ratios observed withRaman lidar, J. Geophys. Res., 112, D16202, doi:10.1029/2006JD008292.
Müller, D., F. Wagner, D. Althausen, U. Wandinger, and A. Ansmann(2000), Physical properties of the Indian aerosol plume derived fromsix‐wavelength lidar observations on 25 March 1999 of the Indian OceanExperiment, Geophys. Res. Lett., 27(9), 1403–1406, doi:10.1029/1999GL011217.
Murayama, T., et al. (2003), An intercomparison of lidar‐derived aerosoloptical properties with airborne measurements near Tokyo during ACE‐Asia, J. Geophys. Res., 108(D23), 8651, doi:10.1029/2002JD003259.
Nakajima, T., M. Tanaka, M. Yamano, M. Shiobara, K. Arao, andY. Nakanishi (1989), Aerosol optical characteristics in the yellow sandevents observed in may, 1982 at Nagasaki: 2. Models, J. Meteorol. Soc.Jpn., 67(2), 279–291.
Okada, K., A. Kobayashi, Y. Iwasaka, H. Naruse, T. Tanaka, andO. Nemoto (1987), Features of individual asian dust‐storm particlescollected at Nagoya, Japan, J. Meteorol. Soc. Jpn., 65(3), 515–521.
Okin, G. S., N. Mahowald, O. A. Chadwick, and P. Artaxo (2004), Impactof desert dust on the biogeochemistry of phosphorus in terrestrial ecosys-tems, Global Biogeochem. Cycles , 18 , GB2005, doi:10.1029/2003GB002145.
Omar, A., et al. (2009), The CALIPSO automated aerosol classificationand lidar ratio selection algorithm, J. Atmos. Ocean. Tech., 26(10),1994–2014.
Omar, A. H., S. Biegalski, S. M. Larson, and S. Landsberger (1999),Particulate contributions to light extinction and local forcing at a ruralIllinois site, Atmos. Environ., 33(17), 2637–2646.
Perry, R. J., A. J. Hunt, and D. R. Huffman (1978), Experimental determi-nations of Mueller scattering matrices for nonspherical particles, Appl.Opt., 17(17), 2700–2710.
Petzold, A., et al. (2009), Saharan dust absorption and refractive indexfrom aircraft‐based observations during SAMUM 2006, Tellus B, 61(1),118–130.
Platt, C. M. R. (1973), Lidar and radiometric observations of cirrus clouds,J. Atmos. Sci., 30, 1191–1204.
Prospero, J. M., and T. N. Carlson (1971), Saharan dust in atmosphere ofnorthern equatorial Atlantic Ocean—A major constituent of marine aero-sol, Bull. Am. Meteorol. Soc., 52(11), 1138.
Prospero, J. M., and T. N. Carlson (1972), Vertical and areal distribution ofSaharan dust over western equatorial North Atlantic Ocean, J. Geophys.Res., 77(27), 5255–5265, doi:10.1029/JC077i027p05255.
Raut, J. C., and P. Chazette (2008), Radiative budget in the presence ofmultilayered aerosol structures in the framework of AMMA SOP‐0,Atmos. Chem. Phys., 8(22), 6839–6864.
Rodhe, H. (2009), Special issue: Results of the Saharan Mineral DustExperiment (SAMUM‐1) 2006 Preface, Tellus B, 61(1), 1–1.
OMAR ET AL.: EXTINCTION‐TO‐BACKSCATTER RATIOS OF DUST D24217D24217
20 of 21

Sasano, Y., and E. V. Browell (1989), Light scattering characteristics ofvarious aerosol types derived from multiple wavelength lidar observa-tions, Appl. Opt., 28, 1670–1679.
Savoie, D., and J. M. Prospero (1976), Saharan aerosol transport acrossAtlantic Ocean—Characteristics of input and output, Bull. Am. Meteorol.Soc., 57(1), 145–145.
Schladitz, A., T. Muller, N. Kaaden, A. Massling, K. Kandler, M. Ebert,S. Weinbruch, C. Deutscher, and A. Wiedensohler (2009), In situ mea-surements of optical properties at Tinfou (Morocco) during the SaharanMineral Dust Experiment SAMUM 2006, Tellus B, 61(1), 64–78.
Sokolik, I. N., and O. B. Toon (1996), Direct radiative forcing by anthro-pogenic airborne mineral aerosols, Nature, 381(6584), 681–683.
Tesche, M., et al. (2009), Vertical profiling of Saharan dust with Ramanlidars and airborne HSRL in southern Morocco during SAMUM, TellusB, 61(1), 144–164.
Vaughan, M. A., Z. Liu, and A. H. Omar (2004), Multi‐wavelength anal-ysis of a lofted aerosol layer measured by LITE, paper presented at 22ndInternational Laser Radar Conference, European Space Agency, Matera,Italy, 12–16 July.
Vaughan, M. A., K. A. Powell, R. E. Kuehn, S. A. Young, D. M. Winker,C. A. Hostetler, W. H. Hunt, Z. Y. Liu, M. J. McGill, and B. J. Getzewich(2009), Fully automated detection of cloud and aerosol layers in theCALIPSO lidar measurements, J. Atmos. Ocean. Tech., 26(10),2034–2050.
Virkkula, A., N. C. Ahlquist, D. S. Covert, W. P. Arnott, P. J. Sheridan,P. K. Quinn, and D. J. Coffman (2005), Modification, calibration and afield test of an instrument for measuring light absorption by particles,Aerosol Sci. Tech., 39(1), 68–83.
Volz, F. E. (1973), Infrared optical constants of ammonium sulfate, Saharadust, volcanic pumice, and flyash, Appl. Opt., 12(3), 564–568.
Voss, K. J., E. J. Welton, P. K. Quinn, J. Johnson, A. M. Thompson, andH. R. Gordon (2001), Lidar measurements during Aerosols99, J. Geo-phys. Res., 106(D18), 20,821–20,831, doi:10.1029/2001JD900217.
Waterman, P. C. (1971), Symmetry, unitarity, and geometry in electromag-netic scattering, Phys. Rev. D, 3(4), 825–839.
Winker, D., M. Vaughan, A. Omar, Y. Hu, K. Powell, Z. Liu, W. Hunt, andS. A. Young (2009), Overview of the CALIPSO mission and CALIOPdata processing algorithms, J. Atmos. Ocean. Tech., 26, 2310–2323.
Winker, D. M., W. H. Hunt, and M. J. McGill (2007), Initial performanceassessment of CALIOP, Geophys. Res. Lett., 34, L19803, doi:10.1029/2007GL030135.
Wong, S., and A. E. Dessler (2005), Suppression of deep convection overthe tropical North Atlantic by the Saharan Air Layer, Geophys. Res. Lett.,32, L09808, doi:10.1029/2004GL022295.
Young, S. A. (1995), Analysis of lidar backscatter profiles in optically thinclouds, Appl. Opt., 34(30), 7019–7031.
B. Anderson, G. Chen, Y. Hu, S. Ismail, A. Omar, K. Powell, C. Trepte,M. Vaughan, and D. Winker, NASA Langley Research Center, ScienceDirectorate, MS 475, Hampton, VA 23681, USA. ([email protected])Z. Liu, National Institute of Aerospace, NASA Langley Research Center,
Science Directorate, MS 475, Hampton, VA 23681‐2199, USA.K. Thornhill and E. Winstead, Science Applications International Corp.,
NASA Langley Research Center, MS 483, Hampton, VA 23681, USA.
OMAR ET AL.: EXTINCTION‐TO‐BACKSCATTER RATIOS OF DUST D24217D24217
21 of 21


![15 Sediment Gages - USGS · 0.2707 c,S372 Velccty and backscatter seres C] Depth-averaøed streamwise vebcfy RMS Curr.tive u at depths backscatter Depth-averaged backscatter Contour](https://img.dokumen.tips/doc/110x75/5fd8133cbc6723794903cbd2/15-sediment-gages-usgs-02707-cs372-velccty-and-backscatter-seres-c-depth-averaed.jpg)