Embed Size (px)
Citation preview
National Hospital Cost Data Collection: Private Hospital Report – Round 22
Independent Hospital Pricing Authority
National Hospital Cost Data Collection: Private Hospital Report Round 22 (Financial year 2017-18)
February 2020
1

National Hospital Cost Data Collection: Private Hospital Report – Round 22
National Hospital Cost Data Collection, Private Hospital Report, Round 22 (Financial year 2017-18)
© Independent Hospital Pricing Authority 2020
This publication is available for your use under a Creative Commons BY Attribution 3.0 Australia licence, with the exception of the Independent Hospital Pricing Authority logo, photographs, images, signatures and where otherwise stated. The full licence terms are available from the Creative Commons website.
Use of Independent Hospital Pricing Authority material under a Creative Commons BY Attribution 3.0 Australia licence requires you to attribute the work (but not in any way that suggests that the Independent Hospital Pricing Authority endorses you or your use of the work).
Independent Hospital Pricing Authority material used 'as supplied'.
Provided you have not modified or transformed Independent Hospital Pricing Authority material in any way including, for example, by changing Independent Hospital Pricing Authority text – then the Independent Hospital Pricing Authority prefers the following attribution:
Source: The Independent Hospital Pricing Authority
1
National Hospital Cost Data Collection: Private Hospital Report – Round 22
ContentsTables and figures.........................................................................................................................3
Acronyms/Abbreviations................................................................................................................4
Disclaimer......................................................................................................................................5
1. Executive summary................................................................................................................6
2. Introduction.............................................................................................................................8
3. Scope and methodology.......................................................................................................11
4. Results..................................................................................................................................15
Appendix A: Analysis performed to determine the minimum sample size...................................34
Appendix B: Private sector costing approaches..........................................................................35
Appendix C: Standard error range for the Round 22 private sector NHCDC..............................37
Appendix D: Cost weight tables by AR-DRG Version 9.0...........................................................38
Appendix E: Cost weight tables by AR-DRG Version 8.0............................................................39
Appendix F: Cost weight tables by AR-DRG Version 7.0............................................................40
Appendix G: Cost weight tables by AR-DRG Version 6.0x.........................................................41
Appendix H: Cost bucket matrix..................................................................................................42
2

National Hospital Cost Data Collection: Private Hospital Report – Round 22
Tables and figuresList of TablesTable 1. Summary of private hospital participation........................................................................................6
Table 2. Summary of private hospital participation........................................................................................9
Table 3. Comparison of separations and hospitals, Round 12 (2007-08) to Round 22 (2017-18)...............15
Table 4. Top 20 DRGs ranked by highest cost weight................................................................................18
Table 5. Top 20 DRGs ranked by highest volume of population adjusted separations...............................20
Table 6. Top 20 DRGs ranked by highest cost weighted separations.........................................................22
Table 7. Top 20 DRGs ranked by average length of stay (ALOS)...............................................................24
Table 8. Breakdown of cost by cost-bucket group (Round 22 compared to Round 21)..............................25
Table 9. Top 20 DRGs for operating room/specialist procedure suites cost bucket....................................27
Table 10. Top 20 DRGs for critical care cost bucket...................................................................................29
Table 11. Top 20 DRGs for prostheses cost bucket....................................................................................31
Table 12. Top 20 DRGs for miscellaneous (Misc.) cost bucket...................................................................33
Table 13. Number of DRGs by standard error range..................................................................................37
Table 14. Round 22 (2017-18) national consolidation cost weight tables – V9.0........................................38
Table 15. Round 22 (2017-18) national consolidation cost weight tables – V8.0........................................39
Table 16. Round 22 (2017-18) national consolidation cost weight tables – V7.0........................................40
Table 17. Round 22 (2017-18) national consolidation cost weight tables – V6.0x......................................41
List of FiguresFigure 1. Top 20 DRGs ranked by highest cost weight...............................................................................17
Figure 2. Comparison of top 20 DRGs by highest volume of population adjusted separations...................19
Figure 3. Comparison of top 20 DRGs by highest cost-weighted separations............................................21
Figure 4. Comparison of top 20 DRGs by average length of stay (ALOS)..................................................23
Figure 5. Breakdown of cost by cost-bucket group (Round 22 compared to Round 21).............................25
Figure 6. Cost bucket matrix....................................................................................................................... 42
3

National Hospital Cost Data Collection: Private Hospital Report – Round 22
Acronyms/AbbreviationsAcronym/Abbreviation Description
ABS Australian Bureau of Statistics
AHPCS Australian Hospital Patient Costing Standards
AIHW Australian Institute of Health and Welfare
AR-DRG Australian Refined - Diagnosis Related Group
DRG Diagnosis Related Group
EDW Enterprise Data Warehouse
HCP Hospital Casemix Protocol
ICD-10-AM International statistical classification of diseases and related health problems, Tenth Revision, Australian modification
IHPA Independent Hospital Pricing Authority
NHCDC National hospital cost data collection
OR Operating room (theatres)
PHDB Private Hospital Data Bureau
QA Quality Assurance
SPS Specialist procedure suites
WIP Work in progress
4

National Hospital Cost Data Collection: Private Hospital Report – Round 22
DisclaimerReliance on this reportThis Report has been prepared by PricewaterhouseCoopers Consulting Pty Limited (PwC) at the request of the Independent Hospital Pricing Authority (IHPA). PwC prepared this report solely for IHPA’s use in accordance with and for the purpose set out in the contract between IHPA and PwC. PwC acted exclusively for IHPA and considered no-one else’s interests and accepts no responsibility, duty or liability to anyone other than IHPA in connection with this report, and for the consequences of using or relying on it for a purpose other than that referred to above.
This disclaimer applies to the maximum extent permitted by law and, without limitation, to liability arising in negligence or under statute. Liability is limited by a scheme approved under Professional Standards legislation.
5

National Hospital Cost Data Collection: Private Hospital Report – Round 22
1. Executive summaryThe private sector NHCDC is a voluntary collection that produces a range of hospital cost and activity information by Australian Refined Diagnosis Related Groups (AR-DRG). This report includes the findings from the Round 22 (financial year 2017-18) of the NHCDC for admitted acute care provided by overnight private hospitals.
Changes in Round 22Similar to the Round 21 private sector NHCDC, for Round 22 IHPA facilitated the data collection process, which involved stakeholder engagement, validation, quality assurance and data set consolidation. Consultants (PricewaterhouseCoopers Consulting Pty Limited, PwC) were engaged to undertake the data analysis and reporting.
Round 22 has two notable changes: Hospitals were required to submit their data in compliance with the Australian Hospital
Patient Costing Standards (AHPCS) version 4.0, instead of v3.1 used in Round 21. The number of participating hospital groups increased by one group.
ParticipationThe high level statistics for the Round 22 private sector NHCDC alongside previously reported Rounds (since 2007-08) are provided in Table 1.
In Round 22, the data set includes 112 hospitals and 2,173,847 separations, representing 66 per cent of the total in scope hospital separations. The number of participating hospitals has increased by 7 hospitals or 7 per cent. The number of sample separations has increased by 250,537 or 13 per cent.
Table 1. Summary of private hospital participation
Summary Round 12 2007-08
Round 13 2008-09
Round 16 2011-12
Round 17 2012-13
Round 18 2013-14
Round 20 2015-16
Round 21 2016-17
Round 22 2017-18
Number of hospitals 109 110 105 95 96 91 105 112
Sample Separations 1,607,678 1,648,989 1,775,059 1,650,816 1,697,311 1,781,699 1,923,310 2,173,847
Participation rate* %) 72 71 66 60 60 58 59 66
AR-DRG version 4.2 5.1 6.0x 6.0x 6.0x 8.0 9.0 9.0
*Participation rate refers to the percentage of sample separations compared to the population separations.
Key findingsThe data from the Round 22 private sector NHCDC was analysed to identify the top 20 DRGs by a range of factors. These rankings were compared to the rankings from the Round 21 data. The key findings were as follows:
Overall, there was a high level of consistency between the DRGs appearing in the top 20 in Round 21 and Round 22, apart from the top 20 for average length of stay (ALOS) and the top 20 for the miscellaneous cost bucket.
Highest cost weight: There was 80 per cent consistency in the top 20 DRGs between Round 21 and Round 22. The two highest ranked DRGs, A13A (Ventilation >=336hours, Major Complexity) and A14A (Ventilation >=96hours & <336hours, Major Complexity), were the
6

National Hospital Cost Data Collection: Private Hospital Report – Round 22
same in both Rounds. Three DRGs which were just outside the top 20 in Round 21 have newly entered the top 20 in Round 22.
Highest volume of population-adjusted separations: There was 100 per cent consistency in the top 20 DRGs between Round 21 and Round 22. The ranking was very similar also, with the top five DRGs in the same order in both Rounds.
Highest cost weighted separations: The analysis showed 95 per cent consistency in the top 20 DRGs between Round 21 and Round 22. The top three DRGs were the same in both Rounds, and the single new entry to the top 20 was just outside the top 20 in Round 21.
Highest ALOS: There was 70 per cent consistency between the top 20 DRGs in Round 21 and Round 22. The top two DRGs were the same in both Rounds, A13A (Ventilation >=336hours, Major Complexity) and A14A (Ventilation >=96hours & <336hours, Major Complexity), and noting that these were the top two DRGs by cost weight as well. There were six new DRGs in the top 20 for Round 22, the majority of which were just outside the top 20 in Round 21.
The data was also analysed by cost bucket1, examining operating rooms (OR) and specialist procedure suites (SPS) combined, critical care, prosthesis and miscellaneous. Round 21 and Round 22 were compared in terms of overall costs within each cost bucket, in addition to comparing the top 20 DRGs in each cost bucket between Rounds. The key findings were:
The percentage of overall cost in the OR and SPS cost bucket increased by 0.6 per cent from Round 21 to Round 22.
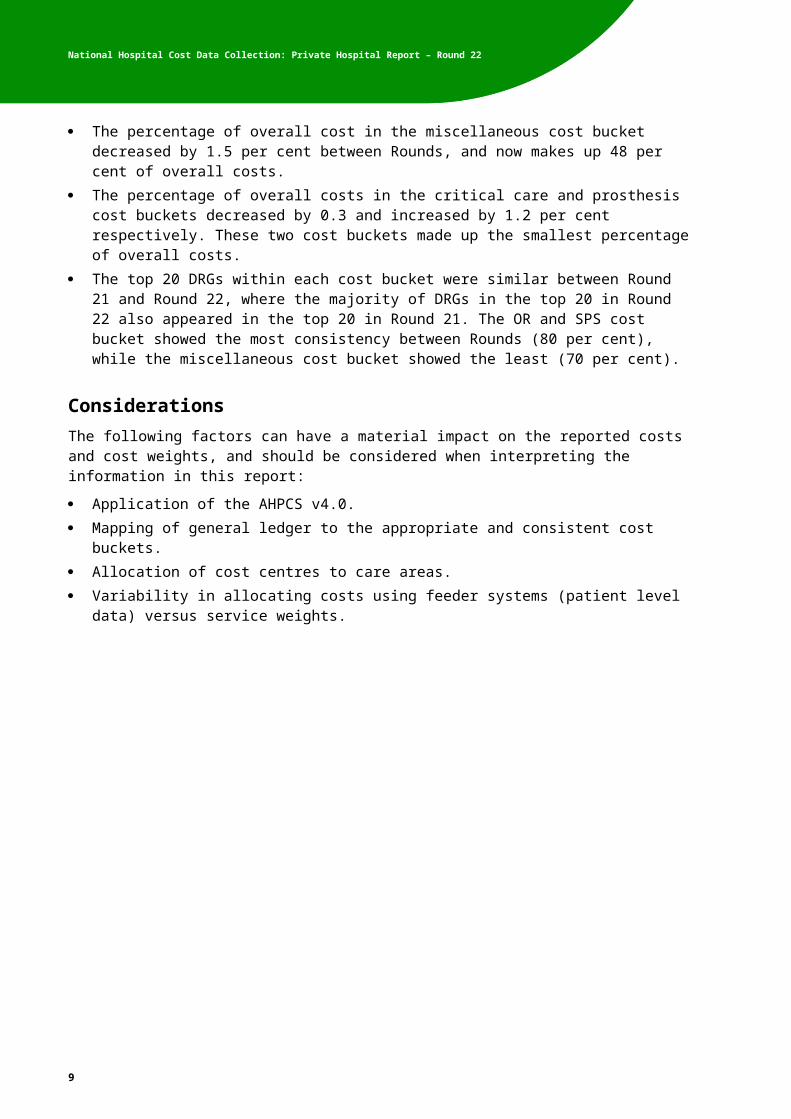
The percentage of overall cost in the miscellaneous cost bucket decreased by 1.5 per cent between Rounds, and now makes up 48 per cent of overall costs.
The percentage of overall costs in the critical care and prosthesis cost buckets decreased by 0.3 and increased by 1.2 per cent respectively. These two cost buckets made up the smallest percentage of overall costs.
The top 20 DRGs within each cost bucket were similar between Round 21 and Round 22, where the majority of DRGs in the top 20 in Round 22 also appeared in the top 20 in Round 21. The OR and SPS cost bucket showed the most consistency between Rounds (80 per cent), while the miscellaneous cost bucket showed the least (70 per cent).
ConsiderationsThe following factors can have a material impact on the reported costs and cost weights, and should be considered when interpreting the information in this report:
Application of the AHPCS v4.0. Mapping of general ledger to the appropriate and consistent cost buckets. Allocation of cost centres to care areas. Variability in allocating costs using feeder systems (patient level data) versus service
weights.
1 Cost buckets represent different combinations of the NHCDC line items, discussed further in Section 3.
7

National Hospital Cost Data Collection: Private Hospital Report – Round 22
2. IntroductionPurpose of this reportThe purpose of this report is to provide an overview of costs reported to the Round 22 private sector NHCDC. The Round 22 private sector NHCDC is a voluntary collection that produces a range of hospital cost and activity information.
The information is grouped by AR-DRG, which is a patient classification scheme that provides a means of relating the number and types of patients treated in a hospital to the resources required by the hospital, as represented by a code2. The AR-DRG is derived from a range of data collected on admitted patients, including diagnosis and procedure information, classified using ICD-10-AM 3.
This report documents the data, processes, methodology and results for admitted acute care provided by overnight private hospitals. The results of the collection are expressed as national cost weights by AR-DRG version 9.0. Cost weight tables are provided in AR-DRG versions 9.0, 8.0, 7.0 and 6.0x in the Appendices.
Format of this reportThis report includes AR-DRG aggregated data, cost weights and other cost relativities. The AR-DRG information is displayed for the top 20 AR-DRGs ranked as follows:
Highest volume of population-adjusted separations Highest cost weighted separations Highest Average Length of Stay (ALOS) Highest cost weight Highest cost weight by every reported cost bucket.
For definitions of the cost buckets please refer to the ‘Read Me’ tab attached to Appendices D-G.
History of the private sector NHCDCRound 1 of the private sector NHCDC was conducted in 1996-97 with 23 hospitals and 240,000 episodes being represented. Since then, the collection has grown steadily, although no publication was released for Rounds 8, 9, or 14 due to low participation rates. No collection was carried out for Rounds 10 and 15 as the sector elected to bypass that year and move directly to the following Round. Round 19 was bypassed due to the expectation that achieving a sufficient participation rate would not be met due to competing priorities of participants. Table 2 below shows the participation rate for Round 22 and the last seven published Rounds.
Table 2. Summary of private hospital participation
2 Department of Health, A Users Guide for the Collection of HCP and PHDB (Version 1.2- May 2010 - page 38, Government Health Website: http://www.health.gov.au/internet/main/publishing.nsf/Content/38E5E5E23C0D4336CA257BF0001E8AC3/$File/Data%20Definitions%20Manual.pdf, dated viewed 21 January 20193 Department of Health, A Users Guide for the Collection of HCP and PHDB (Version 1.2- May 2010 - page 38, Government Health Website: http://www.health.gov.au/internet/main/publishing.nsf/Content/38E5E5E23C0D4336CA257BF0001E8AC3/$File/Data%20Definitions%20Manual.pdf, dated viewed 21 January 2019
8
National Hospital Cost Data Collection: Private Hospital Report – Round 22
Summary Round 12 2007-08
Round 13 2008-09
Round 16 2011-12
Round 17 2012-13
Round 18 2013-14
Round 20 2015-16
Round 21 2016-17
Round 22 2017-18
Number of hospitals 109 110 105 95 96 91 105 112
Sample Separations 1,607,678 1,648,989 1,775,059 1,650,816 1,697,311 1,781,699 1,923,310 2,173,847
Participation rate* % 72 71 66 60 60 58 59 66
AR-DRG version 4.2 5.1 6.0x 6.0x 6.0x 8.0 9.0 9.0
* Participation rate refers to the percentage of sample separations compared to the population separations.
Private hospital statistics for Round 22 (2017-18)583 private hospitals reported to the Private Hospital Data Bureau (PHDB) in 2017-184, a net increase of 21 from 2016-17. These hospitals submitted 4.5 million patient separations in 2017-18, with 21 per cent of these separations reported by day facilities. 3.2 million of these separations, or 72 per cent, were same-day separations. Additionally, 4.1 million of patient separations, or 90 per cent, were classified as acute care or newborn care. Total patient separation submitted to the PHDB increased by 1.5 per cent from 2016-17 to 2017-18.
These separations amounted to 9.9 million patient days of care in 2017-18, or an average length of stay of 2.2 days. Of these, acute care and newborn care patients accounted for 8.3 million patient days, or 84 per cent.
Changes in Round 22In Round 21, participants submitted data in compliance with the Australian Hospital Patient Costing Standards (AHPCS) Version 3.1. Round 22 was the first year that the AHPCS v4.0 was applied and the participants were required to submit data in accordance with these standards.
Public and private sector differencesThis report does not compare the average cost per separation between the public and private sectors, as the scope of costs between the two sectors is different. Many of the cost items present in the public sector such as medical specialist costs, including pathology and imaging are not equally represented in Private Hospital general ledgers. These costs are generally not reported for the private sector because the majority of hospitals do not provide these services directly and patients pay for these services separately.
Confidentiality of dataDue to the commercial nature of the sector, all participating hospitals in Round 22 are requested to sign a confidentiality agreement before any final reports are released.
In this report, where a cost weight reported for a Diagnosis Related Group (DRG) is based on less than five separations, the figures for this cost weight have been replaced by asterisks (*****). If the number of contributing hospitals for a particular DRG is less than three, the figures for this cost weight have been replaced by dashes (-----).
4 Department of Health, Private Hospital Data Bureau (PHDB) Annual Reports, http://www1.health.gov.au/internet/main/publishing.nsf/Content/health-casemix-data-collections-publications-PHDBAnnualReports, data viewed 12th December 2019
9

National Hospital Cost Data Collection: Private Hospital Report – Round 22
Considerations when interpreting the information in this reportThe following factors can have a material impact on the reported costs and cost weights and should be considered, in addition to the changes in Round 22:
Application of the AHPCS v4.0 Mapping of general ledger to the appropriate and consistent cost buckets Allocation of cost centres to care areas The variability in allocating costs using feeder systems (patient level data) by participants
verses service weights.
10

National Hospital Cost Data Collection: Private Hospital Report – Round 22
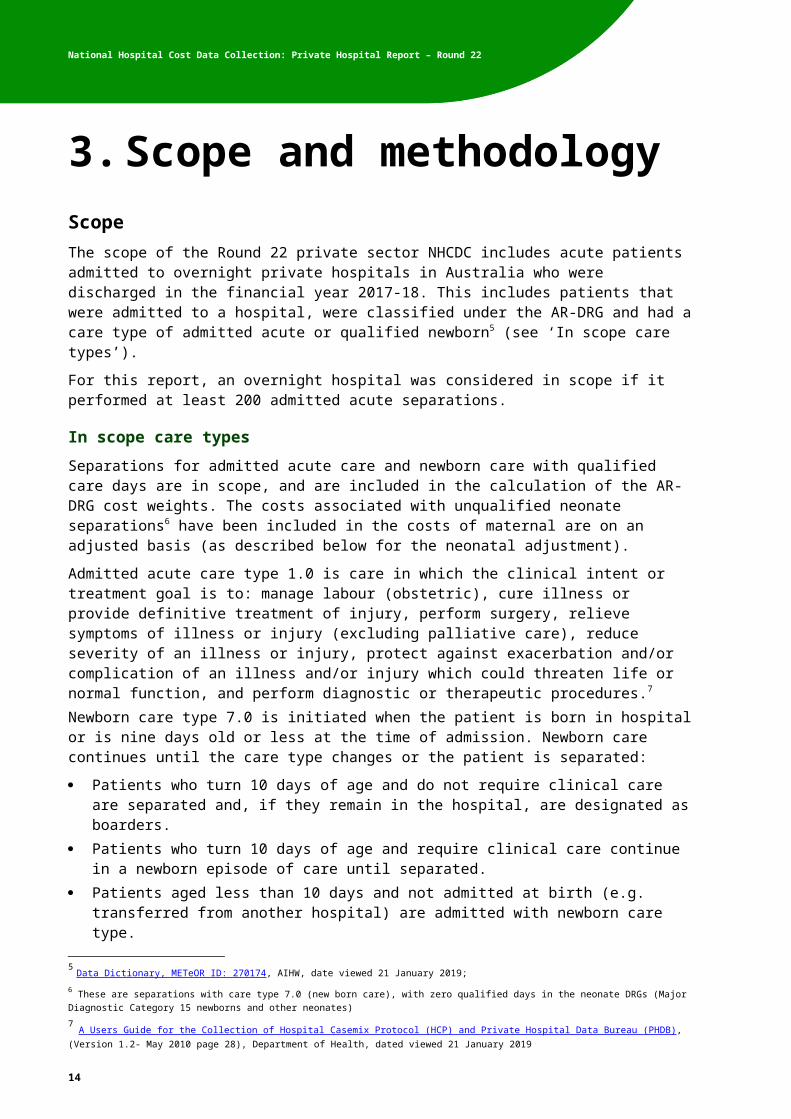
3. Scope and methodologyScopeThe scope of the Round 22 private sector NHCDC includes acute patients admitted to overnight private hospitals in Australia who were discharged in the financial year 2017-18. This includes patients that were admitted to a hospital, were classified under the AR-DRG and had a care type of admitted acute or qualified newborn5 (see ‘In scope care types’).
For this report, an overnight hospital was considered in scope if it performed at least 200 admitted acute separations.
In scope care typesSeparations for admitted acute care and newborn care with qualified care days are in scope, and are included in the calculation of the AR-DRG cost weights. The costs associated with unqualified neonate separations6 have been included in the costs of maternal are on an adjusted basis (as described below for the neonatal adjustment).
Admitted acute care type 1.0 is care in which the clinical intent or treatment goal is to: manage labour (obstetric), cure illness or provide definitive treatment of injury, perform surgery, relieve symptoms of illness or injury (excluding palliative care), reduce severity of an illness or injury, protect against exacerbation and/or complication of an illness and/or injury which could threaten life or normal function, and perform diagnostic or therapeutic procedures.7
Newborn care type 7.0 is initiated when the patient is born in hospital or is nine days old or less at the time of admission. Newborn care continues until the care type changes or the patient is separated:
Patients who turn 10 days of age and do not require clinical care are separated and, if they remain in the hospital, are designated as boarders.
Patients who turn 10 days of age and require clinical care continue in a newborn episode of care until separated.
Patients aged less than 10 days and not admitted at birth (e.g. transferred from another hospital) are admitted with newborn care type.
Patients aged greater than 9 days not previously admitted (e.g. transferred from another hospital) are either boarders or admitted with an acute care type.
Within a newborn episode of care, until the baby turns 10 days of age, each day is either a qualified or unqualified day.
A newborn is qualified when it meets at least one of the criteria detailed in Newborn qualification status.
Within a newborn episode of care, each day after the baby turns 10 days of age is counted as a qualified patient day. Newborn qualified days are equivalent to acute days and may be denoted as such.8
5 Data Dictionary, METeOR ID: 270174, AIHW, date viewed 21 January 2019;6 These are separations with care type 7.0 (new born care), with zero qualified days in the neonate DRGs (Major Diagnostic Category 15 newborns and other neonates)7 A Users Guide for the Collection of Hospital Casemix Protocol (HCP) and Private Hospital Data Bureau (PHDB), (Version 1.2- May 2010 page 28), Department of Health, dated viewed 21 January 20198 A Users Guide for the Collection of Hospital Casemix Protocol (HCP) and Private Hospital Data Bureau (PHDB), (Version 1.2- May 2010 page 30-31), Department of Health, dated viewed 21 January 2019
11

National Hospital Cost Data Collection: Private Hospital Report – Round 22
Reporting requirementsThe Australian Hospital Patient Costing Standards Version 4.09 (AHPCS) guide the hospitals with costing processes for their NHCDC submissions to ensure a consistent treatment of costs between hospitals nationally. Version 4.0 of the AHPCS was released in February 2018 and applied for the first time in Round 22 of the NHCDC.
The AHPCS prescribe the set of line items and cost centres used for mapping hospital costs in the costing process. These costs are then allocated to, and reported under, the NHCDC-defined ‘cost buckets’ (see Appendix H: Cost bucket matrix). Cost buckets represent different combinations of the NHCDC line items and cost centres and can be considered as cost pools within the hospital.
Work in Progress PatientsA work in progress (WIP) patient is a patient that is not admitted and discharged within the reporting period for Round 22. Patients who have not been discharged in 2017-18 are out of scope.
In Round 22, all WIP patients were admitted in 2016-17 and discharged in the 2017-18. These records are in scope and they have been included in the results.
MethodologyThere are eight stages of the private sector NHCDC which are outlined below.
Stage 1: Stakeholder engagement
IHPA sought costed data directly from private hospitals for the private sector NHCDC. Participants were requested to provide a methodology that outlined their costing processes, and all participants demonstrated that they have appropriate costing methodologies.
Stage 2: Data collection
At the commencement of the data collection phase, a Data Request Specification (DRS) was prepared and distributed to all participants. Participants performed their own data collection.
Stage 3: Data preparation
Participants performed their own QA checks on their data to verify that it was appropriate to use in their costing process.
Stage 4: Costing
The costing phase involved participants performing episode-level costing using costing software. Programs used by hospitals in Round 22 include but are not limited to CostPro plus, PPM and C++.
Stage 5: Data submission
IHPA required that the participating hospital groups submit data in accordance with the Round 22 private sector Data Request Specifications (DRS), along with a data quality checklist, which provided IHPA with details on the hospital costing process. The various costing methodologies used by private sector hospitals are outlined in Appendix B: Private sector costing approaches.
Participants were informed of the timeframes for the costed data collection and provided access to the National Health Reform enterprise data warehouse (EDW) drop box to upload and submit their data. The participating hospitals were provided a data transfer guide to help navigate through the process and to communicate processing timeframes.
9 https://www.ihpa.gov.au/publications/australian-hospital-patient-costing-standards-version-40
12

National Hospital Cost Data Collection: Private Hospital Report – Round 22
Stage 6: Data validation and quality assurance
Participants were required to submit their costed data as csv files which passed data checks documented in the DRS. IHPA only accepted data with zero critical errors and which represented at least 90 per cent of the submitted hospital establishment’s total in scope activity.
Where the costed data did not meet the DRS requirements, participants were asked to review the files and make the necessary changes and then re-submit the data.
Once the data was validated, IHPA reviewed the data and produced Quality Assurance (QA) reports which helped participants to confirm the accuracy and appropriateness of the data submission. These included checks in areas with potential to have a material impact on results, such as zero or negative cost buckets, extreme high or low cost separations, and DRG flipping10. If the QA reports identified uncharacteristic traits, the participant was asked to investigate and either adjust the data or justify the deviation. Once all uncharacteristic traits were justified, the participant confirmed their data was final.
On finalisation of the valid costed data submission, IHPA required participants to submit a data quality statement. The data quality statements informed IHPA of the key matters that may impact each participant’s data submission and provided assurance that the data was fit for purpose. IHPA then consolidated the data submission into a national costed data set.
Stage 7: Data analysis (including adjustments)
PwC checked the national cost data set supplied by IHPA to ensure that the separations were in scope. PHDB was also used to estimate the number of in scope private hospitals and the number of in scope separations Australia-wide in 2017-18.
The data was also examined by hospital group and compared against PHDB, in order to ensure that no hospital group was over represented in the data set (compared to the Australian population) in a way that would potentially bias the analysis. It was determined that the level of representation of each group was appropriate, and no adjustments were required. An overall participation rate was calculated relative to the Australian population, and this was flagged to participating hospital groups to ensure they were satisfied with the level of participation in the Round. The separations in the submitted data were then scaled up using estimated weights to be reflective of the Australian population.
PwC reviewed the data set for DRG flipping. In Round 22, there were a small number of instances of DRG flipping identified. After consultation with IHPA, it was agreed that the impact of these DRGs was not material and that no adjustments needed to be made.
Based on the adjustments described above the cost weight tables were produced, checked for reasonableness and compared to the Round 21 results.
Stage 8: Reporting
PwC produced the private hospital report, which outlines the results of the Round 22 private sector NHCDC and draws on the data analysis to provide an interpretation of the results.
10 DRG flipping occurs when the average cost of a lower complexity DRG within the related adjacent DRG is higher than the one with more complexity.
13
National Hospital Cost Data Collection: Private Hospital Report – Round 22
Data adjustmentsThe following adjustments were applied to the dataset during the NHCDC process.
Neonate adjustmentThe costs for newborn infants with zero qualified days, in respect of care type 7 (newborn care) were allocated to the delivery AR-DRGs of mothers at the same hospital.
The definition of unqualified days in the National Health Data Dictionary11, relates to the first nine days of a newborn’s life, unless the newborn is a second or subsequent live born infant or it requires intensive care. The adjustment for unqualified days for Round 22 was conducted in a similar way to that in Round 21.
Market share adjustment processThe market share was determined for each hospital group, to ensure appropriate representation. This was done by calculating the share of the PHDB separations that belonged to the relevant group, against those of the hospital groups that submitted to the NHCDC. The market share was then compared to the submitted data to see if any hospital groups submitted more separations than their market share would warrant, and if so, whether this would lead to an inappropriate representation. The representation for each hospital group was appropriate, and no adjustments were made to the data due to the market share.
Population adjustment processTo ensure the results reflect the full range of Australia’s private hospitals, an estimation process was adopted to create representative national costing and activity figures from sample data. The estimation process produces population data by estimating weights, based on admitted acute separations that are applied to the sample data so that the admitted acute separations equal the total population figures. The weights are calculated based on the number of separations in each hospital group in the submitted data and Australia-wide, based on the total population in PHDB.
The total population was determined as the number of acute separations in 2017-18 obtained from PHDB. All private acute hospitals in Australia (excluding private day hospital facilities) with more than 200 admitted acute separations during the financial year were included.
The number of hospitals in the population file for Round 22 is 260.
Corporate overheads data issueDuring the data collection and submission process, it was identified that one hospital group’s corporate overhead costs were over-allocated in Round 20 and 21. This issue has been rectified in the hospital group’s data submission for Round 22, but no adjustment has been made for previous rounds. Any variances in the comparison of Round 21 and 22 corporate overhead costs need to be considered in the context of this issue.
11 Data Dictionary, Meteor ID 327254, https://meteor.aihw.gov.au/content/index.phtml/itemId/327254, viewed 22nd January 2019
14

National Hospital Cost Data Collection: Private Hospital Report – Round 22
4. ResultsParticipationThe population of separations in Round 22 is defined as all admitted acute separations performed at 260 in scope overnight private hospitals in 2017-18, which is 3,297,288 separations.
The number of sample separations in Round 22 was 2,173,847, which represents a 13 per cent increase in the sample separations compared to Round 21 (shown in Table 3). In Round 22, the participation rate was 66 per cent of separations, which is an increase of 7 percentage points compared to Round 21. The increase in the participation rate raises the level of confidence in the results.
The average number of sample separations submitted per participant increased by 1,092 separations (from 18,317 to 19,409) between Round 21 and Round 22. The average number of separations per population hospital (all hospitals including non-participating hospitals) decreased by 236 separations (from 12,918 to 12,682) between Round 21 and Round 22.
In the table below, Change in separations (%) represents a comparison to the previous Round.
Table 3. Comparison of separations and hospitals, Round 12 (2007-08) to Round 22 (2017-18)
Key Statistic Round 12 2007-08
Round 13 2008-09
Round 16 2011-12
Round 17 2012-13
Round 18 2013-14
Round 20 2015-16
Round 21 2016-17
Round 22 2017-18
Sample separations 1,607,678 1,648,989 1,775,059 1,650,816 1,697,311 1,781,699 1,923,310 2,173,847
Change in separations (%) 24 3 8 -7 3 5 8 13
Population separations 2,248,324 2,328,814 2,703,667 2,753,670 2,827,996 3,051,681 3,242,411 3,297,288
Participation rate (%) 72 71 66 60 60 58 59 66
Sample hospitals 109 110 105 95 96 91 105 112
Change in sample hospitals (%)
33 1 -5 -10 1 -5 15 7
Population hospitals 229 226 248 244 235 246 251 260
Sample hospitals to population hospitals (%)
48 49 42 39 41 37 42 43
Average separations per participant
14,749 14,991 16,905 17,377 17,680 19,579 18,317 19,409
Average separations per population hospital
9,818 10,304 10,902 11,286 12,034 12,405 12,918 12,682
Average Length of Stay 2.62 2.57 2.51 2.53 2.45 2.34 2.26 2.28
Change (%) -9.0 -1.9 -2.2 0.5 -3.1 -4.6 -3.2 0.9
Overnight Average Length of Stay
unknown unknown unknown 4.42 4.38 4.18 4.10 4.12
The average length of stay (ALOS) increased from 2.26 days in Round 21 to 2.28 days in Round 22. Contributing to this increase of 0.9 per cent (see Table 3) was:
an increase in overnight length of stay from 4.10 days to 4.12 days (0.6 per cent increase) a decrease in the proportion of same-day separations from 59.3 per cent to 59.0 per cent
(0.3 per cent decrease).
15

National Hospital Cost Data Collection: Private Hospital Report – Round 22
Some of the variation between Round 21 and Round 22 may be due to a change in casemix that can be attributed to an increase in the number of participating hospitals from 105 to 112. The change in casemix should be considered when interpreting the results.
Analysis of Top 20 DRGs Analysing the top 20 DRGs provides insight into the consistency between Rounds, the identification of any trends, and highlights the DRGs that are driving costs. This section of the report provides an analysis of the top 20 DRGs by the following categories:
Highest cost weight Highest number of population-adjusted separations Highest cost weighted separations Highest ALOS including minimum and maximum range.
Additional analysis of the cost buckets (operating room/specialist procedure suites, critical care, prostheses and miscellaneous) has been undertaken to identify the top 20 DRGs for each of these buckets.
Top 20 DRGs ranked by highest cost weightKey findings
As shown in Figure 1 the highest cost weight DRG was A13A (Ventilation >=336hours, Major Complexity). As illustrated in Table 4, this was ranked number one in Round 21 and was ranked among the highest cost weight DRGs due to its complexity. Of the six highest cost weight DRGs, five are closely related to A13A, reflecting the resource-intensive nature of these groups.
The DRGs in Table 4 were high cost low volume DRGs, representing only 0.2 per cent (or 6,831 population-adjusted separations) of the total population-adjusted separations (3,297,288). However, despite this small volume, they make up 3.3 per cent of the total population cost weighted separations.
Consistencies between Round 22 and Round 21
80 per cent (16 out of 20) of the top 20 DRGs for Round 22 were also in the Round 21 results, with the top two DRGs remaining the highest cost weight DRGs in both Round 21 and Round 22. A13B (Ventilation >=336hours, Minor Complexity) and P64A (Neonate, AdmWt 1250-1499g W/O Significant GI/Vent>=96hrs, Major Complexity) have both experienced an increase in their cost weights, and consequently have risen to be the third and fourth highest cost weight DRGs.
Many of the DRGs in the top 20 list are recurring as they have high patient complexity and resource utilisation.
16

National Hospital Cost Data Collection: Private Hospital Report – Round 22
Differences between Round 22 and Round 21
There were four new DRGs in the top 20 list in Round 22:
K01A (GIs for Diabetic Complications, Major Complexity) E40A (Respiratory System Disorders W Ventilator Support, Major Complexity) P04B (Neonate, AdmWt 1500-1999g W Significant GI/Vent>=96hrs, Minor Complexity) A15B (Tracheostomy, Intermediate Complexity).
P04B was not included in the analysis last year for having fewer than three hospitals with that DRG. The other three DRGs were all just outside the top 20 in Round 21, sitting at ranks 22, 35 and 36 respectively, indicating that they were consistently high cost weight DRGs.
Figure 1. Top 20 DRGs ranked by highest cost weight
0
5
10
15
20
25
30
35
40
45
50
A13
A
A14
A
A13
B
P64
A
A15
A
A14
B
F01
A
F04
A
A40
Z
K01
A
I02A
I09A
E40
A
F01
B
A14
C
P04
B
F08
A
I06Z
F03
A
A15
B
Cos
t wei
ght
AR-DRG
Round 22 Round 21
Note: When a Round 21 bar is missing from the chart, this is because the DRG was masked in Round 21 due to having fewer than
five separations or having fewer than three hospitals with that DRG.
17

National Hospital Cost Data Collection: Private Hospital Report – Round 22
Table 4. Top 20 DRGs ranked by highest cost weightTop 20 Round
21
Rank Round
22
DRG DRG Description Cost weig
ht(a)
No. of weighted
seps(b)
Cost weighted
seps(c)=(a)x(b)
Number of days
(d)
ALOS (days)
(e)=(d)/(b)
Std error
% of total seps
% of CW
seps
Cost weight Round
21
Rank Round
21
No. of weighted
seps Round 21
Yes 1 A13A Ventilation >=336hours, Major Complexity 42.67
132 5,632 7,963 60.5 2.26 0.0% 0.2% 46.60 1 98
Yes 2 A14A Ventilation >=96hours & <336hours, Major Complexity 32.01
153 4,898 7,698 50.3 2.27 0.0% 0.1% 38.79 2 165
Yes 3 A13B Ventilation >=336hours, Minor Complexity 25.61
54 1,383 1,848 34.1 2.04 0.0% 0.0% 21.63 5 8
Yes 4 P64A Neonate, AdmWt 1250-1499g W/O Significant GI/Vent>=96hrs, Major Complexity
20.69
27 559 1,099 40.1 1.99 0.0% 0.0% 16.93 8 16
Yes 5 A15A Tracheostomy, Major Complexity 20.54
31 637 1,052 34.5 2.68 0.0% 0.0% 21.86 4 11
Yes 6 A14B Ventilation >=96hours & <336hours, Intermediate Complexity 20.06
436 8,746 12,114 27.8 0.70 0.0% 0.3% 23.16 3 288
Yes 7 F01A Implantation and Replacement of AICD, Total System, Major Complexity 18.23
305 5,560 3,092 10.1 0.37 0.0% 0.2% 21.58 6 278
Yes 8 F04A Cardiac Valve Procedures W CPB Pump W/O Invasive Cardiac Invest, Major Comp
17.48
234 4,090 5,619 24.0 0.66 0.0% 0.1% 16.69 9 177
Yes 9 A40Z ECMO 16.53
23 380 359 15.7 4.97 0.0% 0.0% 16.45 10 13
No 10 K01A GIs for Diabetic Complications, Major Complexity 15.03
77 1,157 3,577 46.5 2.16 0.0% 0.0% 10.09 35 71
Yes 11 I02A Microvascular Tissue Transfers or Skin Grafts, Excluding Hand, Major Complexity
14.99
54 809 2,359 43.6 2.70 0.0% 0.0% 15.04 14 59
Yes 12 I09A Spinal Fusion, Major Complexity 14.51
630 9,141 11,618 18.4 0.35 0.0% 0.3% 14.00 18 547
No 13 E40A Respiratory System Disorders W Ventilator Support, Major Complexity 14.46
40 578 780 19.7 2.24 0.0% 0.0% 9.97 36 21
Yes 14 F01B Implantation and Replacement of AICD, Total System, Minor Complexity 14.25
2,606 37,136 5,551 2.1 0.09 0.1% 1.1% 15.11 13 2,179
Yes 15 A14C Ventilation >=96hours & <336hours, Minor Complexity 14.22
215 3,057 4,189 19.5 0.62 0.0% 0.1% 15.87 11 172
No 16 P04B Neonate, AdmWt 1500-1999g W Significant GI/Vent>=96hrs, Minor Complexity
14.01
31 434 906 29.1 2.16 0.0% 0.0% ------ ------ ------
Yes 17 F08A Major Reconstructive Vascular Procedures W/O CPB Pump, Major Complexity
14.01
156 2,186 3,323 21.3 0.91 0.0% 0.1% 14.00 16 150
Yes 18 I06Z Spinal Fusion for Deformity 13.92
1,235 17,191 11,587 9.4 0.27 0.0% 0.5% 13.78 19 988
Yes 19 F03A Cardiac Valve Procedures W CPB Pump W Invasive Cardiac Investigation, Major Comp
13.30
314 4,176 5,662 18.0 0.41 0.0% 0.1% 14.82 15 257
No 20 A15B Tracheostomy, Intermediate Complexity 13.15
78 1,026 1,429 18.2 1.09 0.0% 0.0% 13.16 22 63
16 Sub-total, top 20 highest cost weight 15.92
6,831 108,777 91,825 13.4 0.2% 3.3%
in All DRGs 1.00 3,297,288 3,297,288 7,524,561 2.3 100% 100% Top 20 Top 20, % of all DRGs 0.2% 3.3% 1.2%
Notes(a) For cost weight (cost bucket specific) calculations please refer to Appendix D: Cost weight tables by AR-DRG Version 9.0(b) Separations shown are strata weighted(e) ALOS means Average Length of Stay
18

National Hospital Cost Data Collection: Private Hospital Report – Round 22
Top 20 DRGs ranked by highest volume of population-adjusted separationsKey findings
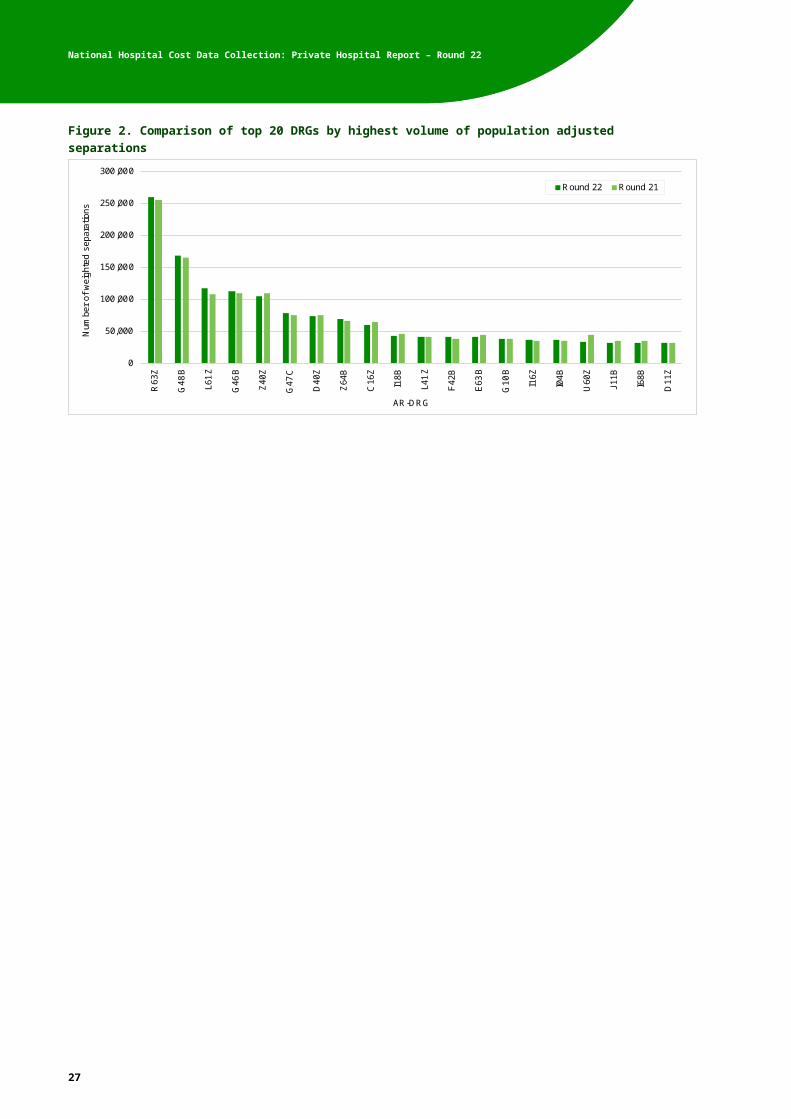
Table 5 and Figure 2 show the DRGs with the highest population-adjusted separations for Round 22. This is a measure of the volume of separations in the entire Australian overnight private hospital population (i.e. the separations in the Round 22 sample, adjusted using weights to reflect the whole population).
Table 5 shows that for Round 22, R63Z (Chemotherapy) was ranked number one, consistent with its Round 21 ranking. Table 5 also shows that the top 20 DRGs represented 44 per cent (1,453,925 population-adjusted separations) of the total population-adjusted separations (3,297,288). However, these DRGs represented only 19 per cent (627,276) of the total population cost weighted separations. This indicates that these DRGs were high volume and low cost.
The ALOS for these top 20 DRGs is 1.2 days compared to the population average of 2.3 days. The reason for this is that the majority of these DRGs were same-day procedures.
Consistencies between Round 22 and Round 21
All of the DRGs in this Round’s top 20 DRGs were included in Round 21’s top 20 (see Table 5), and furthermore the top five in Round 22 are the same as the top five from Round 21, albeit in a different order. This was expected given the high frequency of treatments required for R63Z (Chemotherapy) and the demand for colonoscopies and endoscopies as day procedures.
Differences between Round 22 and Round 21
While there has been some movement in the rank of individual DRGs, otherwise there have been very few changes between Round 21 and Round 22. This very small movement between the Rounds indicated that there is a high level of consistency in the number of high-volume DRGs.
Figure 2. Comparison of top 20 DRGs by highest volume of population adjusted separations
0
50,000
100,000
150,000
200,000
250,000
300,000
R63
Z
G48
B
L61
Z
G46
B
Z40
Z
G47
C
D40
Z
Z64
B
C16
Z
I18B
L41
Z
F42
B
E63
B
G10
B
I16Z
I04B
U60
Z
J11B
I68B
D11
Z
Num
ber
of w
eigh
ted
sepa
ratio
ns
AR-DRG
Round 22 Round 21
19

National Hospital Cost Data Collection: Private Hospital Report – Round 22
Table 5. Top 20 DRGs ranked by highest volume of population adjusted separationsTop 20 Round
21
Rank Round
22
DRG DRG Description Cost weig
ht(a)
No. of weighted
seps(b)
Cost weighted
seps(c)=(a)x(b)
Number of days
(d)
ALOS (days)
(e)=(d)/(b)
Std error
% of total seps
% of CW
seps
No. of weighted
seps Round 21
Rank Round
21
Cost weight Round
21Yes 1 R63Z Chemotherapy 0.19 259,662 49,336 259,678 1.0 0.001 7.9% 1.5% 256,062 1 0.15
Yes 2 G48B Colonoscopy, Minor Complexity 0.30 168,916 50,675 174,737 1.0 0.001 5.1% 1.5% 166,005 2 0.29
Yes 3 L61Z Haemodialysis 0.10 117,511 11,751 117,518 1.0 0.000 3.6% 0.4% 108,871 5 0.10
Yes 4 G46B Complex Endoscopy, Minor Complexity 0.34 112,106 38,116 118,429 1.1 0.001 3.4% 1.2% 109,420 4 0.35
Yes 5 Z40Z Other Contacts W Health Services W Endoscopy 0.24 105,036 25,209 106,602 1.0 0.001 3.2% 0.8% 110,439 3 0.24
Yes 6 G47C Gastroscopy, Minor Complexity 0.24 78,074 18,738 82,756 1.1 0.001 2.4% 0.6% 75,952 7 0.22
Yes 7 D40Z Dental Extractions and Restorations 0.43 74,015 31,826 74,422 1.0 0.001 2.2% 1.0% 76,067 6 0.45
Yes 8 Z64B Other Factors Influencing Health Status, Minor Complexity 0.16 69,093 11,055 73,623 1.1 0.002 2.1% 0.3% 66,815 8 0.18
Yes 9 C16Z Lens Procedures 0.54 59,371 32,060 59,548 1.0 0.001 1.8% 1.0% 64,268 9 0.59
Yes 10 I18B Other Knee Procedures, Minor Complexity 0.54 43,458 23,467 45,164 1.0 0.002 1.3% 0.7% 45,662 10 0.54
Yes 11 L41Z Cystourethroscopy for Urinary Disorder, Sameday 0.24 41,534 9,968 41,534 1.0 0.001 1.3% 0.3% 41,369 13 0.23
Yes 12 F42B Circulatory Dsrds, Not Adm for AMI W Invasive Cardiac Inves Proc, Minor Comp
0.86 41,159 35,397 57,147 1.4 0.004 1.2% 1.1% 38,621 14 0.92
Yes 13 E63B Sleep Apnoea, Minor Complexity 0.19 40,768 7,746 40,868 1.0 0.001 1.2% 0.2% 45,117 11 0.20
Yes 14 G10B Hernia Procedures, Minor Complexity 0.96 38,440 36,902 46,536 1.2 0.003 1.2% 1.1% 38,455 15 0.98
Yes 15 I16Z Other Shoulder Procedures 1.37 36,201 49,595 43,905 1.2 0.004 1.1% 1.5% 35,616 16 1.39
Yes 16 I04B Knee Replacement, Minor Complexity 4.07 36,102 146,935 177,015 4.9 0.006 1.1% 4.5% 34,532 19 4.35
Yes 17 U60Z Mental Health Treatment W/O ECT, Sameday 0.08 34,341 2,747 34,341 1.0 0.000 1.0% 0.1% 44,630 12 0.07
Yes 18 J11B Other Skin, Subcutaneous Tissue and Breast Procedures, Minor Complexity 0.41 32,950 13,510 33,948 1.0 0.002 1.0% 0.4% 35,256 18 0.41
Yes 19 I68B Non-surgical Spinal Disorders, Minor Complexity 0.45 32,887 14,799 57,286 1.7 0.003 1.0% 0.4% 35,278 17 0.46
Yes 20 D11Z Tonsillectomy and Adenoidectomy 0.54 32,303 17,444 32,812 1.0 0.002 1.0% 0.5% 32,793 20 0.57
20 Sub-total, top 20 highest cost weight 0.43 1,453,925 627,276 1,677,869 1.2 44% 19% in All DRGs 1.00 3,297,288 3,297,288 7,524,561 2.3 100% 100%
Top 20 Top 20, % of all DRGs 44% 19% 22% Notes(a) For cost weight (cost bucket specific) calculations please refer to Appendix D: Cost weight tables by AR-DRG Version 9.0(b) Separations shown are strata weighted(e) ALOS means Average Length of Stay
20

National Hospital Cost Data Collection: Private Hospital Report – Round 22
Top 20 DRGs ranked by highest cost weighted separationsKey findings
Table 6 and Figure 3 present the top 20 DRGs ranked by highest cost weight separations. A cost-weighted separation refers to the number of population-adjusted separations multiplied by the cost weight for that DRG, and measures the total cost, or resource utilisation, associated with that DRG.
Figure 3 shows that the highest cost weight DRG was I04B (Knee Replacement, Minor Complexity). This procedure is a common procedure within the private sector and it is frequently ranked amongst the highest cost weighted DRGs. As can be seen in Table 6, the number of cost weighted separations for this DRG decreased by 3,165 or 2.1 per cent (from 150,214 to 146,935 separations) between Rounds.
The DRGs listed in the top 20 (Table 6) were anticipated to be within this ranking given that 85 per cent (17 out of 20) are either within orthopaedic, neurology or cardiac procedures which require high cost prostheses or high volume treatments like colonoscopy/endoscopy or chemotherapy.
The top 20 DRGs by cost weighted separations represented 30 per cent (1,002,822 cost-weighted separations) of the total population cost-weighted separations of 3,297,288. Additionally, these DRGs represented 22 per cent of the total population adjusted separations. This indicated that these were a mixture of high volume and high cost DRGs.
Consistencies between Round 22 and Round 21
As shown in Table 6 the top three DRGs by cost-weighted separations were ranked in the same order as Round 21. The top two – I04B (Knee Replacement, Minor Complexity) and I33B (Hip Replacement for Non-Trauma, Minor Complexity) – are influenced by the high volume of separations, length of stay above average and high cost prostheses being used in these orthopaedic procedures. The third DRG, K11Z (Major Laparoscopic Bariatric Procedures), has been influenced by high prostheses costs and high year-on-year growth in separation volume.
Differences between Round 22 and Round 21
There was one new DRG in the top 20 as can be seen in Table 6, I09B (Spinal Fusion, Intermediate Complexity), which was ranked 22nd in Round 21. The cost weight for this DRG has remained level, but the volume of population-adjusted separations has increased by 19 per cent, leading to a similar increase in the number of cost-weighted separations and pushing it into the top 20 for Round 22.
Figure 3. Comparison of top 20 DRGs by highest cost-weighted separations
0
20,000
40,000
60,000
80,000
100,000
120,000
140,000
160,000
I04B
I33B
K11
Z
I09C
F24
B
I10B
G48
B
R63
Z
I16Z
O01
C
F12
B
G46
B
F01
B
G10
B
I09B
J06B
F42
B
C16
Z
D40
Z
O01
B
Cos
t wei
ghte
d se
para
tions
AR-DRG
Round 22 Round 21
21

National Hospital Cost Data Collection: Private Hospital Report – Round 22
Table 6. Top 20 DRGs ranked by highest cost weighted separationsTop 20 Round
21
Rank Round
22
DRG DRG Description Cost weig
ht(a)
No. of weighted
seps(b)
Cost weighted
seps(c)= (a)x(b)
Number of days
(d)
ALOS (days)
(e)=(d)/(b)
Std error
% of total seps
% of CW
seps
Cost weighted
seps Round 21
Rank Round
21
No. of weighted
seps Round 21
Cost weight Round
21Yes 1 I04B Knee Replacement, Minor Complexity 4.07 36,102 146,935 177,015 4.9 0.01 1.1% 4.5% 150,214 1 34,532 4.35
Yes 2 I33B Hip Replacement for Non-Trauma, Minor Complexity 4.63 24,477 113,329 110,993 4.5 0.01 0.7% 3.4% 114,054 2 22,720 5.02
Yes 3 K11Z Major Laparoscopic Bariatric Procedures 2.45 26,028 63,769 62,934 2.4 0.01 0.8% 1.9% 55,761 3 21,042 2.65
Yes 4 I09C Spinal Fusion, Minor Complexity 6.50 9,583 62,290 48,192 5.0 0.04 0.3% 1.9% 50,566 6 7,864 6.43
Yes 5 F24B Interventional Coronary Procs, Not Adm for AMI, Minor Comp
2.33 23,110 53,846 37,949 1.6 0.01 0.7% 1.6% 51,174 4 20,973 2.44
Yes 6 I10B Other Back and Neck Procedures, Minor Complexity 2.48 21,147 52,445 66,115 3.1 0.02 0.6% 1.6% 42,926 9 18,423 2.33
Yes 7 G48B Colonoscopy, Minor Complexity 0.30 168,916 50,675 174,737 1.0 0.00 5.1% 1.5% 48,141 8 166,005 0.29
Yes 8 R63Z Chemotherapy 0.19 259,662 49,336 259,678 1.0 0.00 7.9% 1.5% 38,409 12 256,062 0.15
Yes 9 I16Z Other Shoulder Procedures 1.37 36,201 49,595 43,905 1.2 0.00 1.1% 1.5% 49,506 7 35,616 1.39
Yes 10 O01C Caesarean Delivery, Minor Complexity 1.96 24,431 47,885 111,588 4.6 0.00 0.7% 1.5% 51,106 5 25,426 2.01
Yes 11 F12B Implantation and Replacement of Pacemaker, Total System, Minor Complexity
4.95 8,031 39,753 19,341 2.4 0.02 0.2% 1.2% 37,585 14 7,298 5.15
Yes 12 G46B Complex Endoscopy, Minor Complexity 0.34 112,106 38,116 118,429 1.1 0.00 3.4% 1.2% 38,297 10 109,420 0.35
Yes 13 F01B Implantation and Replacement of AICD, Total System, Minor Complexity
14.25 2,606 37,136 5,551 2.1 0.09 0.1% 1.1% 32,925 19 2,179 15.11
Yes 14 G10B Hernia Procedures, Minor Complexity 0.96 38,440 36,902 46,536 1.2 0.00 1.2% 1.1% 37,686 13 38,455 0.98
No 15 I09B Spinal Fusion, Intermediate Complexity 9.09 3,941 35,824 32,516 8.3 0.08 0.1% 1.1% 30,149 22 3,324 9.07
Yes 16 J06B Major Procedures for Breast Disorders, Minor Complexity
1.78 19,865 35,360 45,525 2.3 0.01 0.6% 1.1% 32,029 20 18,302 1.75
Yes 17 F42B Circulatory Dsrds, Not Adm for AMI W Invasive Cardiac Inves Proc, Minor Comp
0.86 41,159 35,397 57,147 1.4 0.00 1.2% 1.1% 35,531 15 38,621 0.92
Yes 18 C16Z Lens Procedures 0.54 59,371 32,060 59,548 1.0 0.00 1.8% 1.0% 37,918 11 64,268 0.59
Yes 19 D40Z Dental Extractions and Restorations 0.43 74,015 31,826 74,422 1.0 0.00 2.2% 1.0% 34,230 18 76,067 0.45
Yes 20 O01B Caesarean Delivery, Intermediate Complexity 2.26 13,632 30,808 76,396 5.6 0.01 0.4% 0.9% 34,021 17 14,355 2.37
19 Sub-total, top 20 highest cost weighted separations 1.04 1,002,822 1,043,286 1,628,517 1.6 30% 32% in All DRGs 1.00 3,297,288 3,297,288 7,524,561 2.3 100% 100%
Top 20 Top 20 cost weighted separations, % of all DRGs 30% 32% 22%
Notes(a) For cost weight (cost bucket specific) calculations please refer to Appendix D: Cost weight tables by AR-DRG Version 9.0(b) Separations shown are strata weighted (e) ALOS means Average Length of Stay
22

National Hospital Cost Data Collection: Private Hospital Report – Round 22
Top 20 DRGs ranked by average length of stay (ALOS)Key findings
Table 7 and Figure 4 show that the DRG with the highest ALOS is A13A (Ventilation >=336hours, Major Complexity) with an ALOS of 60.5 days. This DRG was also ranked number one in Round 21, and was also ranked as the DRG with the highest cost weight. DRGs with a high cost weight are expected to have a high ALOS, and vice versa.
The DRGs listed in the top 20 for Round 22 are expected to be within this ranking given their complex nature. The majority of DRGs within the top 20 are either intermediate or major complexity DRGs which have long length of stays.
As shown in Table 7, these DRGs represent 0.1 per cent (3,277 population-adjusted separations) of the total 3,297,288 population-adjusted separations. They also represented 1.2 per cent (41,190 cost-weighted separations) of the total population cost-weighted separations.
Consistencies between Round 22 and Round 21
70 per cent (14 out of 20) of this Round’s top 20 DRGs were in the top 20 in Round 21. The top two DRGs in Round 21 have remained the top DRGs in Round 22. For A13A (Ventilation >=336hours, Major Complexity), the top DRG, the ALOS has increased from 56.7 to 60.5 days, or an increase of 6.8 per cent.
Differences between Round 22 and Round 21
The differences between the top 20 rankings in Round 21 and Round 22. were largely due to the nature of the DRGs with a high ALOS which tend to have a very broad range and can vary from very short (including same-day separations) to very long (several months). These DRGs also tend to be low in volume, which leads to more volatile results.
Six DRGs are new to the top 20 in Round 22. P04B was not included in the analysis in Round 21 due to having fewer than three hospitals with that DRG. Of the other five, their Round 21 ranks ranged from 26 to 35, suggesting that they have been consistently high ALOS DRGs Round-to-Round.
DRG K01A (GIs for Diabetic Complications, Major Complexity) was ranked 15 in Round 21, with an ALOS of 28.6 days. In Round 22, K01A is now ranked third, with an ALOS of 46.5 days, or an increase of 17.9 days. This is the largest movement in ALOS between Rounds for any DRG in the top 20 (in Round 22). We note that this DRG has a small number of population-adjusted separations (77), and so would be susceptible to volatility in their results.
Figure 4. Comparison of top 20 DRGs by average length of stay (ALOS)
0
10
20
30
40
50
60
70
A13
A
A14
A
K01
A
I02A
P64
A
F11
A
R03
A
A15
A
A13
B
G01
A
F21
A
F61
A
P65
A
P04
B
P64
B
U63
A
A14
B
I31A
U66
A
H06
A
Av
erag
e le
ngth
of
stay
AR-DRG
Round 22 Round 21
Note: When a Round 21 bar is missing from the chart, this is because the DRG was masked in Round 21 due to having fewer than
five separations or having fewer than three hospitals with that DRG.
23

National Hospital Cost Data Collection: Private Hospital Report – Round 22
Table 7. Top 20 DRGs ranked by average length of stay (ALOS)Top 20 Round
21
Rank Round
22
DRG DRG Description ALOS (days)
(a)
Min LoS
Max LoS
Cost weight
No. of weighted seps (b)
Cost weighted
seps
Std error
% of total seps
% of CW
seps
ALOS Round
21
Rank Round
21
Number of days
Yes 1 A13A Ventilation >=336hours, Major Complexity 60.5 18 237 42.67 132 5,632 2.26 0.0% 0.2% 56.7 1 7,963
Yes 2 A14A Ventilation >=96hours & <336hours, Major Complexity 50.3 4 178 32.01 153 4,898 2.27 0.0% 0.1% 51.2 2 7,698
Yes 3 K01A GIs for Diabetic Complications, Major Complexity 46.5 10 166 15.03 77 1,157 2.16 0.0% 0.0% 28.6 15 3,577
Yes 4 I02A Microvascular Tissue Transfers or Skin Grafts, Excluding Hand, Major Complexity
43.6 2 187 14.99 54 809 2.70 0.0% 0.0% 34.3 7 2,359
Yes 5 P64A Neonate, AdmWt 1250-1499g W/O Significant GI/Vent>=96hrs, Major Complexity
40.1 14 57 20.69 27 559 1.99 0.0% 0.0% 35.3 6 1,099
Yes 6 F11A Amputation, Except Upper Limb and Toe, for Circulatory Disorders, Major Comp
40.0 10 97 11.90 60 714 0.92 0.0% 0.0% 46.5 3 2,401
Yes 7 R03A Lymphoma and Leukaemia W Other GIs, Major Complexity 35.9 1 107 11.34 94 1,066 0.95 0.0% 0.0% 41.1 4 3,377
No 8 A15A Tracheostomy, Major Complexity 34.5 7 110 20.54 31 637 2.68 0.0% 0.0% 24.3 29 1,052
Yes 9 A13B Ventilation >=336hours, Minor Complexity 34.1 15 92 25.61 54 1,383 2.04 0.0% 0.0% 30.6 12 1,848
Yes 10 G01A Rectal Resection, Major Complexity 30.7 2 236 12.15 310 3,767 0.64 0.0% 0.1% 32.1 9 9,514
Yes 11 F21A Other Circulatory System GIs, Major Complexity 30.5 6 133 7.64 63 481 1.61 0.0% 0.0% 29.7 14 1,912
No 12 F61A Infective Endocarditis, Major Complexity 29.9 4 68 6.91 69 477 0.56 0.0% 0.0% 24.8 26 2,067
Yes 13 P65A Neonate, AdmWt 1500-1999g W/O Significant GI/Vent>=96hrs, Extreme Comp
29.1 5 54 11.40 52 593 1.04 0.0% 0.0% 31.2 11 1,509
No 14 P04B Neonate, AdmWt 1500-1999g W Significant GI/Vent>=96hrs, Minor Complexity
29.1 1 48 14.01 31 434 2.16 0.0% 0.0% ------ ------ 906
Yes 15 P64B Neonate, AdmWt 1250-1499g W/O Significant GI/Vent>=96hrs, Minor Complexity
28.8 1 49 8.18 50 409 0.67 0.0% 0.0% 31.3 10 1,429
Yes 16 U63A Major Affective Disorders, Major Complexity 28.2 1 217 4.68 1,154 5,401 0.12 0.0% 0.2% 26.8 19 32,578
Yes 17 A14B Ventilation >=96hours & <336hours, Intermediate Complexity 27.8 5 133 20.06 436 8,746 0.70 0.0% 0.3% 27.8 17 12,114
No 18 I31A Revision of Hip Replacement, Major Complexity 27.4 2 115 11.92 236 2,813 0.50 0.0% 0.1% 23.5 33 6,465
No 19 U66A Eating and Obsessive-Compulsive Disorders, Major Complexity 26.8 1 77 4.92 130 640 0.33 0.0% 0.0% 23.0 35 3,487
No 20 H06A Other Hepatobiliary and Pancreas GIs, Major Complexity 26.8 2 88 8.98 64 575 1.28 0.0% 0.0% 23.6 32 1,723
14 Sub-total, top 20 highest cost weight 32.1 12.57 3,277 41,190 0.1% 1.2% 105,078in All DRGs 2.3 1.00 3,297,288 3,297,288 100% 100% 7,524,561
Top 20 Top 20, % of all DRGs 0.1% 1.2% 1.4%Notes(a) For cost weight (cost bucket specific) calculations please refer to Appendix D: Cost weight tables by AR-DRG Version 9.0(b) Separations shown are strata weighted(e) ALOS means Average Length of Stay
24

National Hospital Cost Data Collection: Private Hospital Report – Round 22
Analysis of cost bucketsThe private sector NHCDC has analysed and reported on the cost buckets below since Round 17 (2012-13):
Operating room/Specialist Procedure Suites Critical care Prostheses Miscellaneous (representing the remainder of the cost buckets – see Appendix B: Private
sector costing approaches for the list of cost buckets).The same cost buckets are reported in Round 22.
This section contains the analysis of the differences between cost buckets in Round 21 and Round 22 as well as the top 20 DRGs by these cost buckets.
Differences between Round 22 and Round 21Table 8 and Figure 5 illustrate the differences between the cost buckets in Round 21 and Round 22. The movements between the Rounds are relatively small which is expected given that participants undertook their own costing in Round 21 and continued in Round 22.
Figure 5 shows that Miscellaneous had the largest movement between Rounds with a decrease of 1.5 per cent. There was also an increase of 1.2 per cent in prostheses.
Changes in cost buckets may be due to:
Improvements in the accuracy of cost allocations through quality improvement of the participant’s feeder data and/or allocation statistics
Changes in service weights between Rounds Increases in same-day theatre related separations.
Figure 5. Breakdown of cost by cost-bucket group (Round 22 compared to Round 21)
0%
10%
20%
30%
40%
50%
60%
Operating Rooms and Special istProcedure Suites
Critical Care Prostheses Miscellaneous
Round 22 Round 21
Table 8. Breakdown of cost by cost-bucket group (Round 22 compared to Round 21)
Cost Bucket Round 212016-17
Round 22 2017-18
Movement
Operating Rooms and Specialist Procedure Suites 27.9% 28.5% 0.6%Critical Care 5.6% 5.3% -0.3%Prostheses 17.5% 18.8% 1.2%Miscellaneous 49.0% 47.5% -1.5%
Total 100.0% 100.0% 0.0%
25

National Hospital Cost Data Collection: Private Hospital Report – Round 22
Operating room/specialist procedure suites cost bucketKey findings
Table 9 shows that the highest operating room/specialist procedure suites cost weight DRG was J01A (Microvas Tiss Transf for Skin, Subcut Tiss & Breast Dsrds, Major Complexity). This DRG was ranked number three in Round 21. We note that this DRG only had 39 population-adjusted separations in Round 22.
The top operating room/specialist procedure suites DRGs presented in Table 9 have a lower percentage of their total cost belonging to the operating room and specialist procedure suites buckets (20 per cent) than the average DRG (29 per cent). This indicated that most of the DRGs in this table were overall high cost DRGs with only a small share of their cost coming from the operating room/specialist procedure suites bucket (but due to the high overall cost, this is still enough to be a top-ranking DRG).
There were a few DRGs which are lower in cost overall, but have a high share of their costs allocated to the operating room/specialist procedure suites cost buckets. These were:
J01B (Microvas Tiss Transf for Skin, Subcut Tiss & Breast Dsrds, Minor Complexity) which had 46 per cent of its total cost belonging to the operating room/specialist procedure suites cost bucket
J01A (Microvas Tiss Transf for Skin, Subcut Tiss & Breast Dsrds, Major Complexity) which had 38 per cent of its total cost belonging to the operating room/specialist procedure suites cost bucket
A15C (Tracheostomy, Minor Complexity) which had 33 per cent of its total cost belonging to the operating room/specialist procedure suites cost bucket.
Consistencies between Round 22 and Round 21
80 per cent (16 of 20) of the top 20 DRGs by operating room/specialist procedure suites costs in Round 21 were present in the top 20 of Round 22. Two of the DRGs in the top three of Round 21, J01A (Microvas Tiss Transf for Skin, Subcut Tiss & Breast Dsrds, Major Complexity) and A15B (Tracheostomy, Intermediate Complexity), remained in the top three of Round 22.
Differences between Round 22 and Round 21
There were four new entrants to the top 20 in Round 22. These were:
W02A (Hip, Femur and Lower Limb Procedures for Multiple Sig Trauma, Major Complexity) I06Z (Spinal Fusion for Deformity) F07A (Other Cardiothoracic/Vascular Procedures W CPB Pump, Major Complexity) F06A (Coronary Bypass W/O Invasive Cardiac Investigation, Major Complexity).
Of these, one DRG (W02A) was not included in Round 21’s analysis due to having fewer than five sample separations. The remaining DRGs were all highly ranked in Round 21, with ranks between 21 and 36.
The top ranked DRG in Round 21, A15A (Tracheostomy, Major Complexity), fell to rank five in Round 22. A15A’s operating room and specialist procedure suites cost weight fell from 4.17 to 3.12, or a reduction of 25 per cent. However, this DRG only had 31 population-adjusted separations, so these results may be influenced by volatility.
26
National Hospital Cost Data Collection: Private Hospital Report – Round 22
Table 9. Top 20 DRGs for operating room/specialist procedure suites cost bucketTop 20 Round
21
Rank Round
22
DRG DRG Description OR and SPS cost
weight(a)
No. of weighted seps (b)
Overall cost
weight(c)
ALOS (days)
(d)
% of AR-DRG total cost OR and SPS cost
weight Round
21
Rank Round
21OR and SPS
Critical care
Prosth-esis
Miscell-aneous
Yes 1 J01A Microvas Tiss Transf for Skin, Subcut Tiss & Breast Dsrds, Major Complexity 4.12 39 10.94 17.1 38% 15% 7% 40% 3.54 3
Yes 2 A40Z ECMO 3.77 23 16.53 15.7 23% 41% 14% 22% 2.88 8
Yes 3 A15B Tracheostomy, Intermediate Complexity 3.45 78 13.15 18.2 26% 33% 5% 36% 3.58 2
Yes 4 I02A Microvascular Tissue Transfers or Skin Grafts, Excluding Hand, Major Complexity 3.26 54 14.99 43.6 22% 4% 13% 62% 2.46 11
Yes 5 A15A Tracheostomy, Major Complexity 3.12 31 20.54 34.5 15% 46% 5% 34% 4.17 1
No 6 W02A Hip, Femur and Lower Limb Procedures for Multiple Sig Trauma, Major Complexity
3.05 10 11.57 23.2 26% 10% 20% 44% ****** ******
Yes 7 F03A Cardiac Valve Procedures W CPB Pump W Invasive Cardiac Investigation, Major Comp
2.92 314 13.30 18.0 22% 21% 22% 35% 2.90 6
Yes 8 J01B Microvas Tiss Transf for Skin, Subcut Tiss & Breast Dsrds, Minor Complexity 2.90 560 6.26 7.6 46% 6% 9% 39% 2.90 7
Yes 9 F04A Cardiac Valve Procedures W CPB Pump W/O Invasive Cardiac Invest, Major Comp
2.83 234 17.48 24.0 16% 31% 18% 35% 2.22 16
Yes 10 A15C Tracheostomy, Minor Complexity 2.78 84 8.50 10.9 33% 27% 6% 34% 2.58 9
Yes 11 A14A Ventilation >=96hours & <336hours, Major Complexity 2.76 153 32.01 50.3 9% 46% 6% 39% 3.36 4
Yes 12 A13A Ventilation >=336hours, Major Complexity 2.70 132 42.67 60.5 6% 61% 4% 29% 3.15 5
No 13 I06Z Spinal Fusion for Deformity 2.55 1,235 13.92 9.4 18% 5% 57% 20% 1.98 25
Yes 14 F05A Coronary Bypass W Invasive Cardiac Investigation, Major Complexity 2.52 341 11.52 17.3 22% 38% 7% 33% 2.49 10
Yes 15 F03B Cardiac Valve Procedures W CPB Pump W Invasive Cardiac Investigation, Minor Comp
2.47 526 10.61 12.3 23% 20% 27% 30% 2.24 14
Yes 16 I09A Spinal Fusion, Major Complexity 2.45 630 14.51 18.4 17% 11% 44% 28% 2.16 18
No 17 F07A Other Cardiothoracic/Vascular Procedures W CPB Pump, Major Complexity 2.45 94 12.18 19.3 20% 26% 14% 40% 1.93 26
Yes 18 F05B Coronary Bypass W Invasive Cardiac Investigation, Minor Complexity 2.45 1,117 8.76 12.1 28% 31% 7% 34% 2.20 17
Yes 19 F08A Major Reconstructive Vascular Procedures W/O CPB Pump, Major Complexity 2.44 156 14.01 21.3 17% 26% 20% 37% 2.44 12
No 20 F06A Coronary Bypass W/O Invasive Cardiac Investigation, Major Complexity 2.28 213 11.16 16.7 20% 40% 7% 33% 2.10 21
16 Sub-total, top 20 highest cost weight 2.61 6,024 12.90 15.9 20% 24% 26% 31% in All DRGs 0.29 3,297,288 1.00 2.3 29% 5% 19% 47%
Top 20 Top 20, % of all DRGs 0.2%
Notes(a) For cost weight (cost bucket specific) calculations please refer to Appendix D: Cost weight tables by AR-DRG Version 9.0(b) Separations shown are strata weighted(d) ALOS means Average Length of Stay
27

National Hospital Cost Data Collection: Private Hospital Report – Round 22
Critical care cost bucketKey findings
Table 10 demonstrates that the highest critical care cost weight DRG was A13A (Ventilation >=336hours, Major Complexity). This was ranked number one in Round 21 and is expected to be highly ranked given its complex and resource intensive nature.
As seen in Table 10 the DRGs listed in the top 20 were expected to be within this ranking given that they include either mechanical ventilation or neonatal DRGs.
The DRGs with the highest critical care costs were low-volume, high complexity DRGs.
Consistencies between Round 22 and Round 21
75 per cent (15 of 20) of the top 20 DRGs by critical care costs in Round 21 were present in the top 20 of Round 22. Of the top four DRGs in Round 21, three DRGs have remained in the top 4 in Round 22. These three DRGs are all closely related and reflect the highly resource-intensive nature of the A13 (Ventilation >=336hours) and A14 (Ventilation >=96hours & <336hours) ADRGs.
Differences between Round 22 and Round 21
There were five new DRGs entering the top 20 critical care cost weights (see Table 10) in Round 22. These were:
P04B (Neonate, AdmWt 1500-1999g W Significant GI/Vent>=96hrs, Minor Complexity) T40Z (Infectious and Parasitic Diseases W Ventilator Support) P65B (Neonate, AdmWt 1500-1999g W/O Significant GI/Vent>=96hrs, Major Complexity) F40A (Circulatory Disorders W Ventilator Support, Major Complexity) B42A (Nervous System Disorders W Ventilator Support, Major Complexity).
P04B was excluded from the analysis in Round 21 for having fewer than three hospitals with that DRG, while B42A was excluded in Round 21 for having fewer than five sample separations. The remaining three DRGs were all highly ranked in Round 21 (ranging from rank 21 to 36), and are all low volume DRGs, and so may be influenced by volatility.
28

National Hospital Cost Data Collection: Private Hospital Report – Round 22
Table 10. Top 20 DRGs for critical care cost bucketTop 20 Round
21
Rank Round
22
DRG DRG Description Critical care cost
weight(a)
No. of weighted seps (b)
Overall cost
weight(c)
ALOS (days)
(d)
% of AR-DRG total cost Critical care cost
weight Round
21
Rank Round
21OR and SPS
Critical care
Prosth-esis
Miscell-aneous
Yes 1 A13A Ventilation >=336hours, Major Complexity 25.90 132 42.67 60.5 6% 61% 4% 29% 29.90 1
Yes 2 A13B Ventilation >=336hours, Minor Complexity 16.89 54 25.61 34.1 3% 66% 5% 26% 14.28 4
Yes 3 A14A Ventilation >=96hours & <336hours, Major Complexity 14.84 153 32.01 50.3 9% 46% 6% 39% 20.93 2
Yes 4 A14B Ventilation >=96hours & <336hours, Intermediate Complexity 10.33 436 20.06 27.8 10% 51% 6% 33% 12.99 6
Yes 5 E40A Respiratory System Disorders W Ventilator Support, Major Complexity 9.46 40 14.46 19.7 1% 65% 0% 33% 6.25 11
Yes 6 A15A Tracheostomy, Major Complexity 9.35 31 20.54 34.5 15% 46% 5% 34% 8.95 8
Yes 7 A14C Ventilation >=96hours & <336hours, Minor Complexity 7.97 215 14.22 19.5 7% 56% 6% 30% 9.85 7
Yes 8 P64A Neonate, AdmWt 1250-1499g W/O Significant GI/Vent>=96hrs, Major Complexity 7.62 27 20.69 40.1 0% 37% 0% 63% 13.55 5
Yes 9 A40Z ECMO 6.83 23 16.53 15.7 23% 41% 14% 22% 8.83 9
No 10 P04B Neonate, AdmWt 1500-1999g W Significant GI/Vent>=96hrs, Minor Complexity 6.52 31 14.01 29.1 0% 47% 0% 53% ------ ------
Yes 11 P65A Neonate, AdmWt 1500-1999g W/O Significant GI/Vent>=96hrs, Extreme Comp 6.47 52 11.40 29.1 0% 57% 0% 43% 6.41 10
Yes 12 F04A Cardiac Valve Procedures W CPB Pump W/O Invasive Cardiac Invest, Major Comp
5.42 234 17.48 24.0 16% 31% 18% 35% 6.24 12
No 13 T40Z Infectious and Parasitic Diseases W Ventilator Support 5.18 30 9.57 19.5 1% 54% 0% 44% 4.65 21
Yes 14 P64B Neonate, AdmWt 1250-1499g W/O Significant GI/Vent>=96hrs, Minor Complexity 4.76 50 8.18 28.8 0% 58% 0% 42% 4.88 19
No 15 P65B Neonate, AdmWt 1500-1999g W/O Significant GI/Vent>=96hrs, Major Complexity 4.65 79 7.78 23.8 0% 60% 0% 40% 4.02 26
No 16 F40A Circulatory Disorders W Ventilator Support, Major Complexity 4.60 13 11.54 20.9 2% 40% 1% 58% 3.20 36
Yes 17 F06A Coronary Bypass W/O Invasive Cardiac Investigation, Major Complexity 4.46 213 11.16 16.7 20% 40% 7% 33% 5.47 16
Yes 18 F05A Coronary Bypass W Invasive Cardiac Investigation, Major Complexity 4.39 341 11.52 17.3 22% 38% 7% 33% 5.68 14
Yes 19 B42B Nervous System Disorders W Ventilator Support, Intermediate Complexity 4.36 16 7.49 15.6 1% 58% 0% 40% 6.04 13
No 20 B42A Nervous System Disorders W Ventilator Support, Major Complexity 4.31 16 8.99 17.2 3% 48% 1% 48% ****** ******
15 Sub-total, top 20 highest cost weight 8.72 2,185 17.85 27.1 11% 49% 7% 34%
in All DRGs 0.05 3,297,288
1.00 2.3 29% 5% 19% 47%
Top 20 Top 20, % of all DRGs 0.1%
Notes(a) For cost weight (cost bucket specific) calculations please refer to Appendix D: Cost weight tables by AR-DRG Version 9.0(b) Separations shown are strata weighted(d) ALOS means Average Length of Stay
29

National Hospital Cost Data Collection: Private Hospital Report – Round 22
Prostheses cost bucketKey findings
The highest cost weight DRG is F01A (Implantation and Replacement of AICD, Total System, Major Complexity) as shown in Table 11. This was ranked number one in Round 21 due to the high cost of the defibrillator prostheses and increased activity. The prostheses cost weight for this DRG decreased between Rounds, from 15.91 in Round 21 to 12.60 in Round 22, a change of 3.3 cost weights (or 21 per cent).
All DRGs in the top 20 by prostheses cost have a higher percentage of the total cost belonging to the prostheses bucket than the average for all DRGs. The average percentage of costs belonging to the prosthesis bucket for all DRGs is 19 per cent, whereas it is 59 per cent for the DRGs in the top 20 table, ranging from 18 per cent for F04A (Cardiac Valve Procedures W CPB Pump W/O Invasive Cardiac Invest, Major Comp) to 83 per cent for F01B (Implantation and Replacement of AICD, Total System, Minor Complexity). This indicates that the majority of the cost of these DRGs comes from the cost of the prostheses.
These high cost prostheses procedures only represented 1.1 per cent (37,099 population-adjusted separations) of the total 3,297,288 population-adjusted separations.
Consistencies between Round 22 and Round 21
75 per cent (15 out of 20) of the top 20 DRGs were included in the Round 21 results, with the same DRGs appearing in the top 8 of both Rounds, albeit in a different order. This indicated that these DRGs are consistently high in prostheses costs.
Differences between Round 22 and Round 21
There were five new DRGs entering the top 20 prostheses cost weights (see Table 11) in Round 22. These were:
I11Z (Limb Lengthening Procedures) F04A (Cardiac Valve Procedures W CPB Pump W/O Invasive Cardiac Invest, Major Comp) F02Z (Other AICD Procedures) W04A (Multiple Significant Trauma W Other GIs, Major Complexity) F03A (Cardiac Valve Procedures W CPB Pump W Invasive Cardiac Investigation, Major
Comp).W04A experienced the most significant movement, rising from rank 118 in Round 21 to rank 18 in Round 22. However, W04A only has 10 population-adjusted separations, so it is likely that this result is due to volatility. The other four DRGs were highly ranked in Round 21, ranging from 23rd to 41st. These DRGs also have relatively low separations, and so may have been influenced by volatility.
30

National Hospital Cost Data Collection: Private Hospital Report – Round 22
Table 11. Top 20 DRGs for prostheses cost bucketTop 20 Round
21
Rank Round
22
DRG DRG Description Prosth-esis cost
weight(a)
No. of weighted seps (b)
Overall cost
weight(c)
ALOS (days)
(d)
% of AR-DRG total cost Prosth-esis cost
weight Round
21
Rank Round
21OR and SPS
Critical care
Prosth-esis
Miscell-aneous
Yes 1 F01A Implantation and Replacement of AICD, Total System, Major Complexity 12.60 305 18.23 10.1 12% 7% 69% 12% 15.91 1
Yes 2 F01B Implantation and Replacement of AICD, Total System, Minor Complexity 11.84 2,606 14.25 2.1 11% 1% 83% 5% 13.65 2
Yes 3 I06Z Spinal Fusion for Deformity 7.93 1,235 13.92 9.4 18% 5% 57% 20% 8.11 3
Yes 4 I09A Spinal Fusion, Major Complexity 6.41 630 14.51 18.4 17% 11% 44% 28% 6.49 5
Yes 5 D01Z Cochlear Implant 6.19 1,100 7.92 1.4 14% 0% 78% 7% 6.96 4
Yes 6 I09B Spinal Fusion, Intermediate Complexity 4.85 3,941 9.09 8.3 20% 5% 53% 22% 4.94 6
Yes 7 I01A Bilateral and Multiple Major Joint Procedures of Lower Limb, Major Complexity 4.06 622 9.73 14.6 17% 6% 42% 35% 4.51 7
Yes 8 I01B Bilateral and Multiple Major Joint Procedures of Lower Limb, Minor Complexity 3.80 3,474 6.98 5.9 20% 3% 54% 22% 4.50 8
Yes 9 I09C Spinal Fusion, Minor Complexity 3.60 9,583 6.50 5.0 22% 3% 55% 20% 3.58 13
No 10 I11Z Limb Lengthening Procedures 3.54 80 5.91 3.7 20% 0% 60% 19% 2.48 25
Yes 11 F12A Implantation and Replacement of Pacemaker, Total System, Major Complexity 3.43 1,498 7.06 8.6 16% 12% 49% 23% 3.88 10
Yes 12 F12B Implantation and Replacement of Pacemaker, Total System, Minor Complexity 3.27 8,031 4.95 2.4 17% 5% 66% 11% 3.69 11
No 13 F04A Cardiac Valve Procedures W CPB Pump W/O Invasive Cardiac Invest, Major Comp
3.19 234 17.48 24.0 16% 31% 18% 35% 2.28 29
No 14 F02Z Other AICD Procedures 3.18 181 5.16 3.1 20% 5% 62% 14% 1.73 41
Yes 15 I32A Revision of Knee Replacement, Major Complexity 3.07 514 8.46 16.6 17% 6% 36% 41% 3.62 12
Yes 16 F17B Insertion and Replacement of Pacemaker Generator, Minor Complexity 3.06 1,771 4.17 1.2 18% 1% 73% 8% 3.40 14
Yes 17 I31A Revision of Hip Replacement, Major Complexity 3.02 236 11.92 27.4 15% 11% 25% 49% 3.40 15
No 18 W04A Multiple Significant Trauma W Other GIs, Major Complexity 3.01 10 9.35 18.2 14% 8% 32% 45% 0.48 118
No 19 F03A Cardiac Valve Procedures W CPB Pump W Invasive Cardiac Investigation, Major Comp
2.97 314 13.30 18.0 22% 21% 22% 35% 2.60 23
Yes 20 I05A Other Joint Replacement, Major Complexity 2.87 733 6.40 8.5 19% 6% 45% 30% 2.82 19
15 Sub-total, top 20 highest cost weight 4.54 37,099 7.70 5.7 18% 5% 59% 18%
in All DRGs 0.19 3,297,288
1.00 2.3 29% 5% 19% 47%
Top 20 Top 20, % of all DRGs 1.1%
Notes(a) For cost weight (cost bucket specific) calculations please refer to Appendix D: Cost weight tables by AR-DRG Version 9.0(b) Separations shown are strata weighted (d) ALOS means Average Length of Stay
31

National Hospital Cost Data Collection: Private Hospital Report – Round 22
Miscellaneous cost bucketKey findings
As in previous Rounds, the miscellaneous cost bucket was the most volatile in rankings of all the cost buckets. The volatility may be driven by the sample size, different hospitals participating and a different approach to costing being used by the participating hospitals.
Table 12 shows that the highest cost weight DRG in this cost bucket was P64A (Neonate, AdmWt 1250-1499g W/O Significant GI/Vent>=96hrs, Major Complexity).
The DRGs listed in the top 20 were to be expected given that they are high cost, low volume treatments and have appeared in the top 20 of previous tables throughout this report.
These DRGs represented only 0.1 per cent (3,117 population-adjusted separations) of the total 3,297,288 population-adjusted separations.
Consistencies between Round 22 and Round 21
70 per cent (14 out of 20) of the top 20 DRGs were included in the Round 21 results, which is the lowest level of consistency between Rounds seen across the four cost buckets analysed in this report. The top six DRGs in Round 21 all remained highly ranked this Round, staying in the top 8 for Round 22.
Differences between Round 22 and Round 21
The six new DRGs in the top 20 in Round 22 were:
P64A (Neonate, AdmWt 1250-1499g W/O Significant GI/Vent>=96hrs, Major Complexity) P04B (Neonate, AdmWt 1500-1999g W Significant GI/Vent>=96hrs, Minor Complexity) F40A (Circulatory Disorders W Ventilator Support, Major Complexity) F61A (Infective Endocarditis, Major Complexity) H06A (Other Hepatobiliary and Pancreas GIs, Major Complexity) I31A (Revision of Hip Replacement, Major Complexity).
P04B was not included in the analysis last year for having fewer than 3 hospitals with that DRG. Of the remaining five DRGs, the biggest movement was seen in P64A, which moved from a rank of 93 in Round 21, with a miscellaneous cost weight of 3.38 to the top rank in Round 22, with a miscellaneous cost weight of 13.07. This DRG has a low number of population-adjusted separations (27 in Round 22), and so would be susceptible to volatility.
32

National Hospital Cost Data Collection: Private Hospital Report – Round 22
Table 12. Top 20 DRGs for miscellaneous (Misc.) cost bucket Top 20 Round
21
Rank Round
22
DRG DRG Description Miscell-aneous
cost weight
(a)
No. of weighted seps (b)
Overall cost
weight(c)
ALOS (days)
(d)
% of AR-DRG total cost Miscell-aneous
cost weight
Round 21
Rank Round
21OR and SPS
Critical care
Prosth-esis
Miscell-aneous
No 1 P64A Neonate, AdmWt 1250-1499g W/O Significant GI/Vent>=96hrs, Major Complexity 13.07 27 20.69 40.1 0% 37% 0% 63% 3.38 93
Yes 2 A14A Ventilation >=96hours & <336hours, Major Complexity 12.34 153 32.01 50.3 9% 46% 6% 39% 12.50 1
Yes 3 A13A Ventilation >=336hours, Major Complexity 12.34 132 42.67 60.5 6% 61% 4% 29% 12.22 2
Yes 4 K01A GIs for Diabetic Complications, Major Complexity 11.12 77 15.03 46.5 11% 10% 5% 74% 6.53 13
Yes 5 I02A Microvascular Tissue Transfers or Skin Grafts, Excluding Hand, Major Complexity 9.26 54 14.99 43.6 22% 4% 13% 62% 8.93 6
Yes 6 R06A Autologous Bone Marrow Transplant, Major Complexity 9.17 114 10.50 25.1 1% 11% 1% 87% 9.99 5
Yes 7 R03A Lymphoma and Leukaemia W Other GIs, Major Complexity 8.93 94 11.34 35.9 6% 10% 5% 79% 11.10 3
Yes 8 F11A Amputation, Except Upper Limb and Toe, for Circulatory Disorders, Major Comp 7.98 60 11.90 40.0 17% 13% 3% 67% 10.88 4
No 9 P04B Neonate, AdmWt 1500-1999g W Significant GI/Vent>=96hrs, Minor Complexity 7.47 31 14.01 29.1 0% 47% 0% 53% ------ ------
Yes 10 A15A Tracheostomy, Major Complexity 7.01 31 20.54 34.5 15% 46% 5% 34% 6.83 11
Yes 11 R60A Acute Leukaemia, Major Complexity 6.99 433 7.61 23.9 2% 6% 1% 92% 7.78 8
No 12 F40A Circulatory Disorders W Ventilator Support, Major Complexity 6.65 13 11.54 20.9 2% 40% 1% 58% 2.58 145
Yes 13 A13B Ventilation >=336hours, Minor Complexity 6.60 54 25.61 34.1 3% 66% 5% 26% 6.32 16
Yes 14 A14B Ventilation >=96hours & <336hours, Intermediate Complexity 6.55 436 20.06 27.8 10% 51% 6% 33% 6.86 10
Yes 15 G01A Rectal Resection, Major Complexity 6.29 310 12.15 30.7 18% 25% 6% 52% 7.57 9
No 16 F61A Infective Endocarditis, Major Complexity 6.19 69 6.91 29.9 3% 6% 1% 90% 5.41 25
No 17 H06A Other Hepatobiliary and Pancreas GIs, Major Complexity 6.14 64 8.98 26.8 9% 17% 5% 68% 5.75 21
Yes 18 F04A Cardiac Valve Procedures W CPB Pump W/O Invasive Cardiac Invest, Major Comp
6.04 234 17.48 24.0 16% 31% 18% 35% 5.95 19
Yes 19 T01A Infectious and Parasitic Diseases W GIs, Major Complexity 5.99 494 8.90 26.4 11% 17% 4% 67% 6.33 15
No 20 I31A Revision of Hip Replacement, Major Complexity 5.84 236 11.92 27.4 15% 11% 25% 49% 5.60 23
14 Sub-total, top 20 highest cost weight 7.34 3,117 15.01 30.9 10% 34% 7% 49% in All DRGs 0.47 3,297,288 1.00 2.3 29% 5% 19% 47%
Top 20 Top 20, % of all DRGs 0.1%
Notes(a) For cost weight (cost bucket specific) calculations please refer to Appendix D: Cost weight tables by AR-DRG Version 9.0(b) Separations shown are strata weighted(d) ALOS means Average Length of Stay
33

National Hospital Cost Data Collection: Private Hospital Report – Round 22
Appendix A: Analysis performed to determine the minimum sample sizeIn 2012 IHPA engaged PwC to review the methodology for calculating the minimum sample size to have a valid and reliable private sector NHCDC collection. In any process where a sample is used to infer the characteristics of a population, a larger sample size will result in a lower margin of error and higher statistical confidence. This review was requested by the private sector to consider how large of a sample is required to be sufficiently representative of the population, in order to ensure the validity and reliability of the collection. The calculations were based on data received from IHPA, the Department of Health and the PHDB to determine the number of separations, number of hospitals and number of hospital groups required to participate.
The conclusion of this review based on 2012 data was:
A threshold of 60 per cent of all separations achieves a 95 per cent confidence level and 4.0 per cent acceptable margin of error.
The 95 per cent confidence level and 4.0 per cent margin of error parameters have been informed by considering participation levels in historic publications.
The collection should include approximately 90 hospitals and 10 hospitals ‘groups’ (of 2 or more hospitals) to be representative.
In previous Rounds, these participation targets were used as a strict pre-condition for the private sector NHCDC to proceed. However, starting from Round 21, these thresholds have instead been used to inform the decision on whether to proceed with a Round or not. Ultimately, the decision to proceed with the NHCDC depends on discussions between IHPA and participant hospital groups to decide what a satisfactory sample means.

National Hospital Cost Data Collection: Private Hospital Report – Round 22
Appendix B: Private sector costing approachesCosting methodologies
Hospital costing is the process of identifying the resources and inputs used during an episode and applying the costs of those inputs to the different types of clinical procedures and treatments provided to each patient in a hospital.
From Round 20, the participating hospitals have been required to undertake their own costing and during Round 20 and Round 21 they were asked to provide a summary of their costing methodology process as well as they process they used to submit the costing data. During Round 22, participating hospitals have been asked to indicate which of the costing methodologies (outlined below) they have used.
There are two main methodologies that are adopted by participants for hospital cost allocations: cost modelling or patient costing. In recent Rounds of the NHCDC, hospital groups have moved away from cost modelling to patient costing approaches, although some hospital groups continue to use cost modelling for specific cost buckets.
Patient costing: Patient costing (also known as bottom-up costing) uses activity feeder systems to provide actual resource consumption. For example, a prostheses system within a hospital will record what type of prostheses has been implanted into a patient and the cost of the implant. This data is used to allocate costs to patients from the Prostheses patient care area. Patient level costing yields results that are closer to the true cost of an encounter within a hospital, however due to the dependency on feeder systems, perfect patient level costing can be difficult to achieve.
Cost modelling: Cost modelling (also known as top down costing) takes the total admitted acute costs for patient areas (such as Wards) and allocates costs to encounters based on an assumed level of consumption using service weights. Service weights are the relative costs of a service for each type of patient care product. Service weights are applied to apportion costs to patient groups defined by their DRG (in the case of admitted acute care).
Data sources
The following categories of patient level data components are utilised during the costing process:
Financial data: This includes the general ledger cost centres and account codes, along with mapping of those cost centres to patient care areas and standardised line items. This data set excludes revenue cost centres and/or account codes.
Activity data: This includes the encounter level data (such as patient ID, encounter ID, date of birth etc.) and transfer information identifying the patient’s pathway through the hospital via transfers between areas such as operating rooms and wards.
Feeder data: This includes data that identifies patient consumption of hospital products or services within a patient care area. For example, a prostheses feeder might list the prosthetic items received by a patient and the cost of each. This feeder data is used to allocate costs in the general ledger as it identifies how much of the prostheses products each encounter consume.
Where no feeder data is available, patient care area costs are allocated using service weights.

National Hospital Cost Data Collection: Private Hospital Report – Round 22
Cost bucket or cost components
The cost of a separation of admitted acute care is reported by allocating patient level costs to a set of pre-defined cost buckets/cost components. The cost buckets are listed as follows:
1. Ward Medical2. Ward Nursing3. Non-clinical Salaries4. Pathology5. Imaging6. Allied Health
7. Pharmacy8. Critical Care9. Operating Rooms10. Supplies11. Specialist Procedure
Suites
12. On-costs13. Prostheses14. Hotel15. Depreciation16. Patient Travel
Please note that Emergency Department cost bucket is excluded for the private sector NHCDC cost buckets as this collection is for admitted acute only. Additionally, Patient Travel was newly added in Round 22 with the change to Australian Hospital Patient Costing Standards (AHPCS) version 4.0, but had no costs in it, and so was not included in the analysis.
Once each of the cost buckets were calculated for an individual patient, the patient’s total cost of care is derived as the sum of the above components.
AR-DRG grouping
All 112 hospitals submitted data costed in AR-DRG version 9.0.
Cost weights
A cost weight for a selected AR-DRG is calculated as the average cost for that DRG, expressed as a weight relative to the overall average cost across all AR-DRGs. The national cost weight across all AR-DRGs is equal to 1.00, with higher cost AR-DRGs having a cost weight higher than 1.00. The weight is an indicator of the complexity of the care of the patient and thus the resourcing intensity required. This is often referred to as the casemix of a patient or hospital.
Costing standards
Costing was performed in compliance with the AHPCS v 4.0.

National Hospital Cost Data Collection: Private Hospital Report – Round 22
Appendix C: Standard error range for the Round 22 private sector NHCDCStandard errors, reported against DRG cost weights included in Analysis of Top 20 DRGs and Appendix D: Cost weight tables by AR-DRG Version 9.0, give an indication of the reliability of cost weights. A large standard error indicates a high level of variation in the underlying sample data for that particular DRG, and therefore the cost weight presented is a less reliable estimate of the true underlying cost of a separation in that DRG.
Table 13 summarises the reliability of DRG cost weights by grouping the standard errors into a number of ranges. Numbers of DRGs and separations falling into standard error ranges provide insight into the global impact of estimation error on cost weights.
Table 13. Number of DRGs by standard error range
Standard error range
Number of DRGs
Separations Percentage of DRGs (%)
Percentage of total separations
(%)
0.000 - 0.039 280 2,986,041 36% 91%
0.040 - 0.099 182 223,263 24% 7%
0.100 - 0.149 79 42,216 10% 1%
0.150 - 0.199 49 14,543 6% 0%
0.200 - 0.399 85 20,743 11% 1%
0.400 + 96 10,374 12% 0%
Total* 771 3,297,180* 100% 100%
* The standard error for some DRGs cannot be estimated due to low separation counts in the sample.
The results above show that 60 per cent (36 per cent + 24 per cent) of DRGs have cost weight estimates with a standard error range of less than 0.1. Around 98 per cent (91 per cent + 7 per cent) of separations are within the subset of DRGs that have a standard error of less than 0.1.

National Hospital Cost Data Collection: Private Hospital Report – Round 22
Appendix D: Cost weight tables by AR-DRG Version 9.0Table 14. Round 22 (2017-18) national consolidation cost weight tables – V9.0
Please refer to Excel file for details
Intentionally left blank.

National Hospital Cost Data Collection: Private Hospital Report – Round 22
Appendix E: Cost weight tables by AR-DRG Version 8.0Table 15. Round 22 (2017-18) national consolidation cost weight tables – V8.0
Please refer to Excel file for details
Intentionally left blank.

National Hospital Cost Data Collection: Private Hospital Report – Round 22
Appendix F: Cost weight tables by AR-DRG Version 7.0Table 16. Round 22 (2017-18) national consolidation cost weight tables – V7.0
Please refer to Excel file for details
Intentionally left blank.

National Hospital Cost Data Collection: Private Hospital Report – Round 22
Appendix G: Cost weight tables by AR-DRG Version 6.0xTable 17. Round 22 (2017-18) national consolidation cost weight tables – V6.0x
Please refer to Excel file for details
Intentionally left blank.

National Hospital Cost Data Collection: Private Hospital Report – Round 22
Appendix H: Cost bucket matrixFigure 6. Cost bucket matrix
SW Nurs SW AH SW Other SW Med SW VMO GS MS Corp Imag Path Blood Phrm N_PBS
Phrm PBS Oncsts Pros Hotel Dprc B Dprc E Lease Cap Excld Pat Trav
Allied Allied Allied
Clinical Ward Nurs Allied Non Clncl
Imag Imag
Path Imag Path
Crtcl Crtcl
OR OR
Phrm Phrm
ED ED
SPS SPS
Other Serv
Non-Patient Ward Nurs Allied Non Clncl Imag
Cost Bucket Matrix
Line Items
Cost
Cen
tre
Gro
up
Path Phrm
Oncsts Dprc Excld
Non Clncl
Pat Trav
Ward Med Ward Spls
Imag ImagPath
Path Path
Ward Med Ward Spls Path Phrm
Non Clncl Non Clncl
Pros Hotel
Phrm
AlliedImag
ED ED
SPS SPS
Crtcl Crtcl
OR OR
Phrm

National Hospital Cost Data Collection: Private Hospital Report – Round 22
Independent Hospital Pricing Authority
Level 6, 1 Oxford StreetSydney NSW 2000Phone 02 8215 1100Email [email protected] @IHPAnewswww.ihpa.gov.au