Embed Size (px)
Citation preview

Differentiating Between Malignant Mesothelioma andOther Pleural Lesions Using Fourier TransformInfrared Spectroscopy
Sadiku-Zehri, Fatlinda; Gamulin, Ozren; Škrabić, Marko; Qerimi-Krasniqi, Ardita; Sedlić, Filip; Šepac, Ana; Brčić, Luka; Batelja Vuletić,Lovorka; Seiwerth, Sven
Source / Izvornik: Applied Spectroscopy, 2020, 74, 808 - 818
Journal article, Accepted versionRad u časopisu, Završna verzija rukopisa prihvaćena za objavljivanje (postprint)
https://doi.org/10.1177/0003702820924726
Permanent link / Trajna poveznica: https://urn.nsk.hr/urn:nbn:hr:105:716955
Rights / Prava: In copyright
Download date / Datum preuzimanja: 2022-03-22
Repository / Repozitorij:
Dr Med - University of Zagreb School of Medicine Digital Repository

DOI: 10.1177/0003702820924726
1
Paper type: Submitted Paper
Differentiating Between Malignant Mesothelioma and Other Pleural
Lesions Using Fourier Transform Infrared Spectroscopy
Fatlinda Sadiku-Zehri1,2, Ozren Gamulin3,4*, Marko Škrabić3,4, Ardita Qerimi-Krasniqi1,2,
FilipSedlić5, Ana Šepac6, Luka Brčić7, LovorkaBateljaVuletić6,8, Sven Seiwerth6,8
1University of Prishtina, School of Medicine, Department of Histology and Embriology,
Prishtina, Kosovo
2University Clinical Center of Kosovo, Institute of Pathology, Prishtina, Kosovo
3University of Zagreb, School of Medicine, Department of Physics and Biophysics, Zagreb,
Croatia
4Center of Excellence for Advanced Materials and Sensing Devices, Research Unit New
Functional Materials, Zagreb, Croatia
5University of Zagreb, School of Medicine, Department of Pathophysiology, Zagreb, Croatia
6University of Zagreb, School of Medicine, Department of Pathology, Zagreb, Croatia
7Medical University of Graz, Institute of Pathology, Graz, Austria
8KBC Zagreb, Clinical Department of Pathology and Cytology, Zagreb, Croatia
* Corresponding author email address: ozren@mef. hr
Abstract
Histopathology, despite being the gold standard as a diagnostic tool, does not always provide a
correct diagnosis for different pleural lesions. Although great progress was made in this field, the
problem to differentiate between reactive and malignant pleural lesions still stimulates the search
for additional diagnostic tools. Our research using vibrational spectroscopy and PCA statistical
modeling represents a potentially useful tool to approach the problem. The objective method this
paper explores is based on the correlation between different types of pleural lesions and their
vibrational spectra. Obtained tissue spectra recorded by infrared spectroscopy allowed us to
categorize spectra in different groups using a created PCA statistical model. The PCA model was
built using tissues of known pathology as the model group. The validation samples were then
used to confirm the functionality of our PCA model. Student's T-test was also used for
comparing samples in paired groups. The PCA model was able to clearly differentiate the spectra

DOI: 10.1177/0003702820924726
2
of mesothelioma, metastasis and reactive changes (inflammation), and place them in discrete
groups. Thus, we showed that FT-IR spectroscopy combined with PCA can differentiate pleural
lesions with high sensitivity and specificity. This new approach could contribute in objectively
differentiating specific pleural lesions, thus helping pathologists to better diagnose difficult
pleural samples but also could shed additional light into the biology of malignant pleural
mesothelioma.
Keywords: Pleura, mesothelioma, inflammation, metastatic adenocarcinoma, Fourier transform
infrared spectroscopy, FT-IR spectroscopy, principal component analysis, PCA
Introduction
Malignant mesothelioma is a rare tumor with extremely poor prognosis and a tendency to
increase its incidence.1,2 The challenge to objectively diagnose this type of tumor is rather huge
as histologic patterns of malignant mesothelioma can imitate the appearance of many epithelial
and nonepithelial malignancies.3 Moreover, some reactive changes of mesothelial cells can also
mimic malignant mesothelioma.3–6 Reactive mesothelial changes that can mimic malignancy can
be seen in the infection, infarction, systemic diseases, inflammatory changes, radiotherapy and
chemotherapy, liver diseases, and in secondary changes in association with primary or metastatic
tumors.7
For the time being and despite its subjectivity, histopathological evaluation remains the
golden standard in diagnostics.5,8 Immunohistochemistry is especially important in differential
diagnosis of malignant pleural mesothelioma and helps in differentiating primary from metastatic
disease, for example pulmonary adenocarcinoma.4 Standard immunohistochemical panel
includes antibodies specific to mesothelium (calretinin, thrombomodulin, WT-1, D2-40, CK 5/6,
mesothelin) and negative markers (such as CEA, TTF-1, MOC-31, Ber Ep4).9–13 A panel,
including at least two positive and two negative stains helps in identifying lesions of the
mesothelial origin.9
For pathology, the main challenge lies in differentiating between malignant and reactive
mesothelial cells. Tumor invasion into a lung or surrounding fat and muscle tissue presently
remains the only criterion of malignancy.3,9,14–16 Immunohistochemistry markers CD147 and
GLUT-1 were used to differentiate reactive from malignant mesothelial cells, and they were
shown to have sensitivity of 88.8% and 90.9% specificity.17 Recent studies have analyzed

DOI: 10.1177/0003702820924726
3
possible markers for differentiating malignant from benign mesothelial cells, like loss of BAP-1
expression by immunohistochemistry and p16 deletion by FISH, together showing high
specificity (100%) and good sensitivity representing the currently applied standard diagnostic
tool.18–23 Also, MTAP and BAP-1 immunohistochemistry in combination were shown to be
highly specific (100%) for diagnosis of malignant mesothelioma and sensitive in 90% of
cases.24,25 CD47, being a molecule that inhibits the phagocytosis, was found to be overexpressed
in malignant mesothelioma and in combination with BAP-1 was shown to be sensitive (78%) and
specific (100%) to differentiate malignant mesothelioma from reactive mesothelial cells. 26
It has recently been shown that tumor cells can be distinguished from normal counterparts by
comparing their Fourier transform infrared (FT-IR) spectra.27–29 The necessary information for
the differentiation between normal and abnormal cell and tissues is based on their biochemical
content which generates small differences in their infrared spectra (i.e., intensity, bandwidth and
spectral position of the vibrational band).30–33 On the other hand, FT-IR spectroscopy offers
many advantages in the cancer diagnosis such as simplicity, reproducibility, short procedures,
and is a relatively cost-effective process.34–36 This method was also successfully used to
distinguish other benign from malignant changes in organs such as colon, prostate, breast, cervix,
stomach, oral, liver, skin, thyroid and esophageus.37–41
The goal of our study was to evaluate FT-IR spectroscopy as an analytical method in
mesothelial proliferations and as a possible diagnostic tool in pleural pathology. Finding a new
diagnostic method should increase the diagnostic accuracy and help avoid misdiagnosis and
inadequate treatment.
Materials and Methods
Tissue Samples
In our study, we compared the spectra of tissue samples from 32 patients with different
pathology in order to identify a possible difference between them. Tissue samples of malignant
mesothelioma of the pleura (mesothelioma), pleuritis, i.e., inflammation, adenocarcinoma
metastatic to pleura (metastasis), and normal pleura were obtained from the paraffin blocks
retrieved from the archives of the Department of Pathology, University of Zagreb School of
Medicine. All used blocks originated from different patients.
Table I. Types and number of tissue samples.

DOI: 10.1177/0003702820924726
4
Tissue type Number
of
patients
Number of
sections per
patient
Sections for
histopathology evaluation
(5 µm thick)
Samples for FT-
IR (10 µm
thick)
Normal pleura 2 22 2 40
Inflammation 10 23 2 210
Mesothelioma 10 23 2 210
Metastasis 10 23 2 210
Total 32 91 8 670
As shown in Table I, 23 tissue sections were cut and prepared from each tissue block
(patient) except for the normal pleura where we had 22 sections. The cutting was done on a
sliding microtome (pfmmedical, Germany) after which the sections were placed on glass slides.
The first and the last section were 5 μm thick, while the 21 others were 10 μm thick. The first
and the last section were stained with hematoxylin and eosin (H&E) and re-examined by a
pathologist using optical microscope in order to ascertain the tissue type. On the other hand, each
of the 21 tissue sections (20 for normal pleura) from every block became a sample for FT-IR
spectroscopy hence FT-IR spectrum was recorded from all 670 samples. Samples for FT-IR
spectroscopy went through the deparaffinization process in which the removal of paraffin was
done following standard histology protocols. The standard process of deparaffinization implies
removal of paraffin from the tissue sample and rehydration of the cells. The tissue samples were
put on silicon windows, placed in thermostat (60 °C) for one hour and deparaffinized by a
standard procedure according to Bancroft et al.42 (xylene, alcohol, distilled water). Then, the
samples were placed in vacuum for 60 minutes to extract remaining water since FT-IR spectra
are sensitive to it (removing excess water from tissue, not from the cells) and thereafter their IR
spectra were recorded.
FT-IR Spectroscopy
Vibrational spectra of the samples were recorded with PerkinElmer Spectrum GX spectrometer
equipped with liquid N2 refrigerated mercury–cadmium–telluride (MCT) detector. Optical grade

DOI: 10.1177/0003702820924726
5
silicon windows were used for acquiring 1000 scan background, which was automatically
subtracted from tissue spectra. 100 scans were recorded for each tissue section in order to obtain
the vibrational spectra, which lasted around 5 min. for each sample. Data were acquired in 450–
4000 cm–1 spectral range, in transmission mode with a resolution of 4 cm–1. The sample area
with diameter of ~1 cm was recorded at once. The resulting spectrum was a sum of contributions
of all the tissues in the sample area with characteristics depending on the relative contributions of
those tissues (i.e., different relative concentration of standard molecules existing in every
biological material).
Data Analysis
The software Kinetics, running under Matlab R2010b (The Mathworks Inc.), was used for
processing the spectra.30 First, all recorded spectra were baseline corrected and normalized using
the peak at 1646 cm–1 (amide I) at to exclude possible differences caused by the variations in
recording conditions. Baseline of the spectra was determined by the lowest characteristic points
along the spectrum; straight lines were interpolated between the selected points and then
subtracted from the spectrum.43,44 Baseline correction and normalization are relevant
preprocessing techniques for FT-IR spectra which create a linear correlation between absorbance
and concentration. Many physical and chemical factors, like sample size, humidity, interferents,
molecular interactions etc., can affect this correlation. The preprocessing techniques compensate
the deviations from linear relationships and intensify the relationship between the spectral signals
and concentrations of the analytes, although preprocessing corrections lead to slight changes of
the raw spectra.
The Matlab R2010b and PLS_Toolbox (Eigenvector Research) were used to perform the
principal component analysis (PCA). PCA is an unsupervised statistical method which reduces
the multidimensional experimental data set to a much smaller number of uncorrelated variables
called principal components.45 Usually, only the first two principal components, PC1 and PC2,
which account for most of the variance presented in the experimental data, are utilized in
majority of applications. Whole mid-IR spectra (4000–450 cm–1) were used for the PCA. Also,
we used an advanced preprocessing method, generalized least squares weighting (GLSW), which
is commonly utilized to identify the unwanted covariance structure (i.e., how variables change
together) and remove these sources of variance from the data prior to calibration or prediction.46–

DOI: 10.1177/0003702820924726
6
49 In our analysis, the application of GLSW was necessary in order to minimize the differences
between spectra recorded during the prolonged period of time (e.g., possible variations in
recording conditions such as humidity) and to remove information from the inter-referring
compounds without losing relevant tissue type-related variability among the data (e.g., removing
the differences caused by different subtypes inside all three investigated pathological tissue types
and emphasizing the true spectral differences between these tissue types). Then, using PCA we
made a quantitative model, which was used to identify unknown tissue samples by their FT-IR
spectra. Based on the presented model, new undetermined samples can be checked in order to
establish whether they belong to a certain group of pleural changes. The Venetian blind method,
in which the program autonomously selects N number of sets with M number of spectra, which
are excluded from the modelling set and then used for prediction of the modelling set was chosen
for the cross-validation. The cross-validation has been performed for both the models; in the first
created PCA model, the cross-validation is mainly used for the determination of number of
principal components by calculating errors, while in the second PCA model (used for
prediction), the cross-validation assesses the ability of the model to predict the testing set spectra
position in PC1-PC2 space, i.e., determine the unknown tissue type.
To overcome the possible problem of overfitting, two additional classification algorithms
were applied: partial least squares discriminate analysis (PLS-DA) (PLS Toolbox) and k-nearest
neighbor (KNN) algorithm (RapidMiner).50 For both procedures leave-one-out cross validation
was utilized.
Another statistical method used to evaluate differences between studied groups was
Student’s T-test (STT). To obtain the difference spectra, the mean spectrum of one sample group
was subtracted from the mean spectrum of the another group, in six combinations. Student’s T-
test was used to analyze the difference spectra in the manner that each wavenumber was
examined to determine if the difference in intensity between mean spectra of two tissues is
statistically significant.
Results
Histopathologic Evaluation
In our samples, selected from the archive of the Department of Pathology, University of Zagreb
School of Medicine, the original histopathologic diagnoses were based on morphology and

DOI: 10.1177/0003702820924726
7
immunohistochemical (IHC) analysis. For the purpose of this study the material was reviewed
and the histopathological diagnosis was confirmed by one of the authors (SS) and ascertained by
clinico-pathological and radiological correlation as well as follow up. In order to assure tissue
quality and presence of given morphology the first and the last section of all selected paraffin
blocks were stained with H&E and reviewed by a pathologist.
Figure 1. H&E staining. (a) normal pleura, (b) inflammation, (c) metastasis, and (d)
mesothelioma. (e) A representative photograph of the sample’s sizes.
The studied mesothelioma samples consisted of six epithelioid type, three sarcomatoid type, and
one biphasic type. Metastasis samples originated from lungs (seven samples), colon (one sample), and
kidney-clear cell (two samples). Tumor tissue in all samples from lungs consisted of atypical cylindrical
to cuboid epithelial cells, forming regular to irregular glandular structures. Also the metastatic tumor
tissue from colon consisted of glandular structures, while samples from kidney are composed of atypical
epithelial clear cells forming closed lumens. In addition, all the tumors (metastatic and primary) were
proven by immunohistochemically workup according to standard diagnostic guidelines. In our study, all
inflammatory diseases of pleura samples were chronic inflammation including four samples of
granulomatous pleuritis with giant cells. Normal pleural tissue samples were from visceral pleura, without
lung tissue and prepared in a swiss role fashion (as seen in Figure 1a). A representative photograph of the
sizes of the sample, which were almost all smaller than a beam diameter, is shown in Figure 1e.

DOI: 10.1177/0003702820924726
8
Table II. Histopathology diagnosis (number of cases).
Tissue types Histopathology diagnosis and number of cases
Normal pleura Normal tissue (2)
Inflammation Chronic inflammation (6) Granulomatous pleuristis (4)
Mesothelioma Epitheloid (6) Sarcomatoid (3) Biphasic (1)
Metastatis From lung (7) From colon (2) Clear cell type (1)
FT-IR Spectra
The infrared spectra of the studied tissues are complex, consisting of many spectral bands due to the
presence of macromolecules (lipids, proteins, polysaccharides and nucleic acids). These tissues absorb the
infrared light mostly in the two spectral regions: 800–1800 cm–1 and 2800–3700 cm–1. The diameter of
infrared light beam that passed through our tissue samples was 1 cm, hence everything that was in the
field of 1 cm diameter of every sample was recorded in a FT-IR spectrum. As tumor samples are
heterogenous in their composition, every compound of every sample gave its contribution to the recorded
spectra.51–53 As an example of the aforementioned complexity, the mean spectra of all four tissue types are
presented in Figure 2. Each mean spectrum was calculated from 210 spectra of the same tissue type
except for the normal pleura which was calculated from 40 recorded spectra. Generally, IR spectra of
almost all tissues are rather similar, which is also visible in Figure 2. where very small and inconclusive
spectral difference can be noticed. Hence, in order to recognize differences between different pathologies
and possibly separate samples into discrete groups, more powerful statistical analyses are needed.

DOI: 10.1177/0003702820924726
9
Figure 2. Mean spectra from four groups of samples. Lines of different color represent different group:
red: inflammation, blue: mesothelioma; yellow: metastasis; green: normal pleura.
Student’s T-Test on FT-IR Spectra
Since the differences between mean spectra of four groups of samples on Figure 2 are not clearly
visible, we performed Student’s T-test (STT) on all six possible pairs of mean spectra of
different tissue types: metastasis-mesothelioma, metastasis-inflammation, metastasis-pleura,
mesothelioma-inflammation, mesothelioma-pleura, and inflammation-pleura. Significance level
of p <0.01 was used for all combinations. STT calculates statistically significant difference
between intensities in mean spectra of the two tissue groups at each wavenumber.44,54
DOI: 10.1177/0003702820924726
10
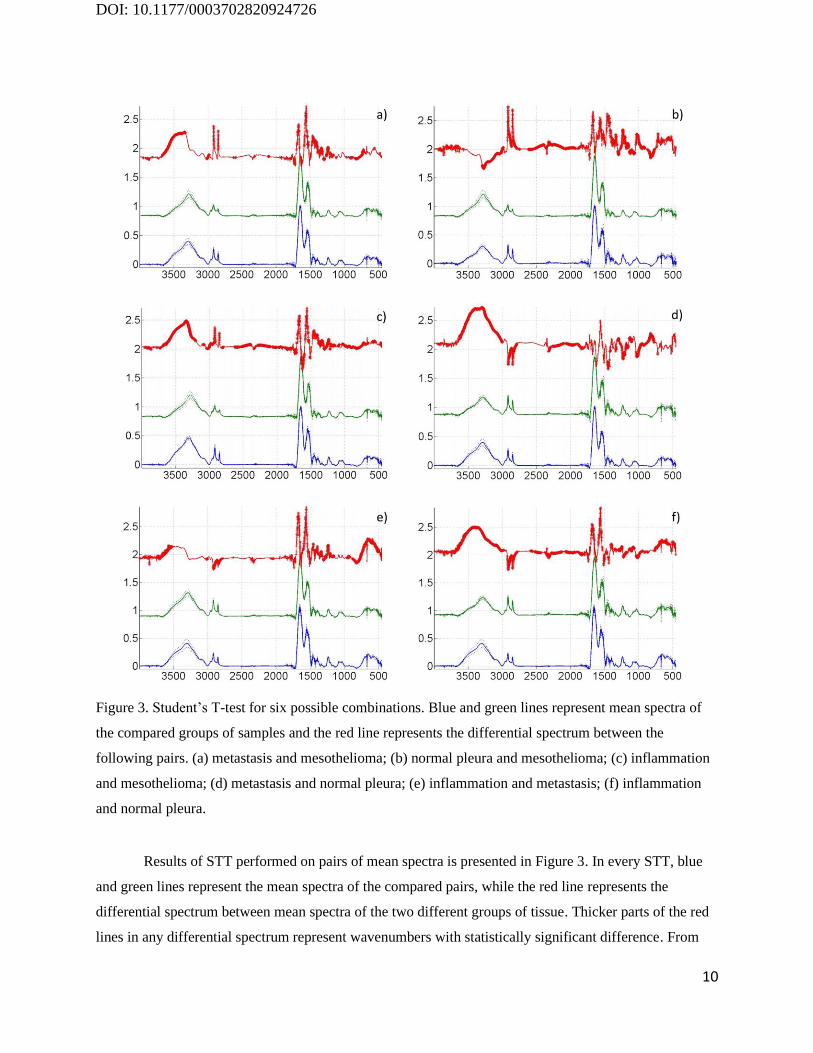
Figure 3. Student’s T-test for six possible combinations. Blue and green lines represent mean spectra of
the compared groups of samples and the red line represents the differential spectrum between the
following pairs. (a) metastasis and mesothelioma; (b) normal pleura and mesothelioma; (c) inflammation
and mesothelioma; (d) metastasis and normal pleura; (e) inflammation and metastasis; (f) inflammation
and normal pleura.
Results of STT performed on pairs of mean spectra is presented in Figure 3. In every STT, blue
and green lines represent the mean spectra of the compared pairs, while the red line represents the
differential spectrum between mean spectra of the two different groups of tissue. Thicker parts of the red
lines in any differential spectrum represent wavenumbers with statistically significant difference. From

DOI: 10.1177/0003702820924726
11
STT results presented in Figure 3, it is possible to assess the spectral regions that contribute most to the
spectra differences between tissue types. Based on literature, vibrational bands present in FT-IR spectra of
a biological tissue are listed in Table III.31,55,56 Student`s T-test indicated the existence of certain
statistically significant difference between the spectra of different pathologies which opened the
possibility to use multivariable methods for tissue type differentiation.
Table III. Band assignments in FT-IR spectra of biological tissues.31,55,56
Wavenumber (cm–1)
Assignment
3611 O–H and N–H stretching vibrations
3500–3600 OH bonds
3401 O–H and N–H stretching vibrations
3396 O–H asymmetric stretching
3330 N–H asymmetric stretching
3300 Amide A bands sterning from N–H stretching modes in proteins and acid
nucleic
3008 Olefinic–CH stretching vibration: unsaturated lipids, cholesterol esters
1630–1670 Amide I, peptide, protein
1515–1570 Amide II, peptide, protein
1468 CH2 scissoring: lipids
1453 CH2 bending: mainly lipids with little contribution from proteins
1400 COO– symmetric stretching: fatty acids
1343 CH2 wagging: phospholipid fatty acid, triglyceride, amino acid side
chains
1238 PO2– asymmetric stretching fully hydrogen-bonded: mainly nucleic acids
with little contribution from phospholipids
968 C–N+– –C stretch: nucleic acids, ribose–phosphate main chain vibrations
of RNA–DNA
933 Z-type DNA
915 Ribose ring vibrations: RNA–DNA
868 Left-handed helix DNA (Z form)

DOI: 10.1177/0003702820924726
12
Principal Component Analysis
Observed differences in Figure 3 indicated a possibility to build a PCA model which might be
able to distinguish between three investigated pathological tissue types and may identify spectra
of unknown pathologies.45 FT-IR spectra of biological samples are often very similar and
important differences are covered with noise and spectral changes caused by small but
unavoidable sample preparation variations. Therefore, statistical analysis must be used to
recognize spectral changes due to the treatment or disease.
For the purpose of this research we created the PCA model from the recorded spectra in
order to identify pathological tissue types. Figure 4 shows the scatterplot of PCA scores for the
two first principal components of all recorded spectra from four groups: mesothelioma,
metastasis, inflammation, and normal pleura. It is obvious that obtained data, which includes
differences in intensity, bandwidth, and position of the vibrational band between spectra, are able
to create a model that classifies unknown tissue samples into categories of different pathologies.

DOI: 10.1177/0003702820924726
13
Figure 4. PC1-PC2 scatterplot as a result of PC analysis with all recorded spectra. Blue squares represent
spectra of the mesothelioma, green stars represent the spectra of metastases, red triangles are
inflammation spectra and light blue crosses are spectra of normal pleura.
Although there is not a clear distinction between the mean spectra of four groups of
samples plotted in Figure 2, the difference between individual FT-IR spectra is visible after the
application of PCA. As seen in Figure 4, in the PC1-PC2 principal component space, there is a
difference between FT-IR spectra recorded from samples of mesothelioma, metastasis,
inflammation, and normal pleura, hence it is possible to distinguish between four groups of
tissues. Few spectra that overlap or fall into proximity of other groups do not change
successfulness of presented PCA model. Reasons for overlapping spectra between two different
tissue groups are probably small differences in recording conditions or sampling procedure.
Nevertheless, their number is small and those spectra can be excluded from the model without

DOI: 10.1177/0003702820924726
14
further consequences on the model precision. Number of problematic spectra can also be reduced
by more precise defining of sample preparation and spectra recording procedure.
Unknown Sample Spectra Identification and Model Validation
In the final step, we validated the accuracy of our model in identification of the unknown
samples. For that purpose, a new model was made using only three pathological tissue groups
which pose differential diagnostic problems, i.e., normal pleura was excluded from the model.
Figure 5. PC1-PC2 scatterplot of the PCA model without spectra of normal pleura and the
validation of the model. Green star: metastasis (model spectra); white rhombuses: identified
metastasis (validation spectra); blue square: mesotheliomas (model spectra); purple triangles:
identified mesothelioma (validation spectra); red triangles: inflammation (model spectra);
turquoise crosses: identified inflammation (validation spectra).

DOI: 10.1177/0003702820924726
15
The model used for identification of unknown samples was built with 150 randomly
chosen spectra from each tissue group. The rest of spectra, 60 from each group, were used for
model validation.57 In Figure 5, which presents distribution of PC scores in the PC1-PC2 space,
the new model validated by the total of 180 spectra recorded from mesothelioma, metastasis and
inflammation of pleura is shown. Spectra used to create the PCA model are grouped in three
separated regions in Figure 5, with one region for each tissue type. Every region is encircled by
an ellipse surrounding the area where 95% of spectra of the same tissue type are placed. Inside
those regions, symbols representing spectra used for modeling are found: Blue squares for
mesothelioma samples, red triangles for inflammation samples, and green stars for metastasis
samples. Validation spectra, also visible on Figure 5, are shown with purple triangles for
mesotheliomas, turquoise crosses for inflammation and white rhombuses representing metastasis.
Spectra used for model validation are also surrounded by an ellipse with specific color
representing the region of particular sample type with color matching the color of the sample
symbols. As can be seen, samples of the same, identified pathologies are grouped together and
their groups are overlapping with region of the graph were modeling spectra are placed, showing
that validation spectra were correctly identified. Although the region of the inflammation
identifiers is wider than the others, only small number of spectra are overlapping with the region
of metastatic tumors (only two from 210 spectra from metastasis). Furthermore, more than 90%
of the spectra from inflammation group are placed inside the inflammation region of the graph.
Sample heterogeneity or different type of sample inflammation might be the possible reasons for
wider spread of inflammation spectra in the PC1-PC2 space. Thus we can infer that the new
model, built from randomly chosen spectra was validated with more than 95% certainty. This
model allows us to add more new recorded spectra of pleural lesions and those spectra will be
identified by the model as being either mesothelioma, metastasis or inflammatory (reactive)
changes. Since the model validation with the randomly chosen testing set implies that the
samples from the same patients are used both in training and testing set, the possibility of false
positive results is increased. In order to verify our results two different procedures were
executed. In the first procedure a new testing set, created by extracting spectra recorded on
samples from two random patients from every tissue group, was made and the PCA modelling
and validation procedure was repeated yielding almost the same results (data not shown).

DOI: 10.1177/0003702820924726
16
Second, we used two new algorithms for model training: PLS-DA and KNN. The results
obtained by these algorithms are presented in form of the two confusion matrices given in Table
IV. Both algorithms exhibit extremely high accuracy confirming the correctness and
demonstrating the viability of our PCA model.
Table IV. Obtained confusion matrices for the PLS-DA and KNN algorithms.
PLS-DA Class 1 Class 2 Class 3
Predicted as Class 1 205 1 0
Predicted as Class 2 3 208 1
Predicted as Class 3 1 0 206
KNN Class 1 Class 2 Class 3
Predicted as Class 1 189 42 1
Predicted as Class 2 19 153 12
Predicted as Class 3 1 14 194
Discussion
Discriminating between different types of pleural lesions still remains a diagnostic challenge
because of their often non-specific or overlapping histopathological appearance.3–6 Also, despite
significant progress in the field so far, there is no specific stain that can ensure the definitive
differential diagnosis between different types of reactive and malignant changes.16 PCA model
presented in this article is a promising objective approach for their potential differentiation.
Model and its validation are shown in Figure 5, in which it is visible that spectra from which
model was made are clearly separated into three groups. Moreover, most of the spectra fall intoa
smallerellipse which surrounds 95% of the same tissue type. Validation spectra are also grouped
in the same areas, except there is a slight overlap between inflammation and metastasis
validation group even though their overall separation is still very good. Furthermore, there is no
overlapping of validation spectra between mesothelioma and metastasis group and between
mesothelioma and inflammation group. From Figure 5 we estimate that PCA model accurately
identified more than 95% of all validation spectra. For the current model the whole FT-IR
spectra was used, while, as seen from STT (Figure3), not all parts of spectra equally contribute to
the spectral differences. We assume that somefuture model can be improved by using only

DOI: 10.1177/0003702820924726
17
relevant parts of the spectra. Also, certain scattering of the spectra on PCA score graph (Figure
5) can be ascribed to small differences in sample preparation and recording conditions. That can
be reduced if the details of FT-IR recording procedure are standardized. However, the presented
model is already very successful in recognizing changes in pleural tissueand provides a new
approach for tackling challenges in differential diagnostics.
As mentioned earlier, 10 blocks per tissue type were used in our experiment and each
block was cut in 21 tissue sections (20 tissue sections for normal pleura). Consequently, more
than 200 sections were produced for each tissue type hence our study altogeteher analysed 670
spectra form 670 tissue sections. For PCA modeling, each tissue section can be considered as a
separate sample because of the small molecular inhomogeneitieswithin each tissue block. As can
be seen from validation process (Figure 5), the model built with this assumption is successful.
Moreover, if the differences between blocks of the same tissue were significant, additional
groups of spectra within a single tissue group, i.e., pathology would appear in both Figures 4 and
5. Since there are no additional groups, we can safely assume that each section behaves asa
distinct sample of the same tissue type. In this article we showed that this kind of approach to
tissue type and pathological changesidentification is possible. For clinical application a model
with tissue spectra from more patients must be built, so our next step will be to test this model on
a larger patient cohort.
In ourfinal model (Figure 5) spectra recorded on healthy pleura samples were excluded
due to several reasons. First, normal pleura is very thin and amount of tissue collected during the
diagnostic procedure is rather small therebymaking it hard to produce samples with recordable
infrared absorption. Second, normalpleura tissue can also be easily distinguished from
pathological tissues using conventional methods, hence a special model for that purpose is not
needed. Third, the PCA model can be successfully built without normal pleura because the
distribution of pathological tissue spectra in the PC1-PC2 space does not depend on the spectra
of normal pleura. Comparing the spectra distribution of in the PCA model where only
pathologically changed tissue was used (Figure 5) and the one where normal pleura was included
(Figure 4), it is obvious that relative positions of pathological spectra groups and their
distributions are similar, suggesting that omission of the normal pleura group is an acceptable
simplification. Furthermore, Figure 4 also shows a visible difference between three pathological

DOI: 10.1177/0003702820924726
18
and one healthy tissue type and it is obvious that spectra from normal pleura formed a separated
group, which shows the indubitable spectroscopical difference from the other tissue types.
Preparation of samples for histopathology examination and the need for complex
immunohistochemistry analysis is time-consuming and rather expensive. After the PCA model is
built, the amount of time necessary for the analysis of new unknown samples is very short,
approximately 30 minutes for the complete procedure which is performed on unstained formalin-
fixed paraffin-embedded sections. So FT-IR combined with the PCA modellingpromises to
eventually be cost-effective and time-saving in comparison to the standard histopathological
procedures.
The motivation behind this study was to create an objective method which makes it
possible to distinguish between three most common types of pathological pleura tissues with
accuracy at least comparable to standard pathological methods. Results showed that
spectroscopic differences between pleural pathological tissues can be observed and used for their
recognition utilizing PCA modeling. We also noticed that certain parts of spectra have stronger
contribution to spectra separation in created PCA model. That fact will be used in our future
work in order to detect which molecules undergo biochemical changes caused by certain disease.
Conclusion
From our results, we can conclude that FT-IR spectroscopy combined with PCA is very sensitive
and can clearly distinguish different types of pleural lesions. FT-IR spectra of different pathology
tissues were recorded followed by STT and PCA modeling which confirmed the existence of
spectral difference between samples. Then, validation of the created PCA model showed that its
accuracy is higher than 95%. This work indicates that FT-IR spectroscopy combined with PCA
could represent a valuable tool in analyzing the still challenging problem of mesothelioma
diagnosis although additional spectra of tissue samples should be recorded with more precise
recording protocols in order to build a reliable clinical model.
Acknowledgments
This article was partially supported by the Croatian Science Foundation grant 4173
Reprogramiranje citoprotektivnih puteva u mezoteliomu [Reprograming of cytoprotective
pathways in malignant mesothelioma], by the Croatian Science Foundation under the project (IP-

DOI: 10.1177/0003702820924726
19
2014-09-7046) and also by the project co-financed by the Croatian Government and the
European Union through the European Regional Development Fund—the Competitiveness and
Cohesion Operational Programme (KK. 01.1.1.01.0001).
Declaration of Conflicting Interests
The authors declare that they have no conflict of interests.
References
1. B.W.S. Robinson, R.A. Lake. "Advances in Malignant Mesothelioma". N. Engl. J. Med. 2005.
353(15): 1591–603.
2. M. Dogan, G. Utkan, C. Hocazade, D. Uncu, et al. "The Clinicopathological Characteristics
with Long-Term Outcomes in Malignant Mesothelioma". Med. Oncol. 2014. 31(10): 232.
3. K.J. Butnor. "My Approach to the Diagnosis of Mesothelial Lesions". J. Clin. Pathol. 2006.
59(6): 564–574.
4. T.C. Allen. "Recognition of Histopathologic Patterns of Diffuse Malignant Mesothelioma in
Differential Diagnosis of Pleural Biopsies". Arch. Pathol. Lab. Med. 2005. 129(11):
1415–1420.
5. K. Kadota, K. Suzuki, C.S. Sima, V.W. Rusch et al. "Pleomorphic Epithelioid Diffuse
Malignant Pleural Mesothelioma: A Clinicopathological Review and Conceptual
Proposal to Reclassify as Biphasic or Sarcomatoid Mesothelioma". J. Thorac. Oncol.
2011. 6(5): 896–904.
6. S. A. Sahn. "Pleural Diseases Related to Metastatic Malignancies". Eur. Respir. J. 1997. 10(8):
1907–1913.
7. H.A. Saleh, M. El-Fakharany, H. Makki, A. Kadhim, S. Masood. "Differentiating Reactive
Mesothelial Cells from Metastatic Adenocarcinoma in Serous Effusions: The Utility of
Immunocytochemical Panel in the Differential Diagnosis". Diagn. Cytopathol. 2009.
37(5): 324–332.
8. R.K. Dukor. "Vibrational Spectroscopy in the Detection of Cancer". In: P.R. Griffiths, J.M.
Chalmers, editors. Handbook of Vibrational Spectroscopy. New Jersey: John Wiley and
Sons. 2006.

DOI: 10.1177/0003702820924726
20
9. W.D. Travis, E. Brambilla, A.P. Burke, A. Marx, A.G. Nicholson. WHO Classification of
Tumours of the Lung, Pleura, Thymus, and Heart. Lyon: International Agency for
Research on Cancer, 2015.
10. J.K. Trupiano, K.R. Geisinger, M.C. Willingham, P. Manders, et al. "Diffuse Malignant
Mesothelioma of the Peritoneum and Pleura, Analysis of Markers". Mod. Pathol. 2004.
17(4): 476–481.
11. H. Kitazume, K. Kitamura, K. Mukai, Y. Inayama, et al. "Cytologic Differential Diagnosis
Among Reactive Mesothelial Cells, Malignant Mesothelioma, and Adenocarcinoma:
Utility of Combined E-Cadherin and Calretinin Immunostaining". Cancer. 2000. 90(1):
55–60.
12. C.E. Comin, L. Novelli, V. Boddi, M. Paglierani, S. Dini. "Calretinin, Thrombomodulin,
CEA, and CD15: A Useful Combination of Immunohistochemical Markers for
Differentiating Pleural Epithelial Mesothelioma from Peripheral Pulmonary
Adenocarcinoma". Hum. Pathol. 2001. 32(5): 529–536.
13. E. Politi, C. Kandaraki, C. Apostolopoulou, T. Kyritsi, H. Koutselini. "Immunocytochemical
Panel for Distinguishing Between Carcinoma and Reactive Mesothelial Cells in Body
Cavity Fluids". Diagn. Cytopathol. 2005. 32(3): 151–155.
14. T. Kawai, M. Suzuki, K. Kageyama. "Reactive Mesothelial Cell and Mesothelioma of the
Pleura". Virchows Arch. A. 1981. 393(3): 251–263.
15. P.T. Cagle, A. Churg. "Differential Diagnosis of Benign and Malignant Mesothelial
Proliferations on Pleural Biopsies". Arch. Pathol. Lab. Med. 2005. 129(11): 1421–1427.
16. A.N. Husain, T.V. Colby, N.G. Ordóñez, T.C. Allen, et al. "Guidelines for Pathologic
Diagnosis of Malignant Mesothelioma 2017 Update of the Consensus Statement from the
International Mesothelioma Interest Group". Arch. Pathol. Lab. Med. 2018. 142(1): 89–
108.
17. C. Pinheiro, A. Longatto-Filho, T.R. Soares, H. Pereira, et al. "CD147
Immunohistochemistry Discriminates Between Reactive Mesothelial Cells and Malignant
Mesothelioma". Diagn. Cytopathol. 2012. 40(6): 478–483.
18. J. Andrici, A. Sheen, L. Sioson, K. Wardell, et al. "Loss of Expression of BAP1 is a Useful
Adjunct, which Strongly Supports the Diagnosis of Mesothelioma in Effusion Cytology".
Mod. Pathol. 2015. 28(10): 1360–1368.

DOI: 10.1177/0003702820924726
21
19. B.S. Sheffield, H.C. Hwang, A.F. Lee, K. Thompson, et al. "BAP1 Immunohistochemistry
and P16 FISH to Separate Benign from Malignant Mesothelial Proliferations". Am. J.
Surg. Pathol. 2015. 39(7): 977–982.
20. M. Cigognetti, S. Lonardi, S. Fisogni, P. Balzarini, et al. "BAP1 (BRCA1-Associated Protein
1) is a Highly Specific Marker for Differentiating Mesothelioma from Reactive
Mesothelial Proliferations". Mod. Pathol. 2015. 28(8): 1043–1057.
21. T. Hida, M. Hamasaki, S. Matsumoto, A. Sato, et al. "BAP1 Immunohistochemistry and P16
FISH Results in Combination Provide Higher Confidence in Malignant Pleural
Mesothelioma Diagnosis: ROC Analysis of the Two Tests". Pathol. Int. 2016. 66(10):
563–570.
22. S. Monaco, M. Mehrad, S. Dacic. "Recent Advances in the Diagnosis of Malignant
Mesothelioma: Focus on Approach in Challenging Cases and in Limited Tissue and
Cytologic Samples". Adv. Anat. Pathol. 2018. 25(1): 24–30.
23. T. Matsubara, G. Toyokawa, Y. Yamada, K. Nabeshima, et al. "A Case of the Resected
Lymphohistiocytoid Mesothelioma: BAP1 is a Key of Accurate Diagnosis". Anticancer
Res. 2017. 37(12): 6937–6941.
24. T. Hida, M. Hamasaki, S. Matsumoto, A. Sato, et al. "Immunohistochemical Detection of
MTAP and BAP1 Protein Loss for Mesothelioma Diagnosis: Comparison with 9p21
FISH and BAP1 Immunohistochemistry". Lung Cancer. 2017. 104: 98–105.
25. K.B. Berg, S. Dacic, C. Miller, S. Cheung, A. Churg. "Utility of Methylthioadenosine
Phosphorylase Compared with BAP1 Immunohistochemistry, and CDKN2A and NF2
Fluorescence in Situ Hybridization in Separating Reactive Mesothelial Proliferations
from Epithelioid Malignant Mesotheliomas". Arch. Pathol. Lab. Med. 2018. 142(12):
1549–1553.
26. C.M. Schürch, S. Forster, F. Brühl, S.H. Yang, et al. "The 'Don’t Eat Me' Signal CD47 is a
Novel Diagnostic Biomarker and Potential Therapeutic Target for Diffuse Malignant
Mesothelioma". Oncoimmunology. 2017. 7(1): E1373235.
27. R. Gasper, G. Vandenbussche, E. Goormaghtigh. "Ouabain-Induced Modifications of
Prostate Cancer Cell Lipidome Investigated with Mass Spectrometry and FT-IR
Spectroscopy". Biochim. Biophys. Acta. 2011. 1808(3): 597–605.

DOI: 10.1177/0003702820924726
22
28. R. Gasper, E. Goormaghtigh. "Effects of the Confluence Rate on the FT-IR Spectrum of PC-
3 Prostate Cancer Cells in Culture". Analyst. 2010. 135(12): 3048–3051.
29. J. Sule-Suso, N.R. Forsyth, V. Untereiner, G.D, Sockalingum. "Vibrational Spectroscopy in
Stem Cell Characterisation: is There a Niche?" Trends Biotechnol. 2014. 32(5): 254–262.
30. S. Rak, T. De Zan, J. Stefulj, M. Kosović, et al. "FT-IR Spectroscopy Reveals Lipid Droplets
in Drug Resistant Laryngeal Carcinoma Cells Through Detection of Increased Ester
Vibrational Bands Intensity". Analyst. 2014. 139(13): 3407–3415.
31. Z. Movasaghi, S. Rehman, I. Rehman. "Fourier Transform Infrared (FT-IR) Spectroscopy of
Biological Tissues". Appl. Spectrosc. Rev. 2008. 43(2): 134-179.
32. A.I. Mazur, J.L. Monahan, M. Miljković, N. Laver, et al. "Vibrational Spectroscopic
Changes of B-Lymphocytes Upon Activation. J. Biophotonics. 2013. 6(1): 101–109.
33. A.L. Mitchell, K.B. Gajjar, G. Theophilou, F.L. Martin, P.L. Martin-Hirsch. "Vibrational
Spectroscopy of Biofluids for Disease Screening or Diagnosis: Translation from the
Laboratory to a Clinical Setting". J. Biophotonics. 2014. 7(3–4): 153–165.
34. Q.B. Li, X.J. Sun, Y.Z. Xu, L.M. Yang, et al. "Diagnosis of Gastric Inflammation and
Malignancy in Endoscopic Biopsies Based on Fourier Transform Infrared Spectroscopy".
Clin. Chem. 2005. 51(2): 346–350.
35. R.K. Sahu, S. Mordechai. "The Increasing Relevance of FT-IR Spectroscopy in
Biomedicine". J. Med. Phys. Appl. Sci. 2015. 1(1): 1–3.
36. H.P. Wang, H.C. Wang, Y.J. Huang. "Microscopic FT-IR Studies of Lung Cancer Cells in
Pleural Fluid". Sci. Total Environ. 1997. 204(3): 283–287.
37. D. Sheng, F. Xu, Q. Yu, T. Fang, et al. "A Study of Structural Differences Between Liver
Cancer Cells and Normal Liver Cells Using FT-IR Spectroscopy". J. Mol. Struct. 2015.
1099: 18–23.
38. M. Wu, W. Zhang, P. Tian, X. Ling, Z.B. Xu. "Intraoperative Diagnosis of Thyroid Diseases
by Fourier Transform Infrared Spectroscopy Based on Support Vector Machine". Int. J.
Clin. Exp. Med. 2016. 9(2): 2351–2358.
39. C.A. Lima, V.P. Goulart, L. Côrrea, T.M. Pereira, D.M. Zezell. "ATR-FT-IR Spectroscopy
for the Assessment of Biochemical Changes in Skin Due to Cutaneous Squamous Cell
Carcinoma". Int. J. Mol. Sci. 2015. 16(4): 6621–6630.

DOI: 10.1177/0003702820924726
23
40. P.D. Lewis, K.E. Lewis, R. Ghosal, S. Bayliss, et al. "Evaluation of FT-IR Spectroscopy as a
Diagnostic Tool for Lung Cancer Using Sputum". BMC Cancer. 2010. 10: 640.
41. M. Dimitrova, D. Ivanova, I. Karamancheva, A. Milev, I. Dobrev. "Application of FT-IR-
Spectroscopy for Diagnosis of Breast Cancer Tumors". J. Univ. Chem. Technol. Metall.
2009. 44(3): 297–300.
42. J.D. Bancroft, C. Layton, S. Kim Suvarna. "Tissue Processing". In: S. Kim Suvarna, C.
Layton, J.D. Bancroft, editors. Bancroft's Theory and Practice of Histological
Techniques. London: Elsevier Ltd., 2018. Chap. 6, Pp. 73–138.
43. D.-W. Sun. "Fundamentals and Instruments". Infrared Spectroscopy for Food Quality
Analysis and Control. Amsterdam: Elsevier Inc., 2009. Chap. 1, Pp. 1–174.
44. A. Gaigneaux, J.M. Ruysschaert, E. Goormaghtigh. "Cell Discrimination by Attenuated Total
Reflection-Fourier Transform Infrared Spectroscopy: The Impact of Preprocessing of
Spectra". Appl. Spectrosc. 2006. 60(9): 1022–1028.
45. S. Wold, K. Esbensen, P. Geladi. "Principal Component Analysis". Chemom. Intell. Lab.
Syst. 1987. 2: 37–52.
46. H. Martens, M. Høy, B.M. Wise, R. Bro, P.B. Brockhoff. "Pre-Whitening of Data by
Covariance-Weighted Pre-Processing". J. Chemom. 2003. 17(3): 153–165.
47. U.K. Acharya, K.B. Walsh, P.P. Subedi. "Robustness of Partial Least-Squares Models to
Change in Sample Temperature: I. A Comparison of Methods for Sucrose in Aqueous
Solution". J. Infrared Spectrosc. 2014. 22(4): 279–286.
48. C.S. Silva, M.F. Pimentel, J.M. Amigo, C. García-Ruiz, F. Ortega-Ojeda. "Chemometric
Approaches for Document Dating: Handling Paper Variability". Anal. Chim. Acta. 2018.
1031: 28–37.
49. M.G. Nespeca, G.B. Piassalonga, J.E. De Oliveira. "Infrared Spectroscopy and Multivariate
Methods as a Tool for Identification and Quantification of Fuels and Lubricant Oils in
Soil". Environ. Monit. Assess. 2018. 190(2): 72.
50. I. Mierswa, M. Wurst, R. Klinkenberg, M. Scholz, T. Euler. "YALE: Rapid Prototyping for
Complex Data Mining Tasks". In: Proceedings of the 12th ACM SIGKDD International
Conference on Knowledge Discovery and Data Mining. 2006. Pp. 935–940. DOI:
10.1145/1150402.1150531.

DOI: 10.1177/0003702820924726
24
51. N. McGranahan, C. Swanton. "Biological and Therapeutic Impact of Intratumor
Heterogeneity in Cancer Evolution". Cancer Cell. 2015. 27(1): 15–26.
52. M. Gerlinger, A.J. Rowan, S. Horswell, J. Larkin, et al. "Intratumor Heterogeneity and
Branched Evolution Revealed by Multiregion Sequencing". N. Engl. J. Med. 2012.
366(10): 883–892.
53. F. Vuletić, V. Zajec, L.B. Vuletić, S. Seiwerth. "Intratumoral Heterogeneity". Diagn. Pathol.
2018. 4(1). DOI: 10.17629/www.diagnosticpathology.eu-2018-4:257.
54. R. Gasper, J. Dewelle, R. Kiss, T. Mijatovic, E. Goormaghtigh. "IR Spectroscopy as a New
Tool for Evidencing Antitumor Drug Signatures". Biochim. Biophys. Acta. 2009. 1788:
1263–1270.
55. N.S. Ozek, S. Tuna, A.E. Erson-Bensan, F. Severcan. "Characterization of Microrna-125b
Expression in MCF7 Breast Cancer Cells by ATR-FT-IR Spectroscopy". Analyst. 2010.
135(12): 3094–3102.
56. G. Bellisola, C. Sorio. "Infrared Spectroscopy and Microscopy in Cancer Research and
Diagnosis". Am. J. Cancer Res. 2011. 2(1): 1–21.
57. R. Bro, K. Kjeldahl, A.K. Smilde, H.A. Kiers. "Cross-Validation of Component Models: A
Critical Look at Current Methods". Anal. Bioanal. Chem. 2008. 390(5): 1241–1251.