Embed Size (px)
Citation preview

EXPLORATORY STUDY ON ACTIVATEDSLUDGE BULKING AND FOAMINGPROBLEMS IN SOUTHERN AFRICA
GA EKAMA, GvR MARAIS,JR BLACKBEARD
WRC REPORT NO 114/1/85

UNIVERSITY OF CAPE TOWN
Department of C iv i l Engineering
FINAL REPORT TO THE
WATER RESEARCH COMMISSION
ON A TWO YEAR EXPLORATORY STUDY ON
ACTIVATED SLUDGE BULKING AND FOAMING
PROBLEMS IN SOUTHERN AFRICA
( 1 9 8 3 - 1 9 8 4 )
Project tasks
1 Survey oa the extent and severity
of balking and foaaing problems
2 Identification of filamentous Micro-organisms
3 Sludge settleabillty and secondarysettling tank behaviour
by
G A EKAMA
G v R MARAIS
J R BLACKBEARD
Research supported by theWater Research Commission MARCH, 1985of South Africa RESEARCH REPORT NO. W 54
FINAL REPORT TO THE HATER RESEARCH COMMISSION
ON A TWO YEAR EXPLORATORY STUDY ON
ACTIVATED SLUDGE BULKING AND FOAMING
PROBLEMS IN SOUTH AFRICA
(1983-1984)
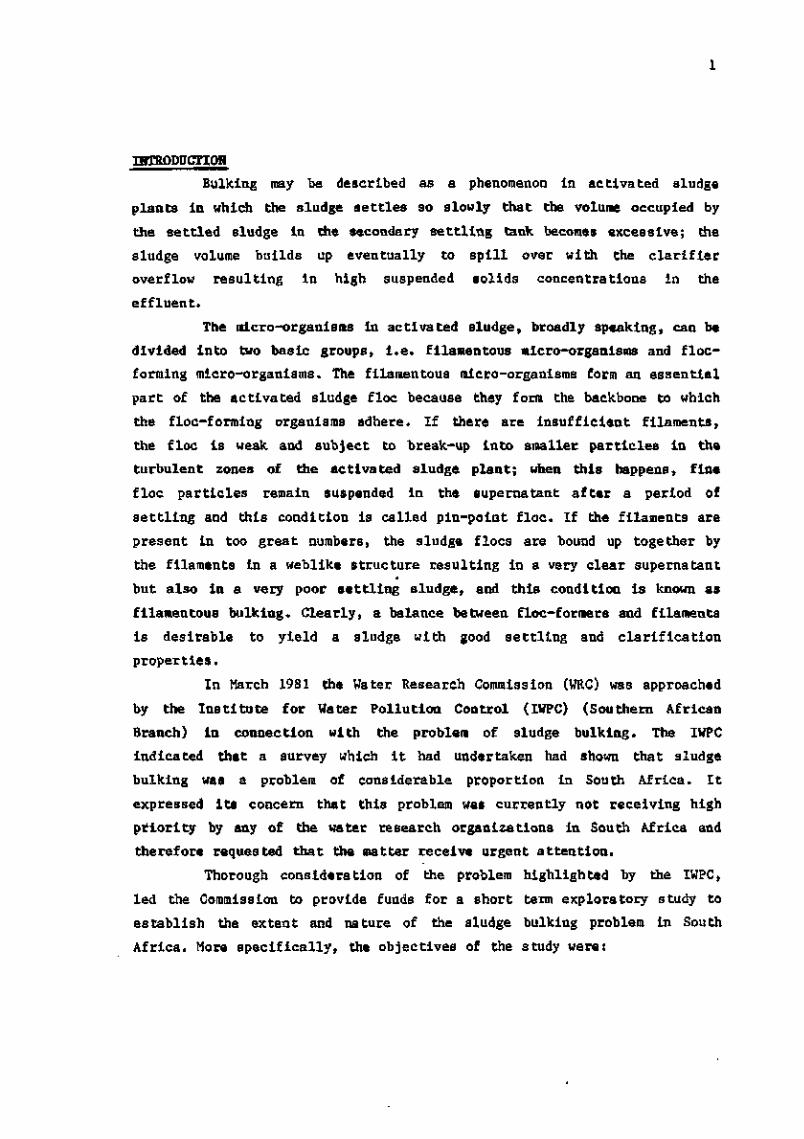
SYNOPSIS
1. Objectives
In a memorandum to the Water Research Commission (WRC), the
Institute for Water Pollution Control (IWPC) indicated that sludge bulking
was a problem of considerable concern in South Africa. Consideration of
the problem led the WRC to contract the University of CapeTown to
undertake an exploratory study into the problem. The objectives of the
study were
1) survey the extent and severity of activated sludge bulking and
foaming problems,
ii) identify the filamentous micro-organisms that are the principal
cause of bulking and foaming,
(iii) identify research needs and directions for controlling bulking and
foaming problems to serve as a basis for possible future research.
(iv) review the literature on bulking control with the view of compiling
an information document on bulking identification and preventaive
and remedial measures,
(v) review the literature on sludge settleability and secondary settling
tank design criteria and procedures with the view of updating
current techniques.

ii
Conclusions and Recoaaendationa
A survey of 111 Southern African activated sludge plants treating
a total flow of 1515Ml/d indicates the following breakdown in problems at
a level worse than minor (figure in brackets represents percentage of
total flow): 44%(47%) either bulking or foaming or bothj 32%(43X)
bulking; 40%(38%) foaming, 27%(34%) bulking and foaming; 5%(9%) bulking
only; 12%(4%) foaming only; and 56%(53%) neither bulking nor foaming.
Identification of filamentous micro-organisms in 96 mixed liquor
and 37 foam samples indicates that the eight principal dominant filaments
in descending order of frequency in the mixed liquor are Type 0092,
M.parvicella, Types 1851, 0675, 0914, 0041, Nocardia spp. and Type 0803,
and the three in the foam are Type 0092, M.parvicella and Nocardia spp.
All these filaments sort into the low F/M group. Some of these filaments
are also the principal dominant ones in the mixed liquor in U.S.A. plants
i.e. Nocardia spp. (ranked 1st), Types 0041 (5th), 0675 (6th) and 0803
(7th) and in European plants i.e. M.parvicella (1st), Types 0092 (4th) and
0041 (6th). The highly ranked dominance of M.parvicella and Nocardia spp.
in foam samples is not unusual as these two are notorious for foaming
problems.
The review of the bulking control literature was undertaken by
Professor D Jenkins of the University of Berkeley, California and the
information document prepared by him is due to be published by the Water
Research Commission soon.
On the basis of the exploratory study on bulking, it is
recommended to undertake research into preventatlve and remedial measures
for foaming and bulking control. Towards this end the WRC has concluded
two contracts, one with the University of Pretoria to investigate foaming
and the other with the University of Cape Town to investigate bulking. In
the bulking research, the high incidence of low F/M filament types
indicates the appropriate remedial action to be the application of
selector reactors. Consequently, research should focus on the following
aspects owing to their particular relevance to South Africa's biological
nutrient removal technology:

lit
(i) aerobic selectors, and their effects on readily biodegradable
(soluble) COD utilization and oxygen consumption rates and integrat-
ing these Into the general kinetic activated sludge model to serve
as a basis for research into anoxic selectors,
(ii) anoxic selectors for application In full scale denitrification
plants
(iii) the feasibility of anaerobic, anoxic and aerobic selectors for
incorporation in nutrient removal plants.
Is is recommended also to investigate chlorlnation as a bulking
control measure and its effect on biological nitrogen and phosphorus
removal plants.
In the review of sludge settleability and secondary settling tank
design procedures, relationships between the different sludge Bettle—
ability measures viz. the flux theory constants VQ/n, Stirred specific
Volume Index at 3,5g/A (SSVI3 5) and Diluted Sludge Volume Index (DSVI),
were investigated and verified with data reported in the literature. With
the aid of these relationships, the predictions of four secondary settling
tank deBign proceures, viz. (i) the flux, (ii) the Water Research Centre
(WRC), (iii) Abwasser Technik Verband (ATV) and (iv) Stichtlng Toegepost
Onderzoek Reiniging Afvalwater (STORA) procedures, are verified against
full scale data measured by STORA (1981). The verification shows that the
flux and WRC procedures ovepredict the permissible solids loading, and
hence the permissible maximum overflow rate by about 20%. A comparison of
the flux, WRC, ATV and STORA procedures shows that for average to poor
sludge settleability (DSVI > 120 mVg, SSVI3 5 > 80 raVg), all predict
similar maximum overflow rates. A comparison of the flux and WRC
procedures with the empirical hydraulic overflow rate criterion of 1 m/h
at Peak Wet Weather Flow (set by the IWPC SA branch)indicates that this
criterion is adequate only for non-bulking sludges (DSVI < 150 m£/g>
SSVI3 5 < 100 mA/g) provided the reactor concentration is less than
3,5g/i.

iv
The review indicates that a large body of research information ia
available on the behaviour of secondary settling tanks. A significant
portion of thia work was conducted at full scale and directed specifically
at developing design procedures but recognize sludge settleability.
Although these procedures give good correlation with observed behaviour,
they have not been widely adopted in South Africa. Consequently, at
present attention should be focussed on upgrading currently used empirical
design criteria by making available the design procedures and full scale
experience (appropriately modified where required) rather than conduct
further full scale research. It is recommended to meet this need by
(i) writing an information document on sludge settleability and
secondary settling tank design for publication by the Water Research
Commission,
(ii) writing a series of technology transfer papers for publication in
"IMIESA" or "Water, Sewage and Effluent" highlighting important
aspects for design and operation,
(iii) writing a series of scientific papers for Water SA detailing
original contributions by the author of the review.

FINAL REPORT TO THE WATER RESEARCH COMMISSIONON A TWO YEAR EXPLORATORY STUDY ONACTIVATED SLUDGE BULKING AND FOAMING
PROBLEMS IN SOUTH AFRICA(1983-1984)
TABLE OF CONTENTS
SYNOPSIS i
TABLE OF CONTENTS v
ACKNOWLEDGEMENTS v l l
INTRODUCTION 1
1. EXTENT AND SEVERITY OF SLUDGE BULKING AND FOAMING 2
2 . IDENTIFICATION OF FILAMENTOUS MICRO-ORGANISMS 52 . 1 Causes of f i l amen tous bu lk ing 52.2 A c q u i s i t i o n and a n a l y s i s of samples 52.3 Filaments In bulking samples 62.4 Filaments In non-bulking sludges 102.5 Filaments in foam samples 12
3. RECOMMENDATIONS FOR BULKING AND FOAMING RESEARCH 133.1 Bulking c o n t r o l measures 13
3 . 1 . 1 Non-specific bulking control measures 133.1.2 Specific bulking control measures 153.1.3 Bulking control research contract 16
3.2 Research Into foaming control 163.3 Closure 17
4. REVIEW OF BULKING AND FOAMING CONTROL LITERATURE 17
5 . SLUDGE SETTLEABILITY AND SECONDARY SETTLING TANK DESIGN 175 . 1 Filamentous organisms and settleability 185.2 Sludge settleability and secondary settling tank design
procedures 185.2.1 Empirical design criteria 185.2.2 Zone Settling Velocity (ZSV) test and the flux theory 205.2.3 The Diluted Sludge Volume Index (DSVI) design procedures 23
5.2.3.1 The ATV and STORA design procedure 235.2.3.2 The Koopman and Cadee design procedure 24
5.2.4 St i r red Specific Volume Index and the Water ResearchCentre design procedure 24
5.3 Scope of the research 255.4 Relationship between sludge s e t t l e a b i l i t y measures 25
5.4.1 Relationship between flux theory constants 255.4.2 Relationship between DSVI and SSVI 275.4.3 Relationship between SVI and flux 28
5.5 Verification of the se t t l ing tank theories 305.5.1 Data source 30
VI
5.5.2 Comparison of predicted and measured maximum solidsloading for the Flux, WRC and K & C theories 31
5.5.3 Qualitative verification of the flux theory 325.5.4 Verification of the ATV and STORA procedures 355.5.5 Discussion on the ATV and STORA procedures 37
5.6 Comparison of the Flux and WRC procedures and the ATV and STORAprocedure 39
5.7 Comparison of flux and WRC theories with empirical designcriteria 42
5.8 Conclusions 455.9 Recommendations for research 48
6. REFERENCES 496 . 1 Survey and filamentous organism i d e n t i f i c a t i o n 496.2 Sludge s e t t l e a b i l i t y and secondary s e t t l i n g tank behaviour 49
7. PAPERS, REPORTS AND OTHER CONTRIBUTIONS PUBLISHED DURING CONTRACTPERIOD 52

vii
ACKNOWLEDGEMENTS
The writers wish to express their gratitude to the following fortheir contribution to the contract work reported above.
~ Mr T Lakay - Laboratory Assistant for his invaluable help with runningthe laboratory.
Mrs H Bain - Clerical Assistant for typing of reports and attending tothe accounts.
Mr R Beverton - Chief Technical Officer, and Civil EngineeringWorkshop S tafT for construction, maintenance and servicing ofequipment in the laboratory.
The efforts of these three persons were not that of support; they arevital participants in the research team.
A special word of thanks to Dr H N S Wiechers for his unfailingsupport, positive critical comments and guidance of this contractwork. Without his efforts, it is doubtful whether the project wouldhave been as successful as it was.
- Gratitude is expressed to Professor D Jenkins and Dr M Richard of theSanitary Engineering Research Laboratory of the University ofCalifornia, Berkeley, for their assistance in filament identificationand valuable comments on the research work.
- Acknowledgement is due to the members of the Steering Committee onthis research project who guided the work for the two year period:
' Dr H N S Wiechers (Chairman) - Water Research Commission
• Mr H Nell - National Institute for Water Research
- (also representing IWPC)
• Mrs M Smollen - National Institute for Water Research
• Professor W Pretorius ) - Department of Water Utilization• Mr C J Laubscher ) - Engineering, University of Pretoria• Mr H G J Beekraan - Cape Town City Council
• Mr W M Malan - University of Stellenbosch,Department of Civil Engineering
• Dr J J Barnard - Department of Environment Affairs.
Gratitude is expressed to the Water Research Commission for thefinancial support of this project.
- Finally, the writers wish to thank all those who participated in thesurvey by returning the questionnalrs and sending samples for analysis- without their excellent response, this survey would not have been ascomplete and successful as reflected in this report.
TSTEODUCTIOH
Bulking may be described as a phenomenon in ac t iva ted sludge
p lan t s in which the sludge s e t t l e s so slowly that the volume occupied by
the s e t t l e d sludge in the secondary s e t t l i n g tank becomes excessive; the
sludge volume bui lds up eventual ly to s p i l l over with the c l a r i f l e r
overflow r e s u l t i n g in high suspended so l id s concentrat ions in the
effluent.
The micro-organisms in activated sludge, broadly speaking, can be
divided into two basic groups, i .e. filamentous micro-organisms and floc-
forraing micro-organisms. The filamentous micro-organisms form an essential
part of the activated sludge floe because they form the backbone to which
the floc-forming organisms adhere. If there are insufficient filaments,
the floe is weak and subject to break-up into smaller particles in the
turbulent zones of the activated sludge plant; when this happens, fine
floe particles remain suspended in the supernatant after a period of
settling and this condition is called pin-point floe. If the filaments are
present in too great numbers, the sludge floes are bound up together by
the filaments in a weblike structure resulting in a very clear supernatant
but also in a very poor settling sludge, and this condition is known as
filamentous bulking. Clearly, a balance between floc-forraers and filaments
is desirable to yield a sludge with good settling and clarification
properties.
In March 1981 the Water Research Commission (WRC) was approached
by the Institute for Water Pollution Control (TWPC) (Southern African
Branch) in connection with the problem of sludge bulking. The IWPC
indicated that a survey which i t had undertaken had shown that sludge
bulking was a problem of considerable proportion in South Africa. I t
expressed its concern that this problem was currently not receiving high
priority by any of the water research organizations in South Africa and
therefore requested that the matter receive urgent attention.
Thorough consideration of the problem highlighted by the IWPC,
led the Commission to provide funds for a short term exploratory study to
establish the extent and nature of the sludge bulking problem in South
Africa. More specifically, the objectives of the study were:

(i) Survey the extent and severity of activated sludge bulking and
foaming problems;
(ii) Identify the filamentous micro-organisms that are the principal
cause of the bulking and foaming;
(lii) Identify research needs and directions aimed at controlling bulking
and foaming problems to serve as a basis for possible future
research contracts;
(iv) Review the literature on bulking control with the aim of drawing up
an information document on bulking identification, remedial
preventatlve measures.
(v) Review the literature on sludge settleabillty and secondary settling
tank design criteria and procedures with the aim of updating
techniques presently in use.
Over the paBt two years the University of Cape Town undertook the
exploratory study and investigated the five aspects set out above. The
results have been reported in detail In a number of reports and scientific
papers (see Section 7). This report summarizes the findings of this
research work.
1. EXTENT AHD SEVERITY OF SLUDGE BDLKIMG AND FQAMIMG
In order to obtain Information on bulking and foaming problems in
activated sludge plants In South Africa, a short two page questionnaire
requesting Information on bulking and foaming was (I) distributed to all
local authorities (± 400) and members of the IWPC (S A Branch) during
early 1983 and (ii) published in IMIESA (1983, 8_t 7, 59) and S A Water
Bulletin (Aug 1983, 15-16). Information requested included the size and
type of the plant, and the extent to which bulking and foaming was a
problem.
The response to the survey was excellent; 220 returns were
received. Of these, 109 reported not having activated sludge plants, 111
supplied the necessary information on activated sludge plants with design

flows from 0,5 to 150 M^/d. The results of the survey, in terras of plant
number and design flows are summarized in Fig 1. The results have been
analysed in detail by Blackbeard and Ekama (1984). In summary, of the 111
plants, 78% experienced either bulking or foaming, or both problems
together, in various degrees of severity ranging from minor to impossible.
ThiB number of plants represented 80% of the total design flow. Bulking
was reported to take place in 56%(68%) of the plants, foaming in 68%(65%)
and neither bulking nor foaming in 22%(20%). Sorting the plants with minor
problems in the group of plants with no problems and accepting the plants
reporting difficult, manageable or impossible problems as the problem
plants requiring bulking and foaming remedial attention, the breakdown of
the problem plants is as follows: 44%(47%) of the plants have either
bulking or foaming or both problems, 32%(43%) have bulking, 4O%(38%) have
foaming and 56%(53%) have neither bulking nor foaming problems.
With regard to bulking, only the larger plants (> 40 MJl/d)
reported the problem as impossible; all the smaller plants reported the
problem at worst to be manageable. A possible explanation for this is that
large plants are likely to have a greater industrial waste content, some
fractions of which may stimulate the growth of filamentous organisms.
Similarly, foaming appears to be more severe in large than in Bmall
plants. A reason for this may be the same as that cited above for bulking
but additionally, some of the large plants have diffused air aeration
which tends to exacerbate an inherent foaming problem. However, this
assessment is a purely subjective one and no direct cause/effect
relationships could be deduced.
The survey confirmed that bulking and foaming problems were
sufficiently widespread, and severe, to merit proceeding with the
remaining objectives of the research programme i.e. addressing objectives
(11) to (v) listed above.
*The first figure is the percentage of plants and the second (in brackets)is the percentage of the total design flow.

TABLE I
DOMINANT FILAMENT TOES INDICATIVE OF CERTAIN ACTIVATED SI.UDGEOPERATIONAL PROBLEHS
(Jenkins ec a l . , 19B5)
Suggested Causative Conditions Ind ica t ive Filament Types
low F/M r a t i o
low dissolved oxygen
presence of sulphide
low pH
nutrient deficiencies
H.parvicella. Types 0041, 0675,0092, 0581, 0961,0803,H.hydroaBla, Nocardla upp.
Type 1701, S.natana,H.hydroaula
Thlothrlx spp., Begglntoa spp.;Type 02 IN
fungi
H.hydroaals, S.natana,Thlothr lx spp., Types 021N,0041 and 0675
100
Eft
BULKING
NUMBER OF PLANTS
S 2! m u>
51
:Z4
JiB
§TTTWik
20
* 0
^
32
•m
W/
25
:25i
ME•??:
44
i?
IPo _03 tO - I
oIo
PLANT SIZE
BULKING
DESIGN FLOW (MI>tJ)
O 9
CATEGORY ( M l / d )
i
NONE
MINOR
DIFFICULT
MANAGABLE
IMPOSSIBLE
FOAMING
NUMBER OF PLANTS
FOAMING
100«• E
32
F
25 20
'•m
33 50 32
22
CO,
DESIGN FL0W{M/d)& rvi inn in K)
fO
20
38:
29IS
I::ISC
o 8 °— I il o O
o = w
S i ^i i i -
O O O8 *i
o om toI 1 | fZ
o y 5 ? § PPLANT SIZE CATEGORY ( M t / d )
I
NONE
MINOR
DIFFICULT
MANAGABLE
IMPOSSIBLE
Figure 1 Severity of hulking (top) and foaming (bottom) in differentplant Bi.se categories and in the total nwriier of plants. Thepercentage of the total number cf plante in each category (left)and tJie percentage of Bie total design flow in each category(right) trtih impossible, nanageahle, difficult, minor and noproblems is given. The total number of plants (left) and totaldesign flou (right) in eaA category ie given at the top of thefigures. The breakdown of all the planta together is ahoim inthe Total eolum in each figure.
2 . IDENTIFICATION OF FILAMENTOUS MICRO-ORfiANISMS
2 . 1 Causes of filamentous bulking
Each type of filamentous micro-organism is likely to prefer a
specific set of environmental conditions for its proliferation. Hence
predominance of one type over another will depend on environmental
conditions in the activated sludge plant. At present, i t is only possible
to suggest tentatively which process operational conditions favour the
proliferation of some filamentous micro-organisms; these conditions and
the corresponding filaments which favour them are listed in Table 1. Using
this Table possible problematic operational conditions can be identified
from the types of filamentous micro-organisms present. I t may then be
possible to change the conditions to prevent the proliferation of the
filaments and so to ameliorate the bulking problem.
2.2 Acquisition and analysis of saaples
Mixed liquor and foam samples (if present) were obtained for
filament identification from most plants that participated in the
questionnaire survey irrespective of whether the plant reported bulking or
non-bulking conditions. The filaments were identified by the
Internationally accepted microscopic analysis technique of Eikelboom and
van Buijsen (1981). In this technique the following terras are used to
express the results:
(i) Overall abundance - a semi-quantitative assessment of the
abundance of all the filament types present in the sample.
( i i ) Occurrence - the presence of a particular filament type.
( i l l ) Dominance and secondary - the most abundant filament type present
The microscopic analysis allows distinction between bulking and
non-bulking sludges on the basis of the filament abundance in the
samples. The results of the identification of the filaments in
bulking and non-bulking mixed liquor samples (judged in the
microscopic analyses from overall filament abundance level) and
foam samples are set out below.

2.3 Fllanenta In bulking saaples
The frequency of occurrence aad frequency of dominance of the
different filaments in the bulking sludges are given in Table 2. The eight
most frequently occurring and dominant filament types are ranked 1 to 8 in
descending order in Table 2 and this ranking number is shown in brackets.
The results in Table 2 are shown graphically in Fig 2 in which the
filaments are ranked from left to right in descending order of frequency
of dominance.
From Fig 2 and Table 2 the eight most frequently occurring
filament types in bulking sludges, in descending order are: Type 0041
present in 94%, Type 0092 in 79%, Type 0675 in 64%, Type 0914 in 53%,
Microthrix parvicella in 51%, Nocardia spp. in 42%, Haliscomenobacter
hydrossis in 30% and type 0803 in 26% of those plants having filamentous
bulking sludges. The eight most frequently dominant filaments are Type
0092 in 43% of the plants, M.parvicella in 28%, Type 1851 in 23%, Type
0675 in 21%, Type 0914 in 17%, Type 0041 and Nocardia spp. each in 15%,
and Type 0803 in 11% of plants. All these types apparently favour low
Food/Micro-organism (F/M) ratio conditions although Types 0041 and 0675
also apparently have a selective advantage with nutrient deficient
conditions (Table 1). However, in South African plants the low F/M
conditions are the most likely cause as most activated sludge plants are
operated at long sludge ages.
Frequency of occurrence and frequency of dominance of filament
types in bulking sludges in the U.S.A. also are listed in Table 2.
Comparing the South African and U.S.A. results, Type 0041 is the most
frequently occurring filament in both countries; similarly in both
countries Nocardia spp. and H.hydrossis are frequently occurring filaments
(6th and 7th in S.A. respectively and 4th and 3rd in U.S.A. respectively)
is termed dominant while the remainder are termed secondary. If the
overall abundance is high it is possible to have 2 or more dominant
filament types.
With regard to the frequency of dominance of filaments in U.S.A.
plants, from Table 2 the six principal ones are, in descending order,
Nocardia spp., Type 1701, Type 021N, Thlothrix spp. and S.natans and Type
0675. Proliferation of these apparently can be ascribed to all the
possible causes listed in Table 2, except low pH; the probable reason for
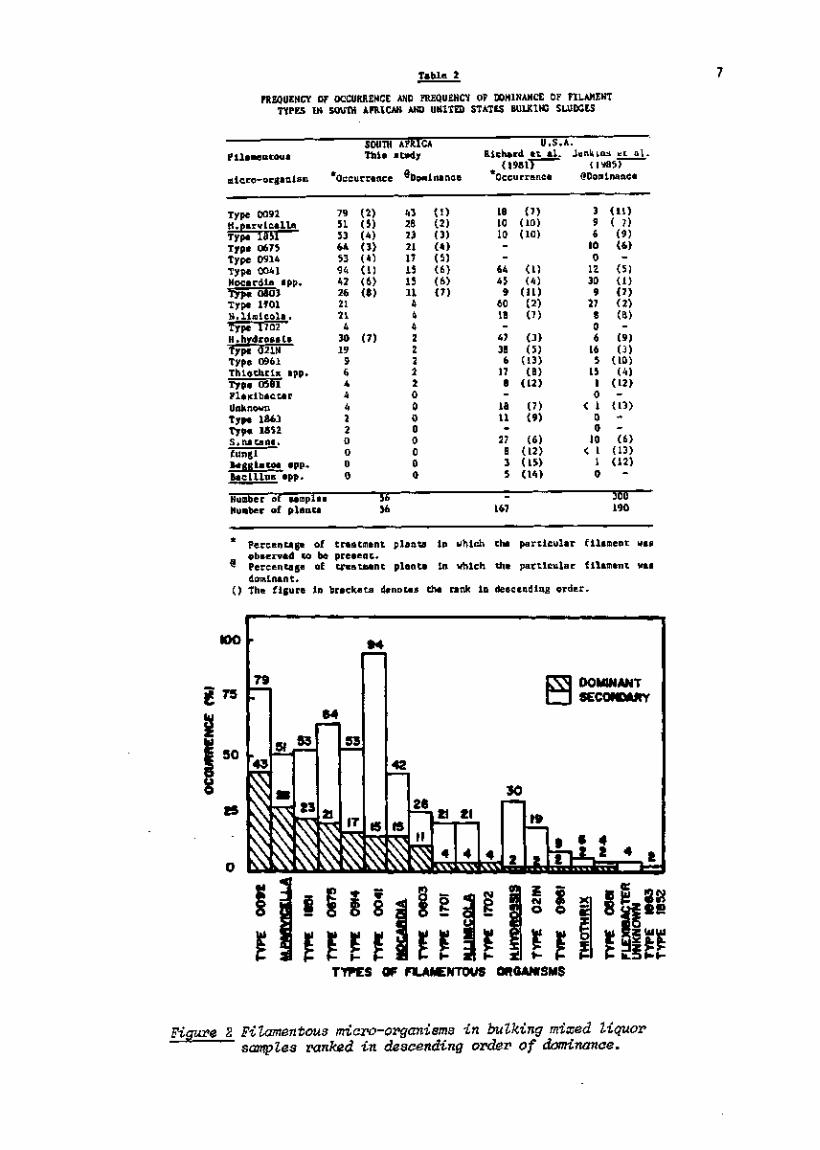
Table 2
FREQUENCY OF OCCURRENCE AND FREQUENCY OF DOMINANCE OF FILAMENTTYPES IN SOUTH AFRICAN ANP UNITED STATES BULKING SLUDGES
Dicro-organlso
Type 0092K.parvicellaType 1B51Type 0675Type 0914Type 0041Nocardia a pp.Type 0303Type lfOlN.Hmlcola.Type 1702H.hydroBBisType 021NType 0961Thtothrix app.Type 05B1FlexlbacterUnknownType 1863Type 1852S.na tans.fungiBegglatoa spp.Bacil lus app.
Number of samplesNumber of plants
SOUTHThis
Occurrence
79 (2)51 (5)53 (4)64 (3)53 (4)94 CD42 (6)26 (8)2121
430 (7)19
96444220000
5656
AFRICAstudy
^Dominance
43282321171515114442222200000000
(1)(2)(3)(4)(5)(6)(6)(7)
U.S.ARichard et al .
(1981)Occurrence
IB1010
6445
960IB
473a
617B
ian27
a35
167
(7)(10)(10)
CD
(ID(2)(7)
(3)(5)
(13)(B)
(12)
(7)(9)
(6)(12)(15)(14)
Jenkins et a l .(1985)
^Dominance
396
100
1230
927806
165
1510
< 100
10< 1
10
(11)( 7)
(9)(6)
(5)(1)(7)(2)(a)(9)(3)
(10)(4)
(12)
(13)
C6>(13)(12)
300190
* Percentage of treatment p lants ln which the par t i cu lar f i lament wasobserved to be preaent .
@ Percentage of treatment p lants ln which the p a r t i c u l a r f i lament wasdominant.
( ) The f igure In brackets denotes the rank ln descending order.
100
8
DOMINANTSECONDARY
f- 3TYPES OF FILAMENTOUS ORGANISMS
Figure 2 Filamentous micro-organisms in bulking mixed liquorsamples ranked in descending order of dominance.
this Is that in the U.S.A. activated sludge processes are operated under a
wide range of conditions, from high rate (short sludge age, high F/M,
posBibly low Dissolved Oxygen, D.O.) to low rate (long sludge age, low
F/M,). Comparing the principal dominant filaments in South African and
U.S.A. bulking sludges, the three types that are common are ( i ) Nocardia
Bpp. - 7th In S.A. and 1st in U.S.A., ( i i ) Type 0041 - 6th in S.A. and 5th
in U.S.A. and ( i l l ) Type 0675 - 4th in S.A. and 6th in U.S.A. Clearly,
there is s imilar i ty with the U.S.A. only where the filaments are low F/M
typeB.
The principal dominant filament types causing bulking in Europe
and Germany have been identified in Independent surveys by Eikelboora
(1977) and Wagner (1982) respectively. In Table 3 the principal dominant
filaments for South Africa are ranked In descending order plus the
corresponding ranking number for that filament found in Europe, Germany
and U.S.A., as reported by the different invest igators . Both Eikelboom's
and Wagner's surveys show that bulking in Europe and Germany may be caused
by one or more of the different causative operating conditions (except low
pH) (Table 1) . This Is perhaps not unexpected because in Europe activated
sludge processes are operated a t both high ra te , In which the low D.O.
filaments may develop and low ra te , In which the low F/H filaments may
develop.
Comparing the surveys in Europe with that In South Africa, again
there Is some s imilar i ty but, as in the U.S.A., only In so far as the
causative filaments are the low F/M types: M.parvlcella, Type 0041 and
Nocardla spp. are In the top six in both countries. The major differences
are (1) in Europe the filaments Type 021N, S. na tans, Type 1701 and
H.hydrossls often are the cause of bulking whereas in South Africa these
seldom are, and ( i i ) filaments Types 0675 and 0914 are not l i s ted in the
European surveys, whereas these are the 4th and 5th most frequently
dominant filaments In South Africa,
Assessing the s i tuat ion in South Africa, with respect to the
suggested causes in Table 1, the low F/M ra t io (long sludge age)
filamentous micro-organisms (Type 0092, M.parvlcella, Types 1851, 0675 and
0914) abound in bulking sludges. These types also cause a large proportion
of the bulking problems in Europe and the U.S.A. so that the low F/M
condition is one that is of greates t prac t ica l importance.

Table 3
RANKISG OF DOMINANT FILAMENT TYPES IN SOUTH AFRICAN,EUROPEAN AND NOItTH AMERICAN PLANTS
Fi lamentousmicroorganisms
South Af r i cathis study
U S AJenkins et a l .
C19B5)
EuropeElkelboom(1977)
GermanyWagner(1982)
Type 0092M.parvlcellaType 1851Type 0675Type 0914Type 0041Nocardla spp.Type 0803Type 1701N.UmlcolaType 02 INH.hydroSBlaS.uatansThtothrlx app.Type 0581Type 0961BegRlatoa app.
It796
5172e3964
!21012
41
12
614
95
11237
178
iO
35
10a7164
Number of Plants 190 200 315
Number of samples 56 300 1100 3500
i
KX)
/5
SO
ts
0
•
77 77-
12
1Y>
72
8?12
9
49
9
44
9
33 33Z6
9 7
NY DOMINANTSECONDARY
35
7 7 ?
a
• T -
n•j u
TYPES OF FILAMENTOUS ORGANISMS
ousi
z(u XO £X
TY
PE
e
s sa
TY
PE
FLEX
1S
.NA
T
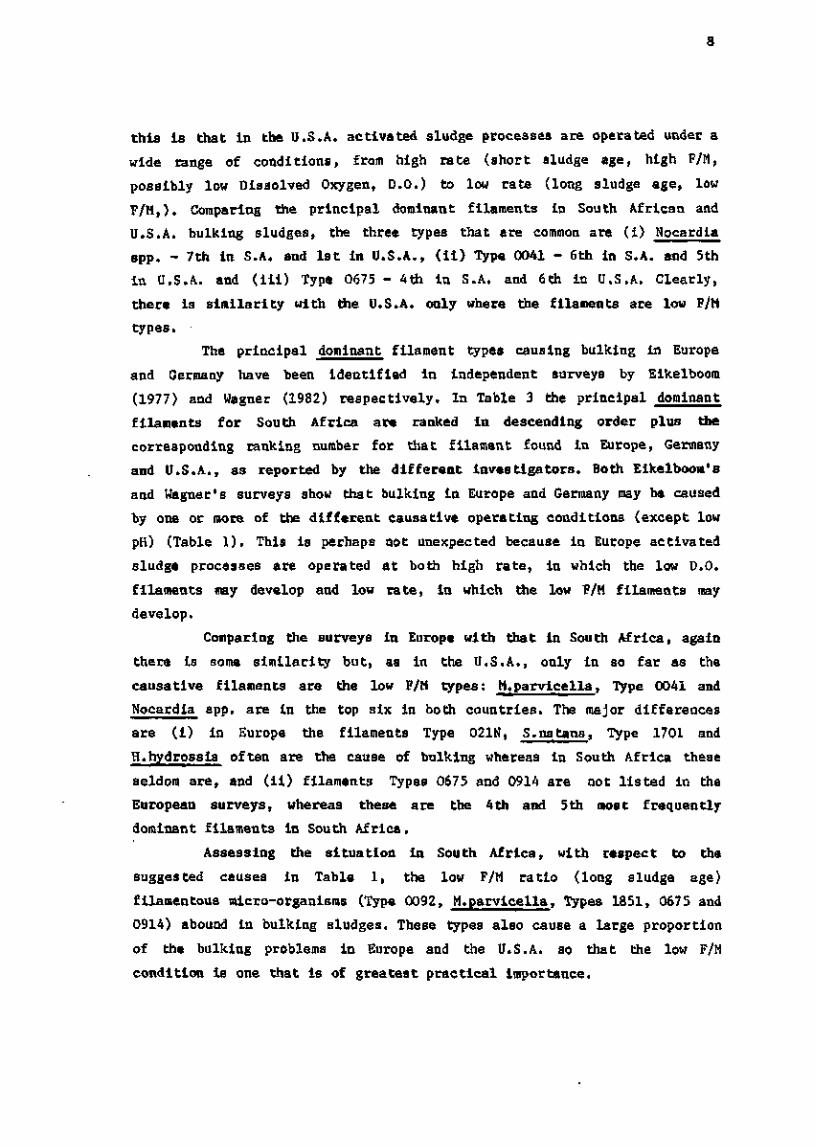
Figure 3 Filamentous micro-organisms in non-bulking mixed liquorsamples ranked in descending order of dominance.

LO
2.4 Filaments ln non-balking sludges
The f i lament types in non-bulking sludges are s e t out in Fig 3
which shows t h a t the f ive most f requent ly occurr ing f i laments in
descending order of frequency, are Types 0092 and 0041 in 77% of samples,
Type 0675 in 72%, Type 1851 in 49% and M.parvice l la in 44% and the seven
most f requent ly dominant f i l amen t s , in descending order of frequency, are
Type 0092 in 23%, Type 0041 and Nocardia spp. each in 12% and Types 0675,
1851, 0914 and M.parvice l la each in 9%.
Table 4
FILAMENTOUS ORGANISMS IN FOAM SAMPLES FROM PLANTSIN SOUTHERN AFRICA
Filamentous Foam SampleMicro-organism Occurrence ^Dominant Rank
Type 0092 U IM.parvicella 59 46 1Nocardia spp. 41 30 2Type 0041 73 14 3Type 0803 27 11 4Type 0914 46 11 4Type 0675 51 8 5Type 1841 43 5 6H.hydrosais 14 3 7Type 02INType 1701N.limicolaType 0961Thiothrix spp.Type 1702Type 1852Type 1863Type 0581BeggiatoaUnknown
Number of samples = 37Number of plants = 37
Percentage of plants In which each filament was observed to occur^ Percentage of plants In which each filament was observed to be dominant
73594173274651431422221185555333
46463014111185300000000000

11
100
Z75uozK 50
Uoo C5
DOMINANTSECONDARY
IS!
I I I IJ3 3 3
8
O o> $0 0 0 0 5
u ui u
« P -io c o
E- a. ITYPES OF FLANENTOUS 0K6ANISMS
re 4 Filamentous micro-organisms in foam samples rankedin descending order of dominance.
ISo
DOMMANTSECONDARY
JOC-
DOMtNANTSECONDARY
ookJ U8
1£ i
TYPES OF FILAMENTOUS ORGANISMS
Figure 5 Comparison of filamentous micro-organisms in foam samples(bottom) uitk those in both bulking and non-bulking mixed liquorsamples (top} ranked in descending order of frequency ofoccurrence in foam eanples. The filaments that are dominant inthe foam samples with a significantly higher frequency than inthe mixed liquor samples, selectively accumulate in the foam andcan be said to he foaming filaments i.e. Type 0092, H.yarvicellaand flocardia spp. The filaments that are dominant in the foamsamples with approximately the same frequency OB in the mixedliquor samples^ are present in the foam due to. incidentalentrapment from the mixed liquor.

Comparing the seven most frequently dominant filaments In non-
bulking samples with those In the bulking ones, it appears that they are
the same types except the order of ranking ia slightly different. Hence
bulking and non-bulking sludges are essentially similar with regard to the
types of filaments present in them, the difference lies only in the
abundance level of the filaments. This seems to indicate that under
certain conditions, the principal causative agents Increase In abundance
to cause the bulking problem but the conditions that stimulate this are at
present unknown.
2.5 Fllaaenta In foan samples
The frequency of occurrence and frequency of dominance of
filamentous organisms In the foam samples are set out In Table 4 and shown
graphically in Fig 4, in which the filaments are arranged in descending
frequency of dominance. From Fig 4, the six most frequently dominant
filaments are Type 0092, M.parvicella, Nocardia spp., Types 0041, 0914 and
0803. However, it cannot be concluded from this that these filaments are
the main causative agents for foaming because they are present also in the
mixed liquor from which the foam originates. This difficulty can be
resolved by comparing the frequency of dominance of filaments In foam
samples with that in mixed liquor samples (see Fig 5). From Fig 5, those
filaments which are found with approximately equal frequency of dominance
in the foam and the mixed liquor can be said to be present In the foam due
to Incidental entrapment from the mixed liquor; the first five of these,
are Types 0041, 0675, 0914, 1851 and 0803. Those filaments which dominate
with a considerably higher frequency In the foam compared with the mixed
liquor, can be said to be specific foaming organisms due to their
selective accumulation in the foam; the principal three of these are, in
descending order, Type 0092, M.parvicella and Nocardia spp. The finding
that M.parvicella and Nocardia spp. are two of the principal filaments
causing foaming in South Africa is not surprising; these two are notorious
internationally for causing this problem. The finding that Type 0092
perhaps causes foaming Is unexpected because, to the knowledge of the
writers, this is not recorded in the literature. However, the implication
that Type 0092 is a possible foaming filament is tentative at best:
M.parvicella and Nocardia Bpp. are dominant in foam samples 2,3 and 2,1

13
times more frequently than in mixed liquor samples respectively, but for
Type 0092 this ratio is 1,35.
3. RECOMMENDATIONS K)R BULKING AND FOAMING RESEARCH
The exploratory study described above (for details see Blackbeard
et al., 1985) as well as visits to a number of local sewage works
indicates that bulking and foaming give rise to considerable problems in
activated sludge plants in South Africa. A considerable information base
already exists on the control of sludge bulking and foaming, as set out in
the review of Jenkins et al. (1985) (see Section 4 below). However, a
number of research needs related to bulking and foaming control and
remedial measures in activated sludge plants have been identified and are
detailed below.
(1) Investigate bulking, its causes, control and preventative
measures at activated sludge plants.
(2) Investigate foaming, its causes, control and preventative
measures at activated sludge plants.
3.1 Bulking control •eaaurea
With regard to bulking control and preventative measures,
considerable advances have already been made internationally, but these
measures need to be investigated more closely to evaluate their
application in South Africa. Bulking remedial and preventative measures
can be divided into two groups viz:
i) Non-specific bulking control methods
li) Specific bulking control methods.
3.1.1 Non-specific bulking control measures
The non-specific bulking control methods involve dosing the plant
experiencing the problem with a bacteriacide such as chlorine or hydrogen
peroxide. The principle behind non-specific bulking control is that the
filaments extending outside the sludge floes expose a much larger surface

area than the floe formers within the sludge floes, with the result that
the former are more susceptible to toxicity: The bacterlacides kill the
filaments outside the sludge floes thereby controlling their growth. The
dosing has to be done in a specific and very controlled manner so as to
affect the filamentous organisms only and not the other bacteria in the
process, in particular the nitrifying organisms which effect
nitrification. Chlorine dosing involves two aspects (1) a total dose of
between 1 and lOg chlorine per kgMLSS per day and (ii) an exposure rate of
at least 2 to 3 times per day to keep the actual dosing concentration low
(5-20 mg/A). The most common dosage point in the plant is in the return
sludge stream because here the MLSS concentration iB high and soluble COD
low. With this method, considerable success in controlling bulking haB
been achieved in the U.S.A. (Jenkins and Richard, 1985). In response to a
short course on activated sludge bulking control presented by Professor D
Jenkins, the method has been applied with some success at a few extended
aeration plants in South Africa e.g. Heidelberg and Daspoort (S.A.
Waterbulletin, Aug., 1983).
To apply chlorination in South Africa, the following needs
attention (for details see Blackbeard et al., 1985).
• To investigate the effects of chlorination on the specific micro-
organisms implicated in the biological phosphorus removal, such
as Acinetobacter. This is important for South Africas's nutrient
removal plants. No experience of this has been reported to date.
• To adapt where necessary the chlorination technique for use at
South African plants and engender confidence and reliability in
its application by bulking control demonstrations and publication
in trade and technical journals.
In the South African context chlorination should not be viewed as an
emergency control measure only - although its expense will limit its
extensive use in South Africa some municipalities have found regular
chlorination to improve sludge settleability (thereby allowing higher
overflow rates) more economical than the cost of interest rates on capital
investments required for additional settling tanks. However, it must be
15
remembered that in many instances, specific bulking control measures can
be applied for permanent prevention of bulking, in particular the selector
approach.
3.1.2 Specific bulking control Measures
The most important reason for knowing the different filamentous
micro-organism types is that it assists identifying possible specific
operating conditions that lead to their proliferation. The principal
filaments causing bulking in South African plants are the low F/M (long
sludge age) types. The indicated measure for their control is the
"selector" reactor approach; with this approach, a small aerobic (or
anoxic) reactor is placed ahead of the main biological reactor. The
principle of the "selector" reactor is that the readily biodegradable OOD
(or dissolved COD) is at a relatively high concentration and hence is
utilized at a high rate in the selector, a condition which reputedly gives
the floc-forming types of micro-organisms a growth advantage over the
filamentous micro-organism types. By the suppression of the filamentous
growth, good settling sludges are obtained.
Considerable success has been recorded in the U.S.A. and Europe
in controlling and curing low F/M filamentous bulking with the selector
approach (for U.S.A. experience see Jenkins and Richard, 1985). In the
main, this research describes situations where the selector reactors or
zones are aerobic. Recently, work by the Berkeley group, has indicated
that the selector effect also can be induced if the reactor or zone is
anoxic (i.e. in the presence of nitrate and absence of dissolved oxygen),
but this development has not yet been adopted at full scale. Anoxic
selectors are of particular relevance to South Africa where nitrification
is obligatory - indeed it is unlikely that aerobic selectors, as applied
to extended aeration plants, will find wide application here because of
the advantage of denitrification once nitrification is included in the
design. Furthermore, biological nutrient removal plants have anaerobic
reactors as their first zone and this raises the question of the
applicability of the selector approach for bulking control in these
plants.
Noting the above, it is recommended to investigate the following
aspectB due to their particular relevance to biological nitrogen and
16
phosphorus removal technology in South Africa (for detailed background,
see Blackbeard et al., (1985);
• aerobic selectors and their effects on the readily biodegradable
(soluble) COD utilization and oxygen consumption rates with the
view to integrating these in a general kinetic theory and thereby
assist In developing a rational design procedure for aerobic
selectors.
anoxic selectors for application in full scale denitrification
plants
• the feasibility of anaerobic, anoxic or aerobic selectors for
incorporation in nutrient removal plants for bulking control.
3.1.3 Bulking control research contract
The recommendations on bulking control research set out above
have been incorporated in a 3 year research contract between the Water
Research Commission and the University of Cape Town. The research program
is to be executed in collaboration with Dr Jenkins of the University of
California, Berkeley.
3.2 Research into foaaing control
With regard to foaming, it would appear best to adopt two
approaches in this research: (i) to investigate different design features
in activated sludge plants and secondary settling tanks that will lead to
efficient and effective foam removal and to investigate alternatives for
ultimate disposal of the collected foam. This approach is likely to yield
the most cost-effective relief to foaming problems in the short term (ii)
to investigate the causes for the proliferation of the foaming micro-
organisms Nocardia spp. and M.parvlcella; a knowledge of the causes will
allow development of control measures that will lead to the decline of
these organisms in the activated sludge plant.
Research on the two approaches has been initiated: At the
Department of Water Utilization of the University of Pretoria under
Prof W Pretorius with funding from the Water Research Commission, both

17
approaches are being investigated, although the first approach is at
present emphasized; at the Sanitary Engineering Research Laboratory of the
University of California, under Prof D Jenkins, research attention is
focussed on the second approach. Some interesting advances in combating
foaming problems are likely to flow from these investigations in the not
too distant future.
3.3 Closure
The survey summarized in this report has stimulated interest in
bulking and foaming control methods in the municipal wastewater treatment
field in South Africa, an interest that has existed for many years in
Europe and the U.S.A. With the keen research interest at the international
level in solving bulking and foaming problems, and the two Water Research
Commission contracts focussing attention on the problems locally, it is
envisaged that significant progress in dealing with these problems will be
made in the not too distant future.
4. REVIEW OF BOLKING AND FOAMING CONTROL LITERATURE
This aspect of the exploratory study was not covered by the Cape
Town group. The Water Research Commission commissioned Professor D Jenkins
of the University of California, Berkeley, U.S.A. who has wide experience
in bulking control at full scale, using chlorination and aerobic
selectors, to review the literature. The review is currently being
finalized and will be published as a Water Research Commission publication
entitled: "Manual on the causes and control of Activated Sludge Bulking
and Foaming", by D Jenkins, M Richard and G T Dalgger (1985).
5. SLUDGE SETTLEABILITY AMD SECONDARY SETTLING TANK DESIGN
In addition to the research into the extent and severity of bulk-
ing and foaming, and identification of the filaments that cause these
problems, the exploratory study also envisaged a review of research on
sludge settleability and secondary settling tank behaviour, with the aim
of possibly updating current secondary settling tank design theories or
procedures.
5.1 Filamentous organisms and aettleablllty
To obtain a quantitative measure of the effect of filamentous
organisms on sludge settleability, efforts have been directed at relating
the sludge settleability to the number or the total length of filaments.
Sezgin et al., (1978) and Pipes (1979) found the most widely used settle-
ability measure, the _Sludge JVoluroe _Index (SVI), to be poorly related to
the filament number (millions/mg). This is because (i) the filament number
fails to account for filament length and (ii) the SVI test is a poor
settleability measure. Sezgin et al., (1978) and Lee et al., (1983)
Investigated the effect of filament length, (denoted JFotal ^Extended
_Filament Length TEFL, km/g) on the SVI, but plots of SVI versus log TEFL
showed such a wide scatter that an SVI of 150 mA/g could have a TEFL rang-
ing between 5 and 70 km/g (see Fig 6). This work demonstrated the
inadequacy of the SVI as an indicator of filament number or length. Work
by Lee et al., (1983) shows that the _Diluted jgiudge ̂ Volume _I_ndex (DSVI),
is an improved settleability measure over the SVI, and does give a
consistent relationship with log TEFL (Fig 6): for TEFL below 30 kra/g,
corresponding to a DSVI of 150 mA/g, the filaments do not Influence the
DSVI significantly; however for TEFL above 30 km/g, the filaments rapidly
commence to dominate the settling behaviour, indicated by the marked pro-
gressive increase in DSVI. Evidently the DSVI can serve as an indirect
quantitative assessment of the filament length and can be used to identify
bulking sludges. As a guide, one can accept that sludges with DSVI above
150 mA/g, are bulking sludges. With regard to the SVI this consistency of
behaviour is absent; the reported SVI values at which bulking is implica-
ted differ widely - from as low as 100 mA/g to as high as 200 mA/g; from
Fig 6 this is not unexpected. However in the absence of DSVI experience
one Is forced in the interim to use the SVI to identify bulking sludges In
the field. Taking note of the above range, one can accept, rather
arbitrarily, that sludges with SVI's above 150 m£/g are bulking sludges.
5.2 Sludge settleability and secondary settling tank, designprocedures
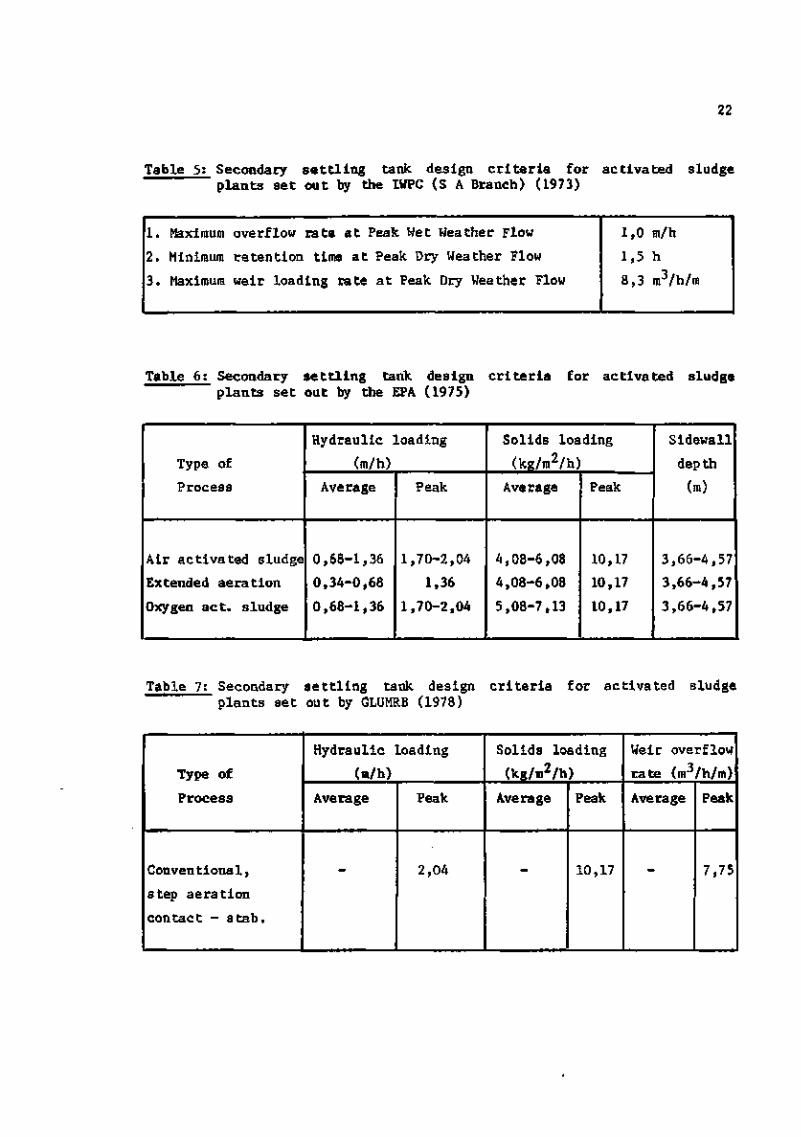
5.2.1 Empirical design criteria
The conventional measure for determining sludge settleability is
the _Sludge J7olume Jitidex (SVI). Despite many attempts, it has not been

19
700
1000
TOTAL EXTENDED FILAMENT LENGTH (km/g)
Figure 6 Relationship between "fatal Extended Hlament Length (TEFL} andthe Sludge Volume Index (SVI) and the Diluted Sludge VolumeIndex (DSVI). The SVI is inconsistently veTated to the TEFL suchThat a sludge with an SVI of ISO mt/g «*m have a TEFL rangingbetween 5 to 70 km/g. In contrast, the DSVI is consistentlyrelated to the TEFL in that a sludge uiih a DSVI of ISO ml/g hasa TEFL of approximately 30 hv/g (Lee at al.t19SS).
possible to incorporate the SVI successfully into a rational settling tank
design procedure. The principal reason for this is the inadequacy of the
SVI as a settleability measure - it has been criticized on the following
aspects: the SVI (1) is not independent of sludge concentration. (2) is not
independent of cylinder diameter and depth (3) is affected by gentle
stirring (4) has no observable relation to Theological properties of
sludge (5) has no relation to the zone settling velocity.
Because of these inadequacies, sludge settleability has not
featured directly in design criteria for settling tanks but enters in an
indirect and often quite empirical fashion: For the various process types,
design criteria have been set down which experience has shown to provide,
usually, for adequate functioning of the settling tank over a range of
settling behaviour that can arise. These rules do not incorporate directly
20
the settleability of the sludge - this is "hidden" in the hydraulic
and solids loading design criteria; examples of such criteria are those
recommended by (i) the Institute for Water Pollution Control (IWPC, SA
Branch) (Table 5), (ii) the United States Environmental Protection Agency
(USEPA) (Table 6), and (iii) the Great Lakes - Upper Mississippi River
Board of State Sanitary Engineers (GLUMRB, or Ten States) (Table 7). All
these criteria in effect implicitly accept that settleability will not
fall below a certain minimum quality, a quality unknown but in conformity
with past experience of similar sludges.
Since 1950, considerable research effort has been directed to
developing improved measures for sludge settleability and incorporating
these into rational theories or design criteria or procedure for settling
tanks. Three such settleability measures have been developed i.e. (i) The
stirred £one ^Settling ^Velocity (ZSV) test with its associated flux theory
(ii) the _Dilute ^ludge Volume JLndex (DSVI) test with its associated ATV*
and STORA design procedures and (iii) the _Stlrred ^Specific JVolume Jndex
(SSVI) test with its associated WRC theory.
5.2.2 Zone Settling Velocity (ZSV) teat and the flux theory
The Zone Settling Velocity test is conducted in a gently stirred
(1 rpra) column of about 100 mm diameter and 600 mm deep. About 2 to 3
minutes after the column has been filled with sludge of a certain
concentration and stirring commenced, the solid/liquid interface begins to
subside and zone settling commences. During stirred zone settling, the
subsidence rate of the interface is called the _Zone ^Settling _Velocity
(ZSV) and is measured from the slope of the straight line portion of an
interface height - time plot. Because the sludge concentration of the zone
settling region remains constant during zone settling and is equal to the
concentration with which the column was originally filled, the ZSV is
associated with the original sludge concentration. By repeating the test
^Research organizations i.e.ATV - Abwasser Technik Verband, Germany.STORA - Stichting Toegepast Onderzoek Reiniging Afvalwater, Ryswijk,
Holland.WRC - Water Research Centre, Stevenage, England.

21
a t different concentrations a set of ZSV concentration data can be
col lected.
The origin of the flux theory can be traced as far back, as 1916
with the work, of Coe and Clevanger. Since that time i t has received con-
siderable research a t ten t ion: notable contributions towards i t s develop-
ment have been by Kynch, (1952), Yoshioka et a l . , (1957), Vesilind (1968),
Dick and co-workers (1967, 1970, 1972), Alkema (1971), Keinath and co-
workers (1973, 1977, 1983), Pitman (1980, 1984) and Ekaroa et a l . , (1984).
To f a c i l i t a t e analyt ical solutions from the flux theory (as opposed to the
graphical ones developed by Yoshioka et a l . , 1957), Vesilind (1968) and
Dick and Young (1972) proposed mathematical expressions linking the ZSV
and the solids concentration; the former proposed a semi-log one i . e .—nX,.
VD = V e z whereas the l a t t e r a log-log one i . e . V = V Xt~n (where VDS O B O B
is the ZSV in m/h and Xfc the MLSS concentration and V and n are constants
that describe the settleability of the sludge called the flux theory
constants). In reviewing these expressions in the flux theory, Sraollen and
Ekama (1984) found the serai-log expression yielded a more consistent flux
model and also gave closer correlation with their measured ZSV -
concentration data at laboratory, pilot and full scale and also with data
reported in the literature.
Today, the flux theory is probably the most rational model avail-
able for secondary settling tanks, its value and usefulness well attested
in the quoted references. However, i t has not been widely adopted for
design and operation principally for three reasons: (i) i t requires
multiple batch stirred settling tests (6 to 10) over a range of concentra-
tions from about 2 to 12 g/£ to obtain the ZSV - concentration data, a
tedious undertaking, ( i i ) measurement of ZSV-concentration data is
uncommon in practice and the test has not acquired familiarity as a sludge
settleability measure with the result that no data base relating this
measure to full scale settling tank behaviour has developed and ( i i i )
to the knowledge of the writers the flux theory per se has not been
verified on full scale settling tanks. These problems with the flux
theory, in particular the tedious ZSV-concentration measurement, has
prompted the development of other simpler settleability measures.
22
Table 5: Secondary s e t t l i n g tank design c r i t e r i a for ac t iva ted sludgeplan ts set out by the IWPC (S A Branch) (1973)
1.
2 .
3 .
Maximum
Minimum
Maximum
overflow r a t e a t
retention time a t
weir loading rate
Peak Wet
Peak Dry
a t Peak
Weather Flow
Weather Flow
Dry Weather Flow
1
1
8
,0
,5
,3
m/h
h
m3/h/m
Table 6: Secondary se t t l ing tank design c r i t e r i a for activated sludgeplants set out by the EPA (1975)
Type of
Process
Air activated sludge
Extended aera tion
Oxygen act . sludge
Hydraulic loading
(m/h)
Average
0,68-1,36
0,34-0,68
0,68-1,36
Peak
1,70-2,04
1,36
1,70-2,04
Solids loading
(kg/m2/h)
Average
4,08-6,08
4,08-6,08
5,08-7,13
Peak
10,17
10,17
10,17
Sidewall
depth
(m)
3,66-4,57
3,66-4,57
3,66-4,57
Table 7: Secondary se t t l i ng tank design c r i t e r i a for activated sludgeplants set out by GLUMRB (1978)
Type of
Process
Conventional,
step aeration
contact - s tab .
Hydraulic loading
(m/h)
Average
-
Peak
2,04
Solids loading
(kg/m2/h)
Average
-
Peak
10,17
Weir overflow
rate (nrVh/m)
Average
-
Peak
7,75

23
5.2.3 The Dilated Sludge Volume Index (DSVI) design procedures
The simplicity of the SVI test has been a major factor contribut-
ing to its popularity. Accordingly there were endeavours at modifying the
test such that it retains its simplicity but improves its usefulness. One
of the main deficiencies of the SVI is its dependency on the JTotal
JSettleable jjplids concentration (TSS). Stobbe (1964) investigated this
dependence and showed that the test result is largely independent of con-
centration if in the 1 litre cylinder the 30 minute ^Settled Volume (SV-Q)
Is less than 250 m£. In consequence, he proposed the _DIluted Jjludge Volume
_Index (DSVI) In which the sludge is diluted such that the SV3Q is less
than 200 m* in the U cylinder; the DSVI is given by the SV30 divided by
the diluted sludge concentration in the cylinder.
5.2.3.1 The ATV and STORA design procedure
The DSVI's insensitivity to sludge concentration makes It a con-
sistent basis for comparison of sludge settleabllity in different
activated sludge plants. The DSVI has been integrated into two settling
tank design procedures proposed by the ATV (1973, 1976) and STORA (1981)
groups respectively. These two procedures are identical in principle and
operate as follows: Using STORA1s symbols, the product of the biological
reactor sludge concentration (Go» g/A) and the DSVI (Ic,r, m£/g) is calleda o v
the Sludge Volume (VS v,mV*). The Sludge Volume VS Is empirically linked
to the permissible overflow rate (q., m/h) found from experience to give
safe designs i.e.
for ATV : qA = 2400 (VSy)*"1*34 sub j ec t to qA < 1,6 m/h (1)
for STORA: qA = — + 200/VSv sub jec t to 300 < qA-VSv < 400 and
qA < 2,0 m/h (2)
The permissible overflow rate function for the ATV procedure is
not based on settling tank failure per se (i.e. gross solids overflow
witheffluent solids concentrations of several hundred rag/A) but on
limiting the effluent solids concentration below 30 mg/A. In developing
their function, STORA (1981) found that there Is only a small difference
in permissible overflow rate for an effluent solids concentration of 30
mg/A and settling tank failure because when failure occurs the effluent
solids concentration increases suddenly from very low (< 30 mg/Jl) to
several hundred mg/A. STORA (1981) therefore based their function on
settling tank failure.

24
Extensive research at full scale, (STORA, 1981) has indicated
that the ATV and STORA procedures predict with reasonable accuracy the
permissible overflow rates from DSVI measurements (Stofkoper and
Trentelraan, 1982). (see section 5.5.4. below).
5.2.3.2. The Koopman and Cadee design proaediwe
A third design procedure based on DSVI measurement is proposed by
Koopman and Cadee (1983) in the U.S.A. In. this procedure the DSVI measure-
ment is used to estimate the flux theory constants VQ and n in the semi-
log ZSV - concentration expression from a set of corresponding DSVI and V
and n data that Koopman and Cadee collected. Once V and n are known, the
permissible solids loading Is calculated via the flux theory. This
approach has not yet been tested at fullscale but clearly its success will
largely depend on the success of the flux theory (see 5.5.3 below) and how
general their set of data are for converting DSVI to VQ and n (Bee 5.4.1
below).
5.2.4 The Stirred Specific Voltme Index and the Water Research Centredesign procedure
White (1975) modified the SVI by Introducing gentle stirring (1
rpm) during settling. He found that this Improved flocculaticm and reduced
short-circuiting and bridge formation effects, thereby creating conditions
more in keeping with those In the settling tank. But more importantly,
gentle stirring Induces a linear relationship between the 30 minute
Settled Volume (SV3Q) and sludge concentration. He called this test the
_S_tirred _Specific ̂ Volume _Index (SSVI). For most sludges White investigated,
the SSVI was independent of the initial sludge concentration. However, for
some sludges this was not the case, hence to Impart a generality to
theSSVI as a comparative measure for sludge settleabllity, he proposed a
standard concentration of 3,5 g/£ for reporting the SSVI data, denoting It
the SSVI3 5.
In terms of the SSVIo c> one empirical theory is available. This
theory, known as the W_ater Research ^Centre (WRC) theory is based on the
flux theory for predicting the maximum solids handling capacity of
settling tanks. Research at full scale has indicated that the WRC theory

25
predicts within 20% the maximum solids handling capacity of a settling
tank based on the SSVIn c as the sludge settleability measure (White,
1975; STORA, 1981; Rachwal et al., 1982). The SSVI3 5 has been widely
adopted in. England as the routine sludge settleability measure and,
together with the WRC theory is extensively used for design and control of
secondary settling tanks.
5.3 Scope of the research
In the UCT research program, the problems with the flux theory
set out above were addressed with a view to making it more attractive for
design and operation of settling tanks. This was largely successful
because with Bettleability data measured and reported in the literature,
it can be shown that it is no longer necessary to do the tedious multiple
batch tests to measure the ZSV-concentration data to obtain the flux
constants V and n because these can be estimated from relationships that
can be established between V and n and the SSVT-, - measure. Furthermore
data was measured and obtained showing that a relationship between the
DSVI and SSVI3 5 also can be established. With the aid of these
relationships the flux theory could be checked against full scale settling
tank data reported by Stofkoper and Trentelman (1982). The same data also
could be used to check the theory of Koopman and Cadee (1983) mentioned
above and to verify the WRC theory developed by White (1975). Finally,
having verified the settling tank theories, the predictions of the WRC and
flux theories could be compared to the ATV and STORA design procedures and
the empirical design criteria set out in Tables 5 to 7. From a
comparison with the empirical design criteria the "hidden" sludge
settleabilities in the criteria could be estimated. The remainder of this
report discusses the more important results of this research.
5.4 Relationship between sludge settleability measures
5.4.1 Relationship between flux theory constants V^/n and SSVI-, ,-
Accepting the semi-log expression for the ZSV-concentration data
i.e. Va =* V_ exp(-nX.), Pitman (1984) found that the flux theory constants
VQ and n, when expressed as V divided by n, i.e. V /n, correlated well
with the SSVI3 5 (see Fig 7). The relationship he obtained is
VQ/n = 67,9 exp(-0,016 S S V I ^ ) (r2 = 0,968) (3)

26
To verify the generality of Pitman's data, these are compared
with data reported in the l i t e r a t u r e in Fig 7. In Fig 7, the data of
Rachwal e t a l . (1982) are averages of a number of years full scale opera-
tion; White's data (on which the WRC theory is based), which were
calculated by equating the WRC and flux theory and finding paired data for
V_ and n and SSVIo c, show a remarkably close correlat ion to Pitman's. The
data that deviate s ignif icantly are those of Koopman and Cadee; However,
they did not measure the SSVIo 5 d i rec t ly , this was estimated from the
DSVI accepting that SSVLg 5 = 0,67 DSVI (see 5.4.2 below); apart from the
deviation that may ar ise from the conversion, the principal cause for the
deviation is that in Koopman and Cadee's the ZSV batch t e s t s , to obtain V
and n, the concentration range waB only 0,7 to 4,8 g/A, a range that is
much too narrow for re l i ab le V and n values and also much narrower than
that of the other researchers (1 to 12g/£).
Knowing V / n from the SSVI, = does not unambiguously define V
and n individually. This problem can be overcome because White's, Pitman's
and Rachwal's data indicate that as V/n. Increases ( i . e . s e t t l e a b i l i t y
improves) so n decreases; a l l three data sets correlate well when plotted
n versus log ( V / n ) . Pitman's data yield
n = 0,88 - 0,393 log (VQ/n) ( r 2 = 0,976) (4)
Once n is known, VQ is found from Eq 5 i . e .
vo = <Vn ) n
The importance of Pi tman 's data Is tha t they confirm White 's
o r i g i n a l work and firmly e s t a b l i s h e s the r e l a t i o n s h i p between V / n and
SSVI, c, and n and V / n . P i tman ' s work conso l ida t e s the WRG and Flux•J f J O
theories into a single theory so that with only SSVIo 5 data, the design
engineer and plant operator has at his disposal both the WRC and flux
theories and can utilize aspects of both in his work. Both these theories
are verified against full scale data, (section 5.5.2 below). In the
interests of brevity, detailed comparison of the WRC and flux theories is
not presented in this report; such a comparison shows that the WRC theory
requires a small modification to make i t identical to the flux theory.
This modification introduces the cri t ical underflow rate which

27
Iou
s
0.9
1.0
I II . '
1,2
13
1 A.1.4
1.5
1.6
>?
— 9- 1 0- I I- 1 2
- 1 4"~I6
1 A
— 18—20- 2 2- 2 4- 2 6
F3 0
-35
- 4 0- 4 5
i < i
Koopman & ^^^Codec d a t a i >based on , '
/
/ Li
• yf><^
ifJM v
yT n •
1 1 I
I 1 1 1
^V~""'^ta- -^ z . Average of
f L ••• readings ~X. I4e readings _j .3. sio readings4. 13 readings
^•White's data « _"--~ Pit man's data. • _
Averages of • years ~fulscale plant datd —
0.88-0,393. log tVo/n) ~
• i i i
SO 100 150STIRRED SPECIFIC VOLUME INDEX
200(ml/g)
Figure 7 Relationship between sludge settleability parametersVo/n and SSVI3 5 showing data from Pitman (1985), White(1975), Raahwal et al. (1982) and Koopman and Cadee(1983). With the exception of the last, there appearsto be a consistent relationship between Vo/n and """"•"
sets an upper limit to the underflow rate beyond which settling tank
overload cannot be ameliorated by further increases in underflow rate.
5.4.2. Rflationihip between DSVI and SSVI3 5
Stofkoper and Trentelman (1982) report DSVI and SSVI3 5 data
pairs measured on 25 activated sludge plants (with and without primary
settling) in Holland. Their data are shown plotted in Fig 8. Although
there is a fairly wide scatter, it seems that the DSVI and SSVI3 = are
linearly related i.e.
SSVI3 5 = k. DSVI (6)

28
where k = constant of proportionality = 0,65.
Data on 13 plants in the Western Cape over a wide range of
settleability confirm Eq (6). However a slightly higher k value was found
i.e. 0,68 instead of 0,65 (see Fig 9).
The spread of data in Figs 8 and 9 Is such that there is little
to choose between the two k values. Consequently, until the k value is
more precisely fixed, or an improved relationship found with the aid of
more data, it seems reasonable to assume that the SSVTg g is approximately
2/3 of the DSVI i.e.
SSVI, c - 0,67 DSVI (7)
The relationship between SSVT3 5 and DSVI allows a comparison to
be made between the DSVI based ATV and STORA design procedures and WRC and
flux theories. This comparison is discussed briefly below (Section 5.6).
If it is possible to establish a firm relationship between the
SSVI3 5 and DSVI, it will become possible to use the WRC and flux theories
and their associated design and operating charts with DSVI measurements
which is a simpler and hence more appropriate measure for settleability in
the field. However, it seems from the scatter of data collected to date
that, from a design point of view, such an approach may not be
sufficiently accurate and that it will have to stand over until more data
are available. For this reason it is recommended that wherever possible,
the SSVIo C or DSVI, but preferably both, are measured routinely on full
scale plants so that a data base for these measurements can be
established. Such a data base will be of great value for design of
secondary settling tankB.
5.4.3 Relationship be tureen SVI and fluxV0/n
Owing to the general acceptance of the SVI in practise, one may
ask if it is not possible to establish a relationship between the SVI and
the flux theory constants VQ/n and so side-step the problem of encouraging
operators and engineers to adopt the DSVI and/or SSVI3 5. In his paper,
Pitman (1984) presents a relationship between the SVI and the flux
constants V /n and suggests that with this relationship, the flux theory,

(ml/g) STIRRED SPECIFIC VOLUME
50 100
INDEX (SSVI3B)
150 200
100 -
v.i
200 - 1
QUJI-
o
300
V\
•
114BO%
1
u.
1 1 I 1 • 1
Data from STORA (Holland)
\ f< J
A \ •
PEBCENTILEt \OF ANNUALAVCNAOC MVI
• 0 M plant• Rijtn plantA it other plants
\ Xaes'iBMt fit- \ ^VSSVIM-0,67 DSVI \ X.
tANTS TRtATM*SETTLED IWWH
S3 1, RAW
•
>LANT« TWATIN**CWAtt
• 1
\\
\ "1 1 1 1400
Figure S Relationship between tsludge eettleability parametersDSVI and SSVI3t$; data from STORA (1981) on 3b plantn inHolland. Data hhow aome Bcattei\ hut heat fit yieldsSSVI^^ = 0,65 DSVI. Diotvibutiono of annual averageDSVI measured on S3 raw and 11? settled seaage plants inHolland are Bhoan on DSVI axis (Isft).
CO
90 KX) 150 200DILUTED SVI (ml/g)
250
ura 9 Relationship between sludge Bettleability parametersDSVI and SSVI$ c, from 13 plants in the Western Cape.Data show Borne'scatter but best fit yields SSVI3 j -0,6? DSVI.
D

30
and Its associated design and operating chart proposed by Ekama etal.,
(1984), can be used with the SVI measurement. Although the relationship
correlates reasonably well (r = 0,913), the writers are of the opinion
that it should not be used because of the SVI's dependence on sludge con-
centration at high 30 minute settled voluraeB (SV-Q > 400 ml/I) and other
problems associated with it (see 5.1 and 5.2.1 above). It is possible that
from the settleabilities and concentrations measured by Pitman, the SVI
was not strongly affected by concentration (which may be why he obtained
the reasonable correlation), but this concentration effect may be substan-
tial with other sludges. Indeed it is because of the unpredictable
behaviour of the SVI at different concentrations between different
sludges, that the more reliable SSVIg g (or the DSVI, with the necessary
caution, see 5.4.2 above) is preferred for estimating the flux constants
VQ/n.
5.5 Verification of the settling tank theories
5.5.1 Data source
STORA (1981) undertook an extensive investigation into full scale
secondary settling tank behaviour in which they analysed 45 cases of
solids loading on 23 plants. The settling tanks Investigated were circular
and had
i) diameters larger than 30 m
11) side wall depths of 1,5 to 2,5 m
ill) conical bottoms with a slope of 1 in 12 towards the centre
iv) scraper sludge collection systems to central sludge collection
hoppers
y) peripheral overflow effluent weirs.
Each test was conducted as follows: Influent to the plant was shut off and
accumulated in the sewer. At the same time the underflow recycle was set
to the required rate and, while the Influent was withheld, the settling
tank emptied itself of sludge. The test commenced at the moment the
influent pumps were started and set at the required flow rate to give a
preselected overflow rate. The flows were kept constant until the test led
to (1) sludge loss over the effluent weirs in which case the test ended in

31
a solids overloaded state, (ii) a steady state in which the sludge blanket
remained at a constant level in the settling tank, in which case the test
ended in a solids underloaded state and (iii) an inability to maintain the
influent flow at the specified rate due to a shortage of sewage, in which
case the final over- or underload state was inferred from the measurements
stated above - if this was not possible with reasonable accuracy, the test
was deemed inconclusive. During each test the following were measured at
regular intervals (i) influent and recycle flows (ii) sludge settleabllity
with the SSVI3 5, DSVI and batch ZSV*.
5.5.2 Comparison of predicted and Measured aaxlaun solids loadingfor the Flux, WRC and K & C theories
For the 45 tests, the applied solids loading (G ) was calculatedap
from the influent and underflow rates and the solids concentration in the
feed flow to the settling tank at (i) the onset of failure for the over-
loaded cases and (ii) equilibrium for the underloaded cases. For the (i)
flux (ii) WRC and (iii) jCoopman and £adee (K & C) theories, the predicted
solids loading was calculated from the measured influent and underflow
rates, the settler feed flow concentration and sludge settleability: for
the flux theory the V and n were estimated from the measured SSVTn =
withthe aid of Eqs (3 to 5); for the WRC theory the measured SSVLj 5 was
used directly and for the K & C theory, the V and n were calculated from
the measured DSVI with the aid of the equations given in their paper. A
comparison of the predicted and applied solids loading for the Flux, WRC
and K & C theories is given in Figs 10 to 12 respectively. In Figs 10 to
12, the different settling tank loading cases are marked as follows:
solids overload I.e. failure X; solidB underload i.e. safe 0 and
* T h i s data unfortunately cannot be used because these, like those ofKoopman and Cadee, were measured over too narrow a concentration range (1to 4,5 g/A). Because of this, STORA (1981) Incorrectly concluded that theflux theory, although providing a good conceptual model for secondarysettling tanks, is unsatisfactory for predicting settling tank failure.This comment is not Intended to disparage their work; on the contrary thescope and detail of the work Is very impressive and their experimentaldata are the most valuable and comprehensive available in the literature.In the opinion of the writers this research obviates the need for doingfull scale settling tank experimentation until the wealth of informationcontained in all the data has been carefully evaluated.

32
inconclusive A; for perfect prediction, a l l the X's should fa l l below the
diagonal and a l l the O's above. Because many data fa l l near the diagonal,
the data are suff icient ly discerning to locate the onset of solids
overload.
For the flux and WRC theories, 6 overload cases fa l l incorrectly
above the diagonal, but no underload cases f a l l incorrectly below the
diagonal. This indicates that the theories tend to overpredict the maximum
solids loading; if the predicted solids loading is reduced by 20% (which
is shown in Figs 10 and 11 by the l ine Applied = 0,80.Predicted) a l l
except one solids overload cases are correctly placed. The reason for th is
reduced loading rate is ascribed to the differences in the direction of
the flux flow patterns in the se t t l ing tes t on which the predictions are
based and in the full scale tank; In the former these are ver t ical only
whereas in the l a t t e r these are horizontal and v e r t i c a l . For the K & G
theory (Fig 12) a l l the data points generally fa l l lower in the diagram
indicating that this theory generally predicts lower solids loadings
compared to flux and WRC theories. This is because generally lower VQ and
n values are estimated from the STORA measured DSVI data with K & C's
re la t ionships ; this is indirect ly reflected in Fig 7 in which the K & C
data fa l l above the other researchers (on the basis that SSVI- - = 0,67
DSVI; the K & C data conform best in Fig 7 when SSVI3 5 = 0,80 DSVI, but a
constant of proportionali ty of 0,80 seems too high compared to the data in
Figs 8 and 9) . Despite the generally lower prediction of the solids load-
Ing with the K & C theory, 5 overload cases fa l l incorrectly above the
diagonal and 2 underload cases fa l l incorrectly below the diagonal (Fig
12). In order to estimate the approximate solids loading i t seems that
with this theory also the predicted solids loading should be reduced by
20% (see Applied = 0,80 Predicted l ine in Fig 12). On the basis of th is
reduction, a l l except one (the same one found In the flux and WRC
theories) overload cases are correctly placed, but the exception is not
misplaced very far as for the WRC and flux theories.
5.5.3 Qualitative verification of the flux theory
The observations made during the different loading cases can be
used to verify the fundamental principle of the flux theory. I t was found
that a d i s t inc t sludge blanket level exists between the sludge on the

z
3CO
QLJ
OOUl
VERIFICATION OFFLUX THEORY
UNDERLOADEDOPERATINGREGION
EXPERIMENT LED T O -
+ ft OVERLOAD
ft • UNDERLOAD
A 4 NO EQUILIBRIUM
FLUX CONSTANTS-CALCULATED FROM
DSVI
OVERLOADEDOPERATING
REGION
15
ena
oen 5
aUJ
oo
VERIFICATION OFMODIFIED WRC THEORY
UNDERLOADEDOPERATINGREGION
EXPERIMENT LED T O - -
W OVERLOADO • UNDERLOADA A NO EQUILIBRIUM
PftEEKCTIONS FROMMEASURED-S S V I j , f S 3 V I 3 ) 3 -
i {ojBrosvi-
OVERLOADEDOPERATINGREGION
L
I I
5 10
APPLIED SOLIDS LOADING (hg/mz/h)15
APPLIED SOLIDS
JO
L O A D I N G
15
Hgura 10 Verification of the flux theory; predicted solids loadingvefsue applied solids loading observed during 45 fullscale settling tank cxperimento by STOEA (19B1). The theoryoverpredictss the aolids loading by about H0%.
Figure ]1 Verification of the modified WHC theory; predicted solidaloading versus applied solids loading observed during 45full ecale settling tank experiments by STORA (1981), Thetheory ouerprediota the solids loading by about 20%.
u>

34
B
10
(9
ICO
3 5
o
ao
VERIFICATION OF K00PMAN S
CAOEE THEORY
UNDERLOADEDOPERATINGREGION
plut 2 0 %
minus 20%
_ PREDICTIONS FROMMEASURED DSVI
11 EXPERIMENT LED TO-X OVERLOAD• UNDERLOAD
A NO CQULIBRIUM
OVERLOADEDOPERATINGREGION
10
APPLIED SOLIDS LOADING tkg/mz/h)
Figure 12 Verification of the Koopman and Cadee theory; predictedsolids loading versus applied solids loading observedduring 45 full scale settling tank experiments by STORA(1981). The theory overprediats the solids loading byabout 20Z.
15
bottom of the tank and the clear supernatant ahove. At the start of the
test, there is sludge only in the cone near the centre of the tank. As the
test proceeds and more sludge enters the tank than is removed, first the
bottom cone fills with sludge. When the cone is full, the sludge blanket
level becomes horizontal and remains so throughout the remainder of the
test irrespective of the outcome. In the underloaded cases, the sludge
blanket level rises only to a certain height which is less than 0,3ra above
the bottom of the side wall. When this occurs the feed and underflow
concentrations remain constant and the sludge concentration in the blanket
increases towards the bottom in horizontal layers except near the inlet
construction. The concentration in the bottom of the tank always is
greater than in the underflow. In the overloaded cases, the sludge blanket
level continues to rise until it reaches the overflow weir, its rate of
rise depending on the severity of the overload. While the blanket is
rising, the effluent solids concentration is low and remains constant. As

35
soon as the blanket level is above 0,2ra below the weir, sludge loss in the
effluent commences and the effluent solids concentration increases
suddenly by several hundred mg/A. Under these conditions, a sludge layer
of constant concentration and thickness ranging from 0,5m (near the middle
of the tank) to 0,3m (near the periphery) exists in the sludge blanket
over the whole area of Che tank. Its position, thickness and concentration
do not change with time. Below it, a zone of increasing concentration
exists having a depth of about 0,5m parallel to the sloping bottom.
The essence of the flux theory is that it predicts that under
overloaded conditions there is a critical zone settling layer of sludge
which limits the Bollds transport to the bottom of the tank. This layer
builds up and causes the sludge blanket level to increase. The observa-
tions cited above indicate that this behaviour indeed occurs under
overloaded conditions thereby providing support for the fundamental
principle on which the flux theory is based. The other aspects of the flux
theory can be developed from this fundamental principle and it can be
shown that these also agree with the full scale observations cited above
(except that the concentration in the bottom of the tank is greater than
in the underflow, but this is caused by the sludge collection systems
rather than a theoretical inadequacy).
5.5.4 Verification of the ATV and STORA procedures
The ATV and STORA design procedures in essence are the same. Both
provide a means to calculate the surface area and depth of the settling
tank. With regard to the surface area, this is estimated from the
permissible overflow rate (q^) and the j]eak jfet feather _Flow (PWWF), where
q^ at PWWF is calculated from the empirical expressions (Eqs 1 and 2)
linking q* to the ^Sludge JTolume -(VSy) by an iterative process: During
PWWF, sludge is transferred from the biological reactor to the settling
tank and needs to be stored there to avoid solids overload. This causes
the biological reactor concentration (G ) at WWF to be lesB than that at
_Dry Vfeather JTlow (DWF). The lower Gfl at WWF reduces the VS y which in turn
allows a higher q^. An iterative procedure is followed by successively
reducing Gg and continued until (i) the permissible sludge storage and
required sludge storage are equal, (ii) the G at WWF is reduced to ao a
minimum of 2 kg/nr or (iii) a maximum of 30% of the sludge mass is stored

36
In the settling tank. Methods and equations for calculating the
concentration at which the sludge ia stored and volume available in the
tank for sludge storage are given by the two design procedures.
With regard to the depth design in the two procedures, these also
are similar and are based on the research of Merkel (1971a, 1971b, 1974)
and Billraeier (1976). Four distinct zones are recognized in the tank I.e.
from the bottom (i) thickening zone (ii) buffer or Bludge storage zone
(111) separation zone and (iv) clear water zone. Methods for estimating
the depths of the four zones and the concentrations in them are given. The
required average depth (side wall + centre depths divided by 2) is the sura
of the depths of the four zones but may not be less than 2 m.
STORA used their full scale data to check the ATV q A~vS v
expression for estimating the overflow rate (Eq 1). For each loading case
the VS was calculated from the measured DSVI and reactor concentration GQV SL
at the end of the loading test i.e. to take account of the G^ reduction as
required by the ATV procedure. The applied overflow rate q. was plotted
versus the VS in Fig 13 where the following symbols denote the outcome of
the loading test - X failure i.e. solids overload, • equilibrium i.e. safe
and no solids overload, and A inconclusive (see Fig 13). The ATV guide
line (Eq 1) also is plotted in Fig 13. For perfect prediction, all the X's
should fall above the line and all the • below. Figure 13 shows this to be
the case generally for VSy < 500 vxS./X. However, for VSV > 500 mA/A (which
are the usual design conditions) there are a group of safe loading cases
that fall above the line indicating that for these VS V values, the ATV
theory tends to be too conservative. This conservativeness of the ATV
guide line prompted STORA to modify the empirical ATV guide line
distinguishing between safe and failure load cases (see Fig 13).
In their experimental work STORA also measured concentration
profiles in the settling tanks in order to check the depth design of the
ATV procedure. The most important aspect in the design of the depth is the
estimate of the concentration in the sludge storage zone (Gc) during WWF.
The estimate of Gc was adopted from Merkel's (1971a, 1971b, 1974) work and
is given by Gc = 500/Igv kg/m3 (where I g v 1B the DSVI). STORA's measured
concentrations in the storage zone were consistently 1,2 kg/ra higher than
the estimated values, but they did not modify the equation because a
slight underestimate of the sludge storage concentration introduces a
factor of safety against solids overload having PWWF.

37
5.5.5 Discussion on the ATV and STORA procedarea
With regard to the estimate of the overflow rate, considering the
simplicity and apparent highly empirical nature of the guideline
expressions (Eqs 1 and 2) the ATV and STORA guidelines can be seen to give
remakably close boundary lines between settling tank overload and
underload cases. Surprisingly, when tracing the development of the ATV
procedure, it can be shown that the ATV expression (and hence the STORA
also, though more indirectly) has its roots in the concepts of the flux
theory: Merkel (1971a, 1971b, 1974), from a set of sludge settleability
data (including paired data of ZSV (m/h) and 30 minute settled volume SV3Q
(tnJl/A), which he accepted to be numerically equal to the Sludge Volume
VS ) developed an equation based on flux principles from which the over-
flow rate can be calculated from given DSVI, reactor concentration G_ and
underflow recycle ratio R (Fig 14a). Furthermore, from a set of sludge
thickening time - concentration data, he developed also a procedure for
calculating the depth requirement of the settling tank from given DSVI, G
and R (Figs 14b and c). From Fig 14a, the recycle ratio R only affects the
overflow rate at good sludge settleability and/or low reactor concentra-
tion (i.e. VSy < 500 mX./l), situations for which one would not normally
design. Noting this, Kalbskopf (1972) simplified Merkel's overflow rate
equation by- suggesting that the product of the overflow rate qA, reactor
concentration Gfl and DSVI, a parameter which he called the _Sludge Volume
Loading (VSA), can be assumed constant i.e.
VS A - qA Ga.DSVI. [A/(m2h) or m3/(m2h)] (8)
qAVS.v
However he does not specifically recommend what VSA value should be
adopted. From his graphs it appears VSA can range between 0,2 and 0,6,
which Is a very wide range and consequently a little counter-productive to
his suggestion that VS A can be assumed constant. Nevertheless his approach
seems to be sound because both the ATV and STORA expressions have an
almost constant VS A i.e. > 0,3 for low VS v and < 0,4 for high VS .
The approach of Kalbskopf eventually led to the ATV overflow rate
versus VS y expression set out in Eq (1), by trial and error relocation of
the line to fit experimental data. The data that appear to have been

38
~ 1,0
3 0,5fa.
0,0
.STORA guidfllin*.ATV guideline
U Solids ovcrlood• Solids und«rtood.A Incooclusivt
200 400 600 800 KXDSLUDGE VOLUfcK (VSV) (ml/1)
Figure 13 Verification of the ATV and STORA guidelines; comparison ofthe overflow rate (q^l versus sludge volume (VSy) expressionsrecommended by AT/ and STORA with that measured on 45 fullscale settling tanks by STORA {1981}. The ATV guideline tendsto be too conservative for sludge volume > SOO m£/£, whichled to the relocation of the guideline by STORA to give acloser correspondence between prediction and observation.
2.0
1.5
i0 500
(ml/1) SLUDGE VOLUMEtOOO
(ml/1) SLUDGE VOLUME0 500
(ml/1) SLUDGE VOLUME(000
(VSy t
Figure 14 Permissible overflow rate (qA) (Fig Ua, left), sludge blanketdepth <hgen) (Fig lib, centre) and stored sludoe volume intank/unit area (SnTev/A) (Fig 14c, right) versus sludae volume!VSV) (vertical axis) from Merkel's flux based settling andthickening theory. Note (i) low recycle ratio IE) and poorsettleabititu (VSV > 500 mt/£) causes low overflow rates, deepsludge blankets and large stored sludge volumes and (ii) recycleratio affects overflow rate only for average to good settle-ability (VS.j < SOO m£/£).

39
accepted by the ATV to fix the qA - VS y line are those measured by Pflantz
(1969) on two full scale treatment plants in Germany: in Figs 15a and b
effluent suspended solids concentration contours are plotted in the qA -
VS diagram; also shown is the ATV guideline expression, Eq (1). In Fig
15a the guideline accepted by the ATV falls very close to the 30 mg/Jl
effluent TSS contour; in Fig 15b, the guideline does not conform so well
to the 30 mg/A effluent TSS when VSy < 450 mJL/JL but the correlation for
VS V > 450 mA/£ (which are the normal design situations) nevertheless is
reasonable. The differences between effluent TSS contours in Figs 15a and
15b arise apparently due to differences in DSVI of the sludge at the two
plants; at Celle (Fig 15a), this was 80 mA/g and at Fallingsbostel (Fig
15b), this was 155, 201 and 306 mA/g.
The overflow rate (qA) - _Sludge ^Volume (VSy) expression of the
STORA procedure can be viewed as a further relocation of the guideline in
the qA - VSV diagram but in this instance it is positioned so as to
distinguish between solids underload and overload conditions rather than a
specific effluent TSS concentration. Although this is a difference in
principle (and is the only significant one between the two procedures), in
practice it leads to only relatively small differences in overflow rate.
The reason for this Is that the settling tank operates safely with
increasing overflow rate, except for small increases in effluent TSS con-
centration, until solids overload takes place, when precipitously, the
effluent TSS increases from low values (30 - 60 mg/Jl) to several hundred
5.6 Comparison of the Flux and WRC procedures and the ATV and STORAprocedures
The major differences between the Flux and WRC design procedures
and the ones set down by the ATV and STORA are that (i) the ATV and STORA
do "not recognize the underflow recycle ratio as important In the estima-
tion of the permissible overflow rate whereaB the WRC and Flux procedures
do recognize this, and (ii) the ATV and STORA procedures include criteria
with which the depth of the settling tank can be estimated whereas no
methods are provided for this in the Flux and WRC procedures.
A direct comparison of the overflow rate estimates by the Flux,
ATV and STORA procedures is given in Fig 16. The WRC predictions are

40
Tnotnwnt plant CELLE
SO 400 600SLUOfC VOLUME ( n l / l )
HXO
u
u§
Qfi
Trtatiwwt plant FALLIN6B0STE1.
D1VI" IBBml/fc • 201
» 3O«
Ef f hurt l *eonemtrailom mfl/t
I200 400 «00 800
SLUDOE VOLUME (ml/1)1000
Figure 15 Effluent suspended solids (Gg, mg/£) aontours for overflowrate (q^) versus sludge volume (VSV) for treatment plantsCelle (left) and Fallingsbostel (right) (data from Pflantz,1969), ATV guideline also shown and seems to indicate thatthe guideline is set to give 30 mg/£ effluent solids.
2,0
e 1,5
i . o -
0,5
OJD,
—ill" vf
• i i i
FLUX THEORY |• 0 % «f Ms. mm
/•> 4O% }m*r1
//
^ ITORA|
1 •
krflMT r«t«
\%\M OOM."
tm
l«ld«Jl>tM I M
200 400 600 800 1000 1200SLUDGE VOLUME (VSV ) ( ml/1)
Figure 16 Comparison of predicted maximum overflow rate (qpj fordifferent sludge volumes (VSV) for the ATV, STORA and fluxprocedures. Flux theory overflow rates (reduced to 80% inconformity with verification) at 80% and 40% optimum under-flow rates for 2,5 to 6,0 g/£ reactor concentration.

41
omitted because these are virtually the same as those from the Flux pro-
cedure. The comparison Is based on the following: (i) because the flux
theory tends to overpredict the applied solids load by 20%, the predicted
solids loading was reduced by 20% by reducing the applied fluxes attribu-
table to both the Influent and underflows by 20%. (li) Pitman's data were
used to convert the VQ and n to SSVI^ 5 which in turn was converted to
DS?I on the basis of DSVI = 1,5 SSVI3 5, (ill) Flux theory predictions are
shown for recycle ratios set at 80% and 40% of the optimum values giving
the maximum permissible overflow rate (actually, 100% and 50% of the
optimum recycle ratio was chosen but because of the 20% reduction in
accordance with (1) above, this is reduced to 80% and 40%). (iv) for the
flux procedure, the overflow rate is sensitive to the feed concentration
so that a range of concentrations from 2,5 (top of band) to 6 g/A (bottom
of band) are presented in Fig 16.
The following conclusions can be drawn from Fig 16:
(I) According to the flux procedure (and hence also the WRC), doubling
the underflow rate from 40% to 80% of the optimum increases the
overflow rate by about a third. This beneficial influence on the
overflow rate of increasing the underflow rate Is absent in the ATV
and STORA procedures.
(II) For good sludge settleability (VSy < 500 mA/i.) the ATV and STORA
design procedures are considerably more conservative than the flux
procedure whereas for average to bad settling sludges (VS > 500
which would be the normal design situation, the different
procedures yield approximately the same permissible overflow rates.
This seems perplexing on first sight since all the procedures have
been verified against the same set of data so that some degree of
uniformity is expected. However the differences can be explained and
are attributable to (a) variations in sludge settleability parameter
conversion factors - these factors do show some variability between
different sludges (see Figs 7 to 9) and different factors would lead
to relative relocation of the lines and (b) one third of the solids
loading experiments by STORA have recycle ratios less than half of
the optimum for the maximum permissible overflow rate. Such low
underflow rates significantly reduce the permissible overflow rate
below the maximum, an effect that occurs to a far greater degree at

the good sludge settleabllity and/or low feed concentration (low
VSy) than at poor settleability and/or high feed concentrations,
(ill) for the normal design conditions i.e. average to poor sludge settle-
ability (VSV > 500 mi/A) the flux, WRC, ATV and STORA design
procedures give approximately similar permissible overflow rates and
differences in the procedures such as the influence of underflow
rate, do have an effect but are of no major consequence.
5.7 Comparison of flux and WRC theories with empirical designcriteria
Having established the qualitative and quantitative validity of
the flux theory, the predicted maximum overflow rates and associated
maximum solids loading can be compared to the empirical design criteria
set out in Tables 5 to 7. This was done as follows: For a selected
SSVIo c, the V and n values were calculated from Eqs (3 to 5). From V ,
the optimum underflow rate, (which gives the maximum permissible overflow
rate) (QrM)o» is calculated from (Q /A) = VQ/e . The maximum permissible
overflow rate, (Qj/A)m, is given by (Q i/A) m = VQe °, where XQ is the
biological reactor sludge concentration. Now, the associated maximum
solids loading, G a p m, Is calculated from G a p m * XQ {(Q±/A)m + (Qr/A)o}f
but to conform to observations this needs to be reduced by 20%. In making
the 20% reduction to G , it was accepted that the fluxes contributed by
the influent and recycle flows are each reduced by 20%. In Figs 17 and 18,
the reduced maximum overflow rate and solids loading respectively are
plotted versus the SSVI3 g settleability measure. For convenience, the
flux VQ/n and DSVI settleability measures calculated from EqB (3 to 7) are
shown also. To Bhow the similarity between the modified WRC and flux
theories the maximum solids loading for the modified WRC theory are
plotted also in Fig 18. In Fig 18 the Modified WRC line is calculated as
follows; from a selected SSVI3 g the optimum underflow rate is calculated
(this calculation is the essence of the modification); knowing the
underflow rate, the applied flux is calculated with the usual WRC
equation; the applied flux Is reduced by 20% and Is Independent of reactor
concentration which is why there is only one line for applied flux in Fig
18. Superimposed on Figs 17 and 18 are the recommended design criteria set
out In Tables 5 to 7. Because these criteria are independent of sludge
concentration and settleability, each plots as a single horizontal line.
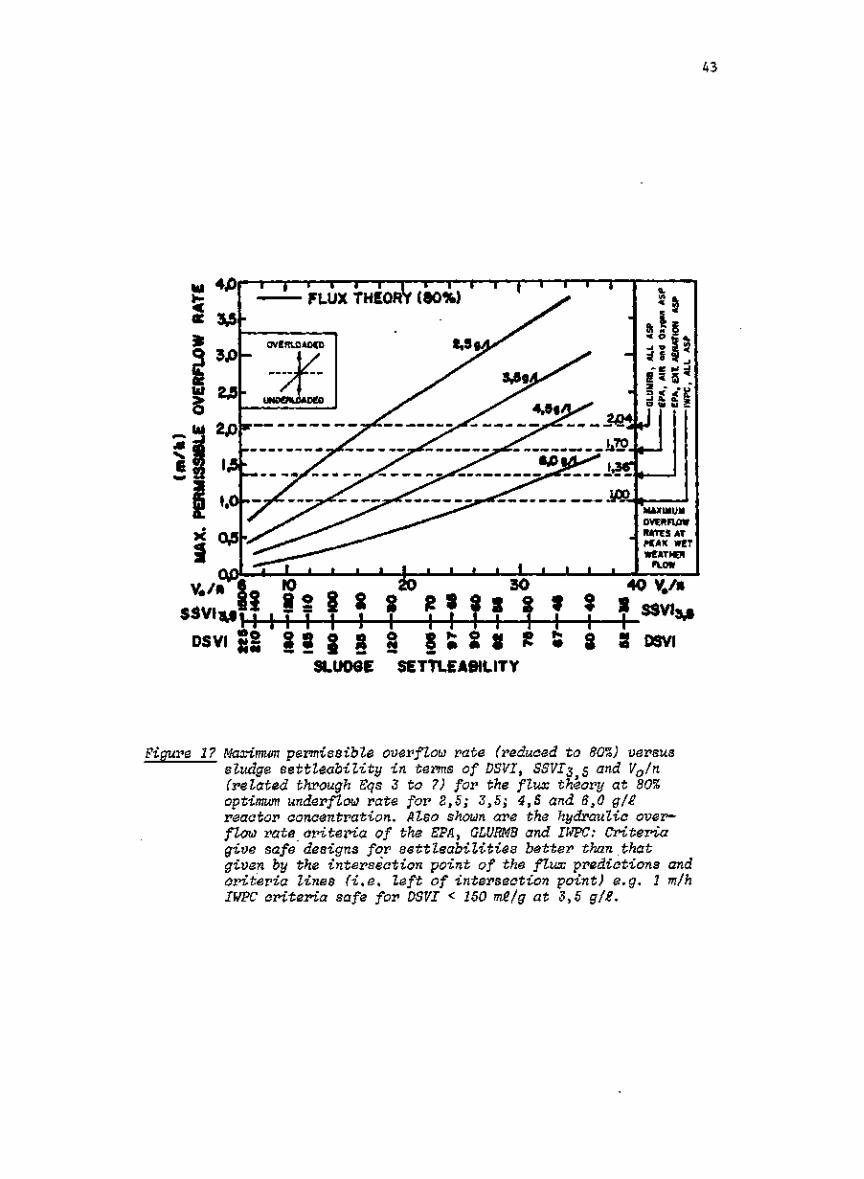
FLUX THEORY (80%)
MAXIMUMOVERFLOWRATES ATPCAK WETWEATHCT
FLOW
f f f i f f ? f f™«DSVI SS DSVI
SETTLEABILITY
Figure 1? Maximum permissible overflow rate (reduced to 80%) versussludge settleability in terms of DSVI, SSVI3 5 and Vo/n(related through Eqs 3 to ?) for the flux theory at 80%optimum underflow rate for 2,5; 3,5; 4,5 and 6,0 g/£reactor concentration. Also shown are the hydraulic over-flow rate criteria of the EPA, GLURMB and IWPC: Criteriagive safe designs for settleabilities better than thatgiven by the intersection point of the flux predictions andcriteria lines (i.e. left of intersection point) e.g. 1 m/hIWPC criteria safe for DSVI < 150 m£/g at 3,5 g/£.

44
I • i T i i i iFLUX THEORY (80%)MODIFIED WRC TW0RY(80%>
SOLIDS OVERLOADje FAILUREREGION
EPA.GLUMRB1 CRITERION
SOLIDSUNOERLOADie SAFEREGION
CRITERION HOLDSTOR SET1l£ABlL]TYBETTER THAW63
CRITERIONnuts FOR
D3VI > lOOal/f
DSVI g{2 • S §. S § S DSVISLUDGE SETTLEABILITY
Figure 18 Maximum solids loading (reduced to 80%) versus sludge settle-ability in terms of DSVI, SSVIS)5 and Vo/n (related throgh Eqs3 to ?) for flux and WRC theory'at 80% optimum underflow ratefor 2,5; 3S5; 4,5 and 6,0 g/2 reactor concentration (XQ).Also shown are the EPA and GLUMRB maximum solids loadingcriterion, which gives safe designs for settleabilities betterthan that given by the intersection point of the flux (and WRC)predictions and criterion lines, e.g. criterion safe for DSVI< 100 m£/g at 3,5 g/£.

45
The approximate sludge settleability that is "hidden" in the
criteria is given at the intersection point of the horizontal lines and
the calculated lines for the flux and modified WRC theories. From Fig 17,
it appears that for a reactor concentration of 3,5 g/% (an approximate
average for S A plants), the IWPC 1 m/h overflow rate will yield safe
settling tank designs for sludges with SSVIq c below about 100 m£/g or
DSVI below about 150 ra^/g. The higher overflow rate criteria set by the
GLUMRB and EPA require better sludge settleability for safe designs than
that set by the IWPC i.e. for a reactor concentration of 3,5 g/A, GLUMRB
requires an SSVI3 g below about 63 m-Vg (DSVI < 95mA/g) and the EPA an
SSVIo = < 85 m£/g (DSVI < 130 raA/g) for extended aeration and an SSVIn = <
75 mA/g (DSVI < 110 m^/g) for air and oxygen activated sludge. The maximum
solids loading criterion set by the GLUMRB and EPA (Fig 18) will lead to
safe designs if the SSVI3 5 is below about 65 mA/g (DSVI < 100 m£/g): For
the GLUMRB this settleability is consistent with that which leads to safe
designs on the basis of overflow rate provided the underflow rate is set
at the optimum; for the EPA, this settleability is better than that which
leads to safe designs on the basis of overflow rate, indicating that the
solids loading criterion is the limiting one If the settling tank is
operated at the optimum underflow recycle rate.
5.8 Conclusions
The review above indicates the following:
1. The flux theory forms the basis for describing secondary settling tank
behaviour. The origin of all the design procedures i.e., the flux,
WRC, ATV and STORA, can be traced to the flux theory. The differences
between the different design procedures are more apparent than real
and arise from different settleability parameters and simplifications
incorporated In them for practical convenience.
2. The DSVI and /or SSVI3 5 should be adopted as the new sludge settle-
ability parameters. The multiple batch tests to estimate the V and n
flux constants may be abandoned (except for research purposes) because
these constants can be estimated with reasonable accuracy from the
SSVI3 5. Although still of some practical value, the SVI is an
inferior settleability test and its replacement by the DSVI or SSVI3 5
should be strongly promoted.

46
3. With the aid of the relationships between the flux constants V and a,
DSVI and SSVIo =, the different settling tank design procedures and
theories were verified against full scale settling tank operational
data. The modified WRG and flux procedures overpredict the
permissible solids loading by about 20%. For average to poor settling
sludges (the usual design situation) the ATV guideline gives a good
estimate of the permissible overflow rate for a maximum effluent
solidB concentration of 30 mg/£, but tends to be conservative for
estimating the overflow rates for the onset of solids overload. The
STORA guideline is a minor relocation of the ATV guideline so that it
yields overflow rates for the onset of solids overload rather than a
specific effluent TSS concentration.
4. It is recommended that the Flux or modified WRC and ATV or STORA
procedures are adopted for a more rational approach to design that
include sludge settleabillty. For average to poor sludge
settleability all these procedures yield approximately similar
permissible overflow rates.
5. Both the SSVI3 5 based flux and modified WRG procedures and the DSVI
based ATV and STORA procedures have deficiencies. The former two
include the effects of the underflow recycle, but exclude a means for
estimating depth whereas the latter two exclude the effects of the
underflow reycle but include a means for estimating depth. However,
knowing the relationship between SSVI3 ^ and DSVI the positive aspects
of the different approaches can be used In design.
6. Design criteria based on hydraulic overflow rates do not overtly
recognize sludge settleability although in them a settleability is
implicitly included; if in practice, a sludge has a settleability
worse than that implied, the settling tank has a reduced maximum
permissible overflow rate. At a biological reactor concentration of
3,5 g/A, the IWPC 1 m/h overflow rate at PWWF will yield safe designs
for sludges of settleability lower than a DSVI of 150 mA/g. A DSVI of
150 raJl/g also is the upper limit for non-bulking sludges (see
Blackbeard et al., 1985). Consequently, the 1 m/h IWPC hydraulic
criterion appears adequate for non-bulking sludges provided the

reactor MLSS < 3,5 g/A; the higher the reactor concentration above 3,5
g/JL, the lower the permissible overflow rate below 1 m/h and vice
versa. For bulking sludges (DSVI > 150 mX/g) the 1 m/h IWPC criterion
is no longer adequate and the design should be based on an expected
DSVI (or SSVI3 5) using the procedures discussed in the paper.
From a design point of view, sufficient understanding of secondary
settling tank behaviour has been developed to produce reliable
designs. The emphasis should be focusaed on practical application of
the design procedures discussed in this review. The problems still to
be resolved lie in determining the causes of bulking and developing
methods for ameliorating this; however, bulking Is a problem of the
activated sludge process itself, not the settling tank.
In South Africa, it is recommended that design of settling tanks
always should provide for bulking sludges until the causes for bulking
and remedies to control these on a permanent basis have been
established. In the Interim, attention should be given to the current
methods for controlling bulking by appropriate process configuration
design and where a bulking problem needs to be overcome in the short
terra, this can be done by appropriate dosing of chlorine (see Jenkins
et al., 1985).
Hydraulic considerations were not discussed in detail in this review
but a consistent pattern emerges from the literature viz (a) with
double sided overflow launders, solids loss always occurs sooner than
with single sided launders; with the former, sludge Is scoured by a
horizontal flow between the bottom of the launder and the sludge
blanket whereas with the latter, the blanket must rise to within 0,2m
of the weir level before solids loss occurs; with the former the tank
depth, and hence sludge storage volume, is effectively reduced by 0,6
to 0,8m. In consequence, It Is recommended that the IWPC 8,3 m/h/m
weir discharge flow should fall away and to provide always a single
peripheral effluent weir on which there is not flow rate per unit
length limitation (Stofkoper and Trentelraan, 1982; Stukenberg et al.,
1983), (b) although there were good resons for hydraulic suction
sludge collection systems (fast sludge return, elimination of sludge

48
movement to the central collection hopper), research indicates that
these systems are no more effective than the conventional scraper
collection systems. Furthermore the suction collection system has a
number of disadvantages: It tends to collect preferentially the more
dilute concentrations and causes hydraulic disturhance of the symmetry
of flow due to the rotating suction arm; this effect is particularly
adverse under high recycle rates (1:1 on ADWF) common to nutrient
removal plants in South Africa where deliberate denitrification Is
Included In the plant. It Is recommended to design deep settling
tanks (3,5-5,0m) (Parker, 1983; Pitman, 1984) with scraper collection
(Stukenberg et al., 1983; Pitman, 1984) instead of shallow tanks (2-
3m) with hydraulic suction collection systems.
5.9 Recowendatione for research
The literature review above indicates that a large body of
research information is available on the behaviour of secondary settling
tanks. A significant proportion of this research was undertaken on full
scale tanks and was directed specifically at developing design procedures
that recognize sludge settleability. These procedures were shown to give a
good correlation with observed behaviour of full scale settling tanks. The
procedures have not been adopted for design In South Africa. Consequently,
it is more appropriate at present to upgrade the currently used hydraulic
design criteria which disregard sludge settleability, by making available
the design procedures and full scale experience (appropriately modified
where necessary) developed in Europe and England, rather than conduct
further full scale research. In other words, a lot of research has been
done; it is time it is put into practise In South Africa. This need will
be filled by three approaches:
(I) writing an information document for distribution to municipal and
consulting engineers and plant operators giving guidance for the design
and operation of secondary settling tanks, based on the above review,
(II) writing a series of technology transfer papers for publication in
IMIESA or "Water, Sewage and Effluent" highlighting important aspects for
design and operation, and
49
(ill) writing a series of scientific papers for Water SA detailing
original contributions by the writers of this review.
6. REFERENCES
6.1 Survey and filamentous organlaa identification
1. Blackbeard J R and G A Ekama (1984) A survey of activated sludgebulking and foaming in Southern Africa, IMIESA, _9_, 3, 20-25.
2. Blackbeard J R, G A Ekama and G v R Marais (1985) An investigationinto filamentous bulking and foaming in activated sludge plantsin South Africa, Research Report No W 53, Dept. of Civil Eng.,Univ. of Cape Town.
3. Eikelboom D H (1977) Identification of filamentous organisms inbulking activated sludge, Prog.Wat.Tech., _8_, 153-161.
4. Eikelboom D H and H J J van Bui j sen (1981) Microscopic sludgeinvestigation manual, TNO Research Institue for EnvironmentalHygiene, Report A 94a, Delft, Netherlands.
5. Jenkins D, M Richard and G T Daigger (1985) Manual on the causes andcontrol of activated sludge bulking and foaming. Published by theWater Research Commission of South Africa, P 0 Box 824, Pretoria,0001.
6. Richard M, D Jenkins, 0 Hao and Shimuzu G (1981) The isolation andcharacterization of filamentous microorganisms from activatedsludge bulking, Progress Report #2, San.Eng.Res.Lab., Univ. ofCalifornia, Berkeley.
7. Wagner F (1982) Study of the causes and prevention of sludge bulkingin Germany; in Bulking of Activated Sludge Eds. B Chambers and EJ Tomlinson, Ellis Hopwood Publishers, Chicheater, England.
6.2 Sludge settleabillty and secondary settling tank behaviour
1. Alkema K L (1971) The effect of settler dynamics on the activatedsludge process, MSc Thesis, Dept. of Chem. Eng., Univ ofColorado.
2. ATV (Abwasser Technik Verband)a) Arbeitsbericht des ATV-Fachausschusaes 2.5 Absetzrerfarhren.Die bemessung, Korrespondenz Abwasser, 8/1973, ̂20_, 193-198.b) Erlauterungen zum Arbeitsbericht des ATV-Fachausschusses 2.5Absetzverfarhren, Die Bemessung der Nachklarbecken vonBelebungsanlangen. Korreapondenz Abwasser, 8/1976, _23_, 231-235.
it
3. Billraeier, uE (1976) Moglichkeiten der mischwasserbehandlund in derNachklarbecken von Belebungsanlagen, Research Report H 12,Wassergutewirtschaft und Gesundheitsingenieurwesen, Tech. Univ.Munich.

50
4. Coe H S and G H Clevenger (1916) Methods for determining thecapacities of Blime settling tanks, Trans. Am. Inst. of MiningEngrs., 55, 356-384.
5. Dick R I and B B Ewing (1967) Evaluation of Activated SludgeThickening Theories, J.San.Eng.Div., ASCE, 93_ SA, 4, 9-29.
6. Dick R I (1970) Role of Activated Sludge Final Settling Tanks.J.San.Eng.Div., ASCE, 96, 423-436.
7. Dick R I and K W Young (1972) Analysis of thickening performance offinal settling tanks. Procs. 27th Purdue Industrial Waste Conf.,Lafayette, Indiana.
8. Ekaraa G A and G v R Marais (1984) Two improved sludge settleabilityparameters, IMIESA, _9_, 6, 20-27.
9. Ekama G A, A R Pitman, M Smollen and G v R Marais (1984) secondarysettling tanks, Chapter 8 in Theory Design and Operation ofNutrient Removal Processes. Published by Water ResearchCommission of South Africa.
10. Ekama G A and G v R Marais (1985) A review of sludge settleabilityparameters and secondary settling tank design theories andprocedures. In preparation.
11. Great Lakes - Upper Mississippi River Board of State SanitaryEngineers (1978) Recommended standards for sewage works.
12. Institute of Water Pollution Control (IWPC) (1973) A guide to thedesign of sewage purification works, IWPC, P 0 Box 81249,Parkhurst 2120.
13. Keinath T M, M D Ryckman, C H Dana and D A Hofer (1977). ActivatedSludge - Unified System design and operation, J. Envlro. Eng.Div., ASCE, 103, EE5, 829-849.
14. Koopraan B and K Cadee (1983) Prediction of thickening capacity usingdiluted sludge volume index, Water Research, _17_, 10, 1427-1431.
15. Kynch J J (1952) A theory for sedimentation, Trans. Faraday Society,148, 166-176.
16. Laquidara V D and T M Keinath (1983) Mechanism of c la r i f i ca t ionfa i lu re , JWPCF, 55, 1, 54-57.
17. Lee S E, B Koopman, H Bode, H and D Jenkins (1983) Evaluation ofa l t e rna t ive sludge s e t t l e a b i l i t y indices, Water Research, 17,1421.
it
18. Merkel W (1971a) Untersuchungen uber das Verhalten des ,,belebtenSchjammes im System Belebungsbecken - Nachklarbecken,Gewasserschutz, Wasser-Abwasser, Aachen.
51
19. Merkel W (1971) Die Bemessung horizontal durchstromter Nachklarbeckenvon Belebungsanlagen, gwf^Waeser/Abwasser, 112, H 12, 596-600.
M It
20. Merkel H (1974) Die Bemessung vertlkal durchatromter Nachklarbeckenvon Belebungsanlagen, gwf-Wasser/Abwasaer, 115t H 6, 272-282.
21. Parker D S (1983) Assessment of secondary clarlfler design concepts,JWPCF, 55, 4, 349-359.
22. Pflantz P (1969) Performance of (activated sludge) secondarysedimentation basins, Procs., 4th IAWPR, Prague, Ed. S H Jenkins,Pergamon press, Oxford, 569-593.
23. Pipes W 0 (1979) Bulking, deflocculation and pinpoint floe, JWPCF, 51,1, 62-70.
24. Pitman A R (1980) Settling properties of extended aeration sludge,JWPCF, 52, 3, 524-536.
25. Pitman A R (1984) Settling of nutrient removal activated sludges,Procs of 12th IAWPRC Conference, Amsterdam, Wat.Sci.Tech., 17,493-504.
26. Rachwal A J, D W M Johnstone, M J Hanbury and D J Critchard (1982).The application of settleabillty tests for control of activatedsludge plants. Chapter 13 in Bulking of Activated Sludge -preventative and remedial methods, Eds Chambers B and Tomllnson EJ., Ellis-Hopwood Publishers, Chichester.
27. Sezgin M, D Jenkins and D S Parker (1978) A unified theory offilamentous activated sludge bulking, JWPCF, 50, 2, 352-381.
28. Smollen M and G A Ekama (1984) Comparison of empirical settlingvelocity equations In flux theory for secondary settling tanks,Water SA, 10, 4, 175-184.
29. Stobbe C T (1964) Ueber das Verhalten von belebten Schlamraes inAufsteigender Wasserbewegung, Verffentlichungen des Institutesfur Siedlungswasserwlrtschaft der Technischen HochschuleHannover, _18_, Hannover.
30. Stofkoper J A and C C H Trentelman (1982). Rlchtlljnen voor hetdimensioneren van ronde nabezinktanks vooractiefsllbinstallaties, ll^, 15j !4, 344-354.
31. STORA (1981) (Stichting Toegepast Onderzoek Reiniging Afvalwater)Hyudraulische en technologische aspecten van het nabezink-process: Rapport 1-Literatuur; Rapport 2-Ronde nabezinktanks(Praktijkonderzoek); Rapport 3-Ronde nabezinktanks(Ontwerpgegevens en bedrijfservaring).
32. Stukenberg J R, L C Rodman and J E Touslee (1983) Activated sludgeclarifier design Improvements, JWPCF, 55, 4, 341-348.

52
33. Tracy K D and T M Ketnath (1973) Dynamic model for thickening ofactivated sludge. Water 1973, AIChE Symposium Seriea, No. 136,Vol 70, 291-308.
34. United States Environmental Protection Agency (1975) Process designmanual for suspended solids removal, EPA 625/l-75-O03a, Office ofTechnology Transfer, USEPA, Washington DC,
35. Vesilind P A (1968) Design of prototype thickeners from batch settlingtests. Water and Sewage Works, 115, 302.
36. White M J D (1975) Settling of Activated Sludge, Technical ReportTRll, Water Research Centre, England.
37. Yoshioka N, Y Hotta, S Naito, S Tanaka and S Tsugami (1957) Continuousthickening of homogenous flocculated suspensions, Chem.Eng.Tokyo,21, 66-74.
7. PAPERS, REPORTS AND OTHER OOHTRIBPTIOHS PUBLISHED PORING COHTRACTPERIOD
A. Sludge bulking and foaming
1. Department of Civil Eng., Univ. of Cape Town, (1983) Questionnaire onactivated sludge bulking and foaming, IMIESA, _8_, 7, 59.
2. Blackboard J R and G A Ekama (1984) Survey of activated sludge bulkingand foaming in Southern Africa, IMIESA, 9_, 3, 20-25.
B. Filamentous micro-organism identification
1. Blackbeard J R and G A Ekama (1984) Preliminary report on filamentousmicro-organisms responsible for bulking and foaming in activatedsludge plants in Southern Africa, Research Report No. W 49, Departmentof Civil Eng., Univ. of Cape Town.
2. Blackbeard J R, G A Ekama and G v R Mara is (1985). An investigationinto filamentous bulking and foaming in activated sludge plants inSouth Africa. Research Report W 53, Dept of Civil Eng., Univ. of CapeTown.
3. Blackbeard J R, G A Ekama and G v R Marais (1985) Investigation intofilamentous bulking and foaming in activated sludge plants. Presentedat biennial IWPC Conference, Durban, May 1985.
C. Sludge settleability and secondary settling tank behaviour
1. Ekama G A, A R Pitman, M Sraollen and G v R Marais (1984) Secondarysettling tanks, Chapter 8 in Theory, design and operation of nutrientremoval activated sludge processes, published by the Water ResearchCommission, P 0 Box 824, Pretoria.
2. Ekama G A and G v R Marais (1984) Two improved sludge settleabilityparameters, IMIESA, 9, 6, 20-27.

53
3. Ekama 6 A and G v R Marals (1985) Sludge s e t t l e a b i l l t y and secondaryse t t l i ng design procedures. Presented a t biennial IWPC Conference,Durban, May 1985.
4. Ekama G A, G v R Marais and J R Blackbeard (1985) Final report to theWater Research Commission on a two year exploratory study on activatedsludge bulking and foaming problems in South Africa (1983-1984),Research Report W 54, Dept. of Civil Eng., Univ. of Cape town.