Embed Size (px)
Citation preview

EXPLOITATION OF SMALL INTERFERING RNA METHODOLOGY TO IDENTIFY
NOVEL ANTICANCER TREATMENTS
by
Carolyn Antonia Kitchens
B.S. in Chemistry, Minor in Biology, Appalachian State University, 2005
Submitted to the Graduate Faculty of
the School of Medicine in partial fulfillment
of the requirements for the degree of
Doctor of Philosophy in Molecular Pharmacology
University of Pittsburgh
2011
ii
UNIVERSITY OF PITTSBURGH
SCHOOL OF MEDICINE
This dissertation was presented
by
Carolyn Antonia Kitchens
It was defended on
December 14, 2010
and approved by
Donald B. DeFranco, PhD, Professor and Vice Chair, Pharmacology and Chemical Biology
Alessandro Bisello, PhD, Associate Professor, Pharmacology and Chemical Biology
Billy W. Day, PhD, Professor, Pharmaceutical Sciences, Chemistry
Jennifer R. Grandis, MD, Professor, Otolaryngology, Pharmacology and Chemical Biology
William Saunders, PhD, Associate Professor, Molecular Genetics and Developmental Biology
Merrill J. Egorin, MD, Professor, Medicine, Pharmacology and Chemical Biology
Dissertation Advisor: John S. Lazo, PhD, Alleghany Foundation Professor, Pharmacology
and Chemical Biology

iii
Copyright © by Carolyn Antonia Kitchens
2011
iv
The majority of current pharmacological treatments for cancer target rapidly dividing cells, a
characteristic of most cancer cells. Unfortunately, these treatments also affect cells that normally
divide at a rapid rate, such as cells of the digestive tract, hair follicles, and bone marrow, which
limits the efficacy of chemotherapy due to toxic side effects. Reducing the drug dose to evade
these side effects, however, often impairs efficacy and encourages drug resistance. Therefore,
new unbiased approaches are required to identify new drug combinations with existing effective
cancer chemotherapeutics. I therefore exploited data from a short interfering RNA (siRNA) high
throughput screen targeting 5,520 unique druggable genes, which comprises gene products that
are theoretically good targets for drug development. I used the siRNA screening methodology to
identify novel combination chemotherapies for the treatment of glioblastoma multiforme (GBM),
the most common and aggressive form of human primary brain tumors. My hypothesis is that
unrecognized chemosensitivity nodes exist for the microtubule destabilizing agent vinblastine.
GBM cells were treated with a sub-lethal concentration of vinblastine and identified gene
products that sensitized cells to vinblastine. Using a series of statistical methods, followed by
target identification assays, I found gene products that sensitized GBM cells to vinblastine,
implicating siRNA screening technology as an efficient, unbiased method for identifying
potentially novel anticancer treatments.
EXPLOITATION OF SMALL INTERFERING RNA METHODOLOGY TO
IDENTIFY NOVEL ANTICANCER TREATMENTS
Carolyn Antonia Kitchens, PhD
University of Pittsburgh, 2011

v
TABLE OF CONTENTS
PREFACE .................................................................................................................................... XI
1.0 INTRODUCTION ........................................................................................................ 1
1.1 CANCER: A GENERAL INTRODUCTION ................................................... 1
1.1.1 Glioblastoma multiforme ................................................................................ 1
1.2 CANCER CHEMOTHERAPY .......................................................................... 4
1.3 MICROTUBULES AS TARGETS FOR ANTICANCER TREATMENT .... 5
1.4 APOPTOSIS: PROGRAMMED CELL DEATH ........................................... 10
1.4.1 Extrinsic cell death pathway ......................................................................... 10
1.4.2 Intrinsic cell death pathway .......................................................................... 11
1.5 MICROTUBULE PERTURBING AGENTS .................................................. 14
1.5.1 Microtubule stabilizing agents ..................................................................... 14
1.5.2 Microtubule destabilizing agents ................................................................. 16
1.6 CANCER CHEMOTHERAPY ........................................................................ 20
1.6.1 Therapeutic index .......................................................................................... 21
1.6.2 Target-driven therapeutics ........................................................................... 21
1.6.3 Combination chemotherapy ......................................................................... 23
1.7 HIGH-THROUGHPUT SCREENING ........................................................... 27
1.7.1 The druggable genome .................................................................................. 29

vi
1.7.2 Small interfering RNA .................................................................................. 30
1.7.3 Small interfering RNA high-throughput assay ........................................... 30
1.8 STATEMENT OF THE PROBLEM AND HYPOTHESIS .......................... 35
2.0 MATERIALS AND METHODS .............................................................................. 37
2.1 REAGENTS ....................................................................................................... 37
2.2 CELL CULTURE .............................................................................................. 38
2.3 COMPOUNDS ................................................................................................... 39
2.4 SMALL INTERFERING RNA HIGH THROUGHPUT SCREEN ............. 39
2.5 DATA ANALYSIS FOR THE SMALL INTERFERING RNA HIGH-
THROUGHPUT SCREEN ................................................................................................ 40
2.6 LYSATE PREPARATION AND WESTERN BLOTS .................................. 42
2.7 CONCENTRATION RESPONSE CURVES .................................................. 43
2.8 MITOCHONDRIAL FRACTIONATION ...................................................... 44
2.9 CASPASE-GLO-3/7 ASSAY ............................................................................ 45
2.10 SMALL INTERFERING RNA SEQUENCES ............................................... 45
3.0 SMALL INTERFERING RNA HIGH-THROUGHPUT SCREEN ..................... 46
3.1 INTRODUCTION ............................................................................................. 46
3.2 STATISTICAL ANALYSIS OF THE SMALL INTERFERING RNA
HIGH-THROUGHPUT SCREEN .................................................................................... 47
3.2.1 Median Absolute Deviations outlier detection method .............................. 51
3.2.2 Viability ratio ................................................................................................. 54
3.2.3 Student’s t-test ............................................................................................... 55
3.2.4 False discovery rate ....................................................................................... 57

vii
3.2.5 Statistical Conclusions ................................................................................... 58
3.3 RESULTS ........................................................................................................... 59
3.3.1 Primary screen ............................................................................................... 59
3.3.2 Secondary assay ............................................................................................. 63
3.4 DISCUSSION ..................................................................................................... 66
4.0 SENSITIZATION OF CANCER CELLS TO VINBLASTINE BY BCL-XL ..... 70
4.1 INTRODUCTION ............................................................................................. 70
4.2 RESULTS ........................................................................................................... 74
4.2.1 BCL-xL siRNA sensitization to vinblastine ................................................ 74
4.2.2 ABT-263 sensitization of T98G and A549 but not HeLa cancer cells to
vinblastine ................................................................................................................... 77
4.2.3 Vinblastine concentration dependency for cytotoxicity ............................. 82
4.2.4 ABT-263 induction of mitochondrial-dependent apoptosis ....................... 84
4.3 DISCUSSION ..................................................................................................... 87
5.0 CONCLUSIONS ........................................................................................................ 93
APPENDIX A .............................................................................................................................. 98
SMALL INTERFERING RNA SEQUENCES FOR BCL-XL IN SECONDARY
ANALYSIS .......................................................................................................................... 98
APPENDIX B .............................................................................................................................. 99
MOLECULAR BIOLOGY OF THE CELL .................................................................... 99
ANNUAL REVIEWS ....................................................................................................... 100
NATURE PUBLISHING GROUP .................................................................................. 101
BIBLIOGRAPHY ..................................................................................................................... 103

viii
LIST OF TABLES
Table 1. Microtubule perturbing agents and their current therapeutic uses. ................................. 19
Table 2. Viability ratios, p-values and FDRs from the 65 high confidence gene products that
sensitized cells to vinblastine as indicated by the primary siRNA screen. ................................... 61
Table 3. Forty of the 65 gene products from the primary screen confirmed as vinblastine
sensitizers with T98G cells, nine of which confirmed with both siRNAs (first column). ............ 64

ix
LIST OF FIGURES
Figure 1. Clinical outcomes of GBM and cell culture responsiveness to anticancer agents. ......... 3
Figure 2. Microtubules actively polymerize and depolymerize in a GTP dependent manner. ....... 6
Figure 3. The phases of the cell cycle. ............................................................................................ 7
Figure 4. Microtubules are essential in cellular division ................................................................ 9
Figure 5. Apoptosis through intrinsic or extrinsic cell death pathways. ....................................... 13
Figure 6. The paclitaxel binding site on tubulin ........................................................................... 15
Figure 7. Microtubule destabilizing agent binding sites on tubulin .............................................. 18
Figure 8. Example of therapeutic indices with respect to concentration of drug. ........................ 26
Figure 9. Chemical structures of ABT-737 and ABT-263. .......................................................... 28
Figure 10. The gene family distribution of the human druggable genome. .................................. 29
Figure 11. Small interfering RNAs transiently knockdown protein expression. .......................... 34
Figure 12. siRNA high-throughput screening protocol. ............................................................... 49
Figure 13. siRNA HTS theory to identify a novel combination chemotherapy. .......................... 50
Figure 14. Example of MAD analysis from the primary screen: AKT3. ..................................... 52
Figure 15. Histogram of standard deviations before and after MAD analysis. ............................ 53
Figure 16. Examples of Student's t-test and viability ratios. ........................................................ 58
Figure 17. Reduction in cell viability with the top 65 gene products from the siRNA screen. .... 60

x
Figure 18. Primary and secondary assay overview. ...................................................................... 69
Figure 19. The intrinsic cell death pathway. ................................................................................. 72
Figure 20. BCL-xL siRNA sensitization of T98G cells to vinblastine. ........................................ 75
Figure 21. Reduction in BCL-xL protein levels in T98G cells after siRNA treatment. ............... 76
Figure 22. Sensitization of T98G cells to vinblastine by ABT-263. ............................................ 77
Figure 23. Overexpression of BCL-xL in human cancer cells. .................................................... 78
Figure 24. Sensitization of A549 cells to vinblastine by ABT-263. ............................................. 79
Figure 25. Failure of ABT-263 to sensitize HeLa cells to vinblastine. ........................................ 81
Figure 26. Concentration dependent cytotoxicty of vinblastine with BCL-xL siRNA or ABT-263.
....................................................................................................................................................... 83
Figure 27. Induction of intrinsic apoptosis induced by vinblastine and ABT-263. ...................... 85
Figure 28. ABT-263 dependent caspase-3/7 induction of intrinsic apoptosis. ............................. 86
Figure 29. Resensitization of cancer cells to vinblastine by BCL-xL siRNA and ABT-263. ...... 92
Figure 30. Primary screen results for BCL-2 prosurvival proteins. .............................................. 96

xi
PREFACE
"The definition of insanity is doing the same thing over again and expecting different results."
– Albert Einstein
“The light at the end of the tunnel has been turned off due to insufficient funds.”
– Unknown
“You miss 100% of the shots you never take.”
– Wayne Gretzky
This thesis is dedicated to all the people that have believed in me throughout my graduate
career. Specifically, to my parents Larry and Anita, who have supported me and loved me
unconditionally my entire life. To my three older brothers Chris, Steve and Joe, who never let
me forget who I am, never let me get away with anything, always served as great role models
and always loved me (even though they probably would never admit it). Finally, to the memory
of Jennifer Finke-Dwyer, a great scientist but more importantly an amazing friend.
xii
ACKNOWLEDGEMENTS
There have been many times during my graduate career I have felt both “insane” and the light at
the end of my tunnel had been turned off, however at this point in time, I realize that I am neither
insane nor was my light ever extinguished. Every scientist is some sort of crazy, but rarely
insane, and some tunnels are just longer than others, making the light difficult to see. So many
people in my life have been watching me, guiding me and supporting me, ensuring my success.
At this time, I would like to acknowledge those people for all their support over the years.
First, I must thank my primary advisor, John S. Lazo, PhD. On the surface, Dr. Lazo has
taught me how to think like a scientist, how to ask scientific questions, design and critique
experiments, and overall molded me into an excellent scientist. At the same time, he has taught
me so much more: perseverance in the face of adversity, mental strength, persistence, and most
importantly, how to put a positive spin on negative data. Dr. Lazo has an amazing ability to find
a ray of sunshine on even the most overcast days when it comes to negative data. Probably what
brought me the most enjoyment was Dr. Lazo’s ability to develop a sports analogy. Whether it be
themed to basketball, volleyball, softball, hockey or even throwing the javelin, Dr. Lazo always
had a way of translating every scientific hurdle (pun intended) into some sports analogy,
constantly feeding on my competitive side to help me conquer my scientific mountains.
To the faculty members of the Lazo laboratory, Andreas Vogt, PhD, Elizabeth Sharlow,
PhD, and Paul Johnson, PhD, who have in some way or another helped guide me through my
dissertation and graduate career. For always having an opinion at lab meeting, constantly
keeping me thinking on my feet, always asking great scientific questions, having great ideas for
experiments and for always having open doors and helping a young scientist in need.
xiii
To all the graduate students in the Lazo laboratory: Mark Zimmerman, Pallavi Bansal,
Pierre Quieroz de Oliveira, Peter McDonald, Robb Tomko and Yan Wang. Thank you for all
your advice on experiments, alternate interpretations of results, constructive criticism, guidance
and support throughout the years. Especially to Pete who provided me with the primary data I
needed for the completion of my thesis project and was always available to teach me various
experiments and run through all the data from the primary screen. To all the other members of
the Lazo laboratory, specifically Brian Taylor, Caleb Foster, Catherine Corey, Celeste Reese,
Crystal Zellefrow, Dave Close, Drew Dudgeon. Fang Zhang, Harold Takyi, Heather Grieser
John Skoko, Laura Pliske, Laura Vollmer, Nikhil Thaker, Renae Brinza, Ronda Toth, Stephanie
Leimgruber, Steve Paterson and Tong Ying Shun, all of which have contributed to my growth as
a scientist and have helped me to succeed after all these years.
To the members of my thesis committee: Donald B. DeFranco, PhD, Alessandro Bisello,
PhD, Billy W. Day, PhD, Jennifer R. Grandis, MD and William Saunders, PhD. Each of these
committee members, in their own way, has been a great contribution to my graduate career and I
am honored to say I have had the opportunity to have each of them as a mentor. I would also
like to pay my respects to the memory of Merrill Egorin, MD, a member of my committee who
was never able to see the completion of my dissertation. Dr. Egorin, who passed away in the
summer of 2010, was an AMAZING scientist and teacher. He had an innate ability to make
science fun. Every class that Dr. Egorin taught was a joy and I am truly honored that I had the
chance to learn from him. The medical field lost a great man, a great mind and a great scientist
the day Dr. Egorin passed away.
To the faculty and staff of the Department of Pharmacology and Chemical Biology.
Without the people within this department I never would have completed my graduate studies.

xiv
To Guillermo Romero and Patrick Pagano, for all your work with the graduate students. I know
that from our experiences together, all the current graduate students are in excellent hands with
you as mentors and supporters of their scientific careers. To Jeanette McDew, Jim Kaczynski,
Rich Smith, Pat Smith and the rest of the administrative staff, for making sure I always had my
posters printed on time for meetings, had a conference room when I needed one, ensured I
always got paid, had health insurance and was always registered for the classes and credits I
needed to graduate. To Bruce Freeman, the head of the Pharmacology and Chemical Biology
department, for all of your hard work in the department and guidance throughout my graduate
career, ensuring that I graduated in a timely manner and always having my best interests in mind.
To all the faculty and staff of the Interdisciplinary of Biomedical Sciences program.
Specifically, to Cindy Duffy, Sandra Honick, Veronica Cardamone, Jennifer Walker, Clare
Gauss, Carol Williams and Susanna Godwin, the staff of the interdisciplinary program, who have
been with me as well as all the graduate students in our program from before we even started the
program. Everything you do is truly underappreciated and it is simply amazing how many great
scientists you help develop. To Stephen Phillips and John Horn for recruiting and accepting me
into the graduate program here at the University of Pittsburgh and for creating an amazing
environment to help mold many great minds into great scientists.
All of these people have had some contribution to help build me as a scientist and have
played an integral role to my career but some of the people I have to thank the most are those
that have come to comprise my Pittsburgh family. First, I have to thank one of the most amazing
scientists and people I know, Lauren Drowley. I will never forget all the bad days, all the
conversations, letting me vent over a frosty and fries at Wendy’s. Without you, I never would
have made it this far. To Christi Kolarcik and her family: Jacquie, Rosemary, Chad, Joe, Reanna

xv
and Jared, for being my Pittsburgh family, always including me and always, no matter the
occasion, always making me feel at home, when home seemed so far away. For always
listening, always comforting, always supporting and always loving me. I know now, I could not
live without my Pittsburgh family. To Miranda Sarachine, for all our late night conversations in
lab, sitting together through all the Pharmacology seminars, always reminding me when there
was a Pharmacology seminar, and always reassuring me that we would get through this together.
To Paulina Liang, Dan Liang, Arlee Fafalios-Dulak, Austin Dulak, Bart Phillips, Vicki Hritz,
Gina Coudriet and Meghan Delmastro for always being supportive and for being great friends.
To my roommate, Marcia, thank you for always being there for me, for making sure I ate and I
slept while working on my dissertation and for making sure I took breaks every once and a while
to maintain my sanity. To Gretchen, Deb, Janice, Anna, Mikki and all the other Pittsburgh
Puffins, thank you for all being so supportive even when three-fourths of the time you had no
clue what I was talking about. Finally, to Jennifer Finke-Dwyer, one of the greatest scientific
minds and one of the best friends a person could ever ask. My life would not be the same
without you. I never would have survived graduate school and I miss you every day. The day
you passed away was truly the saddest day of my life. For me to finally get my PhD, I dedicate
it to you. I feel it is the greatest accomplishment I will ever have and yet it is bitter sweet
because you are not here to celebrate it with me. I know you are looking down, guiding me
along the right path and hopefully putting in some good words with the big man upstairs (I really
hope for both our sakes, He has a sense of humor). I do not have the authority yet to award
honorary degrees, but to me, you will always be Jennifer Finke-Dwyer, PhD.
Most importantly to my family. While my Pittsburgh family has been supporting me for
the past 5 years, my family has been supporting me my whole life. To my brothers, Chris, Steve

xvi
and Joe, thank you for being the three best older brothers a little sister could ask for. While I
may not have known it at the time, you three have helped me become the person I am today. All
of my strength, perseverance, competitiveness and confidence I owe to you. Thank you for
always being there for me. To Ashley and Monica, being the only girl with three older brothers,
it is so nice to have some sisters around. You both are beautiful, amazing women who are a true
blessing in my life, much less my brothers’ lives. I couldn’t wish for two better sister-in-laws.
To my mom and dad, words cannot express my love for you and for the gratitude and
thankfulness I feel every day for having such amazing and supportive parents. I owe all of this
to you. You both are my heroes, my inspiration and my rock. Thank you for giving me the best
genes a biomedical scientist could ask for. I love you. This is for you…

xvii
ABBREVIATIONS
BCL-2 B-cell lymphoma 2 BCL-xL B-cell lymphoma-extra large
BME Basal Media Eagle DMEM Dulbecco's Modified Eagle Media DMSO Dimethyl sulfoxide DNA Deoxyribonucleic acid
EMEM Eagle's Minimum Essential Medium FDR False discovery rate GBM Glioblastoma Multiforme GDP Guanosine diphosphate GTP Guanosine triphosphate HTS High-throughput screening MAD Median Absolute Deviations MPAs Microtubule perturbing agents mRNA messenger RNA MTs Microtubules RISC RNA-induced silencing complex RNA Ribonucleic acid SCR Scrambled siRNA
siRNA small interfering RNA TNF Tumor necrosis factor UV Ultraviolet
VBL Vinblastine

1
1.0 INTRODUCTION
1.1 CANCER: A GENERAL INTRODUCTION
Cancer is the second most common cause of death in the United States, killing 1 in 4 individuals.
In 2010, over 500,000 Americans (more than 1,500 per day) are expected to die of cancer and
over 1.5 million new cancer cases are expected to be diagnosed in 2010 alone (1). Between 1999
and 2005 the five-year relative survival rate for all cancers was 68%, up from the 50% survival
rate in the 1970s (1). This improvement in survival reflects the ability to diagnose certain cancers
at an earlier stage and improvements in the treatment of cancer.
Cancer encompasses a large group of diseases in which cells exhibit uncontrolled
proliferation. These cells, unlike normal cells, contain an innate ability to survive. If an
environment becomes too hostile for these cells, the cells gain the ability to migrate into the
blood stream or lymphatic system and invade neighboring tissues, as well as tissues throughout
the body. Cancer cells have the capacity to invade and disseminate inappropriately, which is
what makes cancer so deadly (2).
1.1.1 Glioblastoma multiforme
Glioblastoma multiforme (GBM) is the most aggressive form of the gliomas, with the majority
of these primary brain tumors arising from normal human astrocytes (3). Gliomas are clinically

2
divided into four grades based on increasing rates of proliferation with grade one being slow
growing and grade four being the most rapidly growing and aggressive. GBM is a stage four
glioma and is the most common add aggressive glioma in humans. The majority of patients with
GBM die within a year (3).
GBM is especially difficult to treat because of the cancer location, aggressive biological
behavior, infiltrating growth and resistance to current anticancer therapies (Figure 1) (4).
Despite all the developments and advancements in new surgical techniques, radiation treatment
and anticancer chemotherapy, a successful treatment, much less a cure, for GBM remains
elusive. Even with surgical removal in conjunction with radiation and chemotherapy treatments,
the tumor reoccurrence is rapid and indicative of a tumorigenic cell population that is resistant to
current therapies (5). The three year survival rate is less than 1% for extensive resection with or
without radiotherapy; the addition of chemotherapy to extensive resection and radiotherapy,
however, has increased the survival rate to 15-20% at four years (Figure 1A).
The “success” of the addition of chemotherapy to resection and radiotherapy has
stimulated interest in identifying new treatment regimens for GBM. Patients receiving
chemotherapeutic agents such as temozolomide, cisplatin or the vinca alkaloids still have high
tumor reoccurrences and poor survival rates at four years (6, 7). Thus, there is a desperate need
for chemotherapy treatments that can specifically target these chemoresistant GBMs and
potentially increase the survival rate of what is currently a devastating disease.

3
Figure 1. Clinical outcomes of GBM and cell culture responsiveness to anticancer agents.
(A) Kaplan-Meier survival plots of patients with GBM. Biopsy only (blue), extensive resection (red) and
extensive resection with radiotherapy (green) have essentially no survivors after three years. Greater than 95%
resection with radio and chemotherapy (black) increases the longevity but still has less than 20% survivors after four
years. (B) Percent cell death of (●) primary human erythroblasts, (■) Jurkat cells, and (▲) GBM stem cells treated
with (i) 10 µM etoposide, (ii) 100 µM camptothecin, (iii) 5 mM cisplatin, (iv) 250 µM temozolomide, (v) 1 µM
daunorubicin, (vi) 1 µM doxorubicin, (vii) 100 nM vincristine, or (viii) 10 µM methotrexate. GBM stem cells are
highly resistant to all anticancer agents at toxic concentrations to erythroblasts and Jurkat cells. Adapted from (3, 4).

4
1.2 CANCER CHEMOTHERAPY
Cancer chemotherapy is defined as the use of chemicals to treat and kill cancer cells (8, 9). The
first documented successful cancer chemotherapeutic clinical trial occurred in the early 1940s
when Louis Goodman and Alfred Gilman used mustine, bis(2-chloroethyl) methylamine, to treat
a patient with non-Hodgkin’s lymphoma (10). Goodman and Gilman observed in autopsy
findings from soldiers in World War I that soldiers exposed to mustard gas had a profound
depletion of both bone marrow and lymph nodes. From this observation, Goodman and Gilman
believed that nitrogen mustard would have a similar effect on lymphatic tumors. They tested
mustine, a nitrogen mustard drug, in mice with a transplanted lymphoid tumor and found the
treatment could cause a regression in the tumor. In collaboration with Gustav Lindskog, a
thoracic surgeon, Goodman and Gilman injected mustine into a patient with advanced non-
Hodgkin’s lymphoma. They found that treatment with the mustine caused a profound regression
in the size of the mediastinal and lymphatic masses. Unfortunately, the remission was short lived
and the disease progressed, but the principle that drugs can be administered systemically to
induce tumor regression and the idea of cancer chemotherapy was born (11).
Upon further investigation of the molecular action of mustine, Goodman and Gilman
found that the nitrogen mustard induces the formation of crosslinks between strands of DNA,
which ultimately leads to what is now termed apoptosis. They also established the principle that
tumors may be more susceptible to these toxins than normal cells, which was later determined to
be due at least in part to the rapid proliferation of cancer cells. This idea of targeting dividing
cells within the body has led to the discovery of some of the most successful anticancer agents to
date (8).
5
1.3 MICROTUBULES AS TARGETS FOR ANTICANCER TREATMENT
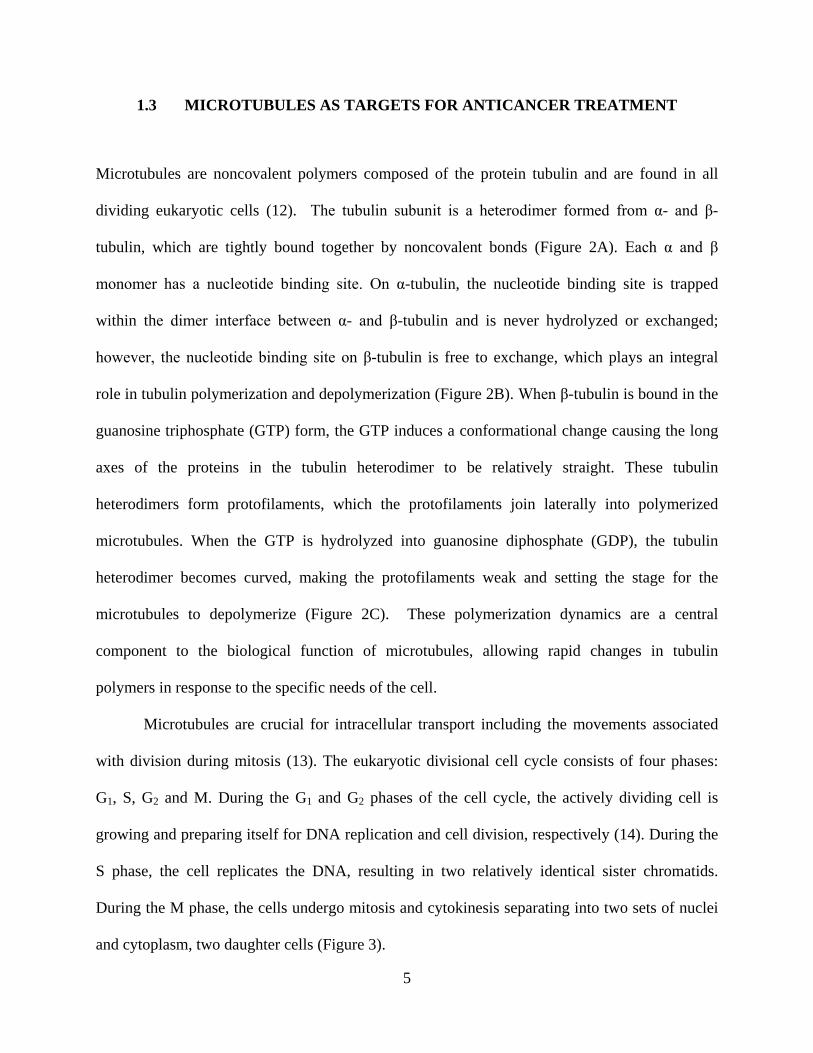
Microtubules are noncovalent polymers composed of the protein tubulin and are found in all
dividing eukaryotic cells (12). The tubulin subunit is a heterodimer formed from α- and β-
tubulin, which are tightly bound together by noncovalent bonds (Figure 2A). Each α and β
monomer has a nucleotide binding site. On α-tubulin, the nucleotide binding site is trapped
within the dimer interface between α- and β-tubulin and is never hydrolyzed or exchanged;
however, the nucleotide binding site on β-tubulin is free to exchange, which plays an integral
role in tubulin polymerization and depolymerization (Figure 2B). When β-tubulin is bound in the
guanosine triphosphate (GTP) form, the GTP induces a conformational change causing the long
axes of the proteins in the tubulin heterodimer to be relatively straight. These tubulin
heterodimers form protofilaments, which the protofilaments join laterally into polymerized
microtubules. When the GTP is hydrolyzed into guanosine diphosphate (GDP), the tubulin
heterodimer becomes curved, making the protofilaments weak and setting the stage for the
microtubules to depolymerize (Figure 2C). These polymerization dynamics are a central
component to the biological function of microtubules, allowing rapid changes in tubulin
polymers in response to the specific needs of the cell.
Microtubules are crucial for intracellular transport including the movements associated
with division during mitosis (13). The eukaryotic divisional cell cycle consists of four phases:
G1, S, G2 and M. During the G1 and G2 phases of the cell cycle, the actively dividing cell is
growing and preparing itself for DNA replication and cell division, respectively (14). During the
S phase, the cell replicates the DNA, resulting in two relatively identical sister chromatids.
During the M phase, the cells undergo mitosis and cytokinesis separating into two sets of nuclei
and cytoplasm, two daughter cells (Figure 3).

6
Figure 2. Microtubules actively polymerize and depolymerize in a GTP dependent manner.
(A) Microtubules are formed from tubulin heterodimers consisting of α- and β-tubulin monomers. The GTP
molecule in α-tubulin is tightly bound between the two monomers preventing nucleotide exchange. The nucleotide
binding site on β-tubulin, however, is free, allowing for active nucleotide exchange. (B) These tubulin heterodimers
polymerize together to form protofilaments in a GTP-dependent manner. When β-tubulin is bound in the GTP form,
the heterodimers form straight protofilaments, which are ideal for polymerization. Upon hydrolyzation of GTP to
GDP, the heterodimer becomes weak, resulting in a curved protofilament, which causes the microtubules to
depolymerize. (C) Microtubules with GTP bound β-tubulin results in the polymerization of microtubules. In the
presence of GDP bound β-tubulin, the protofilaments become curved, resulting in microtubule depolymerization.
Adapted from ©2002 From Molecular Biology of the Cell 4E by Alberts et al. Reproduced by permission of
Garland Science/Taylor and Francis.

7
Figure 3. The phases of the cell cycle.
The eukaryotic cell cycle is composed of four phases: G1, S, G2 and M. In the G1 phase, the cell undergoes
a growth cycle, preparing for DNA replication. Red and grey represent two of the 23 different chromosomes in a
human cell (pink). In the S phase, the DNA unwinds and replicates, forming two sets of relatively identical sister
chromatids. The G2 phase is a second growth phase of the cell cycle where the cell prepares for mitosis and
ultimately cell division. In the M phase, the microtubules align the chromosomes on the metaphase plate and pull the
sister chromatids to opposite sides of the cell. Once the chromosomes divide, the cell undergoes cytokinesis, which
divides the cytoplasm and separates the two cells with the cellular membrane, ultimately resulting in two identical
cells.

8
Microtubules are responsible for physically segregating and aligning the chromosomes on
the metaphase plate during the mitosis phase of the cell cycle (Figure 4) (15). The aligning of
the chromosomes on the metaphase plate is essential for cell division, as it places the
chromosomes in the center of the cell. When the cell divides into two cells, this alignment on the
metaphase plate ensures that each daughter cell will have essentially identical sister chromatids.
If the chromosomes do not align properly and the cell divides, the two daughter cells will have
unequal sets of DNA, which could lead to aneuploidy, genetic mutations and/or death. Cells have
a mitotic spindle checkpoint to prevent these problems from occurring, where the cell pauses in
division to ensure that the chromosomes are aligned on the metaphase plate and, upon division,
each daughter cell has relatively identical DNA (16). Any disruption of these chromosomes will
prevent aligning on the metaphase plate and trigger the spindle checkpoint. Upon cell cycle
arrest at the spindle checkpoint, the cell will attempt to repair itself. If the damage is irreparable,
the cell will induce a type of programmed cell death, typically apoptosis.
Many human tumor cells in culture require an average of 24 hours to complete the cell
cycle. Of these 24 hours, the cells spend approximately 23 hours in interphase (G1, S and G2)
and one hour or less in mitosis, a relatively short period in the life of a cell (17). While in
interphase, microtubules turnover (polymerize and depolymerize) every few hours. In mitosis,
microtubules are over 100 times more dynamic, turning over every 10-30 seconds, making them
more susceptible to microtubule perturbing agents (18). Any disruption of the microtubules in
mitosis by microtubule perturbing agents could lead to cell cycle arrest at the spindle checkpoint
and ultimately the induction of apoptosis.

9
Figure 4. Microtubules are essential in cellular division
(A) During interphase (G1, S and G2) the microtubules (green) maintain the cell shape, transport vesicles
and transport proteins in cellular signaling. (B) In prophase, the chromosomes condense and the mitotic spindle
assembles outside the nucleus. (C) In prometaphase, the nuclear envelope breaks down and the mitotic spindle
attaches to the centriole within the chromosomes. (D) In metaphase, the microtubules align the chromosomes on the
metaphase plate and the cell prepares for division. (E) During anaphase, the microtubules shorten, separating the
daughter chromosomes and localizing relatively identical sets of DNA to opposite sides of the cell. (F) In telophase,
a nuclear envelope reassembles around the separated sets of chromosomes forming identical nuclei. (G) In
cytokinesis, the cytoplasm is divided by the contractile ring, creating two daughter cells. ©2002 From Molecular
Biology of the Cell 4E by Alberts et al. Reproduced by permission of Garland Science/Taylor and Francis.

10
1.4 APOPTOSIS: PROGRAMMED CELL DEATH
Apoptosis is a form of cellular death that consists of programmed cell disintegration into
membrane-enclosed fragments that are taken up by neighboring healthy cells in vivo. Apoptosis
is often beneficial to the organism and plays an essential role in normal human development. For
example, in mammalian embryo development, cells between the fingers and toes undergo a stage
of apoptosis that results in separated digits (14). In adults, cells that have been damaged by
toxins (liver cells) or UV radiation from the sun (skin cells) undergo apoptosis to prevent the
damaged cells from proliferating and allowing for healthy cells to replace the damaged cells.
When normal dividing cells encounter cellular stress, such as DNA damage, oncogene activation
or mitotic catastrophe, the cells can undergo apoptosis through one of two mechanisms: intrinsic
or extrinsic cell death pathways (Figure 5A and B, respectively).
1.4.1 Extrinsic cell death pathway
The extrinsic cell death pathway receives signals through the binding of extracellular protein
ligands to proapoptotic death receptors (19). The extrinsic pathway typically plays a role in the
selection and maintenance of the immune response, removing infected, transformed or damaged
cells (20). TNF (tumor necrosis factor) is a cytokine that is the primary mediator of extrinsic
apoptosis. TNF binds to TNF receptors, which comprise more than 20 proteins, and results in the
assembly of a death-inducing signaling complex (DISC). The DISC complex stimulates caspase-
8, which activates a downstream cascade (caspase-10 and caspase-6), resulting in the activation
of caspase-3 and ultimately apoptosis (Figure 5B).

11
1.4.2 Intrinsic cell death pathway
The intrinsic cell death pathway signals through a mitochondrial-dependent apoptosis signaling
pathway and is typically activated by radiation, cytotoxic drugs, cellular stress, and growth factor
withdrawal (21). Initiation of apoptosis by these external stimuli results in the inactivation of
BCL-2 prosurvival proteins through one of two mechanisms: phosphorylation of BCL-2
prosurvival proteins through protein kinase signaling pathways (Figure 5Ai) or the activation of
BCL-2 homology-3 (BH-3) only proteins (Figure 5Aii) (22).
Upon activation of apoptosis through an external stimuli, such as microtubule perturbing
agents, protein kinases like JNK, Raf-1, PKA, CDC2 induce the phosphorylation of BCL-2 pro-
survival proteins (23-29). The phosphorylation of the BCL-2 prosurvival proteins, which in the
unphosphorylated form are bound to the BAX pro-apoptotic proteins, inactivates BCL-2
proteins, releasing BAX proteins. BAX then oligomerizes and permabilizes the mitochondrial
outer membrane, which releases cytochrome c into the cytoplasm. Once in the cytoplasm,
cytochrome c combines with an adaptor molecule, apoptosis protease-activating factor 1
(APAF1) and procaspase-9. This complex in turn activates procaspase-9 into caspase-9.
Caspase-9 triggers a cascade activating caspase-7 and ultimately caspase-3. Activation of
caspase-3, as in the extrinsic pathway, results in the activation of apoptosis (Figure 5A). These
external stimuli can also activate the BH-3 only proteins, BIM, BID, BAD, NOXA, and PUMA
(30-32). These BH-3 only proteins engage with and thereby inhibit the BCL-2 pro-survival
proteins, allowing the oligomerization of the pro-apoptotic proteins. The pro-apoptotic proteins
oligomerize and permeabilize the mitochondrial outer membrane and release cytochrome c into
the cytoplasm and the ultimate activation of apoptosis.

12
The intrinsic apoptosis pathway is one of the major mechanisms of cell death in cancer
cells, including GBM, in response to chemotherapy (21). Microtubule perturbing agents are
proposed to activate apoptosis through these two different mechanisms in intrinsic apoptosis
signaling. Several studies have demonstrated that the intrinsic cell death pathway, specifically
the inactivation of BCL-2 prosurvival proteins through activation of BH3 only proteins, is
essential for activation of apoptosis by microtubule perturbing agents (22, 30). Alternatively,
these BCL-2 prosurvival proteins can be inactivated by phosphorylation by various protein
kinase signaling pathways through indirect activation by microtubule perturbing agents (22, 28,
33). Activation of the protein kinase signaling pathways can also activate the BH3 only proteins,
which would then bind to the pro-survival proteins and activate apoptosis (22). Alternatively,
more recent literature indicates that the phosphorylation of BCL-2 plays a role in the activation
of Beclin 1, an essential autophagy protein (34, 35).
At this point, the mechanism by which microtubule perturbing agents activate intrinsic
apoptosis through BCL-2 pro-survival proteins is not clear. Activation of intrinsic apoptosis by
these microtubule perturbing agents could occur through the activation of BH3 only proteins or
the phosphorylation of BCL-2 pro-survival proteins, both of which result in the inactivation of
the pro-survival proteins and activation of the pro-apoptotic proteins BAX and BAK. A variety
of factors could be involved in the mechanism by which these microtubule perturbing agents
induce apoptosis: microtubule stabilizing versus destabilizing agents, various protein kinase
signaling pathways, cellular environment or cell type (22). Thus, it is necessary to gain a better
understanding of the role of these microtubule perturbing agents in apoptosis, as well as the
mechanism by which these agents activate the intrinsic signaling pathway.

13
Figure 5. Apoptosis through intrinsic or extrinsic cell death pathways.
(A)The intrinsic or mitochondrial-dependent apoptosis pathway is indirectly activated by chemotherapeutic
agents, including microtubule perturbing agents. Pro-survival proteins (BCL-2) are inactivated by (i)
phosphorylation through various protein kinase signaling cascades (JNK, p21, p53, PKA, CDC2 or Raf-1) or (ii)
binding activated BH3 only proteins to the BH3 domain. Both pathways induce the release of BAX pro-apoptotic
proteins from BCL-2. BAX proteins oligomerize on the mitochondrial surface and release cytochrome c into the
cytoplasm. Cytochrome c activates the complex formation of procaspase-9 and APAF-1, which cleaves procaspase-
9 into caspase-9, ultimately activating caspase-3 and apoptosis. (B) The extrinsic cell death pathway is activated by
the binding of death ligands (TNF) to death receptors (TNFR), which stimulates the activation of caspase-8.
Caspase-8 activates a downstream cascade, which activates caspase-3 and apoptosis.

14
1.5 MICROTUBULE PERTURBING AGENTS
Cancer cells require proliferation and are highly dependent upon microtubule dynamics in
mitosis, which makes microtubules an excellent target for anticancer treatment (36). To date,
microtubule perturbing agents are among the most successful anticancer agents with multiple
agents in clinical use and many others in development and clinical trials (18). These microtubule
perturbing agents can be subdivided into two separate classes: the microtubule stabilizing and
destabilizing agents. Both classes of agents disrupt microtubule dynamics by binding to one of
three sites on tubulin: the taxane site, the vinca domain and the colchicine site.
1.5.1 Microtubule stabilizing agents
The microtubule stabilizing agents are a family of microtubule perturbing agents that bind to and
promote the polymerization of microtubules (37). Paclitaxel was the first compound to be
observed to promote the polymerization of tubulin heterodimers into microtubules and to
stabilize preformed microtubules under depolymerizing conditions (38). Paclitaxel was
discovered in the 1960s and for many years was the only microtubule stabilizing agent.
Docetaxel, a paclitaxel analog, was synthesized and developed in the 1980s and since 1995 many
other microtubule stabilizing agents have been discovered including epothilones A and B,
discodermolide, eleutherobin and sarcodictyins A and B, all of which bind to the paclitaxel site
on tubulin (Figure 6) (39, 40). All of these agents, including paclitaxel, bind in a pocket that is in
contact with the M-loop roughly in the middle of the β monomer, situated at the boundary
between the nucleotide-binding domain and the middle domain (41). These microtubule
stabilizing agents function by constraining microtubule protofilaments in a straight conformation

15
Figure 6. The paclitaxel binding site on tubulin
(A) Crystal structure of α-tubulin (dark grey, left) and β-tubulin (light grey, right). Paclitaxel (TAX) binds
roughly in the middle of the β monomer, situated at the boundary between the nucleotide-binding domain and the
middle domain and in contact with the M-loop. (B) Tubulin heterodimer in the GTP-bound form with α-tubulin on
the left and β-tubulin on the right. (C) Tubulin heterodimer in the GDP-bound form but with bound paclitaxel.
Paclitaxel binds and induces a conformational change that mimics the GTP-bound form of the heterodimer.
Reprinted by permission from Annual Reviews: Annual Reviews of Cell and Developmental Biology, (41).

16
that mimics tubulin bound to GTP (Figure 6B) even in the presence of GDP (Figure 6C). These
microtubule stabilizing agents, including paclitaxel, docetaxel, and the epothilones, are currently
in clinical use or in various phases of clinical trials for the treatment of a variety of cancers as
seen in Table 1 (15, 18).
1.5.2 Microtubule destabilizing agents
The microtubule destabilizing agents are a family of microtubule perturbing agents that bind to
tubulin and promote the depolymerization of microtubules (42). These microtubule destabilizing
agents, for the most part, bind to one of two sites on tubulin: the colchicine site or the vinca
domain (Figure 7).
The colchicine site binding agents include colchicine and its analogues, podophyllotoxin,
combretastatins, CI-980, 2-methoxyestradiol, phenylahistins, steganacins and curacins (18).
These agents bind intra-heterodimer, between the α and β monomers of a tubulin heterodimer.
When compounds bind to the colchicine site, they induce a conformational change in tubulin
heterodimers that prevents the formation of straight protofilaments, thereby blocking
polymerization (Figure 7B). Colchicine, the compound initially found to bind to this site, failed
in clinical trials as an anticancer agent but is used clinically for the treatment of other non-
neoplastic diseases. Other agents, particularly the combretastatins, have had some success in
clinical trials as anticancer agents. The combretastatins are potential vascular-targeting or
vascular-disrupting chemotherapeutic agents. They produce a rapid disruption of tumor blood
flow due to their effects on the microtubule cytoskeleton of endothelial cells (Table 1).
Agents that bind the vinca domain include the vinca alkaloids (vinblastine, vincristine,
and vinorelbine and vinflunine), the cryptophycins and the dolastatins. The vinca binding

17
domain is located inter-heterodimer, between the α and β subunits of two tubulin heterodimers.
These compounds bind closely to the nucleotide exchange site on β-tubulin and prevent GTP
from binding β-tubulin, preventing tubulin polymerization (Figure 7C). The vinca domain
binding agents are composed primarily of the vinca alkaloids, which are the oldest family of
microtubule perturbing agents (43). Compounds that bind the vinca domain are among the most
successful microtubule perturbing agents with four agents currently in clinical use (vinblastine,
vincristine, vinorelbine and eribulin) and others in trials and drug development (Table 1).

18
Figure 7. Microtubule destabilizing agent binding sites on tubulin
(A) The microtubule destabilizing agents interact at to two unique sites on microtubules: the colchicine site
(COL, yellow) and the vinca domain (vinblastine, VBL, blue). (B) The colchicine site is intra-heterodimer, between
the α and β subunits of one tubulin heterodimer, which when bound induces a conformational change that prevents
tubulin from forming straight protofilaments, thereby preventing polymerization. (C) The vinca domain is inter-
heterodimer, between the α and β subunits of two tubulin heterodimers. Compounds that bind to this domain
interfere with the nucleotide exchange site on β-tubulin and inhibit GTP interaction with tubulin, thereby preventing
polymerization. Reprinted by permission from Nature Publishing Group: Nature (44, 45).

19
Table 1. Microtubule perturbing agents and their current therapeutic uses.
Binding
domain
Microtubule
perturbing agent Therapeutic uses Clinical stage
Paclitaxel
(Stabilizer)
Paclitaxel Ovarian, breast and lung tumors,
Kaposi’s sarcoma In clinical use
Docetaxel Prostate, brain and lung tumors Phases I-III
Epothilones Paclitaxel-resistant tumors Phases I-III
Colchicine
(Destabilizer)
Colchicine Non-neoplastic diseases Failed trials
Combretastatins Potential vascular-targeting Phase I, II
2-Methoxyestradiol NA* Phase I
Vinca
(Destabilizer)
Vinblastine Hodgkin’s disease, testicular germ cell
cancer In clinical use
Vincristine Leukemia, lymphomas In clinical use
Vinorelbine Solid tumors, lymphomas, lung cancer In clinical use
Vinflunine Bladder, NSCLC, breast cancer Phase III
Cryptophycin 52 Solid tumors Phase III
Eribulin Breast cancer In clinical use
Hemiasterlins NA* Phase I
* NA signifies no known therapeutic uses to date. Adapted from (18).

20
1.6 CANCER CHEMOTHERAPY
To date, some of the most successful anticancer agents target dividing cells in the body, a
characteristic of most cancer cells. These treatments also affect normal dividing cells, such as
cells of the digestive tract, hair follicles and bone marrow, which limit the efficacy of these
chemotherapeutic agents due to toxic side effects. Hundreds of potential cancer
chemotherapeutics have been developed over the past century, however, the efficacy of these
compounds is limited by low therapeutic indices and inability to specifically target cancer cells
without harming patients (46).
The microtubule perturbing agents are among the most successful anticancer agents
(Table 1) despite their toxic side effects when given at an effective dose (15, 18, 47). The vinca
alkaloids are clinically used for the treatment of a variety of cancers but have severe side effects
including leukopenia, alopecia, nausea and vomiting, which are caused by effects on normal
dividing cell populations in addition to cancer cells (15).
Currently, there is a need for the development of novel chemotherapeutic methods to help
increase the tumor selectivity and decrease the side effects associated with these microtubule
perturbing agents by directly targeting cancer cells while sparing normal cells (18). This can be
accomplished by combining an established chemotherapeutic agent with a novel agent targeted
specifically to cancer cells. By selectively sensitizing the cancer cells with a targeted therapy,
one hopes to increase the therapeutic window, augmenting the efficacy and decreasing the side
effects of each individual drug (48-50). Therefore, novel chemosensitivity nodes are being
investigated as potential methods for combination treatment of molecularly targeted drugs
specific to cancer with already established anticancer agents.

21
1.6.1 Therapeutic index
The therapeutic index is a comparison of the amount of an agent that causes a therapeutic effect
versus the amount that causes drug toxicity (8, 46). The therapeutic index can be calculated by
dividing the drug dose that produces a toxic effect in 50% of the population (TD50) by the
minimum effective dose for 50% of the population (ED50). A drug with a higher therapeutic
index is almost always preferable to a drug with a lower one, which corresponds to a situation
where a patient would have to take a significantly higher dose of a drug to reach the toxic
threshold than the dose necessary to elicit a therapeutic effect (Figure 8). The main factor that
can influence the therapeutic index of a drug is its inability to distinguish between intended and
unintended targets (46). For example, the therapeutic indices of many anticancer agents are
often dismal due to their inability to specifically target cancer cells. These agents primarily
induce toxicity by preventing the division of all replicating cells in the body, thereby killing cells
that normally divide. Currently, there are two methods to help increase the therapeutic indices of
these anticancer agents: the development of target-driven therapeutics and synthetic lethal
combination therapeutics.
1.6.2 Target-driven therapeutics
Target-driven therapeutics are druggable targets that are specific to cancer cells. Presumably
there are proteins that cancer cells completely depend upon for survival that are less-essential for
normal cells (48, 51). Indeed, it has been documented that some cancer cells are addicted to
certain oncogenes, making them valuable candidates for chemotherapy (51). Drug development

22
against these cancer-dependent proteins could provide a way to specifically target cancer cells
while not destroying normal cells, alleviating a major problem with existing cytotoxic agents.
The first successful example of a targeted therapeutic was imatinib, a BCL-ABL tyrosine
kinase inhibitor that is used for the treatment of chronic myeloid leukemia (52). Chronic myeloid
leukemia is caused by a translocation of the Philadelphia chromosome where parts of the 9th and
22nd chromosomes switch places. As a result, part of the breakpoint cluster region (BCR) gene
from chromosome 22 fuses with the V-abl Abelson murine leukemia viral oncogene homolog 1
(ABL) gene on chromosome 9, which forms the BCR-ABL fusion gene. The presence of the
BCR-ABL fusion gene results in the expression of the BCR-ABL fusion protein, a tyrosine
kinase, which is constitutively active and signals a cascade of proteins that stimulate cellular
proliferation. Imatinib, a tyrosine kinase inhibitor, binds to the ABL tyrosine kinase receptor
and prevents activation. Since the BCL-ABL fusion protein is the singular molecular
abnormality in this disease, specifically targeting the BCL-ABL protein is an excellent example
of a situation where targeted therapies are useful. Another example of targeted therapy is the use
of monoclonal antibodies against tumor-specific proteins expressed on the cell surface that, upon
activation, stimulate cellular proliferation. The monoclonal antibodies can specifically target
growth receptors and block ligands from binding and activating these prosurvival and
proliferation pathways, essentially starving the cells of growth factors. Cetuximab is a
monoclonal antibody that functions by specifically targeting epidermal growth factor receptors
(EGFR) in metastatic colorectal and head and neck cancers. Approximately 75% of all metastatic
colorectal cancers have EGFR-expressing tumors, 60% of which are responsive to cetuximab as
a therapeutic treatment (53). Although these monoclonal antibodies serve as an example of a

23
monotherapy that can specifically target cancers, they are actually more effective when used in
combination with other anticancer agents.
1.6.3 Combination chemotherapy
In 1965, James Holland, Emil Freireich and Emil Frei developed the concept of combination
chemotherapy for the treatment of cancer. Following the notion of using multiple antibiotic
treatments, each of which have a different mechanism of action, for tuberculosis therapy,
Holland, Freireich and Frei simultaneously administered methotrexate (an antifolate), vincristine
(a microtubule destabilizing agent), 6-mercaptopurine (6-MP, an immunosuppressor) and
prednisone (a corticosteroid) to patients with childhood acute lymphoblastic leukemia (ALL)
(54).
Prior to this study, children being treated for ALL were typically given 6-MP as a single
agent treatment. While 6-MP had a 60% remission rate, as soon as the treatments were stopped,
relapse occurred in most patients (55). Upon ALL reappearance, patients were typically treated
with the same 6-MP drug regimen, which was frequently not effective due to drug resistance.
Holland, Freireich and Frei believed that the relapse of ALL after the initial treatment was due to
what is now referred to as the “iceberg effect” where, after treatment of a cancer with an
individual treatment, a resistant population remains that can resurface over time and is
subsequently resistant to the initial drug treatment (56). Therefore, Holland, Freirech and Frei
proposed that by using more than one therapy at a time, thought to act through different
mechanisms of action, they could target a majority of the ALL population and cells that were
resistant to one therapy would be sensitive to another, decreasing the possibility of relapse due to
drug resistance (57). This combination treatment, also known as the POMP regimen, increased

24
the complete remission rate of ALL to over 80% and now with the evolution of bone marrow
transplants and combination chemotherapy, ALL in children is essentially a curable disease (58).
In 1974, Lawrence Einhorn and his group began a series of studies working with solid
tumors using the combination chemotherapy of cisplatin, vinblastine and bleomycin, which
increased the cure rate of metastatic testicular cancer from 10% to 60% by 1978. Today, all
stages of testicular cancer are treated with combination chemotherapy and these cancers are
curable in most patients (9).
There are two general methods for combination chemotherapy: 1) the use of two or more
drugs at maximal doses without overlapping toxicities and 2) the use of two drug that
individually are not toxic to the cells but the combination is lethal to cancer cells, thereby
increasing the efficacy and decreasing the side effects of each individual drug (46, 56).
Classic chemotherapies provide maximum toxicity to the cancer cells while maintaining a
tolerated toxicity to the patient, which is determined by the therapeutic window of the drug
(Figure 8A versus B). In Figure 8A, the effective concentration of the anticancer agent is highly
toxic and affects the normal cells at essentially the same concentration as the cancer cells;
however, in Figure 8B, the therapeutic window is larger and the anticancer agent is effective
against the majority of the cancer cells while not affecting the normal cells. Combination
chemotherapies typically consist of two or more drugs that work through separate mechanisms,
do not have overlapping side effects and are not subject to the same mechanisms of resistance.
Using a combination of this manner, the patient can be treated with a therapeutic dose of each
individual drug while having an additive or synergistic effect of the cancer cells and essentially
no increase in side effects relative to each drug as an individual therapy (8). The use of drugs
that function through separate mechanisms of resistance decreases the possibility of an “iceberg

25
effect.” In using two or more drugs with varying mechanisms of resistance, even if a population
of cells is resistant to one drug, the second drug can kill those resistant cells, thereby decreasing
the potential for a relapse of the cancer (59).
A more recent method to identify agents for combination chemotherapy is the synthetic-
lethal approach where individually two anticancer agents are not particularly toxic to the cells,
but the combination of the two results in a synergistic lethality (46, 60, 61). Using this approach,
each individual agent is exceedingly more effective when used in combination versus alone. By
maintaining the concept that each drug works through separate mechanisms without overlapping
side effects, it is hypothesized that these combinations can increase the efficacy while decreasing
the side effects of each individual drug. This approach can be expanded to the use of siRNA to
identify critical survival networks and drugs. Theoretically, if one or more of these gene
products could be directly targeted, they might sensitize cancer cells to established or novel
cancer therapeutics, leading to an effective treatment combination (46, 62). Therefore, by
combining this synthetic lethal approach with historically successful anticancer agents, we hope
to discover non-lethal concentrations of a cytotoxic agent, such as a microtubule perturbing
agent, in combination with an inhibitor targeting cancer specific genes and develop a cancer-
specific cytotoxic therapy without affecting normal cells (61).

26
Figure 8. Example of therapeutic indices with respect to concentration of drug.
(A) An unfavorable therapeutic index where the effective dose (blue) is overlayed with the toxic dose (11).
Essentially every dose of the compound is toxic to all patients and therefore the therapeutic index is small. (B) A
favorable therapeutic index where at the lowest toxic dose, over 50% of patients can receive a therapeutic dose,
indicative of a large therapeutic index. (% Response signifies the percentage of the population receiving an effective
dose). Adapted from (63).

27
1.7 HIGH-THROUGHPUT SCREENING
Within the last few years, the use of high-throughput screening (HTS) technology has
substantially accelerated the evaluation of molecularly targeted drugs (64). HTS provides the
opportunity to identify biologically active small molecules as candidates for further biological or
pharmacological experiments by rapidly testing hundreds of thousands to millions of small
molecules. HTS utilizes the discovery and design of large compound libraries, sophisticated
automated liquid handling platforms and innovated detection to expose potential lead
compounds.
Significant advances in combinatorial chemistry and genomics have helped drive the
rapid growth in HTS. Combinatorial chemistry and structural biology provide the technology to
target a specific protein of interest and design structurally related molecules in silico.
Combinatorial chemists have helped generate large libraries of molecules that can be exploited
with HTS to identify inhibitors or mimetics of a specific protein.
The BCL-2 prosurvival protein inhibitors ABT-737 and ABT-263 (Figure 9 A and B,
respectively) are examples of small molecule inhibitors identified by combinatorial chemistry
and HTS (65). In 2005, Oltersdorf et al. used a structure-activity relationship by NMR screen to
identify compounds that bind to the BH3 domain of BCL-2 prosurvival proteins (66). These
small molecule inhibitors serve as BH3 mimetics by binding to the BH3 domain on BCL-2,
BCL-xL and BCL-w, thereby competitively inhibiting BAX and BAK, which are then free to
oligomerize and bind to the surface of mitochondria, ultimately inducing apoptosis (67). ABT-
737 was originally identified as a BH3 mimetic that binds with high affinity to BCL-2, BCL-xL
and BCL-w and exhibited single-agent activity against numerous cancers including small-cell
lung cancer and lymphoma malignancies; the prospect of ABT-737 as a therapeutic agent was

28
hampered, however, by its poor physiochemical and pharmaceutical properties (68). Due to the
low aqueous solubility and poor bioavailability of ABT-737, Abbott Laboratories performed a
secondary BCL-2 specific inhibitor screen using the structure of ABT-737 to design compound
analogs that would be more attractive as therapeutic agents. Using a structure-activity
relationship by NMR screen, they identified ABT-263, an orally bioavailable BH3 mimetic that
maintains the high affinity for BCL-2, BCL-xL and BCL-w observed with ABT-737 (68, 69).
Figure 9. Chemical structures of ABT-737 and ABT-263.
(A) ABT-737 is a BH3 mimetic that binds in the BH3 domain of BCL-2 pro-survival proteins BCL-2,
BCL-xL and BCL-w. ABT-737 is not ideal as a therapeutic agent due to its poor physiochemical and pharmaceutical
properties. (B) ABT-263 is an analog of ABT-737 with three major chemical alterations (blue boxes). These
modifications increase the oral bioavailability and affinity of ABT-263 to the BH3 domain of BCL-2, BCL-xL and
BCL-w, relative to ABT-737. Adapted from (68).
Advances in genomics have substantially expanded our knowledge of human
development, physiology, evolution and medicine with the sequencing of the human genome
(70). Using HTS, protein sequencing technology, X-ray crystallography and combinatorial
chemistry, we can develop novel small molecule inhibitors that inhibit proteins from the human
genome project that specifically affect cancer cells and not normal cells. There are over 30,000
genes encoding proteins of the human proteome, a specific subset of which yield gene products
that are good druggable targets: the druggable genome (71).

29
1.7.1 The druggable genome
Biological systems have only four types of macromolecules that can be targeted by therapeutic
agents: proteins, polysaccharides, lipids and nucleic acids (71). Due to toxicity, lack of
specificity and the inability to obtain potent compounds against polysacchardies, lipids and
nucleic acids, proteins are clearly the most popular target for drug discovery. A subset of the
greater than 30,000 genes in the human genome encode proteins that are known to or are
theorized to bind small molecules with appropriate affinity and specificity; these genes comprise
what has been termed the druggable genome (72). Using a combination of genomics, proteomics
and combinatorial chemistry, approximately 5,000 proteins have been classified as druggable
(Figure 10).
Figure 10. The gene family distribution of the human druggable genome.
The human druggable genome consists of 5,520 different genes distributed through various gene families
including serine/threonine and tyrosine kinases (22%), G-protein-coupled receptors (15%), cation channels (5%)
serine proteinases (4%), protein phosphatases (4%) and other (50%). Other includes, but is not limited to, zinc
peptidases, cytochrome P450s, and nuclear hormone receptors. Adapted from (71).

30
1.7.2 Small interfering RNA
Small interfering RNAs (siRNAs) are non-coding RNA molecules, approximately 22 nucleotides
in length, that silence target RNAs in a sequence-specific manner (73). siRNAs facilitate the
degradation of mRNA sequences through the mechanism of RNA interference. Initially, long
double-stranded siRNAs are transfected into the cells using a liposome transfection reagent
(Figure 11A). Upon entering the cell, the siRNAs are recognized by the ribonuclease-III, Dicer,
and in an ATP-dependent manner Dicer cleaves the double-stranded siRNAs into two siRNAs
(Figure 11B). Dicer delivers the siRNAs to the RNA-Inducing Silencing Complex (RISC), which
recognizes the antisense strand of the siRNAs by the 5’ phosphorylation site (Figure 11C). The
antisense siRNA then guides the RISC complex to mRNA with a complementary sequence,
resulting in the endonucleolytic cleavage of the target mRNA (Figure 11D). Cleavage of the
mRNA leads to the specific degradation of the mRNA and prevents the expression of the gene
product at the protein level. This technique is used to transiently knockdown expression of a
protein of interest.
1.7.3 Small interfering RNA high-throughput assay
siRNA technology has recently been utilized as a method to identify genetic alterations in cancer
cells through a loss-of-function phenotype by identifying genes that are essential for cancer cell
survival (46, 74). Within the last decade, these siRNA HTS have enhanced cancer drug
discovery through a variety of screening strategies: 1) the exploitation of oncogene addiction, 2)
reversing the hallmarks of cancer and 3) identification of synthetic lethal drug combinations
strategies (74).

31
The development of cancer is typically a multistage process, requiring multiple mutations
to the cells before expressing a cancerous phenotype (75). Some of these cancers however, have
an “oncogene addiction,” a phenomenon where even though the cell required multiple mutations
to become cancerous, the removal of one of those oncogenes is detrimental to the cell (76), for
example BCL-ABL driven leukemias. In this malignancy the mutation primarily required for cell
survival is the constitutively active ABL tyrosine kinase. Imatinib, a small molecule tyrosine
kinase inhibitor, directly targets the mutated ABL protein and prevents the tyrosine kinase
activity (77). In the case of an oncogenic addiction, one can identify critical oncogenic
mutations by siRNA HTS and develop a targeted therapy that can kill cancer cells while not
harming normal cells, which are not affected by the oncogene.
Tumor cells typically exhibit a series of well-defined phenotypical hallmarks of cancer
that may be of therapeutic benefit (78). These hallmarks include tissue invasion and metastasis,
angiogenesis, apoptosis evasion, insensitivity to anti-growth signals and self-sustaining growth
signals. Combination siRNA screens with specific assay readouts that directly exploit these
hallmarks can be utilized to identify gene products that are essential for specific cancer
phenotypes. For example, in 2006, Collins et al. performed a siRNA screen using wound-
healing as a measurement of cell migration and found that the inhibition of MAP4K4 can prevent
JNK mediated migration of multiple carcinoma cell lines (79). To validate the screen, they
suppressed cell migration using a JNK small molecule inhibitor suggesting these JNK inhibitors
can be utilized to prevent cancer metastasis.
Synthetic lethality is a concept where individually, the inhibition or mutation of two gene
products is not particularly toxic to the cells, but the combination of the two is detrimental to the
cancer cells (46). Using a siRNA HTS, by individually knocking down the expression of

32
numerous gene products, one can uncover drug combinations where the siRNAs can sensitize the
cells to the sub-lethal dose of an anticancer agent. By treating the cells with a lower
concentration of anticancer agent but maintaining the toxic phenotype, the drug combination can
increase the therapeutic window of an anticancer agent that typically has a suboptimal
therapeutic index.
Whitehurst et al. performed a synthetic lethal siRNA screen with a library of pooled
siRNAs targeting 21,127 genes within the human genome and treated cells with an EC0.1
concentration of the microtubule stabilizing agent, paclitaxel. They compared the cell viability
of NCI-H1155, a human non-small cell lung cancer, when treated with the siRNA alone and the
siRNA in combination with paclitaxel. Using a Student’s t-test followed by viability ratios, they
identified gene products that alone were not essential for cell survival, but upon the addition of a
non-toxic concentration of paclitaxel the cell viability was significantly decreased. In this
screen, they identified 87 gene products that were subdivided into twelve protein subgroups:
proteasome components, microtubule-related, post-translational modification, cell adhesion,
gametogenesis-associated, receptors, RAS family, transcription, translation, ion channel,
membrane proteins, and others (61). In an attempt to identify a synthetic lethal drug-drug
combination, Whitehurst et al. treated non-small cell lung cancers with a sub-lethal concentration
of paclitaxel in combination with the synthetic salicylihalamide derivative, RTA 203, and found
that individually each drug was not toxic to the cells, but the combination had a greater than 50%
decrease in cell viability at multiple concentrations tested. This HTS describes the first genome-
wide chemosensitization siRNA screen with extensive validation and characterization of hits.
While performing a HTS with siRNAs targeting the entire human genome is informative,
the use of a druggable genome siRNA library, a library consisting of siRNAs that only knock
33
down gene products that are theoretically good targets for drug development, has the potential to
quickly advance the process of the initial gene product identification and the development of
small molecule inhibitors. Because a large majority of the human genome is currently deemed
undruggable, specifically targeting the druggable genome can eliminate a significant subset of
nontherapeutic genes (71). A siRNA screen using the druggable genome library can identify
gene products that upon treatment of cells with an anticancer agent can decrease the viability of
the cancer in an additive or synergistic manner. Assuming that the decrease in expression of a
specific protein with a siRNA can be replicated by inhibiting the functionality of said protein
with a small molecule, this siRNA HTS can identify novel drug-drug combinations that can
theoretically specifically target cancer cells.

34
Figure 11. Small interfering RNAs transiently knockdown protein expression.
(A) Long double-stranded siRNAs are transfected into the cells using a liposome transfection reagent. (B)
Upon entering the cell, the siRNA is recognized by the ribonuclease-III, Dicer and, in an ATP-dependent manner,
Dicer cleaves the double-stranded siRNA into two siRNAs. (C) Dicer delivers the siRNAs to the RNA-Inducing
Silencing Complex (RISC), which recognizes the antisense strand of the siRNAs by the 5’ phosphorylation site on
the antisense strand. (D) The antisense siRNA guides the RISC complex to mRNA with a complementary sequence,
resulting in the endonucleolytic cleavage of the target mRNA.

35
1.8 STATEMENT OF THE PROBLEM AND HYPOTHESIS
The microtubule perturbing agents are widely used as anticancer agents. Their success in altering
the dynamics of microtubule assembly and disassembly and treating cancer has stimulated
additional attempts to develop newer and more effective microtubule perturbing agents.
Nonetheless, compounds that alter microtubule dynamics, like the majority of current
pharmacological treatments for cancer, target all rapidly dividing cells. The proliferation rate of
some normal cells in the body equals or exceeds that of the malignant population, which forms
the foundation for untoward drug effects. In addition, normal cells, especially neurons, require
functional microtubules to facilitate macromolecular trafficking. Disruption of microtubule
integrity by these microtubule perturbing agents can result in neurotoxicity.
There continues to be an enormous need for anticancer treatments that increase the tumor
selectivity and decrease the subsequent side effects compared with microtubule perturbing
agents. This can be accomplished a variety of ways including the development of combination
treatments of already available chemotherapeutic agents to increase the therapeutic window,
thereby augmenting the efficacy and decreasing the side effects of each individual drug (48, 49).
There is a growing body of literature indicating the complexity of microtubule assembly
and disassembly. A host of proteins regulate this process and these proteins are
posttranslationally controlled. Moreover, there is an elaborate sensing system that operates to
detect microtubule integrity and cell viability, which can be altered in malignant cells.
Consequently, it seems possible one might be able to identify and ultimately exploit malignant
cell processes that are microtubule-dependent. It is conceivable that biochemical pathways or
nodes exist that could be employed for the design of novel drug combinations.

36
siRNA technology has been utilized as a method to identify genetic alterations in cancer
cells through a loss-of-function phenotype by identifying genes that are essential for cancer cell
survival (46, 74). The use of the druggable genome siRNA library, a library consisting of
siRNAs aimed at gene products that are theoretical good drug targets, has the potential to quickly
advance the process of the initial identification and development of small molecule inhibitors
(71, 72).
I hypothesize that druggable gene products exist that limit tumor cell sensitivity to
the vinca alkaloids and that small molecule inhibitors against such gene products could
yield novel drug-drug combinations for the treatment of cancer. Thus, a pooled short
interfering RNA screen was implemented targeting 5,520 unique genes within the druggable
genome (80). T98G human glioblastoma cells were treated with a sub-lethal concentration of
vinblastine in combination with the siRNA druggable genome library. The specific aims of this
dissertation were to 1) develop a series of statistical methods to identify gene products from the
siRNA druggable genome library that alone were not essential for cell survival but sensitized
cells to vinblastine, 2) validate the identified cellular sensitization gene products with two
individual siRNAs and 3) determine whether small molecule inhibitors targeting the identified
gene products could sensitize cells to vinblastine.

37
2.0 MATERIALS AND METHODS
2.1 REAGENTS
The Silencer Druggable Genome siRNA Library (Version 1.1), Silencer Select secondary library,
Silencer Select Negative Control No. 1, BCL-xL Silencer Select siRNAs (siRNA ID s1920,
s1921, and s1922), CDC42 Silencer Select siRNAs (siRNA ID s2765 and s2766), RHOA
Silencer Select siRNAs (s758 and s759) and AKT3 Silencer Select siRNAs (siRNA ID s19427
and s19428) were purchased from Ambion (Austin, TX). AllStars Hs Cell Death Control siRNA
was purchased from Qiagen (Valencia, CA). DharmaFECT2 transfection reagent, 5x siRNA
resuspension buffers, and the siGENOME Non-Targeting siRNA #1 were purchased from
Dharmacon (Lafayette, CO). Tissue culture-treated 384-well microtiter plates were from Greiner
Bio-One (GMBH, Freckenhausen, Germany). CellTiter Blue Cell Viability Assay and Caspase-
Glo 3/7 Assay were purchased from Promega (Madison, WI). BD BioCoat Collagen I 384-well
microplates and BD Falcon 384-well white/clear bottom plates were purchased from BD
Biosciences (Bedford, MA). Eagle’s Minimum Essential Medium (EMEM), Opti-MEM, Basal
Medium Eagle (BME), phosphate buffered saline (PBS), L-glutamine, penicillin/streptomycin,
Hoechst 33342, and Novex 4-20% Tris-Glycine Gel 1.0 mm, 12 well were purchased from
Invitrogen (Carlsbad, CA). Fetal bovine serum was purchased from Cellgro (Manassas, VA).
ECL Western blotting substrate was from Pierce Biotechnology (Rockford, IL). The T98G and

38
A549 cell lines were purchased from the American Type Culture Collection (ATCC, Manassas,
VA). Vinblastine and 1,1’-sulfinylbismethane (DMSO) were purchased from Sigma-Aldrich (St.
Louis, MO). ABT-263 was obtained from ChemieTek (Indianapolis, IN). GAPDH rabbit
monoclonal (#2118), BCL-xL rabbit polyclonal (#2762) and BAX rabbit monoclonal (#5023)
antibodies were purchased from Cell Signaling (Danvers, MA). BCL-xL rabbit monoclonal
[E18] (ab32370), Cytochrome c mouse monoclonal (ab13575) and ERAB [5F3] - Mitochondrial
Marker mouse monoclonal antibodies were purchased from Abcam (Cambridge, MA). Rabbit
and mouse peroxidase-conjugated secondary antibodies were purchased from Jackson
ImmunoResearch (West Grove, PA). Mini EDTA-free Protease Inhibitor Cocktail Tablets were
purchased from Roche (Nutley, NJ).
2.2 CELL CULTURE
The T98G glioblastoma cell line was maintained in EMEM supplemented with Earle’s basic salt
solution, nonessential amino acids, sodium pyruvate, 1% L-glutamine, 1%
penicillin/streptomycin and 10% fetal bovine serum. The non-small cell lung cancer cell line
A549 was maintained in BME supplemented with 1% L-glutamine, 1% penicillin/streptomycin
and 10% fetal bovine serum. Cells were incubated in a humidified incubator at 37°C with 5%
CO2. T98G and A549 cell lines were validated by RADIL Research Animal Diagnostic
Laboratory (University of Missouri-Columbia).

39
2.3 COMPOUNDS
Vinblastine and ABT-263 were dissolved in 100% DMSO. Compound treatments were added 48
hours after initial cell seeding for both the synthetic lethal screens and drug combination studies.
Compound treatment and DMSO vehicle controls were diluted in media with a final DMSO
concentration of 0.5%. Cells were incubated for an additional 48 hours in the presence of
compounds and controls.
2.4 SMALL INTERFERING RNA HIGH THROUGHPUT SCREEN
T98G cells were wet-reverse transfected with the Ambion Silencer Druggable Genome siRNA
library at a final concentration of 20 nM per target in a one gene per well format.
DharmaFECT2 transfection reagent (0.17 µL) and OptiMEM (33 µL) were mixed and plated
into a 384 well format with a Zoom MV automated microplate dispenser (Titertek, Huntsville,
AL). For each gene target, 4.13 µL of 833.3 nM siRNA were added to the
DharmaFECT2/OptiMEM mixture using the V-Prep high speed automated precision microplate
pipetting station (Velocity 11, Menlo Park, CA). The siRNA/DharmaFECT2/OptiMEM
complexes were split between two 384-well plates (14 µL per well) with the V-Prep and
incubated for 20 minutes. T98G cells (500 cells per well, in antibiotic free EMEM) were added
directly to the siRNA complexes with the Zoom MV automated microplate dispenser. After 5
hours, allowing sufficient time for transfection and cell seeding, medium containing the siRNA
complexes was removed and replaced with fresh EMEM containing antibiotics. Cells were
incubated for 48 hours in a humidified incubator at 37°C with 5% CO2. After 48 hours, the

40
medium was removed and replaced with medium containing either 1.2 nM vinblastine or 0.5%
DMSO vehicle control. Cells were incubated for an additional 48 hours in the presence of
compounds, at which point cell viability was measure with the CellTiter-Blue cell viability assay
(1:5 ratio of CellTiter-Blue to media) for three hours, according to manufacturer’s protocol.
Plates were read on the Spectramax M5 (Molecular Devices, Sunnyvale, CA).
2.5 DATA ANALYSIS FOR THE SMALL INTERFERING RNA HIGH-
THROUGHPUT SCREEN
The siRNA high throughput screen was performed a total of three times to uncover sensitizers of
T98G cells to vinblastine. Relative fluorescence units from each targeted siRNA well were
normalized to in-plate scrambled negative controls treated with DMSO, which allowed for plate
to plate comparisons.
Due to significant inherent variability in the cell-based assay seen from day-to-day, I
employed the Median Absolute Deviations (MAD) analysis, an outlier detection method, which
unlike other methods, is resistant to the presence of outliers within the samples. The MAD-score
of each gene is determined by initially determining the MAD value for each data point across the
three screens. The MAD value can be determined by:
{ }iiji XXMedianMAD ~−=
where ijX is the viability of the ith gene in the jth screen and iX~ is the median of the three
viability replicates of the ith gene from the synthetic lethal screens. Once the MAD value is

41
determined, the MAD-score can be calculated. The MAD-score (M) for each replicate within the
screens is determined using the following equation:
( )i
iijij MAD
xxM
~6745.0 −=
Samples with an M greater than 3.5 were defined as outliers with 95% confidence within that
sample set and were discarded. Cell viability of that sample was calculated by averaging the
remaining values from the screen.
To determine which siRNAs were sensitizers of T98G cells to vinblastine, I developed a
novel statistical analysis method using two orthogonal statistical methods. First, the samples
were ranked according to their viability ratio (VR) which accounts for the magnitude of the
difference between compound and vehicle treatments among samples. Briefly:
i
i
yxVR =
where ix is the average cell viability of the siRNA plus compound treatment and iy is the average
cell viability of the siRNA plus vehicle control. The genes were ranked from lowest to highest
according to their VR and the top 2.5% of genes (138 genes) were selected. A Student’s t-test
was performed on these 138 genes to determine the significant difference between cells treated
with siRNA plus vehicle control (µx) and siRNA plus vinblastine (µy) where:
yxOH µµ ≥: yxaH µµ <:
The t value for each sample was determined using this following equation:
( ) ( )
y
y
x
x
yxii
ns
ns
yxt
22
+
−−−=
µµ

42
where t is the t value, nx and ny are the sample sizes, ix and iy are the sample means, µx and µy
are the population means, and sx and sy are the standard deviations of the samples. I used
Microsoft Excel to determine the p-values associated with the t values for each sample. Genes
with a p-value ≤0.01 (65 genes) were selected, giving 99% confidence that there is a significant
difference between siRNA plus vehicle control and siRNA plus vinblastine, resulting in 65 genes
that sensitize T98G cells to vinblastine.
The Benjamini-Hochberg false discovery rate (FDR) was used to control for type 1 errors
due to multiple comparisons during hypothesis testing. To calculate the FDR, the samples are
ranked from smallest to largest, according to their p-values. Based off these rankings, the FDR
is determined by:
mkFDRkα
=
where k is the sample rank, α is the confidence interval and m is the total number of t-tests
performed. Each ordered p-value (pk) is compared to the corresponding FDRk where any test
with a pk less than the FDRk is declared significant.
2.6 LYSATE PREPARATION AND WESTERN BLOTS
Six-well plates containing T98G cells were placed on ice to suspend all cellular activity, washed
with ice-cold PBS, and collected by scraping into lysis buffer containing a mini EDTA-free
Protease Inhibitor Cocktail Tablet, Triton X-100, SDS, sodium chloride (NaCl), EDTA, sodium
fluoride (NaF), sodium β-glycerol phosphate and sodium orthovanadate (Na3VO4). The protein
concentration for each sample was determined using the Bio-Rad protein assay kit (BioRad).

43
Thirty micrograms of protein from cell lysates were resolved on Novex 4-20% Tris-Glycine gels
and transferred to nitrocellulose membranes using the iBlot Dry Blotting System (Invitrogen).
Membranes were probed with antibodies at various dilutions targeting: BCL-xL (1:500), β
tubulin (1:10,000), GAPDH (1:1000), BAX (1:200), Cytochrome c (1:200) and ERAB (1:200).
Positive antibody reactions were visualized using either rabbit or mouse peroxidase-conjugated
secondary antibodies (1:1000) and chemiluminescence by ECL Western Blotting Substrate
according to manufacturer’s protocol. Membranes were imaged using the FujiFILM LAS-3000
imager (R&D Systems, Minneapolis, MN).
2.7 CONCENTRATION RESPONSE CURVES
For the vinblastine sensitization assays using BCL-xL siRNAs, cells were transfected in
collagen-coated 384-well plates with increasing concentrations of BCL-xL siRNA (0.63 to 10
nM) as described in the siRNA screen. Forty-eight hours post-transfection, the cells were treated
with vinblastine (25 pM to 50 nM) with a final DMSO concentration of 0.5%. Percent cell
viability of each sample was determined by CellTiter Blue as described above. All samples were
normalized to the DMSO/scrambled (SCR) negative control, which was termed 100% cell
viability. Toxicity of siRNA alone was determined by comparing the siRNA/DMSO percent cell
viability to the SCR/DMSO negative control. The “Cell Death” siRNA (AllStars Hs Cell Death
Control siRNA) was used as a positive control for transfection efficiency. Only experiments with
>90% cell death with the “Cell Death” positive control were considered for analysis.
For the drug combination studies with both T98G and A549 cells, I first determine their
sensitivity to vinblastine (25 pM to 50 nM) and ABT-263 exposure (0.8 to 50 µM). Based on

44
these data, the two drugs were titrated in a “checkerboard” format on a 384-well plate where the
concentration range of vinblastine was arranged in the columns and the concentration range of
ABT-263 was arranged in the rows in the plate with DMSO in the last rows and columns,
providing a standard concentration response curve for each drug. Cells were plated at a density
of 500 cells per well. Plates were treated after 48 hours with vinblastine and ABT-263 and, after
an additional 48 hours cell viability was determined using the CellTiter-Blue assay. All wells
were normalized to the DMSO control and the percent cell viability of each sample was
determined as described above.
2.8 MITOCHONDRIAL FRACTIONATION
Mitochondria samples were isolated by differential centrifugation (81). T98G cells were plated
and treated in 100-mm dishes. Samples were placed on ice and washed with ice-cold PBS to
suspend cellular activity. Samples were scrapped on ice with 500 µL of ice-cold PBS into 1.5
mL Eppendorf tubes. The samples were centrifuged at 1,500 x g for 5 minutes at 4°C to generate
a cellular pellet. The supernatant was discarded and the pellet was homogenized in 500 µL of
STE (10 mM Tris, pH 7.4 at 4°C, containing 250 mM sucrose and 1 mM EGTA) on ice. Samples
were centrifuged at 1,000 x g for 5 minutes to remove cellular debris and collect the supernatant.
To separate the mitochondrial fraction from the cytosolic fraction, samples were centrifuged at
10,000 x g for 10 minutes. The supernatant fraction was collected for the cytosolic fraction and
the pellet was collected for the mitochondrial fraction. The mitochondrial pellet was
homogenized in 100 µL of STE, centrifuged at 10,000 x g for 10 minutes for an additional wash,
the supernatant discarded and the pellet collected for the mitochondrial fraction. The
45
mitochondrial pellet was resuspended in 50 µL of STE and the cytosolic and mitochondrial
fractions were frozen at − 80°C overnight. Samples were prepared for Western Blot analysis as
described above.
2.9 CASPASE-GLO-3/7 ASSAY
The Caspase-Glo-3/7 assay was performed according to the manufacture’s protocol. Briefly,
T98G cells were plated as described previously in the drug combination studies. Cells (500 cells
per well) were plated in BD Falcon 384-well white/clear bottom plates (which was necessary for
chemiluminescence detection). Forty-eight hours after cell seeding, plates were treated with the
vinblastine/ABT-263 combination. After an additional 48 hours, the medium containing drugs
was removed and the Caspase-Glo-3/7 reagent was added to wells in a 1:1 ratio of reagent to
medium (25 µL of reagent and 25 µL of medium per well). Plates were incubated in the dark at
room temperature for one hour. The plates were read using an EnVision Multilabel Plate Reader
(PerkinElmer Waltham, MA). Levels of caspase-3/7 were normalized to DMSO controls.
2.10 SMALL INTERFERING RNA SEQUENCES
The Ambion Druggable Genome consists of 16,560 Silencer siRNA duplexes targeting 5,520
gene products. The sequences for BCL-xL, CDC42, RHOA, and AKT3 siRNAs are listed in
Appendix A.

46
3.0 SMALL INTERFERING RNA HIGH-THROUGHPUT SCREEN
3.1 INTRODUCTION
The advent of HTS technology has drastically improved the number of molecular targets that can
be examined and has stimulated the belief that drug discovery costs will be reduced (64, 74).
siRNA technology has been used to identify genes that are essential for cancer cell survival
through a loss-of-function phenotype (46, 74). By combining HTS methodology with siRNA
technology, the druggable genome siRNA library has the potential to quickly advance the
process of the initial target identification and the development of small molecule inhibitors (71).
To help identify novel combination treatments for cancer, specifically, the vinca alkaloid
vinblastine, Peter R. McDonald, PhD implemented a siRNA high throughput screen targeting the
druggable genome to identify gene products that sensitize T98G glioblastoma cells to vinblastine
(80). In this assay T98G cells were transiently transfected with 16,520 siRNAs targeting 5,520
druggable gene products (three pooled siRNAs per target) with one gene per well basis, as
described in the Methods Section and Figure 12. Using two non-overlapping statistical methods,
I identified siRNAs that individually were not toxic, but in combination with vinblastine, were
synergistically toxic to the cells (Figure 13).
The ultimate goal of this assay was to translate the information uncovered by the siRNA
HTS and develop a novel anticancer combination drug therapy. Assuming the depletion of a

47
protein by siRNA can be replicated by a small molecule protein inhibitor, I can uncover a novel
chemotherapeutic node for vinblastine, thereby developing a drug-drug combination anticancer
treatment. In order to identify gene products that sensitize cells to vinblastine, I developed a
series of statistical methods that rapidly identified candidate “hits” with the highest degree of
confidence. These methods consist of a series analyses to control for common HTS errors while
simultaneously decreasing the possibility of false-positives and false-negatives (82).
3.2 STATISTICAL ANALYSIS OF THE SMALL INTERFERING RNA HIGH-
THROUGHPUT SCREEN
The detection of true biological functionality of siRNAs with high confidence is the ultimate
goal of any primary siRNA screen and yet the statistical analyses behind the identification
remains a point of controversy in the data analysis community (83). Universally, there is no
single correct analysis method for any dataset. The dataset for each siRNA screen is dependent
on the initial plate design, the internal plate controls as well as the specific results that are desired
from the screen (84). For example, a siRNA primary screen attempting to identify novel
monotherapies for the treatment of cancer would have an entirely different data analysis method
from a HTS looking at novel combination chemotherapies, which has an additional variable of
compound within the assay and doubles the number of assay plates (Figure 12C). A
monotherapy siRNA HTS is primarily interested in identifying gene products where the siRNA
alone is toxic to the cell and the protein is essential for cell survival. To identify gene products
that are essential for cell survival, the statistical analyses for this “survival gene” screen would
directly compare the cell viability of the individual gene product to the overall scrambled control

48
(85). A combination siRNA HTS, would primarily identify siRNAs that alone are not toxic to
the cells but the addition of a chemotherapeutic agent to that siRNA, is toxic to the cell. This
would require a more rigorous set of statistical methods, which first eliminates siRNAs that
individually are toxic to the cells, then identifies gene products that, combined with a non-toxic
concentration of anticancer agent, are toxic to the cells.
Using these biological guidelines, I designed and implemented a series of statistical
methods to analyze the vinblastine-dependent siRNA HTS and identify gene products that
sensitize T98G glioblastoma cells to vinblastine. Initially, I normalized the data from each plate
to the internal negative control, scrambled siRNA plus DMSO vehicle. To control for variability
within the HTSs, I employed the Median Absolute Deviations (MAD) analysis as an unbiased
outlier detection method (86, 87). The viability ratio of each gene product, which determined the
magnitude of difference between conditions, was determined by dividing the percent cell
viability of siRNA plus drug by the percent cell viability of the siRNA alone. I also used a one-
sided Student’s t-test to determine the significant difference between the siRNA and drug versus
the siRNA alone.

49
Figure 12. siRNA high-throughput screening protocol.
(A) A siRNA HTS was performed in 384 well plates. On day one cells were wet reverse transfected with
target siRNAs in two identical plates. The cells were incubated for 48 hours allowing sufficient time for protein
knockdown, at which point one plate was treated with a DMSO vehicle control and the other plate with a sub-lethal
concentration of vinblastine (VBL). After an additional 48 hours, cell viability was determined by CellTiter Blue
cell viability assay. (B) The siRNAs were plated in a one gene per well basis with a pool of three siRNAs against
each gene target. On each plate (16 plates in total) the last two columns were treated with a scrambled (SCR) siRNA
as a negative control for transfection. Four wells within the controls contained a “Cell Death” siRNA, which was a
positive control of cell viability. (C) For “hit” determination, all cell viabilities were normalized to the SCR control
within each plate. Statistical analyses were performed directly comparing siRNA plus VBL (Xi) to siRNA plus
DMSO vehicle control (Yi).

50
Figure 13. siRNA HTS theory to identify a novel combination chemotherapy.
T98G cells were treated with non-toxic concentrations of vinblastine: scrambled plus microtubule
perturbing agent (MPAs) and the siRNA druggable genome library. For the screen, we were interested in genes
where the siRNAs themselves were not significantly toxic to the cells (siRNA X plus vehicle) when compared to the
negative control (Scrambled plus vehicle); however, when cells were treated with the siRNA in combination with
the non-toxic concentration of vinblastine (siRNA X plus MPAs), the combination was toxic to the cell. I was
particularly interested in instances when the results from the siRNA screen were mimicked with a drug/drug
combination between drug X, targeting protein X in combination with the non-toxic concentration of vinblastine.

51
3.2.1 Median Absolute Deviations outlier detection method
The MAD analysis method is an outlier detection method that is unbiased towards the presence
or absence of outliers. Other outlier detection methods, which are based on the mean of the data
set, are actually influenced by the presence of outliers, increasing the possibility of false
positives. Previously, the MAD analysis has been utilized as a method for hit detection (87), but
for the purposes of our siRNA high throughput screen, I used the MAD analysis as an outlier
detection method.
siRNA screens are an inherently variable type of screen where data sets can change on a
daily basis. There are a number of factors that can contribute to this variability including HTS
mechanical error, differences in sera composition and changes in cell density day to day. An
additional element is the variability in transfection efficiency between replicates (83). For some
processes complete deletion of the protein is essential to sensitize cells to vinblastine
cytotoxicity. Partial protein suppression due to poor transfection efficiency could mask the
sensitization. For the vinblastine siRNA screen, there were a significant number of occasions
where one of the three replicates of the screen was significantly different from the other two
screens. To aid in the hit determination, I employed the MAD analysis to remove outliers from
the three replicates of the screen while not being biased by the presence of said outliers (Figure
14).

52
Figure 14. Example of MAD analysis from the primary screen: AKT3.
(A) MAD analysis formula where ix~ is the median of the viability replicates of the ith gene from the
screens, ijx is the viability of the ith gene in the jth screen and ijM is the MAD score for the ith gene in the jth
screen. (B) An example of a data set from the primary screen (AKT3) where one replicate of the screen was
significantly different from the other two replicates (red boxes), which was verified by MAD analysis, where an
observation with a MAD score greater than 3.5 was deemed an outlier with 95% confidence. (C) Visual
representation of percent cell viability of the gene AKT3 before and after MAD analysis. Before MAD analysis,
there is greater variability and no significant difference between siRNA and siRNA plus vinblastine. After MAD
analysis, the variabilities are smaller and there is a significant difference between the two conditions.

53
After applying the MAD analysis to the entire screen, I found that 20% of the data points
over three replicates of the screens were outliers. Using histograms to visualize the variability
between replicates, I graphed the frequency of standard deviations before and after MAD
analysis (Figure 15). Before MAD analysis, the distribution of standard deviations had a normal
Gaussian appearance centered around 20% standard deviations and extended out to
approximately 40%. After MAD analysis, the distribution of the standard deviations became
bimodal where a specific population was affected by MAD (the lower mode) and a second
population was unaffected by MAD (the upper mode). This unaffected population could be
attributed to instances where the MAD analysis did not recognize an outlier based on the
distribution of the data. If a siRNA were to have three replicates that were largely variable, but
were evenly distributed (e.g. 20% difference between each data point), the MAD analysis would
not recognize any of the data points as outliers, resulting in a population of genes with large
standard deviations. Despite this population unaffected by MAD, there was a second population
that was heavily biased by the MAD analysis, where many of the genes that once had standard
deviations over 10% were well below 5% standard deviations.
Figure 15. Histogram of standard deviations before and after MAD analysis.
Graph of the frequency of standard deviations of the genes from the vinblastine siRNA screen before (left)
and after MAD analysis (49). After MAD analysis, a significant population had a drastic change in standard
deviations, dropping to less than 10% variability between replicates.

54
After applying the MAD analysis, I needed to develop a series of statistical methods to
help identify gene products from the primary screen that sensitized cells to vinblastine. For this,
I set a series of criteria that each gene product had to fulfill in order to be considered a sensitizer
to vinblastine (Figure 13). I was interested in gene products where: 1) the siRNAs alone were not
toxic to the cells, 2) the concentration of vinblastine was not toxic to the cells and 3) the
combination of the vinblastine and siRNA were significantly toxic to the cells in a biologically
relevant manner. For a gene product to be biologically relevant, I was particularly interested in
instances where the siRNA sensitized the cells to vinblastine with a greater than 50% toxicity. To
determine which gene products were biologically relevant, I employed the viability ratio to
calculate the magnitude of response between conditions.
3.2.2 Viability ratio
The viability ratio is a value used to determine the signaling window between the siRNA/DMSO
control and the siRNA/vinblastine conditions. This value takes into account the magnitude of
response between the two conditions by dividing the percent cell viability of the siRNA plus
vinblastine by the percent cell viability of the siRNA plus DMSO control, where both conditions
are normalized to the scrambled/DMSO control (61). To determine the viability ratio of each
siRNA, I used the following equation:
i
i
yxVR =
where VR is the viability ratio, ix is the mean of the percent cell viability of the siRNA plus
vinblastine across the three screens and iy is the mean of the percent cell viability of the siRNA
plus DMSO control.

55
For the vinblastine siRNA HTS, the viability ratios were determined and samples were
ranked where the smallest viability ratios had the largest signaling window between siRNA plus
DMSO and siRNA plus vinblastine. The top 2.5% of gene products were selected as sensitizers
of T98G cells to vinblastine. Despite the ability of the viability ratio to determine gene products
with the largest signaling window between experimental conditions, the viability ratio does not
take standard deviations into consideration and some of the top gene products were not
statistically significant due to large standard deviations (Figure 16A). Therefore, I employed a
statistical method to determine which gene products were sensitizers to vinblastine with
statistical significance.
3.2.3 Student’s t-test
The Student’s t-test is a two sample test used to determine whether there is a significant
difference between two population means. The paired t-test is used when testing repeated
measures, where the conditions are tested before and after a treatment (e.g. siRNAs before and
after receiving treatment with vinblastine). The null hypothesis states that the means of the two
normally distributed populations are not significantly different and the alternate hypothesis states
the two means are significantly different. For a one tailed t-test:
yxOH µµ ≥: yxaH µµ <:
where Ho is the null hypothesis, Ha is the alternate hypothesis, xµ is the mean of samples treated
with vinblastine and yµ is the mean of the DMSO control. To determine the t value of a sample, I
used the equation:

56
( ) ( )
y
y
x
x
yxii
ns
ns
yxt
22
+
−−−=
µµ
where t is the t value, nx and ny are the sample sizes, ix and iy are the sample means, µx and µy
are the population means, and sx and sy are the standard deviations of the samples (88). I used
Excel to determine the p-values associated with the t values.
For the vinblastine siRNA HTS, I was interested in instances where the siRNA alone was
not toxic to the cells but upon the addition of drug, the combination of siRNA and vinblastine
was toxic to the cells (Figure 13). To determine gene products where the siRNA plus drug was
significantly different from the siRNA alone, I employed a one-sided Student’s t-test comparing
cells treated with siRNA (µy) and siRNA plus vinblastine (µx).
Upon reviewing the data, I observed instances where the difference between the two
samples was statistically significant but the magnitude of response between the two conditions
was not large enough to be what I considered to be biologically relevant (Figure 16B). In these
samples, the standard deviations between the two samples were extremely small making the
conditions statistically different but the addition of vinblastine did not greatly increase the
toxicity to the cells. I was interested in identifying gene products based on the combination of
the statistical significance and the magnitude of response between the two conditions. Therefore
I combined the viability ratios and the Student’s t-tests to determine my high confidence gene
products that significantly sensitized cells to vinblastine in a biologically relevant manner.
One issue to address when performing numerous Student’s t-tests is when performing t-
tests with an α of 0.01 on 5,520 different genes, there is a 100% chance of having at least one
false positive due to multiple comparisons (89). To help limit the possibility of false positives

57
due to multiple comparisons, I first limited the data set by selecting the top 2.5% viability ratios;
however, even in performing only 138 Student’s t-tests (2.5% of 5,520), there was still a 75%
chance of having at least one false positive. To control for these possibilities, I employed the
Benjamini-Hochberg’s false discovery rate procedure with an α 0.02, which decreased the
probability of at least one false positive due to multiple comparisons from 75% to 2% when
performing t-tests on 138 samples (90).
3.2.4 False discovery rate
The Benjamini-Hochberg false discovery rate (FDR) is a statistical method used to control for
multiple comparisons during hypothesis testing. In a list of rejected hypotheses, the FDR
controls the proportion of incorrectly rejected null hypotheses, also known as type I errors or
false positives (91, 92). The FDR is an alternative to the familywise error rate (FWER), which is
a common approach for controlling error due to multiple comparisons (90). The FWER method,
while decreasing the possibility of false positives, also increases false negatives by being too
stringent and weighing each rejected hypothesis with the same significance level (93). The FDR
corrects for this stringency by ranking the samples according to their p-value, where the lower
the rank, the less strict the criteria (89). By ranking the p-values of the Student’s t-test for each
sample from smallest to largest, the FDR can be calculated using the following equation:
mkFDRkα
=
where k is the rank of the sample, α is the confidence interval and m is the total number of t-tests
performed. Each ordered p-value (pk) is compared to the corresponding FDRk where any test
with a pk less than the FDRk is declared significant.

58
3.2.5 Statistical Conclusions
By first identifying gene products by their viability ratios, selecting the top 2.5% of the 5,520
gene products and then performing Student’s t-tests on the remaining 138 genes with an α of
0.01, I identified gene products that sensitize T98G glioblastoma cells to vinblastine in a
statistically significant and biologically relevant manner (Figure 16C). Using these methods, I
identified 65 high confidence gene products, in an unbiased manner, which sensitized cells to a
sub-lethal concentration of vinblastine.
To eliminate the possibility of false positives due to multiple comparisons, I performed
an FDR analysis on the 138 gene products. Upon applying an α of 0.02, I found that all 65 gene
products identified by the viability ratios and Student’s t-test were declared significant according
to the FDR.
Figure 16. Examples of Student's t-test and viability ratios.
(A) Top gene product (TNFRSF6) using viability ratios to determine vinblastine sensitizers. The samples
are biologically relevant with a large difference between the two conditions (VR=0.275), but based on standard
deviations, are not statistically significant (p=0.03). (B) Top gene product (DKFZP434F011) using Student’s t-tests
where the samples are statistically significant (p=0.0001) but are not biologically relevant (VR=0.913). (C) Top
gene product (BCL-xL) combining the Student’s t-test with the viability ratios to determine significant hits. The
conditions are statistically significant (p=0.0001) and biologically relevant (VR=0.329). Each value is the mean of
three independent experiments. Bars equal S.D.

59
3.3 RESULTS
3.3.1 Primary screen
A siRNA HTS was performed to identify gene products that sensitized T98G cells to
vinblastine. siRNAs were aliquoted into 384 well plates in a one gene per well format, including
scrambled and cell death siRNA controls on each plate. This format allowed for direct plate to
plate comparisons within the screen. Initially, T98G cells were wet reverse transfected with 3
pooled siRNAs against each target in two identical plates. The cells were incubated for 48 hours
to allow for sufficient protein depletion, at which point one plate was treated with an EC10
concentration of vinblastine (1.2 nM) and the other with DMSO control (0.05%). After 48 hours
of drug treatment the cell viability was determined for each well using a CellTiter Blue cell
viability assay. All drug and siRNA treatments were normalized to a DMSO/SCR siRNA
control, which was defined as 100% cell viability. This screen was performed in three replicates
over three separate weeks (80).
I applied a series of statistical methods to determine which gene products sensitized
T98G cells to vinblastine with an α of 0.01. MAD analysis was performed to determine outliers
with 95% confidence. After all outliers were removed, I averaged the replicates of each gene and
determined the viability ratios by dividing the cell viability of the siRNA plus vinblastine by the
siRNA alone. The genes were ranked according to their viability ratio and I selected the top 2.5%
of genes products. I performed a Student’s t-test on the 138 remaining genes, comparing the
siRNA to siRNA plus vinblastine treatments, and determined which genes sensitized T98G cells
to vinblastine with an FDR of 2%, resulting in 65 high confidence gene products that sensitize
cells to vinblastine (Figure 17, Table 2).

60
Figure 17. Reduction in cell viability with the top 65 gene products from the siRNA screen.
Percent cell viabilities were determined for the siRNA plus DMSO (white bars) and siRNA plus vinblastine
(VBL, black bars) for all genes in the druggable genome library. The top hits from the screen, according to the
viability ratios and p-values (65 genes), are listed above. In most cases, the siRNAs were not toxic to the cells when
used alone; however, upon addition of a non-toxic concentration of vinblastine, the combination was toxic. Each
value is the mean of three independent experiments. Bars equal S.D.
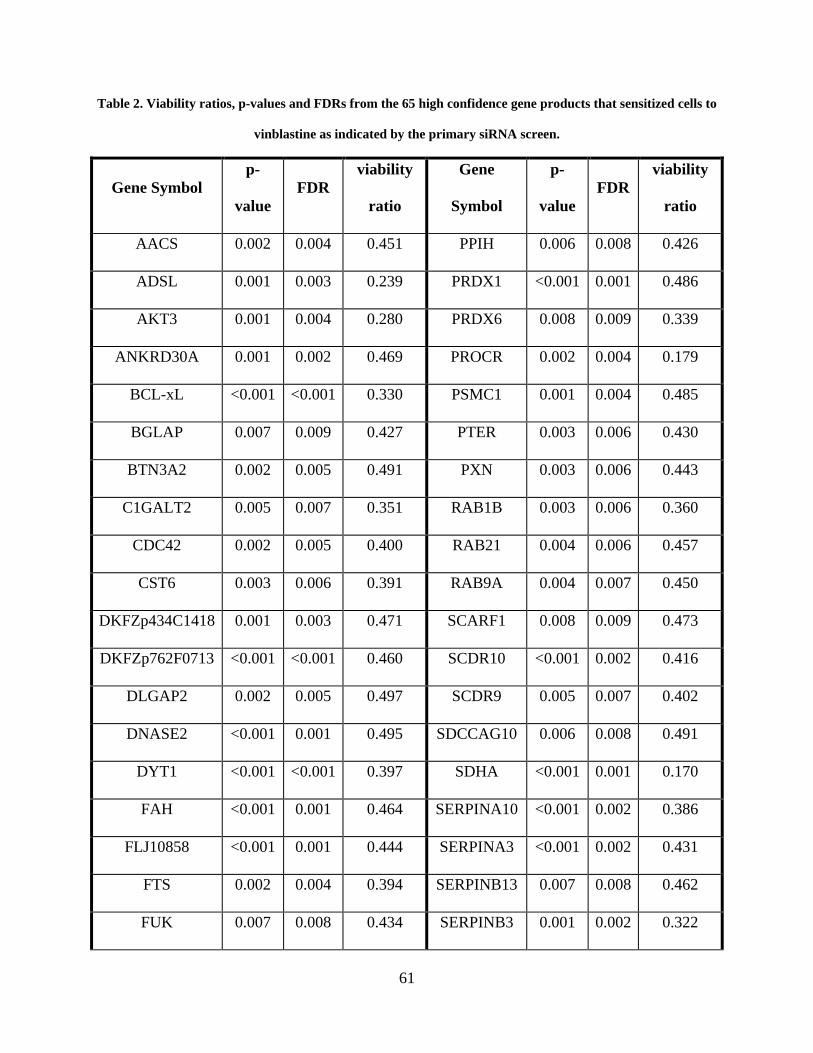
61
Table 2. Viability ratios, p-values and FDRs from the 65 high confidence gene products that sensitized cells to
vinblastine as indicated by the primary siRNA screen.
Gene Symbol p-
value FDR
viability
ratio
Gene
Symbol
p-
value FDR
viability
ratio
AACS 0.002 0.004 0.451 PPIH 0.006 0.008 0.426
ADSL 0.001 0.003 0.239 PRDX1 <0.001 0.001 0.486
AKT3 0.001 0.004 0.280 PRDX6 0.008 0.009 0.339
ANKRD30A 0.001 0.002 0.469 PROCR 0.002 0.004 0.179
BCL-xL <0.001 <0.001 0.330 PSMC1 0.001 0.004 0.485
BGLAP 0.007 0.009 0.427 PTER 0.003 0.006 0.430
BTN3A2 0.002 0.005 0.491 PXN 0.003 0.006 0.443
C1GALT2 0.005 0.007 0.351 RAB1B 0.003 0.006 0.360
CDC42 0.002 0.005 0.400 RAB21 0.004 0.006 0.457
CST6 0.003 0.006 0.391 RAB9A 0.004 0.007 0.450
DKFZp434C1418 0.001 0.003 0.471 SCARF1 0.008 0.009 0.473
DKFZp762F0713 <0.001 <0.001 0.460 SCDR10 <0.001 0.002 0.416
DLGAP2 0.002 0.005 0.497 SCDR9 0.005 0.007 0.402
DNASE2 <0.001 0.001 0.495 SDCCAG10 0.006 0.008 0.491
DYT1 <0.001 <0.001 0.397 SDHA <0.001 0.001 0.170
FAH <0.001 0.001 0.464 SERPINA10 <0.001 0.002 0.386
FLJ10858 <0.001 0.001 0.444 SERPINA3 <0.001 0.002 0.431
FTS 0.002 0.004 0.394 SERPINB13 0.007 0.008 0.462
FUK 0.007 0.008 0.434 SERPINB3 0.001 0.002 0.322

62
Gene Symbol p-
value FDR
viability
ratio
Gene
Symbol
p-
value FDR
viability
ratio
GSTA1 0.009 0.009 0.371 SERPINB5 0.005 0.007 0.484
GSTZ1 0.001 0.003 0.455 SEZ6L2 0.005 0.007 0.496
GYG 0.003 0.006 0.485 SPINK1 0.001 0.002 0.411
GYS1 0.006 0.007 0.460 SULF2 0.007 0.008 0.490
ITPR3 0.009 0.009 0.399 TGM3 0.001 0.003 0.483
KDELR1 0.008 0.009 0.410 THEA 0.007 0.008 0.441
KIF11 0.009 0.009 0.481 TNFRSF25 0.002 0.005 0.475
LOC136242 0.006 0.008 0.456 TPRA40 <0.001 0.001 0.450
LOC200895 0.002 0.005 0.438 UGT1A9 0.002 0.005 0.498
NIT1 <0.001 0.001 0.402 UGT2B11 0.002 0.005 0.440
NOS1 <0.001 0.003 0.483 UGT2B17 0.001 0.003 0.496
NRAS 0.001 0.003 0.389 UMPS 0.001 0.004 0.380
PMM2 0.005 0.007 0.397 WARS2 0.003 0.006 0.479
POLR1A 0.001 0.004 0.497

63
3.3.2 Secondary assay
To confirm gene products that sensitized cells to vinblastine, I performed a secondary assay
replicating the experimental conditions from the primary screen. Individual siRNA sequences
have the ability to affect the expression of unintended targets (94). Knocking down an
unintended protein target by an individual siRNA could sensitize the cells to vinblastine resulting
in a false positive. Using various siRNA sequences targeting a specific protein of interest
increases the likelihood that the collective effect by the siRNAs is due to the direct knockdown
of the protein of interest and not an unintended target.
Using this theory, I tested two individual siRNAs targeting the top 65 high confidence
genes to confirm siRNAs from the primary screen. By testing two unique siRNAs targeting the
same gene products, I was able to enhance the likelihood the observed effect was due to on-
target effects. If only one or none of the siRNAs targeting a gene product sensitized cells to
vinblastine, then the effect seen in the primary screen was possibly due to non-specific effects of
the siRNA; however if both siRNAs confirmed as vinblastine sensitizers, then the shared effect
by the siRNAs was likely due to specific knockdown of the protein of interest (61). Therefore, I
accepted the gene products where both siRNAs confirmed in the secondary assay as true
sensitizers to vinblastine.
For the secondary assay, I performed the screen in a one gene, one siRNA per well basis.
Using the same experimental methods as the primary screen, I transfected one 384 well plate
containing all siRNAs in duplicates, where the first half of the plate (columns 1 through 12) and
the second half (columns 13 through 24) were identical. After employing the MAD analysis, I
determined the viability ratios for each siRNA and ranked the samples accordingly. I also used
the Student’s t-test to determine whether the siRNAs treated with vinblastine were significantly

64
Table 3. Forty of the 65 gene products from the primary screen confirmed as vinblastine sensitizers with
T98G cells, nine of which confirmed with both siRNAs (first column).
p-value p-value p-value
Gene
Symbol
siRNA
A
siRNA
B
Gene
Symbol
siRNA
A
siRNA
B
Gene
Symbol
siRNA
A
siRNA
B
ACOT11 0.023 <0.001 ADSL NS* 0.003 POLR1A NS* 0.041
AKT3 0.033 0.002 ANKRD30A NS* 0.042 PRDX6 0.014 NS*
BCL-xL 0.035 0.041 BTN3A2 NS* 0.041 PROCR 0.002 NS*
FUK 0.006 0.003 CDC42 NS* 0.002 RAB9A NS* 0.031
ITPR3 0.003 0.010 DHFRL1 0.046 NS* SDHA NS* <0.001
KDELR1 0.029 0.030 GSTA1 0.027 NS* SERPINA10 NS* 0.024
NOS1 0.008 0.003 HSD11B1L 0.012 NS* SERPINB13 NS* 0.012
NRAS 0.003 0.001 LOC136242 0.030 NS* SPINK1 0.004 NS*
SERPINA3 0.004 0.008 NEIL3 <0.001 NS* UGT1A9 0.046 NS*
NIT1 NS* 0.045 UGT2B17 NS* 0.004
PMM2 0.023 NS* WARS2 0.012 NS*
*NS (not significant) represents siRNAs in the secondary screen with a p>0.05.

65
different from those treated with DMSO. I ranked the samples according to their p-value and
selected all siRNAs with a p≤0.05 as vinblastine sensitizers (Table 3 ). Forty of the siRNAs
repeated from the primary screen, nine of which had both siRNAs confirm, indicating that the
observed effect was likely due to specific knockdown of the gene product and not due to off-
target effects. I recognize that I cannot determine whether the effect seen by the other 22 siRNAs
was due to off-target effects, but for the purposes of this study, I focused on those gene products
that confirmed both siRNAs from the secondary assay.
To aid in assay characterization, this list of nine was further limited to gene products with
commercially available inhibitors and antibodies. The other gene products are available for
possible drug discovery, but I limited the list to gene products with already available inhibitors:
AKT3, BCL-xL, NOS1 and NRAS.
66
3.4 DISCUSSION
siRNA HTS technology has been recently developed to identify gene products where the loss-of-
function phenotype results in a decrease of proliferation or even death of cancerous cells (1, 95,
96). To help identify novel combination treatments for cancer, I performed a vinblastine-
dependent siRNA HTS targeting the druggable genome to identify gene products that sensitize
cells to the microtubule destabilizing agents, which, to my knowledge, has not been previously
reported. Using this siRNA screening methodology, in combination with a series of statistical
methods, I identified gene products that sensitized glioblastoma cells to vinblastine.
Previously, the MAD analysis has been utilized as a method for “hit” detection (87), but
for my purposes the MAD analysis served as an unbiased outlier detection method. siRNA
screens are an inherently variable type of cellular assay where data sets can change daily due to
differences in cellular functionality, human or mechanical error, and siRNA transfection
efficiency (83). Even in the most consistent siRNA screens, the transfection efficiency is
challenging to regulate and monitor on a well-to-well basis, which increases the possibility of
variability among replicates. Using the MAD analysis, I was able to identify replicates within
the individual screens that did not corroborate with the overall results. In removing these
replicates, I uncovered a subset of possible false-negatives that were being heavily biased by the
presence of outliers (Figure 14).
Other studies have used siRNA methodology to identify novel combination
chemotherapies using a synthetic lethality approach where non-essential gene products were
targeted, and alone the loss-of-function phenotype was non-toxic to the cells, but in combination
with an anticancer therapy, was lethal to cancer cells. Whitehurst et al. performed a siRNA
synthetic lethal screen where they treated cells with a sub-lethal concentration of the microtubule

67
stabilizing agent paclitaxel in combination with a siRNA library targeting 21,127 unique human
genes (61). Using statistical analyses combining Student’s t-tests and viability ratios, they
identified 87 genes that sensitized non-small-lung cancers to paclitaxel. In their statistical
analyses, Whitehurst et al. first performed a Student’s t-test on all 21,127 genes, which has a
100% chance that at least one of those t-tests was a false positive due to multiple comparisons.
To control for the possibility of these false positives being due to multiple comparisons, they
performed a FDR, which weighs the p-value of each gene based on the number of t-tests
performed and the rank of that individual gene. By selecting a FDR α of 0.05, they identified
gene products that were declared to be true positives with 95% confidence. Simultaneously,
Whitehurst et al. ranked the 21,127 genes according to their viability ratios and selected the top
2.5% (528 genes) as sensitizers to paclitaxel. Genes that were identified by both an FDR ≤0.05
and the top 2.5% viability ratios were included as high confidence paclitaxel sensitizers.
For the statistical analyses for the vinblastine HTS, I took a similar approach to that of
Whitehurst et al. employing both the Student’s t-test and the viability ratios as a measure of “hit”
determination. While, Whitehurst et al. performed the Student’s t-test and viability ratios
concurrently and selected the overlapping gene products, I performed a more linear analysis,
where I first limited the gene products by their viability ratios, then performed Student’s t-tests
on those top 138 genes (Figure 18). By first limiting the number of Student’s t-tests from 5,520
to 138, I decreased the possibility of a false positive due to multiple comparisons from 100% to
75%. While Whitehurst et al. performed their siRNA HTS on 21,127 genes, compared to my
5,520 genes, had they first limited their samples by their viability ratios, they would have
performed only 528 t-tests. By performing 528 t-tests versus 21,127 at an α of 0.01, they could
have decreased the probability of at least one false positive due to multiple comparisons before

68
ever performing a FDR analysis. To confirm this, I directly compared the statistical sequence I
employed versus that of Whitehurst et al. for the vinblastine siRNA HTS. I confirmed with an
FDR α of 0.02 that all 65 high confidence gene products identified by performing only 138
Student’s t-test, were likely true positives. I also ranked the gene products according to their p-
values and viability ratios as performed by Whitehurst et al. and selected those with a p≤0.01
(733 genes) and the top 2.5% viability ratios (138 genes). I performed an FDR with an α of 0.02
and found that of the 733 t-tests performed, none of the top 2.5% viability ratios were significant
according to FDR, indicating that by first limiting samples according to their viability ratios
significantly decreases the probability of false positives due to multiple comparisons.
Despite my rigorous statistical methods, there was still the potential for false positives
within the screen. One possible cause would be off-target effects of the siRNAs. Thus, I
purchased two unique siRNAs targeting each of the 65 gene products from the primary screen
and tested these siRNAs independently with the assumption if only one or none of the siRNAs
repeated in the secondary screen, the results from the primary screen were possibly due to off-
target effects. In limiting to gene products where both siRNAs confirmed the primary screening
results, I identified nine gene products that confirmed as vinblastine sensitizers.
Assuming that an inhibitor targeting these gene products could have the same molecular
effect as knocking down the gene product by siRNA, I was particularly interested in the top gene
products with commercially available inhibitors to mimic the effect of the siRNA. This further
limited the list to four gene products: AKT3, BCL-xL, NOS1 and NRAS. The complete
overview of the primary and secondary screen can be seen in Figure 18.

69
Figure 18. Primary and secondary assay overview.
A high-throughput screen targeting 5,520 gene products with 16,560 siRNAs was undertaken to identify
vinblastine sensitizers in T98G cells. Outliers from the screen were determined and rejected by MAD analysis.
Genes were ranked according to their viability ratio (VR) and the top 2.5% VRs (138 genes) with FDR≤0.02 were
selected as hits, resulting in 65 genes that sensitize cells to vinblastine (1.2% hit rate). Nine of these genes confirmed
in a secondary screen, which was limited to gene products with commercially available antibodies and inhibitors,
resulting in four gene products as potential targets for novel chemotherapy combinations with vinblastine.
70
4.0 SENSITIZATION OF CANCER CELLS TO VINBLASTINE BY BCL-XL
4.1 INTRODUCTION
The B-cell lymphoma 2 (BCL-2) family is divided into two sub-families: the pro-apoptotic
proteins (BAX and BAK) and the pro-survival proteins (BCL-2, BCL-xL and BCL-w). This
family of proteins governs the mitochondrial outer membrane permeabilization, controlling the
release of cytochrome c and other proapototic proteins in response to a variety of stimuli:
cytotoxic drugs, nutrient deprivation and cell detachment (97). All BCL-2 family members are
characterized by their structures, which universally contain a BCL-2 homology (BH) domain:
BH1, BH2, BH3 or BH4 domain. All pro-survival proteins contain all four BH domains. All
pro-apoptotic proteins contain at least the BH3 domain, which is necessary for dimerization with
other proteins of the BCL-2 family and is crucial for the pro-apoptotic activity (65).
The BCL-2 pro-survival proteins under normal cellular conditions form dimers with the
BCL-2 pro-apoptotic proteins, BAX and BAK, through the BH3 domain (14). Upon activation of
the intrinsic cell death pathway through various stimuli (Figure 19A), BH3-only proteins, such as
NOXA, PUMA, BAD, BIM and BID, interact with the pro-survival proteins (Figure 19B),
causing the pro-survival proteins to release BAX and BAD. BAX and BAD are then free to
oligomerize (Figure 19C) and permeabilize the mitochondrial outer membrane resulting in the
release of cytochrome c into the cytoplasm (Figure 19D). Once released, cytochrome c binds to

71
an adaptor molecule, apoptosis protease-activating factor 1 (APAF-1), which cleaves an inactive
initiator caspase, procaspase-9, into activated caspase-9. Caspase-9 in turn activates caspase-3,
which ultimately signals apoptosis (Figure 19E).
Constitutively high levels of BCL-2 and BCL-xL have been associated with more
aggressive cancers as well as certain multi-drug resistant cancers (9, 11, 43, 98). For example,
overexpression of BCL-xL in the NCI 60 cell line panel strongly correlates with multidrug
resistant cancer cell lines (12) and overexpression of BCL-2 in primary prostate cancers is
associated with high Gleason scores and an increased rate in relapse after a prostatectomy (9).
The overexpression of these BCL-2 prosurvival proteins, BCL-2 and BCL-xL, can actually cause
alterations in susceptibility of these cells to apoptosis, resulting in resistance to anticancer agents
(21). Even with activation of BH-3 only proteins by external stimuli, such as anticancer agents,
there is an abundance of these pro-survival proteins, where some BCL-2 and BCL-xL proteins
can be bound to the BH-3 proteins and others remain bound to the pro-apoptotic BCL-2 proteins.
Even though the cell is receiving a pro-apoptotic stimulus, there is an excess of pro-survival
proteins and the intrinsic cell death pathway cannot be activated.
Recently, small molecule inhibitors targeting these BCL-2 pro-survival proteins have
been developed to target cancer cells overexpressing BCL-2 and BCL-xL, thereby restoring the
balance between pro-survival and pro-apoptotic proteins and resensitizing the cells to the
intrinsic cell death pathway. These small molecule inhibitors, which were identified through a
structure-based computer screen, are BH3 mimetics that bind in the BH3 domain of the pro-
survival proteins and induce a disassociation with the pro-apoptotic proteins (37). This
disassociation activates the pro-apoptotic proteins, allowing them to oligomerize and relocate to
the surface of the mitochondria, ultimately resulting in the activation of apoptosis (Figure 19).

72
Figure 19. The intrinsic cell death pathway.
(A) The intrinsic cell death pathway is initiated by various external stimuli including chemotherapeutic
agents. (B) MAPK proteins (JNK, p21, p53, PKA, CDC2 and Raf-1) are indirectly activated by anticancer agents,
which phosphorylate and inhibit BCL-2 pro-survival proteins (BCL-2, BCL-xL and BCL-w), thereby releasing and
activating the pro-apoptotic BCL-2 proteins (BAX and BAK). (C) BH3-only proteins (BIM, BID, BAD, NOXA and
PUMA) engage with pro-survival BCL-2 family members to relieve the inhibition of the pro-apoptotic BCL-2
family members. (D) Upon separation of the pro-apoptotic proteins from the pro-survival proteins, BAX and BAK
translocate to the mitochondria where they oligomerize and are activated, leading to the permeabilization of the
mitochondrial outer membrane. (E) Cytochrome c is released into the cytoplasm, where it combines with apoptosis
protease-activating factor 1 (APAF-1) and pro-caspase-9. (F) Pro-caspase-9 is cleaved into caspase-9, which
activates caspase-3 and results in the activation of apoptosis.

73
ABT-737, 4-[4-[(4'-Chloro[1,1'-biphenyl]-2-yl)methyl]-1-piperazinyl]-N-[[4-[[(1R)-3-
(dimethylamino)-1-[(phenylthio)methyl]propyl]amino]-3-nitrophenyl]sulfonyl]benzamide
(Figure 9A), is a BH3 mimetic that specifically targets BCL-2, BCL-xL and BCL-w. ABT-737
binds to these pro-survival proteins with a high affinity and has shown single agent antitumor
efficacy as well as synergistic effects in conjunction with radiation and chemotherapy with
reduced cytotoxicity (97, 99). The prospects of ABT-737 as a therapeutic agent, however, are
limited due to the poor physiochemical and pharmaceutical properties of ABT-737 (68).
ABT-263, 4-(4-{[2-(4-chlorophenyl)-5,5-dimethylcyclohex-1-en-1-yl]methyl}piperazin-
1-yl)-N-({4-({(1R)-3-morpholin-4-yl-1-[(phenylsulfanyl)methyl]propyl}amino)-3-
[(trifluoromethyl)sulfonyl]phenyl}sulfonyl)benzamide (Figure 9B), is a second generation BH3
mimetic derived from ABT-737. ABT-263, unlike its predecessor, is orally bioavailable and
soluble in water, giving ABT-263 promise as a therapeutic agent (68). Cancer cell lines that
overexpress BCL-2 and BCL-xL are very sensitive to treatment with ABT-263, resulting in rapid
BAX activation, cytochrome c release and caspase activation. ABT-263 has been successful in
xenograft models both as an individual treatment, as well as in combination with three anticancer
therapies: rituximab, a monoclonal antibody against CD20; bortezomib, a proteasome inhibitor;
and rapamycin, an mTOR inhibitor (68, 100, 101).
Since BCL-xL was identified by the primary and secondary siRNA screen as a sensitizer
to vinblastine and due to the success of the orally bioavailable inhibitor, ABT-263, I wanted to
determine whether ABT-263 could phenocopy BCL-xL siRNA and enhance the cytotoxic effects
of vinblastine.

74
4.2 RESULTS
4.2.1 BCL-xL siRNA sensitization to vinblastine
Due to the clinical success, availability and the biological relevance of inhibitors targeting the
prosurvival protein BCL-xL (21, 68), I examined BCL-xL specific siRNAs and determined
whether they could sensitize T98G cells to increasing concentrations of vinblastine (Figure 20).
T98G cells were treated with vinblastine in the presence or absence of decreasing concentrations
of pooled BCL-xL siRNA (sequences of siRNAs in Appendix A). At all concentrations of BCL-
xL siRNAs tested (0.63 nM to 10 nM Figure 20A-E), I found the cells were sensitized to
concentrations of vinblastine from 3.125 to 25 nM. To determine whether any of the observed
toxicities were due to the siRNAs alone, I determined that at all concentrations tested (0.63 to 10
nM) the BCL-xL siRNA was not toxic to the cells, relative to SCR control (Figure 20F).
Since off-target effects are always a possibility with siRNAs, I performed Western blot
analyses to determine whether the sensitization of vinblastine to T98G cells by BCL-xL siRNAs
was due to specific knockdown of BCL-xL protein. At both the 48 (time of drug addition) and 98
hour (end point of the assay) time points, BCL-xL protein was undetectable at all concentrations
of pooled siRNAs tested relative to SCR control (Figure 21).

75
Figure 20. BCL-xL siRNA sensitization of T98G cells to vinblastine.
Three siRNAs targeting BCL-xL were pooled together and tested as sensitizers of T98G cells to
vinblastine. Cells were transfected with negative control siRNAs (SCR), positive control siRNAs (Cell Death) and
BCL-xL siRNAs at decreasing concentrations: (A) 10 nM, (B) 5 nM, (C) 2.5 nM, (D) 1.25 nM and (E) 0.63 nM.
Forty-eight hours post-transfection, the cells were treated with increasing concentrations of vinblastine ranging from
25 pM to 25 nM. After 48 hours, cell viability was determined by CellTiter Blue fluorometric assay. All data points
were normalized to a SCR/DMSO control and the difference between VBL/SCR and VBL/BCL-xL siRNA were
determined. (F) None of the siRNAs were significantly toxic to the cells at all concentrations tested. (○) T98G cells
treated with vinblastine in combination with siRNA negative control (SCR). (□) T98G cells treated with vinblastine
in combination with pooled BCL-xL siRNAs. (▲) T98G cells transfected with “Cell Death” negative control
siRNA. Each value is the mean of four independent experiments. Bars equal S.E.M. *p≤0.05

76
Figure 21. Reduction in BCL-xL protein levels in T98G cells after siRNA treatment.
Cells were transfected with either negative control (SCR) siRNA or BCL-xL pooled siRNA at various
concentrations (2.5, 1.25, 0.63, and 0.31 nM) and protein levels of BCL-xL were measured at 48 and 96 hours by
Western blot analysis. BCL-xL siRNA decreased protein levels at all concentrations tested relative to the scrambled
control, at both 48 and 96 hours. Blot is representative of three independent experiments.

77
4.2.2 ABT-263 sensitization of T98G and A549 but not HeLa cancer cells to vinblastine
To determine whether ABT-263, a BCL-2 family specific inhibitor, sensitized cells to vinblastine
(as indicated by siRNA), I treated T98G cells with increasing concentrations of vinblastine in the
presence or absence of a nontoxic concentration of ABT-263 (Figure 22A). I found that 1.56 µM
ABT-263 sensitized T98G cells to vinblastine at 1.56 nM and higher (Figure 22B).
Figure 22. Sensitization of T98G cells to vinblastine by ABT-263.
(A) T98G cells were treated with increasing concentrations of ABT-263 (0.8 to 50 µM) for 48 hours. Cell
viability was determined using CellTiter Blue cell viability assay. All values were normalized to the DMSO control
(No ABT-263). (B) T98G cells were treated with increasing concentrations of vinblastine (25 pM to 25 nM) in the
presence and absence of a nontoxic concentration of ABT-263 (1.56 µM). At higher concentrations of vinblastine
(1.56 to 25 nM), ABT-263 significantly decreases the cell viability relative to vinblastine alone. (○) Cells treated
with increasing concentrations of vinblastine. (■) Cells treated with increasing concentrations of vinblastine in the
presence of nontoxic ABT-263 concentrations. Each value is the mean of four independent experiments. Bars equal
S.E.M. *p≤0.05

78
I compared expression levels of BCL-xL protein in T98G and other glioblastoma cells
(U87, U3T3 and LNZ 428), as well as other cancer cells (MDA-MB-231, HeLa and A549), to
normal human astrocytes (HA) by Western blot (Figure 23). I found that relative to the normal
human astrocytes, BCL-xL protein was overexpressed in all of the cancer cell lines tested
(MDA-MB-231, A549, T98G, U87 and U3T3) except for HeLa and LNZ 428.
Figure 23. Overexpression of BCL-xL in human cancer cells.
(A) BCL-xL protein expression was measured by Western blot analysis in various cancer cells including
(from left to right) MDA-MB 231 (breast cancer), HeLa (cervical cancer), A549 (non-small cell lung cancer), T98G,
U87, U3T3, LNZ 428 (glioblastoma), and HA (Human Astrocytes). Expression levels were normalized to a β-
tubulin loading control. (B) Protein expression levels were quantified by densitometry normalized to the tubulin
control and then normalized to the relative expression levels of HA cells. Blot representative of three replicates. Bars
equal S.E.M. *p≤0.05

79
To determine whether the BCL-xL sensitization of vinblastine was specific to T98G
cells, I treated A549 non-small lung cancer cells with increasing concentrations of vinblastine in
the presence or absence of nontoxic concentrations of ABT-263 (Figure 24A). In the presence of
12.5 µM ABT-263, A549 cells were sensitized to vinblastine at concentrations of 3.13 nM and
higher indicating this effect is not specific to T98G or GBM cell lines (Figure 24B).
Figure 24. Sensitization of A549 cells to vinblastine by ABT-263.
(A) A549 cells were treated with increasing concentrations of ABT-263 (0.8 to 50 µM) for 48 hours. Cell
viability was determined using CellTiter Blue cell viability assay. All values were normalized to the DMSO control
(No ABT-263). (B) A549 cells were treated with increasing concentrations of vinblastine (25 pM to 25 nM) in the
presence and absence of a nontoxic concentration of ABT-263 (12.5 µM). At higher concentrations of vinblastine
(3.13 to 25 nM), ABT-263 significantly decreases the cell viability relative to vinblastine alone. (○) Cells treated
with increasing concentrations of vinblastine. (■) Cells treated with increasing concentrations of vinblastine in the
presence of nontoxic ABT-263 concentrations. Each value is the mean of three independent experiments. Bars equal
S.E.M. *p≤0.05

80
To determine if inhibition of BCL-xL sensitized only tumor cells or nonmalignant cells
as well, I wanted to expose human astrocytes with increasing concentrations of vinblastine in the
presence or absence of ABT-263; however, since vinblastine therapy is highly dependent upon
the spindle check point in mitosis, to directly compare the effectiveness of a vinblastine
treatment, cell lines with comparable cell cycle doubling times should be used. A cell line, such
as human astrocyte, which divide significantly slower than most cancer cell lines (96-108 versus
22-24 hour doubling time, respectively), theoretically might appear to be more resistant to
vinblastine simply due to the time it requires for the cells to reach the spindle checkpoint (10,
44). Therefore, I used the HeLa cervical cancer cell line as a comparison to determine the role of
BCL-xL expression level on the sensitization to vinblastine. I believe the HeLa cell line served
as a valuable control as HeLa cells have approximate the same doubling time as both the T98G
and A549 cell lines (22-24 hour doubling time) but express BCL-xL proteins at levels equivalent
to the human astrocyte control (Figure 23). Upon treatment of HeLa cells with increasing
concentrations of vinblastine, there was no significant sensitization (p≤0.05) in the presence of
non-toxic concentrations of ABT-263 (Figure 25).

81
Figure 25. Failure of ABT-263 to sensitize HeLa cells to vinblastine.
(A) HeLa cells were treated with increasing concentrations of ABT-263 (0.8 to 50 µM) for 48 hours. Cell
viability was determined using CellTiter Blue cell viability assay. All values were normalized to the DMSO control
(No ABT-263). (B) HeLa cells were treated with increasing concentrations of vinblastine (25 pM to 25 nM) in the
presence and absence of a nontoxic concentration of ABT-263 (1.56 µM). ABT-263 does not sensitize HeLa cells to
vinblastine at any concentrations tested. (○) Cells treated with increasing concentrations of vinblastine.
(■) Cells treated with increasing concentrations of vinblastine in the presence of nontoxic ABT-263 concentrations.
Each value is the mean of three independent experiments. Bars equal S.E.M. unless the value is less than the size of
the symbol. *p≤0.05

82
4.2.3 Vinblastine concentration dependency for cytotoxicity
Collectively, in the IC50 curves, at the higher concentrations of vinblastine, there is a population
of cells that remains, which could be due to vinblastine having a cytostatic as opposed to a
cytotoxic effect on the cells. To determine whether this is the case, I performed growth inhibition
curves comparing the cell viability at the time of vinblastine addition and the end point of the
assay, 48 hours later, where 0% growth inhibition was the percent cell viability of the negative
control at 96 hours, 100% growth inhibition was the percent cell viability of the negative control
at 48 hours and the 100% cytotoxic was the percent cell viability of the “Cell Death” control at
96 hours.
In all conditions tested (BCL-xL siRNA in T98G cells and ABT-263 in T98G, A549 and
HeLa cells) vinblastine induced a cytostatic effect at concentrations of 1.56 nM and higher
(Figure 26). In the presence of BCL-xL siRNA in the T98G cells, the loss of BCL-xL protein
sensitized the cells to vinblastine and the cytostatic concentrations became cytotoxic (Figure
26A). In the T98G and A549 cell lines, which overexpress BCL-xL protein relative to the
normal human astrocyte cell line, the addition of a non-toxic concentration of ABT-263 also
sensitized the cells to vinblastine, inducing a cytotoxic effect at cytostatic concentrations of
vinblastine alone (Figure 26B and C, respectively). In the HeLa cells, however, which express
BCL-xL at levels equivalent to normal human astrocytes, the growth inhibition curves in the
presence and absence of ABT-263 were not statistically different and, therefore, the cells were
not sensitized to vinblastine in the presence of ABT-263 (Figure 26D).

83
Figure 26. Concentration dependent cytotoxicty of vinblastine with BCL-xL siRNA or ABT-263.
Growth inhibition curves comparing the cell viability at the time of vinblastine addition and the end point
of the assay, 48 hours later. (A) T98G cells transfected with scrambled (SCR), 5 nM BCL-xL or “Cell Death”
siRNA, were treated with increasing concentrations of vinblastine. At 1.56 nM of vinblastine and higher, vinblastine
had a cytostatic effect (100% growth inhibition) on the cells. In the presence of 5 nM BCL-xL siRNA, the cells were
sensitized to vinblastine and the combination had a cytotoxic effect, where 100% cellular toxicity is complete
lethality. “Cell Death” siRNA was completely lethal in the cells. (B) T98G, (C) A549 and (D) HeLa cells were
treated with increasing concentrations of vinblastine in the presence and absence of 1.56 µM ABT-263. Alone
vinblastine was cytostatic, but upon the addition of ABT-263 in the T98G and A549 cells, the combination was
cytotoxic. There was no significant difference between the two conditions in the HeLa cells. Each value is the mean
of three independent experiments. (○) Cells treated with increasing concentrations of vinblastine. (■) Cells treated
with increasing concentrations of vinblastine in the presence of nontoxic BCL-xL siRNA or ABT-263. (▲) T98G
cells transfected with “Cell Death” negative control siRNA. Each value is the mean of three independent
experiments. Bars equal S.E.M. *p≤0.05

84
4.2.4 ABT-263 induction of mitochondrial-dependent apoptosis
To determine the process by which the combination of nontoxic ABT-263 and vinblastine
induced cell death in T98G cells, I examined caspase-3/7 activation using a Caspase-3/7 Glo
assay kit. T98G cells were treated with increasing concentrations of vinblastine in the presence
and absence of 1.56 µM ABT-263 and caspase-3/7 activity was observed over time. At a toxic
concentration of ABT-263 (25 µM), I observed significant activation of caspase-3/7 relative to
DMSO control as early as one hour (Figure 27A, dark grey), which was maintained through 24
hours (Figure 27A, white). From the time of drug addition up to eight hours (Figure 27A, light
grey), there was no observed activation of caspase-3/7 by non-toxic concentrations of ABT-263
(1.56 µM) or vinblastine relative to DMSO controls; however, at 24 hours, treatments of 1.56
nM vinblastine and higher resulted in activation of caspase-3/7 (Figure 27B, dotted line). In the
presence of 1.56 µM ABT-263, which alone had low levels of caspase 3/7 activation at 24 hours
(Figure 27A, white), there was a greater than additive increase in caspase 3/7 activation by
vinblastine (Figure 27B, solid line, 1.56 to 25 nM) that corresponded with the increased toxicity
seen in Figure 22.
I also examined cytochrome c localization in the mitochondria to determine whether the
decrease in cell viability was occurring through mitochondria-dependent (intrinsic) apoptosis. I
initially treated T98G cells with increasing concentrations of ABT-263 and observed a
concentration dependent decrease in cytochrome c localization to the mitochondria (Figure 28A
and B). At three hours, in the presence of ABT-263 and ABT-263 plus vinblastine, but not
vinblastine alone, there was a decrease in cytochrome c expression in the mitochondria,
indicative of cytochrome c release into the cytoplasm and ultimately the induction of intrinsic
apoptosis (Figure 28C and D).

85
Figure 27. Induction of intrinsic apoptosis induced by vinblastine and ABT-263.
(A) Activation of caspase-3/7 in T98G cells was measured at toxic (25 µM) and nontoxic (1.56 µM)
concentrations of ABT-263 and toxic (25 nM) concentrations of vinblastine over time. Caspase-3/7 activation was
measured at 0 (black), 1 (dark grey), 8 (light grey) and 24 (61) hours. (B) T98G cells were treated with increasing
concentrations of vinblastine (25 pM to 25nM) in the presence and absence of 1.56 µM ABT-263. Caspase-3/7
activation was measured at 24 hours using a Caspase-3/7 Glo assay kit. (Δ) Cells treated with increasing
concentrations of vinblastine. (■) Cells treated with combinations of vinblastine and ABT-263. Each value is the
mean of three independent experiments. Bars equal S.E.M. *p≤0.05

86
Figure 28. ABT-263 dependent caspase-3/7 induction of intrinsic apoptosis.
(A) T98G cells were treated with decreasing concentrations of ABT-263 (3.125 to 0.31 µM) and
localization of cytochrome c was visualized by Western blot analysis. ERAB, a mitochondrial specific marker, was
used as a loading control. (B) Quantification of cytochrome c localization to the mitochondria, relative to ERAB
expression levels. All values were normalized to the DMSO control. (C) Localization of cytochrome c to the
mitochondria in the presence of DMSO, 1.56 µM ABT-263, 12.5 nM vinblastine, and ABT-263 plus vinblastine.
(D) Quantification of localization of cytochrome c to the mitochondria in the presence of ABT-263, vinblastine or
ABT-263 plus vinblastine. Expression levels were normalized to ERAB expression levels as well as the DMSO
control. Blots are representative of three independent experiments. Bars equal S.E.M. *p≤0.05

87
4.3 DISCUSSION
BCL-xL is a member of the B-cell lymphoma-2 (BCL-2) pro-survival proteins and has an
essential role in the mitochondrial-dependent apoptosis pathway. These pro-survival proteins
inhibit the pro-apoptotic proteins BAX and BAK, which in the activated state, BAX and BAK
lead to mitochondrial permeabilization and the release of cytochrome c in to the cytoplasm.
Cytochrome c cleaves pro-caspase-9 into caspase-9 activating caspase-3 through a signaling
cascade, ultimately resulting in mitochondrial-dependent apoptosis (21).
Exposure to microtubule perturbing agents is indirectly responsible for the
phosphorylation of pro-survival BCL-2 family proteins, as well as the activation of BH3 only
proteins, leading to mitochondrial-dependent apoptosis; however, the exact mechanism by which
these microtubule perturbing agents activate intrinsic apoptosis is not well understood (22). I
suspect that the induction of apoptosis by these microtubule perturbing agents is a very complex
process associated with many protein kinase signaling pathways. A better understanding of these
pathways is necessary and may provide a unique avenue for targeting cancer cells with these
anticancer therapies.
A variety of cancers are able to evade mitochondrial-dependent apoptosis due to the
overexpression of BCL-2 pro-survival proteins (21, 65, 102, 103). Even though these cancer
cells receive a cytotoxic stimulus, such as vinblastine, the cells do not undergo apoptosis due to
an overabundance of these pro-survival proteins that prevent the oligomerization of pro-
apoptotic proteins and thereby prevent intrinsic apoptosis (Figure 29B).
Oblimersen sodium is a BCL-2 antisense oligonucleotide that has been used clinically to
specifically decrease the expression of BCL-2 protein in cancer cells. BCL-2 siRNAs, like
oblimersen, can resensitize chemotherapy resistant cancer cells due to an overexpression of

88
BCL-2 pro-survival proteins: BCL-2, BCL-xL and BCL-w (104-106). Decreasing the protein
expression of BCL-2 by siRNA predisposes the cells to an apoptotic phenotype that reestablishes
the balance between the pro-survival and pro-apoptotic proteins, if not a complete bias towards
the pro-apoptotic proteins BAX and BAK (Figure 29C). Oblimersen has been clinically tested in
combination with other anticancer chemotherapeutics in chronic lymphocytic leukemia, acute
myeloid leukemia, multiple myeloma, small cell lung cancer, non-Hodgkin’s lymphoma and
melanoma (21, 107-111). While the combination of oblimersen with the microtubule stabilizing
agents, paclitaxel and docetaxel, has had clinical success in small cell lung cancer, non-small cell
lung cancer and hormone refractory prostate cancer (21, 112, 113), oblimersen has not, to my
knowledge, been tested clinically in combination with any microtubule destabilizing agents.
If knocking down the expression of protein by siRNA can be mimicked phenotypically
through the inhibition of the functionality of said protein by small molecules, then pro-survival
inhibitors, specifically BH3 mimetics, could sensitize cells to apoptosis by inhibiting the pro-
survival proteins that are typically overexpressed in chemoresistant cancers as indicated by
oblimersen (21). The BH3 mimetics, ABT-737 and ABT-263, restore the intrinsic apoptosis
pathway in cancer cells overexpressing BCL-2, BCL-xL and BCL-w by binding to the BH3
domain on these pro-survival proteins, allowing the pro-apoptotic proteins BAX and BAK to
dimerize and permeabilize the mitochondrial membrane, leading to intrinsic cell death (Figure
29D).
From the primary and secondary siRNA HTS, I found that, similarly to the combination
of oblimersen with microtubule stabilizing agents, upon the addition of BCL-xL siRNA to T98G
glioblastoma cells, I could sensitize these cells to the microtubule destabilizing agent vinblastine.
Similarly, when I combined a sub-lethal concentration of ABT-263 to vinblastine, I observed a

89
greater than additive toxic effect as indicated by the siRNA HTS. This increase in toxicity was
related to the activation of caspase-3 through a mitochondrial-dependent apoptotic pathway as
identified by cytochrome c localization to the cytoplasm. The addition of ABT-263 reestablished
a pro-apoptotic phenotype in cancer cells by balancing the expression levels of the pro-survival
and pro-apoptotic proteins, thereby resensitizing the cells to a vinblastine through activation of
the intrinsic apoptosis. While ABT-263 was able to resensitize T98G glioblastoma and A549
non-small cell lung cancer cells to vinblastine, the BH3 mimetic did not sensitize HeLa cervical
cells to the microtubule destabilizing agent. When comparing these cancer cells to normal human
astrocytes, I observed both the T98G and A549 cells overexpressed BCL-xL protein, while HeLa
cells expressed the protein at levels equivalent to the normal cell line (Figure 23), indicating a
possible dependency of vinblastine sensitization to the expression levels of BCL-xL protein.
This theory corroborates with current literature where chemotherapy resistant cancer cell lines
that overexpress BCL-2 pro-survival proteins can be resensitized to the anticancer agents upon
addition of a BH3 mimetic (100, 101, 103, 114).
Interestingly, the sensitization of T98G and A549 cancer cell lines to vinblastine by BCL-
xL siRNA and ABT-263 only occurred at concentrations of vinblastine that were semi-toxic to
the cells (1.56 nM and higher), which is consistent with previously published literature (68, 100,
101). In a study by Ackler et al., the combination of ABT-263 with rapamycin in Non-Hodgkin’s
lymphoma, demonstrated similar results where cells treated with ABT-263 required a semi-toxic
concentration of rapamycin to see a synergistic toxicity (100). Since an external stimulus, such
as an anticancer agent, is necessary for the activation of intrinsic apoptosis, I believe the
presence of ABT-263 predisposed the cells to intrinsic apoptosis, but at the concentrations tested
ABT-263 alone did not induce apoptosis.

90
At the highest concentrations of vinblastine, on average, only 50% of the cells were killed
by the anticancer agent, which could be due to three biological phenomena as indicated by the
growth inhibition studies: 1) the doubling time of the cells in the time frame of vinblastine
treatment was sufficient for a cytostatic and not a cytotoxic effect, 2) at the endpoint of the assay
the growth rate of the cells and death rate of vinblastine were equal, or 3) each cell line contains
a sub-population of cells that were resistant to vinblastine. Regardless, the addition of a non-
toxic concentration of ABT-263 to the cells reversed this effect and the combination of
vinblastine and ABT-263 were cytotoxic to cells as indicated by the growth inhibition studies
(Figure 26). This effect, however, was only observed in the T98G and A549 but not the HeLa
cell line, indicating a dependence on the expression levels of BCL-xL in the combination
cytotoxicity. It is possible that these cancer cell lines that overexpress BCL-xL are resistant to
vinblastine due to a desensitization to intrinsic apoptosis caused by expression levels biased
towards pro-survival proteins. Upon the addition of ABT-263 or BCL-xL siRNA, the ratio of
pro-survival to pro-apoptotic proteins is restored and these cells are once again sensitive to
vinblastine. Cancer cell lines that overexpress BCL-2 pro-survival proteins as a mechanism for
chemotherapeutic resistance are believed to have a BCL-2 specific oncogenic addiction where
cancer cells overexpressing pro-survival proteins are more sensitive to BH3 mimetics relative to
cancer cell lines that do not overexpress pro-survival proteins (68, 115, 116), which confirms the
observed sensitization of vinblastine to T98G and A549 but not HeLa cancer cells by ABT-263.
The BH3 mimetics can be toxic to the cells at higher concentrations and have been used
as singular anticancer therapies (21, 100, 101, 114), which I was able to confirm in all three
cancer cell lines tested (Figures 22A, 24A and 25A). At a high enough concentrations of BH3
mimetics, these small molecule inhibitors can saturate the BH3 domains on the pro-survival

91
proteins and disassociate BAK from the BH3 domain, thereby activating intrinsic apoptosis with
no other external stimulus, as demonstrated by the caspase activation of T98G cells by 25 µM
ABT-263 as early as one hour (Figure 27A); however upon addition of an external stimulus like
vinblastine, a greater than 10-fold decrease in the concentration of ABT-263 is sufficient to
activate comparable levels of intrinsic apoptosis (Figure 27B). HeLa cells, however, required the
higher concentrations of ABT-263 to observe any additional apoptosis indicating a synergistic
toxicity between ABT-263 and vinblastine that is specific to cancer cells that overexpress BCL-2
prosurvival proteins.
Due to the previous success of vinblastine as an individual anticancer agent (52, 53, 117)
and ABT-263 as a sensitizer to anticancer therapies (100, 101), I believe the combination of
ABT-263 with vinblastine could serve as an excellent candidate for potential combination
chemotherapy in cancer cells that are dependent upon the overexpression of BCL-2 pro-survival
proteins.

92
Figure 29. Resensitization of cancer cells to vinblastine by BCL-xL siRNA and ABT-263.
(A) Normal human cells have a balance of BCL-2 pro-survival and pro-apoptotic proteins. Upon activation
of intrinsic apoptosis, BH3 only proteins compete with BCL-2 pro-apoptotic for binding to the BCL-2 pro-survival
proteins (BCL-2, BCL-xL and BCL-w). The pro-apoptotic proteins are then free to translocate to the mitochondria
and activate apoptosis. (B) In certain cancer cells, the BCL-2 pro-survival proteins are overexpressed and the
balance of pro-survival to pro-apoptotic proteins is disrupted. Upon activation of intrinsic apoptosis by anticancer
agents, the overexpressed pro-survival proteins are able to bind the BH3 only proteins, while still suppressing the
pro-apoptotic proteins, preventing apoptosis even in the presence of chemotherapy. (C) siRNAs targeting pro-
survival proteins decrease the expression of the pro-survival proteins, thereby reestablishing the balance between
pro-survival and pro-apoptotic proteins and resensitizing cancer cells to chemotherapeutic agents. (D) BH3
mimetics, such as ABT-263, bind to the overexpressed pro-survival proteins and resensitize cells to other anticancer
agents.

93
5.0 CONCLUSIONS
Because of the side effects of existing anticancer agents, there is a high demand for the
identification of chemotherapeutics that can productively cooperate for the treatment of cancer.
One method could be to employ agents that collaborate by acting through different mechanisms
without overlapping side effects (49).
Microtubule perturbing agents are among the most successful cancer chemotherapies to
date (18). To identify novel combination chemotherapies in conjunction with vinblastine, a
siRNA HTS was performed in combination with a sub-lethal dose of vinblastine (80). For the
screen, the druggable genome siRNA library limited the combination studies to gene products
that either already have inhibitors developed against them or are targets for potential drug
discovery. Using a stringent “hit” characterization analysis, I was able to limit the subset of
5,520 gene product to four potential vinblastine sensitizers: AKT3, BCL-xL, NRAS and NOS1.
BCL-xL is a member of the BCL-2 pro-survival proteins, which plays an essential role in
the intrinsic cell death pathway. When the pro-survival proteins, BCL-2 and BCL-xL, are
overexpressed in cancer, the ratio of pro- and anti-apoptotic proteins is disturbed and the intrinsic
cell death pathway can be evaded (21). This is significant as the majority of cancer
chemotherapies, including cytotoxic drugs like vinblastine, induce cell death through the
intrinsic signaling pathway. In some cases, overexpression of the BCL-2 pro-survival proteins
can actually enhance the resistance of the cells to these anticancer therapies (68).

94
Inhibitors that specifically target the pro-survival BCL-2 family members, bind to the
BH-3 domain and competitively inhibit the binding of BAX and BAK, resulting in a
resensitization of cells to intrinsic apoptosis (100, 101). Since T98G cells, which overexpress
BCL-xL, were sensitized to vinblastine by BCL-xL siRNA as identified by the primary screen, I
was interested in determining whether ABT-263 could mimic the siRNA sensitization and serve
as a novel drug-drug combination with vinblastine.
In studying unique BCL-xL siRNAs in combination with increasing concentrations of
vinblastine, I found at concentrations of vinblastine 1.56 nM and higher, the addition of BCL-xL
siRNA sensitized the cells to vinblastine, causing a greater than additive cytotoxic effect. Using
a drug-drug combination, where T98G cells were treated with a non-toxic concentration of ABT-
263 in combination with increasing concentrations of vinblastine, the combination was able to
mimic the siRNA results. At the lower concentrations of the IC50 curve, where vinblastine is
non-toxic to the cells, the cells did not receive a proapoptotic signal and therefore was no
increased sensitization to vinblastine. The increase in sensitization at higher concentrations of
vinblastine, however, appeared to be specific to cancer cells that overexpress BCL-xL relative to
a normal human astrocyte. In A549 cells, which overexpress BCL-xL to equivalent levels of
T98G cells, I was able to reproduce the vinblastine sensitization by ABT-263. In HeLa cells,
which do not overexpress BCL-xL relative to normal human astrocytes, ABT-263 did not
sensitize the cells to vinblastine, consistent with the need to have elevated levels of BCL-xL to
see a productive collaboration with vinblastine. This dependence on the overexpression of BCL-
xL suggests the possibility of an oncogenic addiction to BCL-2 prosurvival proteins in cancers
overexpressing BCL-2 or BCL-xL. By specifically targeting these oncogenic pro-survival
proteins as a mechanism to target cancer cells, the combination of a sub-lethal dose of

95
vinblastine and a BH3 mimetic could serve as a potential combination chemotherapy that could
specifically target cancer cells overexpressing BCL-2 pro-survival proteins.
I examined caspase-3/7 activation and cytochrome c localization to determine whether
the observed cytotoxicity in the GBM was occurring through the mitochondrial-dependent
apoptotic pathway. Upon inhibiting BCL-xL by ABT-263, caspase-3/7 activation was induced
by vinblastine two-fold. Also, in the presence of increasing concentrations of ABT-263, there
was an inverse correlation between drug concentration and cytochrome c localization to the
mitochondria, indicative of cytochrome c release into the cytosol. The combination of a nontoxic
concentration of ABT-263 with a toxic concentration of vinblastine induced a greater than
additive effect of cytochrome c release into the cytosol.
These data confirm that the presence of a nontoxic concentration of ABT-263 sensitizes
the cells to toxic concentrations of vinblastine, which is directly correlative with an increase in
intrinsic apoptosis. Interestingly, in all the cell lines tested, the vinblastine treatment had a sub-
population of cells that survived, even in the presence of toxic concentrations of vinblastine. This
population, however, was sensitized in the presence of ABT-263 in the T98G and A549 cells but
not HeLa cells. Since HeLa cells expressed BCL-xL at levels comparable to the normal human
astrocytes, it is possible that there is a direct correlation between BCL-xL expression and the
effectiveness of this vinblastine/ABT-263 combination therapy.
Due to the stringent criteria used in the data analysis, there is a possibility of false
negatives that were eliminated in the primary siRNA HTS. The vinblastine screen data set has
indefinite possibilities for analysis. The application of a more lenient viability ratio or p-value
could result in a new subset of gene products that sensitize vinblastine to cells, such as BCL-2
and BCL-w, which are pro-survival family members with BCL-xL and are also inhibited by

96
ABT-263. In the primary screen, had I selected p≤0.05 instead of p≤0.01 and determined my
high confidence gene products with a 95% confidence interval instead of a 99% confidence
interval, both BCL-2 and BCL-w would have been included in the data set, indicating all three
family members can sensitize cancer cells to vinblastine (Figure 30). In retrospect, I was able to
identify these genes, BCL-2 and BCL-w, as potential vinblastine sensitizers; however, for the
purpose of this screen, the initial data analysis was set with high stringency to determine a
definite subset of gene products that sensitize cells to vinblastine.
Figure 30. Primary screen results for BCL-2 prosurvival proteins.
By decreasing the stringency of the siRNA primary screen, all three BCL-2 prosurvival proteins would
have been identified as sensitizers to vinblastine. (A) BCL-xL was originally identified as a high confidence
vinblastine sensitizer with a p≤0.01 and a viability ratio in the top 2.5%. While (B) BCL-2 and (C) BCL-w also had
viability ratios in the top 2.5%, they both had p≤0.05 but p>0.01, which eliminated them as high confidence gene
products in from the primary siRNA screen. If the initial Student’s t-test had an α of 0.05 versus 0.01, all three
prosurvival proteins would have been identified as high confidence vinblastine sensitizers from the primary screen.

97
In summary, an unbiased siRNA high-throughput methodology identified a novel
combination treatment for cancer. In addition to BCL-xL, I identified eight other gene products
that function to protect T98G cells from the cytotoxic actions of vinblastine. It is not obvious for
most of the newly discovered sensitizing gene products how they might sensitize cells to
vinblastine. Nonetheless, several of the gene products provide attractive pharmacological targets,
such as BCL-xL, AKT3, and NOS1, and some gene products, such as BCL-xL, highlight known
cellular protective processes. Overall, these studies illustrate the value of unbiased siRNA HTS
for detecting novel chemosensitivity nodes and potential new anticancer drug combinations.

98
APPENDIX A
SMALL INTERFERING RNA SEQUENCES FOR BCL-XL IN SECONDARY
ANALYSIS
Silencer Select siRNAs purchased from Ambion (Austin, TX)
siRNA name
siRNA ID sense antisense
BCL-xL "A" s1920 AUACUUUUGUGGAACUCUATT UAGAGUUCCACAAAAGUAUCC
BCL-xL "B" s1921 GCUGGAGUCAGUUUAGUGATT UCACUAAACUGACUCCAGCTG
BCL-xL "C" s1922 GGAACUCUAUGGGAACAAUTT AUUGUUCCCAUAGAGUUCCAC

99
APPENDIX B
MOLECULAR BIOLOGY OF THE CELL
Dear Carolyn, • Figure 16-6 on page 915: “The structure of a microtubule and its subunit”- Permission to use only parts a, b, c. D belongs to Richard Wade, E to Richard Linck. • Figure 16-11 on page 919: “Dynamic instability due to the structural differences between a growing and a shrinking microtubule end”-Permission to use a, b, and the illustrated portion of c. he photograph in part C belongs to E.M. Mandelkow, E, Mandelkow and R.A. Milliagn, J. Cell. Biol. 114:977-991, 1991©The Rockefeller University Press. • Panel 18-1 on page 1034-35: “The Principal Stages of M Phase (Mitosis and Cytokinesis) in an Animal Cell”- Permission to use the panel minus the photographs as they belong to C. L . Rieder. When using the images you must use the following credit: ©2002 From Molecular Biology of the Cell 4E by Alberts et al. Reproduced by permission of Garland Science/Taylor and Francis. Best, Shauna Blaize Marketing Coordinator Garland Science Taylor & Francis, LLC 270 Madison Ave, 4th FL New York, NY 10016 Phone: (212) 216-7849 Fax: (212) 947-3027 www.garlandscience.com

100
ANNUAL REVIEWS

101
NATURE PUBLISHING GROUP

102

103
BIBLIOGRAPHY
1. (2010) Cancer Facts & Figures 2010. Amercian Cancer Society.
2. Berlin NI. (1975) An overview of research in cancer diagnosis. Mayo Clin Proc, 50:249-254.
3. Holland EC. (2000) Glioblastoma multiforme: The terminator. Proc Natl Acad Sci USA, 97:6242-6244.
4. Eramo A, Ricci-Vitiani L, Zeuner A, Pallini R, Lotti F, Sette G, Pilozzi E, Larocca LM, Peschle C, and DeMaria R. (2006) Chemotherapy resistance of glioblastoma stem cells. Cell Death Diff, 13:1238-1241.
5. Fulda S, Wick W, Weller M, and Debatin K-M. (2002) Smac agonists sensitize for Apo2L/TRAIL- or anticancer drug-induced apoptosis and induce regression of malignant glioma in vivo. Nat Med, 8:808-815.
6. Stupp R, Mason WP, van den Bent MJ, Weller M, Fisher B, Taphoorn MJB, Belanger K, Brandes AA, Marosi C, Bogdahn U, Curschmann J, Janzer RC, Ludwin SK, Gorlia T, Allgeier A, Lacombe D, Cairncross JG, Eisenhauer E, and Mirimanoff RO. (2005) Radiotherapy plus concomitant and adjuvant temozolomide for Glioblastoma. N Engl J Med, 352:987-996.
7. Parney IF and Chang SM. (2003) Current chemotherapy for glioblatoma. Cancer J, 9:149-156.
8. Malhotra V and Perry MC. (2003) Classic chemotherapy: Mechanisms, toxicities and the therapeutic window. Cancer Biol Ther, 2:S2-S4.
9. DeVita VT and Chu E. (2008) A History of Cancer Chemotherapy. Cancer Res, 68:8643-8653.
10. Chabner BA and Roberts TG. (2005) Chemotherapy and the war on cancer. Nat Rev Cancer, 5:65-72.

104
11. Gilman A and Philips FS. (1946) The biological actions and therapeutic applications of the B-chloroethyl amines and sulfides. Science, 103:409-436.
12. Desai A and Mitchison TJ. (1997) Microtubule pulymerization dynamics. Annu Rev Cell Dev Biol, 13:83-117.
13. Jordan A, Hadfield JA, Lawrence NJ, and McGown AT. (1998) Tubulin as a target for anticancer drugs: Agents which interact with the mitotic spindle. Med Res Rev, 18:259-296.
14. Alberts B, Johnson A, Lewis J, Raff M, Roberts K, and Walter P, Molecular Biology of the Cell. 4 ed. 2002, New York: Garland Science.
15. Dumontet C and Jordan MA. (2010) Microtubule-binding agents: a dynamic field of cancer therapeutics. Nat Rev Drug Discov, 9:790-803.
16. Howard J and Hyman AA. (2003) Dynamics and mechanics of the microtubule plus end. Nature, 422:753-758.
17. Borgs L, Beukelaers P, Vandenbosch R, Belachew S, Nguyen L, and Malgrange B. (2009) Cell "circadian" cycle: New role for mammalian core clock genes. Cell Cycle, 15:832-837.
18. Jordan MA and Wilson L. (2004) Microtubules as a target for anticancer drugs. Nat Rev Cancer, 4:253-265.
19. Gonzalvez F and Ashkenazi A. (2010) New insights into apoptosis signaling by Apo2L/TRAIL. Oncogene, 29:4752-4765.
20. Wilson NS, Dixit V, and Ashkenazi A. (2009) Death receptor signal transducers:nodes of coordination in immune signaling networks. Nat Immunol, 10:348-355.
21. Kang MH and Reynolds CP. (2009) Bcl-2 inhibitors: Targeting mitochondrial apoptotic pathways in cancer therapy. Clin Cancer Res, 15:1126-1132.
22. Wang LG, Liu XM, Kreis W, and Budman DR. (1999) The effect of antimicrotubule agents on signal transduction pathways of apoptosis: a review. Cancer Chemother Pharmacol, 44:355-361.
105
23. Attalla H, Westberg J, Andersson L, Adlercreutz H, and Makela T. (1998) 2-Methoxyestradiol-induced phosphorylation of bcl-2: uncoupling from JNK/SAPK activation. Biochem Biophys, 247:616-619.
24. Barboule N, Chadebech P, Baldin V, Vidal S, and Valette A. (1998) Involvement of p21 in mitotic exit after paclitaxel treatment in MCF-7 breast adenocarcinoma cell line. Oncogene, 15:2867-2875.
25. Basu A and Haldar S. (1998) Microtubule-damaging drugs triggered bcl-2 phosphorylation- requirement of phosphorylation on both serine-70 and serine-87 residues of bcl-2 protein. Int J Oncol, 13:659-664.
26. Blagosklonny M, Schulte T, Nguyen P, Trepel J, and Neckers L. (1996) Taxol induction of p21WAF1 and p53 requires c-raf-1. Cancer Res, 55:4623-4626.
27. Blagosklonny M, Schulte T, Nguyen P, Trepel J, and Neckers L. (1996) Taxol-induced apoptosis and phosphorylation of bcl-2 protein involves c-raf-1 and represents a novel c-raf-1 signal transduction pathway. Cancer Res, 56:1851-1854.
28. Haldar S, Jena N, and Croce CM. (1995) Inactivation of Bcl-2 by phosphorylation. Proc Natl Acad Sci USA, 92:4507-4511.
29. Pathan N, Aime-Sempe C, Kitada S, Basu A, Haldar S, and Reed J. (2001) Microtubule-targeting drugs induce bcl-2 phosphorylation and association with Pin1. Neoplasia, 3:
30. Bouillet P and Strasser A. (2002) BH3-only proteins-evolutionarily conserved pro-apoptotic BCL-2 family members essential for initiating programmed cell death. J Cell Sci, 115:1567-1574.
31. Bouillet P, Purton JF, Godfrey DI, Zhang L-C, Coultas L, Puthalakath H, Pellegrini M, Cory S, Adams JM, and Strasser A. (2002) BH3-only Bcl-2 family member Bim is required for apoptosis of autoreactive thymocytes. Nature, 415:922-926.
32. Cheng EHYA, Wei MC, Weiler S, Flavell RA, Mak TW, Lindsten T, and Korsmeyer SJ. (2001) BCL-2, BCL-XL sequester BH3 domain-only molecules preventing BAX- and BAK-mediated mitochondrial apoptosis. Mol Cell, 8:705-711.
33. Upreti M, Galitovskaya EN, Chu R, Tackett AJ, Terrano DT, Granell S, and Chambers TC. (2008) Identification of the major phosphorylation site in BCL-xL induced by

106
microtubule inhibitors and analysis of its functional significance. J Biol Chem, 283:35517-35525.
34. Levine B, Sinha SC, and Kroemer G. (2008) Bcl-2 family members: Dual regulators of apoptosis and autophagy. Autophagy, 3:600-606.
35. Pattingre S, Tassa A, Qu X, Garuti R, Liang XH, Mizushima N, Packer M, Schneider MD, and Levine B. (2005) Bcl-2 Antiapoptotic Proteins Inhibit Beclin 1-Dependent Autophagy. Cell, 122:927-939.
36. Rodriguez OC, Schaefer AW, Mandato CA, Forscher P, Bement WM, and Waterman-Storer CM. (2003) Conserved microtubule-actin interactions in cell movement and morphogenesis. Nat Cell Biol, 5:599-609.
37. Altmann K-H. (2001) Microtubule-stabilizing agents: a growing class of important anticancer drugs. Curr Opin Chem Biol, 5:424-431.
38. Horwitz SB. (1994) Taxol (paclitaxel): mechanism of action. Ann Oncol, 5 Suppl 6:S3-S6.
39. Shahabi S, Yang C-PH, Goldberg GL, and Horwitz SB. (2010) Epothilone B enhances surface EpCAM expression in ovarian cancer Hey cells. Gynecologic Oncology, 119:345-350.
40. Valderrama K, Castellanos L, and Zea S. (2010) Validation and evaluation of an HPLC methodology for the quantification of the potent antimitotic compound (+)-discodermolide in the Caribbean marine sponge Discodermia dissoluta. J Sep Sci, 33:2316-2321.
41. Downing KH. (2000) Structural basis for th interaction of tubulin with proteins and drugs that affect microtubule dynamics. Annu Rev Cell Dev Biol, 16:89-111.
42. Hamel E and Covell DG. (2002) Antimitotic peptides and depsipeptides. Curr Med Chem, 2:19-53.
43. Johnson IS, Armstrong JG, Gorman M, and Burnett JP. (1963) The Vinca Alkaloids: A New Class of Oncolytic Agents. Cancer Res, 23:1390-1427.
107
44. Gigant B, Wang C, Ravelli RBG, Roussi F, Steinmetz MO, Curmi PA, Sobel A, and Knossow M. (2005) Structural basis for the regulation of tubulin by vinblastine. Nature, 435:519-522.
45. Ravelli RBG, Gigant B, Curmi PA, Jourdain I, Lachkar S, Sobel A, and Knossow M. (2004) Insight into tubulin regulation from a complex with colchicine and a stathmin-like domain. Nature, 428:198-202.
46. Kaelin WG. (2005) The concept of synthetic lethality in the context of anticancer therapy. Nat Rev Cancer, 5:689-698.
47. Jackson JR, Patrick DR, Dar MM, and Huang PS. (2007) Targeted anti-mitotic therapies: can we improve on tubulin agents? Nat Rev Cancer, 7:107-117.
48. Terstappen GC, Schlupen C, Raggiaschi R, and Gaviraghi G. (2007) Target deconvolution strategies in drug discovery. Nat Rev Drug Discov, 6:891-903.
49. Kummar S, Chen HX, Wright J, Holbeck S, Millin MD, Tomaszewski J, Zweibel J, Collins J, and Doroshow JH. (2010) Utilizing targeted cancer therapeutic agents in combination: novel approaches and urgent requirements. Nat Rev Drug Discov, 9:843-856.
50. Chou T-C. (1998) Drug combinations: From laboratory to practice. J Lab Clin Med, 131:6-8.
51. Luo J, Solimini NL, and Elledge SJ. (2009) Principles of cancer therapy: Oncogene and non-oncogene addiction. Cell, 136:823-837.
52. Krause DS and Van Etten RA. (2005) Tyrosine kinases as targets for cancer therapy. N Engl J Med, 353:172-187.
53. Schrama D, Reisfeld RA, and Becker JC. (2006) Antibody targeted drugs as cancer therapeutics. Nat Rev Drug Discov, 5:147-159.
54. Rodriguez V, Hart JS, Freireich EJ, Bodey GP, McCredie KB, Whitecar JP, and Coltman CA. (1973) POMP combination chemotherapy of adult acute leukemia. Cancer, 32:69-75.

108
55. Freireich E, Gehan E, Frei E, III, Schroeder L, Wolman I, Anbari R, Burgert E, Mills S, Pinkel D, Selawry O, Moon J, Gendel B, Spurr C, Storrs R, Haurani F, Hoogstraten B, and Lee S. (1963) The effect of 6-mercaptopurine on the duration of steroid0induced remissions in acute leukemia: a model for evaluation of other potentially useful therapy. Blood, 21:
56. Devita VT, Young RC, and Canellos GP. (1975) Combination versus single agent chemotherapy: A review of the basis for selection of drug treatment of cancer. Cancer, 35:98-110.
57. Frei E, III, Karon M, Levin R, Freireich E, Taylor R, Hananian J, Selawry O, Holland J, Hoogstraten B, Wolman I, Abir E, Sawitsky A, Lee S, Mills S, Burgert E, JR., Spurr C, Patterson R, Ebaugh F, James G, III, and Moon J. (1965) The effectiveness of combinations of antileukemic agents in inducing and maintaining remission in children with acute leukemia. Blood, 26:642-656.
58. Mertens AC. (2010) Survival rates and race—clues to curing childhood cancer. Pediatric Blood & Cancer, n/a-n/a.
59. Cheong K, Spicer J, Chowdhury S, and Harper P. (2005) Combination therapy versus single agent chemotherapy in non-small cell lung cancer. Expert Opin Pharmacother, 6:1693-1700.
60. Kuiken HJ and Beijersbergen RL. (2010) Exploration of synthetic lethal interactions as cancer drug targets. Future Oncology, 6:1789-1802.
61. Whitehurst AW, Bodemann BO, Cardenas J, Ferguson D, Girard L, Peyton M, Minna JD, Michnoff C, Hao W, Roth MG, Xie X-J, and White MA. (2007) Synthetic lethal screen identification of chemosensitizer loci in cancer cells. Nature, 446:815-819.
62. Tallarida RJ. (2001) Drug synergism: Its detection and applications. J Pharmacol Exp Ther, 298:865-872.
63. Bernier J, Hall EJ, and Giaccia A. (2004) Radiation oncology: a century of achievements. Nat Rev Cancer, 4:737-747.
64. Agresti JJ, Antipov E, Abate AR, Ahn K, Rowat AC, Baret J-C, Marquez M, Klibanov AM, Griffiths AD, and Weitz DA. (2010) Ultrahigh-throughput screening in drop-based microfluidics for directed evolution. Proc Natl Acad Sci USA,

109
65. Hockenbery DM. (2010) Targeting mitochondria for cancer therapy. Environ Mol Mutagen, 51:476-489.
66. Oltersdorf T, Elmore SW, Shoemaker AR, Armstrong RC, Augeri DJ, Belli BA, Bruncko M, Deckwerth TL, Dinges J, Hajduk PJ, Joseph MK, Kitada S, Korsmeyer SJ, Kunzer AR, Letai A, Li C, Mitten MJ, Nettesheim DG, Ng S, Nimmer PM, O'Connor JM, Oleksijew A, Petros AM, Reed JC, Shen W, Tahir SK, Thompson CB, Tomaselli KJ, Wang B, Wendt MD, Zhang H, Fesik SW, and Rosenberg SH. (2005) An inhibitor of Bcl-2 family proteins induces regression of solid tumours. Nature, 435:677-681.
67. High LM, Szymanska B, Wilczynska-Kalak U, Barber N, O'Brien R, Khaw SL, Vikstrom IB, Roberts AW, and Lock RB. (2010) The Bcl-2 homology domain 3 mimetic ABT-737 targets the apoptotic machinery in acute lymphoblastic leukemia resulting in synergistic in vitro and in vivo Interactions with established drugs. Mol Pharm, 77:483-494.
68. Tse C, Shoemaker AR, Adickes J, Anderson MG, Chen J, Jin S, Johnson EF, Marsh KC, Mitten MJ, Nimmer P, Roberts L, Tahir SK, Xiao Y, Yang X, Zhang H, Fesik S, Rosenberg SH, and Elmore SW. (2008) ABT-263: A Potent and Orally Bioavailable Bcl-2 Family Inhibitor. Cancer Res, 68:3421-3428.
69. Petros AM, Huth JR, Oost T, Park C-M, Ding H, Wang X, Zhang H, Nimmer P, Mendoza R, Sun C, Mack J, Walter K, Dorwin S, Gramling E, Ladror U, Rosenberg SH, Elmore SW, Fesik SW, and Hajduk PJ. (2010) Discovery of a potent and selective Bcl-2 inhibitor using SAR by NMR. Bioorganic & Medicinal Chemistry Letters, 20:6587-6591.
70. (2001) Initial sequencing and analysis of the human genome. Nature, 409:860-921.
71. Hopkins AL and Groom CR. (2002) The druggable genome. Nat Rev Drug Discov, 1:727-730.
72. Russ AP and Lampel S. (2005) The druggable genome: an update. Drug Discov Today, 10:1607-1610.
73. Jinek M and Doudna JA. (2009) A three-dimensional view of the molecular machinery of RNA interference. Nature, 457:405-412.
74. Iorns E, Lord CJ, Turner N, and Ashworth A. (2007) Utilizing RNA interference to enhance cancer drug discovery. Nat Rev Drug Discov, 6:556-568.

110
75. Nowell P. (1976) The clonal evolution of tumor cell populations. Science, 194:23-28.
76. Weinstein IB. (2002) Addiction to Oncogenes--the Achilles Heal of Cancer. Science, 297:63-64.
77. Capdeville R, Buchdunger E, Zimmermann J, and Matter A. (2002) Glivec (STI571, imatinib), a rationally developed, targeted anticancer drug. Nat Rev Drug Discov, 1:493-502.
78. Hanahan D and Weinberg R. (2000) The hallmarks of cancer. Cell, 100:57-70.
79. Collins CS, Hong J, Sapinoso L, Zhou Y, Liu Z, Micklash K, Schultz PG, and Hampton GM. (2006) A small interfering RNA screen for modulators of tumor cell motility identifies MAP4K4 as a promigratory kinase. Proc Natl Acad Sci USA, 103:3775-3780.
80. McDonald PR, Identification of novel potential cancer therapies by synthetic lethal screening, in Molecular Pharmacology. 2008, University of Pittsburgh: Pittsburgh, PA.
81. Shiva S, Brookes PS, Patel RP, Anderson PG, and Darley-Usmar VM. (2001) Nitric oxide partitioning into mitochondrial membranes and the control of respiration at cytochrome c oxidase. Proc Natl Acad Sci USA, 98:7212-7217.
82. Malo N, Hanley JA, Cerquozzi S, Pelletier J, and Nadon R. (2006) Statistical practice in high-throughput screening data analysis. Nat Biotech, 24:167-175.
83. Birmingham A, Selfors LM, Forster T, Wrobel D, Kennedy CJ, Shanks E, Santoyo-Lopez J, Dunican DJ, Long A, Kelleher D, Smith Q, Beijersbergen RL, Ghazal P, and Shamu CE. (2009) Statistical methods for analysis of high-throughput RNA interference screens. Nat Methods, 6:569-575.
84. An W and Tolliday N. (2010) Cell-based assays for high-throughput screening. Mol Biotechnol, 45:180-186.
85. Thaker N, Zhang F, McDonald PR, Shun TY, Lewen MD, Pollack IF, and Lazo JS. Identification of Survival Genes in Human Glioblastoma Cells Using siRNA Screening. Molecular Pharmacology,

111
86. Sabade SS and Walker DM, Evaluation of effectiveness of Median of Absolute Deviations outlier rejection-based IDDQ testing for burn-in reduction, in Proc 20th IEEE VLSI Test Symp. 2002, IEEE Computer Society. p. 81-86.
87. Chung N, Zhang XD, Kreamer A, Locco L, Kuan P-F, Bartz S, Linsley PS, Ferrer M, and Strulovici B. (2008) Median Absolute Deviation to improve hit selection for genome-scale RNAi screens. J Biomol Screen, 13:149-158.
88. Kitchens LJ, Basic Statistics and Data Analysis. 2003, Pacific Grove, CA: Thomson Brooks/Cole.
89. Devlin B, Roeder K, and Wasserman L. (2003) Statistical genetics: False discovery or missed discovery? Heredity, 91:537-538.
90. Benjamini Y and Hochberg Y. (1995) Controlling the false discovery rate: A practical and powerful approach to multiple testing. J R Statist Soc, 57:289-300.
91. Benjamini Y and Hochberg Y. (2000) On the adaptive control of the false discovery rate in multiple testing with independent statistics. J Educ Behav Statist, 25:60-83.
92. Benjamini Y and Yekutieli D. (2001) The control of the false discovery rate in multiple testing under dependency. Ann Statist, 29:1165-1188.
93. Shaffer JP. (1995) Multiple hypothesis testing. Ann Rev Psychol, 46:561-584.
94. Jackson AL and Linsley PS. (2004) Noise amidst the silence: off-target effects of siRNAs? Trends Genet, 20:521-524.
95. Willingham AT, Deveraux QL, Hampton GM, and Aza-Blanc P. (2004) RNAi and HTS: Exploring cancer by systematic loss-of-function. Oncogene, 23:8392-8400.
96. Sachse C and Echeverri CJ. (2004) Oncology studies using siRNA libraries: the dawn of RNAi-based genomics. Oncogene, 23:8384-8391.
97. Sasi N, Hwang M, Jaboin J, Csiki I, and Lu B. (2009) Regulated cell death pathways: New twists in modulation of BCL2 family function. Mol Cancer Ther, 8:1421-1429.

112
98. Bensch KG and Malawista SE. (1968) Microtubule crystals: A new biophysical phenomenon induced by vinca alkaloids. Nature, 218:1176-1177.
99. Rao S, Orr GA, Chaudhary AG, Kingston DGI, and Horwitz SB. (1995) Characterization of the taxol binding site on the microtubule. J Biol Chem, 270:20235-20238.
100. Ackler S, Xiao Y, Mitten MJ, Foster K, Oleksijew A, Refici M, Schlessinger S, Wang B, Chemburkar SR, Bauch J, Tse C, Frost DJ, Fesik SW, Rosenberg SH, Elmore SW, and Shoemaker AR. (2008) ABT-263 and rapamycin act cooperatively to kill lymphoma cells in vitro and in vivo. Mol Cancer Ther, 7:3265-3274.
101. Ackler S, Mitten M, Foster K, Oleksijew A, Refici M, Tahir S, Xiao Y, Tse C, Frost D, Fesik S, Rosenberg S, Elmore S, and Shoemaker A. (2010) The Bcl-2 inhibitor ABT-263 enhances the response of multiple chemotherapeutic regimens in hematologic tumors in vivo. Cancer Chemother Pharmacol, 66:869-880.
102. Trask DK, Wolf GT, Bradford CR, Fisher SG, Devaney K, Johnson M, Singleton T, and Wicha M. (2002) Expression of Bcl-2 Family Proteins in Advanced Laryngeal Squamous Cell Carcinoma: Correlation With Response to Chemotherapy and Organ Preservation. The Laryngoscope, 112:638-644.
103. Li R, Zang Y, Li C, Patel NS, Grandis JR, and Johnson DE. (2009) ABT-737 synergizes with chemotherapy to kill head and neck squamous cell carcinoma cells via a Noxa-mediated pathway. Mol Pharmacol, 75:1231-1239.
104. Gazitt Y, Rothenberg M, Hilsenbeck S, Fey V, Thomas C, and Montegomrey W. (1998) Bcl-2 overexpression is associated with resistance to paclitaxel, but not gemcitabine, in multiple myeloma cells. Int J Oncol, 13:839-848.
105. Liu R, Page C, Beidler DR, Wicha MS, and Nunez G. (1999) Overexpression of BCL-xL promotes chemotherapy resistance of mammary tumors in a syngeneic mouse model. Am J Pathol, 155:1861-1867.
106. Castilla C, Congregado B, Chinchon D, Torrubia FJ, Japon MA, and Saez C. (2006) BCL-xL is overexpressed in hormone-resistant prostate cancer and promotes survival of LNCaP cells via interaction with proapoptotic BAK. Endocrinology, 147:4960-4967.
107. Bedikian A, Millward M, and H P. (2006) Bcl-2 antisense (oblimersen sodium) plus dacarbazine in patients with advanced melanoma: the Oblimersen Melanoma Study Group. J Clin Oncol, 24:4738-4745.

113
108. Marcucci G, Moser B, and Blum W. (2007) A phase III randomized trial of intensive induction and consolidation chemotherapy {+/-} oblimersen, a pro-apoptotic Bcl-2 antisense oligonucleotide in untreated actue myeloid leukemia patients > 60 years old. J Clin Oncol, 25:7012.
109. O'Brien S, Cunningham C, Golenkov A, Turkina A, Novick S, and Rai K. (2005) Phase I and II multicenter study of oblimersen sodium, a Bcl-2 antisense oligonucleotide, in patients with advanced chronic lymphocytic leukemia. J Clin Oncol, 23:7697-7702.
110. O'Brien S, Moore J, and Boyd T. (2007) Randomized phase III trial of fludarabine plus cyclophosphamide with or without oblimersen sodium (Bcl-2 antisense) in patients with relapsed or refractory chronic lymphocytic leukemia. J Clin Oncol, 25:1114-1120.
111. Rudin C, Salgia R, and Wang X. (2008) Randomized phase II studey of carboplatin and etoposide with or without the bcl-2 antisense oligonucleotide oblimersen for extensive-stage small-cell lung cancer. J Clin Oncol, 26:870-876.
112. Tolcher A, Chi K, and Kuhn J. (2005) A phase II, pharmacokinetic, and biological correlative study of oblimersen sodium and docetaxel in patients with hormone-refractory prostate cancer. Clin Cancer Res, 11:3854-3861.
113. Liu G, Kolesar J, McNeel DG, Leith C, Schell K, Eickhoff J, Lee F, Traynor A, Marnocha R, Alberti D, Zwiebel J, and Wilding G. (2008) A phase I pharmacokinetic and pharmacodynamic correlative study of the antisense BCL-2 oligonucleotide G3139, in combination with carboplatin and paclitaxel, in patients with advanced solid tumors. Clin Cancer Res, 14:2732-2739.
114. Zall H, Weber A, Besch R, Zantl N, and Hacker G. (2010) Chemotherapeutic drugs sensitize human renal cell carcinoma cells to ABT-737 by a mechanism involving the Noxa-dependent inactivation of Mcl-1 or A1. Mol Cancer, 9:164.
115. Sharma SV, Gajowniczek P, Way IP, Lee DY, Jiang J, Yuza Y, Classon M, Haber DA, and Settleman J. (2006) A common signaling cascade may underlie "addiction" to the Src, BCR-ABL, and EGF receptor oncogenes. Cancer Cell, 10:425-435.
116. Hübner A, Jaeschke A, and Davis RJ. (2006) Oncogene Addiction: Role of Signal Attenuation. Developmental cell, 11:752-754.
117. Giannakakou P, Sackett D, and Fojo T. (2000) Tubulin/Microtubules: Still a promising target for new chemotherapeutic agents. J Nat Cancer Inst, 92:182-183.

![Carbon Dots for Efficient Small Interfering RNA DeliveryBreakthrough Technologies Carbon Dots for Efficient Small Interfering RNA Delivery and Gene Silencing in Plants[OPEN] Steven](https://img.dokumen.tips/doc/110x75/6097ea46a6cadd37c2441661/carbon-dots-for-eficient-small-interfering-rna-breakthrough-technologies-carbon.jpg)