Embed Size (px)
Citation preview

EXPERT CLASSIFICATION TECHNIQUE FOR MAPPING TEAK PLANTATION AREAS IN THAILAND
Siripun Taweesuk
Prasong Thammapala Faculty of Science and Technology
Thammasat University, Rangsit Campus 99 Moo 18, Paholyotin Rd., Pathumtani, 12120, Thailand
ABSTRACT Thailand is one of the ten countries with the largest plantation development programs, which occupying three percent of the total global plantation area. Teak specie (Tectona grandis) makes up more than half of all the forest plantation areas (FAO, 2003). Thus, deriving the accurate and up-to-date teak plantation areas are necessary steps in forest plantation management as these data are significant to the decision-making processes. In this paper, we focus on the use of remote sensing analysis techniques with the Landsat data in order to discriminate teak plantation areas. Our main objective is to explore whether the expert classification technique can improve the accuracy of teak plantation classification when compare to the typical classification technique, such as supervised classification. In our experiment, expert and supervised classification techniques are applied to the Landsat data sets, which cover area of Muang district, Petchabun province Thailand. The training and reference data were acquired from the field survey that took place roughly at the same time as the acquisition of the satellite data in 2003. The overall accuracy, kappa statistics, producer’s and user’s accuracy were computed from the error matrices in order to evaluate and compare the accuracy of the classification. The analysis of pairwise and Z-test were also employed for statistical interpretation. Our results indicated that using an expert classification technique yielded a significantly higher discrimination accuracy of teak plantation. However, the complication of an analytical procedure, the processing time and cost of analysis may overcome the benefits. The knowledge and experience of the data analysts, as well as other factors should be taken into consideration when selecting an appropriate classification technique.
INTRODUCTION
Maps that accurately discriminate teak plantation areas from other land cover types are highly desirable for efficient and sustainable management of forest plantation in Thailand. Especially, in the areas that are dominated by monoculture of teak plantations. In recent literatures, the potential of various classification techniques based on remote sensing for teak plantation mapping are rarely explored. The remotely sensed data, however, are extensively applied in other types of land cover classification. In a digital image classification process, there is a limitation in deriving land cover information from the inter-band correlation of multispectral images as the spectral signatures are often similar, particularly in broad-leaves deciduous species (Jensen, 2000; Lillesand and Kiefer, 2000; Schowengerdt, 1997; Schriever & Congalton, 1995). Supervised classification technique with the traditional maximum likelihood decision rule was thus a primary algorithm that has been widely applied in deriving such information from the Landsat data. As the method is based on statistical models, non-unique spectral signatures can degrade the accuracy of the classifier. Many studies have attempted to incorporate ancillary data, such as digital elevation model (DEM), slope, principal components analysis (PCA) and other geographic variables in order to improve the accuracy of the image classification (Eiumnoh and Shrestha, 2000; Palacio-Prieto and Luna-González, 1996).
An expert classification system as define by Leica Geosystems (2003) is “a hierarchy of rules, or a decision tree that describes the conditions under which a set of low level constituent information (user-defined variables, raster imagery, vector coverages, spatial models, external program and simple scalars) gets abstracted into a set of high level information classes”. Many research papers have revealed the potential of expert system (knowledge-based system) incorporated with the GIS data in order to improve the accuracy of image classification. Gao, et al. (2004) applied the spatial knowledge in GIS to the classification process of SPOT data, and concluded that it considerably
Pecora 16 “Global Priorities in Land Remote Sensing” October 23 – 27, 2005 * Sioux Falls, South Dakota

improved the accuracy of mapping mangrove forest in New Zealand. Another expert system for image classification was implemented by combining airborne hyperspectral imagery with terrain data. This system also increased the accuracy of coastal vegetation map in salt marshes in the Netherlands (Schmidt, et al., 2004). Huang and Jensen (1997) built the knowledge bases by using a machine learning approach for an integration of image analysis expert system, SPOT multispectral imagery, and GIS data to classify wetland areas in South Carolina, USA. The result yielded the highest accuracy and was significantly different from the traditional unsupervised and supervised classification.
This research aims at developing digital image classification technique for discrimination of forest plantation in tropical landscape, specifically for teak plantation areas in Thailand. Our work investigated the available integration of multi-sources, spectral and non-spectral data applying in expert classification technique. The results are then compared with the traditional supervised classification technique.
METHODS
Study Area
In 1994, the government subsidies, provided to the private land owner practicing forest plantation, has declared teak as the significantly precious specie. Our research thus emphasized the classification of teak plantation areas in Thailand. The study area covers about 2,200 sq. km. in parts of Pasak watershed, administratively in Muang District, Petchabun Province, in the northern part (Figure 1). The terrain elevation of the area ranges from 100 to 1,340 meters. The western and the eastern parts are mostly mountainous with slopes higher than 35 percent, and covered by primary and secondary of mixed deciduous and dry dipterocarp forests. Most of the areas in the central part lies from north to south are under agricultural practices with the major crops being paddy, sugarcane, maize, orchards (mostly are tamarind) and other plantation crops. Forest plantation, especially teak plantation areas are distributed over Petchabun province. Sixty percent of teak plantation areas were at seven to ten years old with an average diameter at breast height (DBH) of more than 9.0 centimeters and the total height between 7.0 - 14.0 meters (Thammapala and Taweesuk, 2004).
Figure 1 The study area in Muang District, Petchabun Province, Thailand
NN
TThhaaiillaanndd
LLaannddssaatt 77 EETTMM++ BBaanndd
554433 Image Acquisition and Preprocessing
The subset of two Landsat scenes (band 1, 2, 3, 4, 5 and 7) covered path 129 and row 49 with cloud cover less than five percent were obtained for this experiment. The two scenes (Landsat 7 ETM+ and Landsat 5 TM) were acquired on January 11 (dry season) and November 19, 2003 (wet season) respectively. Then, the Landsat 7 image was geometrically corrected to the UTM Zone 47 coordinate system using forty ground control points (GCPs), obtained from the field survey using the GPS device. The Landsat 5 image was also registered to the Landsat 7 image
Pecora 16 “Global Priorities in Land Remote Sensing” October 23 – 27, 2005 * Sioux Falls, South Dakota
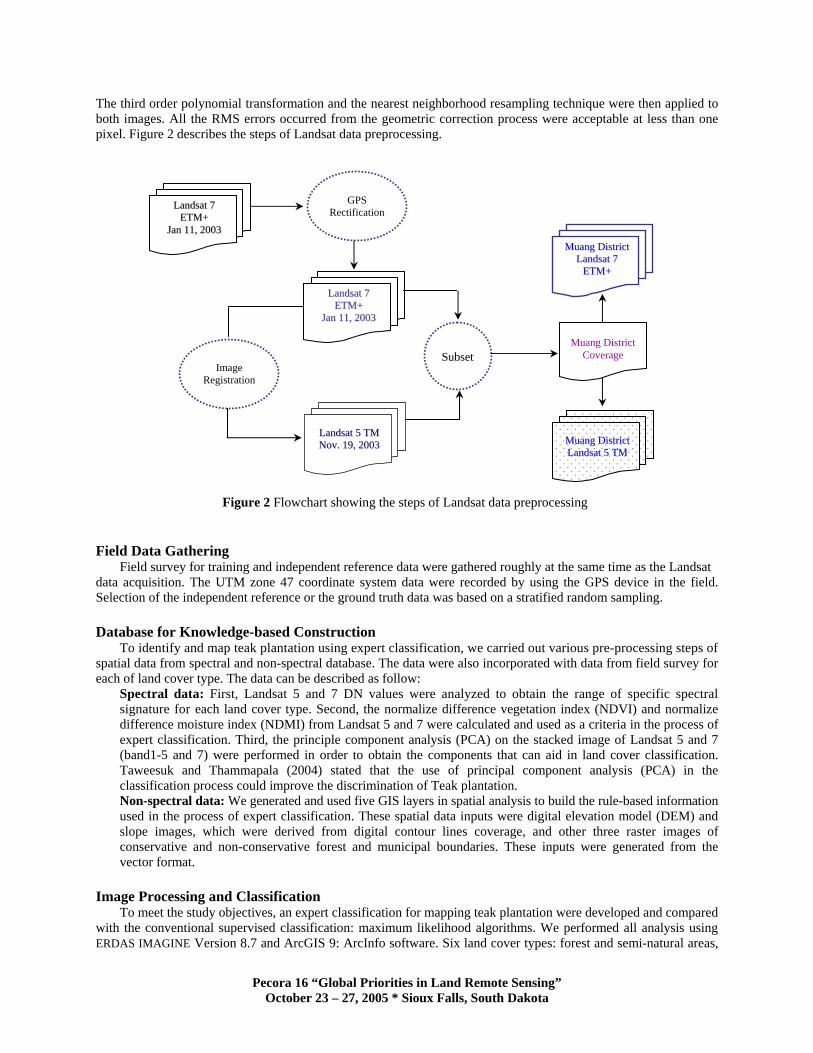
The third order polynomial transformation and the nearest neighborhood resampling technique were then applied to both images. All the RMS errors occurred from the geometric correction process were acceptable at less than one pixel. Figure 2 describes the steps of Landsat data preprocessing.
Figure 2 Flowchart showing the steps of Landsat data preprocessing
LLaannddssaatt 77 EETTMM++
JJaann 1111,, 22000033
GPS Rectification
MMuuaanngg DDiissttrriicctt LLaannddssaatt 77
EETTMM++
MMuuaanngg DDiissttrriicctt LLaannddssaatt 55 TTMM
Muang District Coverage
LLaannddssaatt 77 EETTMM++
JJaann 1111,, 22000033
LLaannddssaatt 55 TTMM NNoovv.. 1199,, 22000033
Image Registration
Subset
Field Data Gathering
Field survey for training and independent reference data were gathered roughly at the same time as the Landsat data acquisition. The UTM zone 47 coordinate system data were recorded by using the GPS device in the field. Selection of the independent reference or the ground truth data was based on a stratified random sampling. Database for Knowledge-based Construction
To identify and map teak plantation using expert classification, we carried out various pre-processing steps of spatial data from spectral and non-spectral database. The data were also incorporated with data from field survey for each of land cover type. The data can be described as follow:
Spectral data: First, Landsat 5 and 7 DN values were analyzed to obtain the range of specific spectral signature for each land cover type. Second, the normalize difference vegetation index (NDVI) and normalize difference moisture index (NDMI) from Landsat 5 and 7 were calculated and used as a criteria in the process of expert classification. Third, the principle component analysis (PCA) on the stacked image of Landsat 5 and 7 (band1-5 and 7) were performed in order to obtain the components that can aid in land cover classification. Taweesuk and Thammapala (2004) stated that the use of principal component analysis (PCA) in the classification process could improve the discrimination of Teak plantation. Non-spectral data: We generated and used five GIS layers in spatial analysis to build the rule-based information used in the process of expert classification. These spatial data inputs were digital elevation model (DEM) and slope images, which were derived from digital contour lines coverage, and other three raster images of conservative and non-conservative forest and municipal boundaries. These inputs were generated from the vector format.
Image Processing and Classification
To meet the study objectives, an expert classification for mapping teak plantation were developed and compared with the conventional supervised classification: maximum likelihood algorithms. We performed all analysis using ERDAS IMAGINE Version 8.7 and ArcGIS 9: ArcInfo software. Six land cover types: forest and semi-natural areas,
Pecora 16 “Global Priorities in Land Remote Sensing” October 23 – 27, 2005 * Sioux Falls, South Dakota

teak plantation, agricultural areas, urban and built-up areas, orchards and water bodies were classified. The details of each class are described in Table 1. The steps of applying both image classification techniques are shown in Figure 3.
Table 1 Land cover class name definition using in Landsat data classification schemes
Class Class Name Description
1 Forest and Semi-natural Areas
Vegetation formation composed predominantly of evergreen and deciduous tress including shrubs, bush under-stories, forest areas in conservative forest and secondary forest in other areas
2 Teak Plantation Areas covered with monoculture of Teak plantation with the average DBH > 9.0 cm.
3 Agricultural Areas Paddy, field crops (maize, sugarcane, tobacco, etc.), and bare land (exposed soil surface covered with shrubs or trees < 10 percent)
4 Urban and Built-up Areas
A combination of buildings, urban material and vegetation mixed with urban / built-up areas, residential and other man-made structures such as industrial, commercial and services, and other utilities
5 Orchards Monoculture of plantation crops such as: tamarinds, mangoes and others
6 Water Bodies Natural or artificial open water surfaces such as: lakes, reservoirs, and etc.
Supervised Classification A one-pixel-to-one class method or the supervised classification with maximum
likelihood classifier, was conducted to classify the Landsat 7 image using the spectral signatures from the training areas. At least five training areas from field survey were selected for each land cover class in order to generate the spectral signatures using in the process.
Expert Classification The expert system for mapping teak plantation was developed using the IMAGINE Expert ClassifierTM. We applied the expert knowledge gained from the spatial analysis of spectral and non-spectral data in the study area. The DNs values from each band and the values of NDVI and NDMI were generated from image transformation. These values were our spectral data. The PCA1 and PCA3 were also used as our data inputs. Moreover, we incorporated the geographical background knowledge of unique class, such as the teak plantation class, based on terrain elevation and slope that was derived from DEM. Figure 4 shows the rules and data inputs used in the expert classification process.
Post-classification The classified images were smoothen twice with a 3 x 3- majority rule filter in order to eliminate salt-and-pepper from the classification process (post classification filtering).
Accuracy Assessment
An accuracy assessment determines the quality and the reliability of information extracted from the satellite imagery. The classification accuracy on two classified images from both supervised with maximum likelihood and expert classification techniques were evaluated against 350 independent reference data acquired from the field survey with the stratified random sampling. A minimum of fifty reference samples for each land cover categories were applied in the error matrix (Congalton and Green, 1999). An overall accuracy, a producer’s accuracy and a user’s accuracy from an error matrix together with the kappa statistic were then calculated. Statistical Analysis
In order to compare the two classification techniques, the analysis of pairwise significant and Z-test were analyzed at the ninety five percent confidence level. The analysis may show the possibility of one technique producing statistically higher accuracy for teak plantation mapping than the other.
Pecora 16 “Global Priorities in Land Remote Sensing” October 23 – 27, 2005 * Sioux Falls, South Dakota
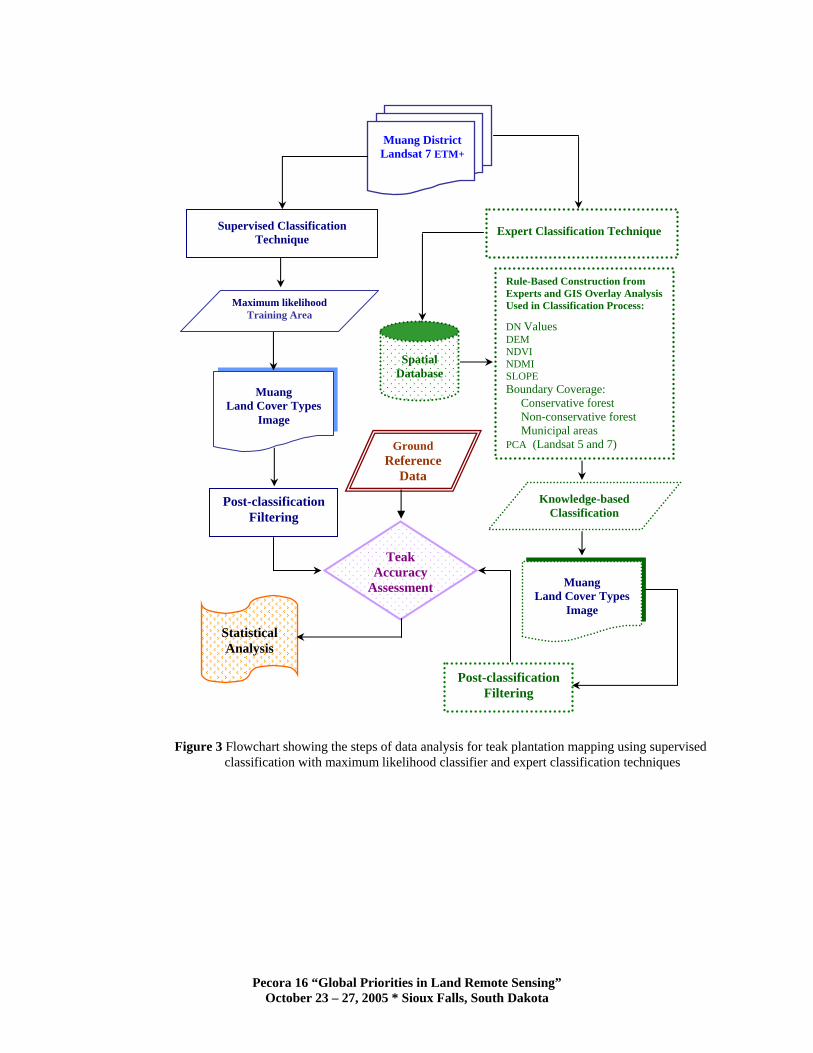
Figure 3 Flowchart showing the steps of data analysis for teak plantation mapping using supervised classification with maximum likelihood classifier and expert classification techniques
Muang District Landsat 7 ETM+
Supervised Classification Technique
Spatial Database
Rule-Based Construction from Experts and GIS Overlay Analysis Used in Classification Process: DN Values DEM NDVI NDMI SLOPE Boundary Coverage: Conservative forest Non-conservative forest Municipal areas PCA (Landsat 5 and 7)
Muang Land Cover Types
Image
Tea
Pecora 16 “Global Priorities in Land Remote Sensing” October 23 – 27, 2005 * Sioux Falls, South Dakota
k Accur cy
Assessmenta
Gr und Reference
Data
o
Post-classification Filtering
Statistical Analysis
Maximum likelihood Training Area
Knowledge-based Classification
Post-classification Filtering
Expert Classification Technique
Muang Land Cover Types
Image

Conservative Forest
Pecora 16 “Global Priorities in Land Remote Sensing” October 23 – 27, 2005 * Sioux Falls, South Dakota
based construction in expert classification Figure 4 Diagram shows the knowledge
Water Bodies Rule B se: VIa LS7_DN_Band 2, 3, 4, 5& 7
Urban and Built-up Areas Rule Base: IV
Municipal Boundary
LS7_DN_Band 1, 2, 3, 5, 7
LS5_NDVI
LS7_NDMI
PCA 1 & PCA 3
LS5_DN Band 3
LS7_DN_ Band 1, 3 & 5
Agricultural Areas Rule Base: III
Teak Plantation Rule Base: II
DEM
SLOPE
PCA 1 & PCA 3
LS7_NDVI & LS5_NDMI
LS7_DN Band 2, 3, 4 & 5
Forest and Semi-natural Areas Rule Base: I
LS7_NDVI
LS5_NDMI
Non-Conservative Forest
Orchards PCA 1
Rule B se: V aLS7_DN_Band 1 & 3
RESULTS AND DISCUSSION The results from our study demonstrated that the expert classification technique produced an overall accuracy of
81.1 percent with the kappa value of 0.7717, which was higher than 70.6 percent with the kappa of 0.6395 using the maximum likelihood classifier. The 84.8 percent of teak plantation pixels were correctly classified using expert classifier. This number was also higher than that of the traditional supervised classifier (64.4 percent). Furthermore, the expert classification error matrix revealed higher producer’s accuracy from “forest and semi-natural areas”, “agricultural areas” and “urban and built-up areas” classes with the values of 79.7, 87.7 and 78.8 percent, respectively.

The supervised classification error matrix, on the other hand, showed the valued of 65.6, 78.1 and 51.9 percent of accuracy. Tables 2 and 3 show in details the accuracy of teak plantation and other land cover types classification for both techniques.
Table 2 The classification error matrix shows the accuracy of teak plantation and other land cover types using supervised classification: maximum likelihood algorithm
Reference Data Supervised
Classification FS TP AG UB O W Total User’s
Accuracy (%)
FS 42 11 6 0 3 1 63 66.7
TP 6 38 1 0 0 0 45 84.4
AG 10 5 57 24 16 0 112 50.9
UB 0 0 1 27 0 0 28 96.4
O 5 5 8 1 33 0 52 63.5
W 1 0 0 0 0 49 50 98.0
Total 64 59 73 52 52 50 246
Producer’s Accuracy (%) 65.6 64.4 78.1 51.9 63.5 98.0 Overall Accuracy = 70.3 %
Overall Kappa = 0.6395
Note: FS = Forest & Semi-natural Areas TP = Teak Plantation AG = Agricultural Areas UB = Urban & Built-up Areas O = Orchards W = Water Bodies
Table 3 The classification error matrix shows the accuracy of teak plantation and other land cover types using expert classification
Reference Data Expert
Classification FS TP AG UB O W Total User’s
Accuracy (%)
FS 51 0 2 0 7 3 63 80.9
TP 2 50 4 0 4 0 60 83.3
AG 5 6 64 11 9 1 96 66.7
UB 0 1 1 41 0 0 43 95.4
O 5 2 2 0 32 0 41 78.1
W 1 0 0 0 0 46 47 97.9
Total 64 59 73 52 52 50 284
Producer’s Accuracy (%) 79.7 84.8 87.7 78.9 61.5 92.0 Overall Accuracy = 81.1 %
Overall Kappa = 0.7717
Note: FS = Forest & Semi-natural Areas TP = Teak Plantation AG = Agricultural Areas UB = Urban & Built-up Areas O = Orchards W = Water Bodies
The confusion of class discrimination between teak plantation and forest including semi-natural areas using the maximum likelihood classifier obviously caused the lower accuracy in teak plantation discrimination. Performing such classification technique could not effectively discriminate the teak plantation, due to the similarities of their spectral signatures. Similarly, these also occurred to the discrimination between agricultural, orchards and teak plantation classes. It is cleared that using only the spectral information and one statistical model-derived teak plantation class could not yield an acceptable accuracy. To reduce the misclassification, the decision trees and knowledge based construction from spatial analysis can be applied. In our experiment, the rule-based expert classifier revealed a significant improvement of teak plantation classification (from 64.4 to 84.8 percent).
It is noticeable that the incorporation of GIS and spectral data play significant roles to the accuracy improvement. For example, the DEM value, the slope and the boundary of conservative forest areas were applied to separate the known boundary of natural forest, which did not have teak plantation areas in the image. The process aids in
Pecora 16 “Global Priorities in Land Remote Sensing” October 23 – 27, 2005 * Sioux Falls, South Dakota
reducing the misclassification caused the spectral similarity of teak plantation and the natural forest classes. An example of the rules that was applied in the expert classifier is shown below: Rule: If a pixel value is equal to conservative forest, then class = forest and semi-natural areas If a pixel value is not equal to conservative forest, then other combination of rules will be further rapplied.
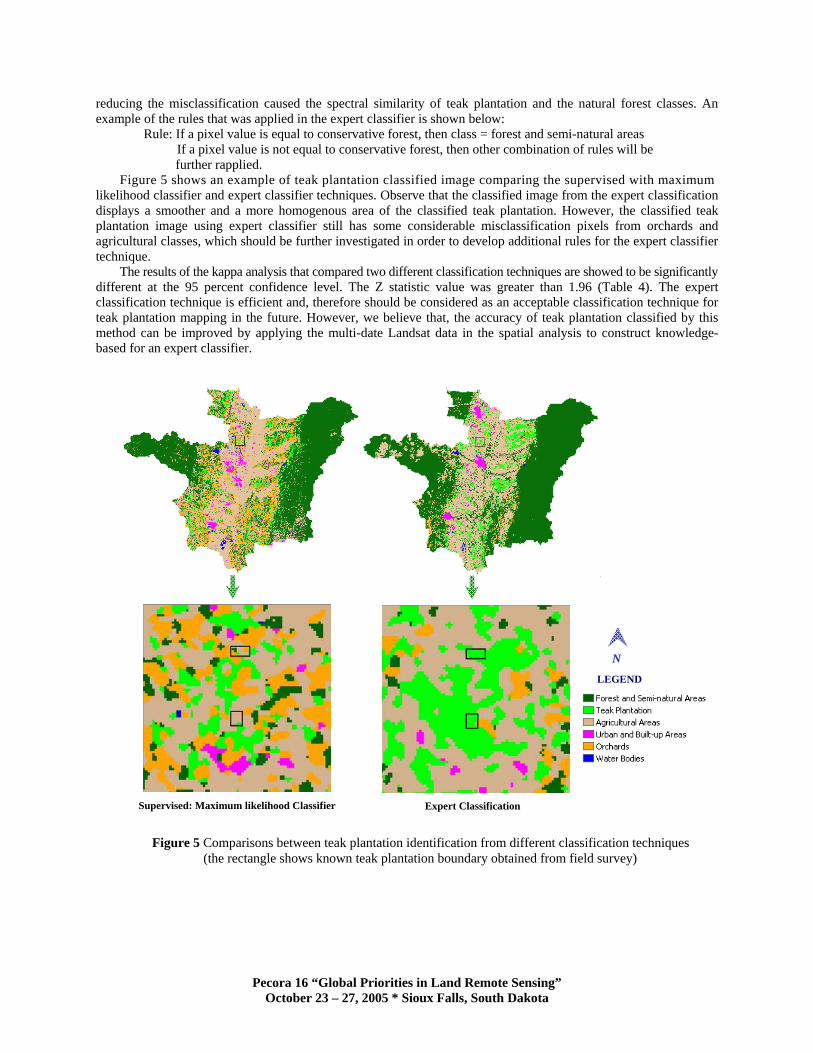
Figure 5 shows an example of teak plantation classified image comparing the supervised with maximum likelihood classifier and expert classifier techniques. Observe that the classified image from the expert classification displays a smoother and a more homogenous area of the classified teak plantation. However, the classified teak plantation image using expert classifier still has some considerable misclassification pixels from orchards and agricultural classes, which should be further investigated in order to develop additional rules for the expert classifier technique.
The results of the kappa analysis that compared two different classification techniques are showed to be significantly different at the 95 percent confidence level. The Z statistic value was greater than 1.96 (Table 4). The expert classification technique is efficient and, therefore should be considered as an acceptable classification technique for teak plantation mapping in the future. However, we believe that, the accuracy of teak plantation classified by this method can be improved by applying the multi-date Landsat data in the spatial analysis to construct knowledge- based for an expert classifier.
Figure 5 Comparisons between teak plantation identification from different classification techniques (the rectangle shows known teak plantation boundary obtained from field survey)
LEGEND
NN
Supervised: Maximum likelihood Classifier Expert Classification
Pecora 16 “Global Priorities in Land Remote Sensing” October 23 – 27, 2005 * Sioux Falls, South Dakota

Table 4 Pairwise comparisons between supervised: maximum likelihood classifier
and expert classification techniques for teak plantation mapping
Note: * Z Statistic > 1.96: The two classification techniques are significantly different.
Pairwise Comparison Z Statistic
Supervised: Maximum likelihood vs. Expert Classification 3.3342*
CONCLUSION
Our results indicated that using the expert classification technique with the incorporation of spectral data from Landsat TM and ETM+, and non-spectral data form GIS database, yielded satisfactory teak plantation classification accuracy of 84.8 percent, compared to 64.4 percent gained from the maximum likelihood classifier. The accuracy generated by expert method was also significantly different from the supervised with maximum likelihood classifier. Based on our study, the results encourage the use and the development of the effective algorithms based on expert system technique. With some fine-tuning the technique can further improve the accuracy of teak plantation mapping procedures. However, the complication of an analytical procedure, the processing time and cost of analysis may overcome the benefits. The knowledge and experience of the data analysts, as well as other factors should be taken into consideration when selecting an appropriate classification technique.
ACKNOWLEDGMENT
This research work is a part of ongoing research project “Analysis of Forest Ecosystems in Pasak Watershed Area Using Remote Sensing and Digital Image Analysis Techniques”, supported by Thammasat University and the National Research Council of Thailand.
REFERENCES
Congalton, R. G. and K. Green. (1999). Assessing the Accuracy of Remotely Sensed Data: Principles and Practices.
Lewis Publishers, New York: pp. 17-49. Eiumnoh, A., and R. P. Shrestha. (2000). Application of DEM data to Landsat image classification: evaluation
in a tropical wet-dry landscape of Thailand. Photogrammetric Engineering and Remote Sensing, 66(3): 297-304.
FAO. (2003). Forest Plantations. Retrieved April 14, 2004 from http://www.fao.org / forestry Gao, J, H. Chen, Y. Zhang and Y. Zha. (2004). Knowledge-based approaches to accurate mapping of mangroves
from satellite data. Photogrammetric Engineering and Remote Sensing, 70(11): 1241-1248. Huang, X., and J. R. Jensen (1997). A machine learning approach to automated knowledge-base building for
remote sensing image analysis with GIS data. Photogrammetric Engineering and Remote Sensing, 63(10): 1185-1194.
Jensen, J. R. (2000). Remote Sensing of the Environment: an Earth Resource Perspective. Prentice Hall Series in Geographic Science. Prentice Hall. New Jersey: pp. 333-373.
Leica Geosystems. (2003). ERDAS Field GuideTM 7 th Ed. GIS & Mapping LLC. Atlanta, Gorgia: p. 255. Lillesand, T. M. and R. W. Kiefer. (2000). Remote Sensing and Image Interpretation. John Wiley & Sons Inc.,
New York: pp. 518-523. Palacio-Prieto, J. L., and L. Luna-González. (1996). Improving spectral results in a GIS context. International
Journal of Remote Sensing, 17(11): 2201-2209. Schmidt, K. S., and E. H. Kloosterman, H. van Oosten, L. Kumar and J. A. M. Janssen. (2004). Mapping coastal
Pecora 16 “Global Priorities in Land Remote Sensing” October 23 – 27, 2005 * Sioux Falls, South Dakota

vegetation using an expert system and hyperspectral imagery. Photogrammetric Engineering and Remote Sensing, 70(6): 703-715.
Schriever, J. R., and R. G. Congalton. (1995). Evaluating seasonal variability as an aid to cover–type mapping from Landsat Thematic Mapper data in the northeast. Photogrammetric Engineering and Remote Sensing, 61(3): 321-327.
Schowengerdt, R. A. (1997). Remote Sensing: Models and Methods for Image Processing. Academic Press, New York: pp. 187-203.
Taweesuk, S. and P. Thammapala. (2004). Performance of principal component analysis to teak plantation classification accuracy. Proceeding from the 25th Asian Conference on Remote Sensing, November 22-26, 2004: 929-933.
Thammapala, P. and S. Taweesuk. (2004). Identification of teak plantation area using remote sensing technique in Pasak watershed. Journal of Remote Sensing and GIS Association of Thailand, 5(3): 22-32.
Pecora 16 “Global Priorities in Land Remote Sensing” October 23 – 27, 2005 * Sioux Falls, South Dakota