1
Experimental Validation of Tritium Recovery System from Liquid PbLi by Vacuum Sieve Tray Concept Fumito Okino a , Yukinori Hamaji b , Juro Yagi a , Teruya Tanaka b , Satoshi Konishi a , Akio Sagara b , and Takeo Muroga b a Institute of Advanced Energy, Kyoto University b National Institute for Fusion Science [email protected] VERIFICATION CAMPAIGN PROCEDURES Based on successful Proof of Principle, Vacuum Sieve Tray (VST)[1] as shown in Fig. 1, development is in technical demonstration / maturity phase. Tritium Extraction Efficiency (TEE) from liquid PbLi is a significant function of a liquid breeding blanket (LBB). Design review of ITER Test Blanket Module (TBM) program, categorized VST tritium extraction method [2] as still less technically matured. Probable issues are a) TEE degradation by the dense distribution of multiple nozzle arrays. b) Unstable performance in continuous operation and risk of degradation in long term operation. - Purpose of this study - To identify dynamic characteristics and reliability of VST under multiple droplets conditions. 1) Setup fabrication. As shown in Fig. 2-a-1, Fig. 2-a-2 and Fig. 2-a-3. The VST setup was integrated into the liquid metal test loop Oroshhi-2[3] at the National Institute for Fusion Science (NIFS). By the waves of Laboratory shut-down, the schedules were extremely delayed. Function checks of the D 2 dissolution into PbLi and permeation through concentration monitor are still underway. Hereafter, obtained results of the basic function checks are reported. 2) D 2 concentration monitor. As shown in Fig. 2-b-1, A schematic of the D 2 concentration monitor and basic dimension is depicted. The concentration of dissolved D 2 in PbLi is measured using the permeation mass flow through a concentration monitor wall. As a monitor wall material, the α (Alfa) iron (Fa) is preferred due to its high permeability and machinability. However, the material strength at high temperature (375 to 450 ) is not reported. STKM-11A JIS G3445 (Fs), low carbon engineering purpose iron STKM-11A (Fs) C<0.12 %, Si<0.35%, Mn<0.6%, P<0.04%, S< 0.04%, is applied due to the high temperature durability and commercial feasibility. A comparison of the D 2 permeation between the Fa and Fs tube is shown in Fig. 2-b-2. A ratio of obtained permeability was Fs / Fa = 0.38, which is not equivalent but operable as a permeation monitor material. 1) The VST technology for tritium extraction from PbLi is demonstrated in the Oroshhi-2 loop at an engineering scale. 2) Following demonstration campaigns have started. Mass balance verification to ensure consistency with theory. TEE measurements to verify multiple nozzle effects. 24h reliable operation to demonstrate VST engineering TRL. CONCLUSION ID: xxx •This research is supported by NIFS Collaboration Research Program NIFS18KOBF039. ACKNOWLEDGEMENTS / REFERENCES Fig. 1. A schematic of VST Tritium is efficiently recovered from liquid PbLi droplets while falling in a vacuum. The internal dispersion caused by the spherical oscillation contributes the enhancement. [1] F. Okino et al., Feasibility analysis of vacuum sieve tray for tritium extraction in the HCLL test blanket system, Fus. Eng. Des. 111 (2016) 1748-1753. [2] I. Ricapito et al., Tritium technologies and transport modelling: main outcomes from the European TBM Project, Fus. Eng. Des. (2018) https://dosi.org/10.1016/j.fusengdes.2018.01.023. Fig. 2-a-1 (Left). The concentration monitor Before (CMb). Permeated D2 gas through the monitor wall is conducted to the QMS. Fig. 2-a-2 (Right) The D2 dissolving tube (DD) which is made of a double tube system, D2 gas is filled inside tube. PbLi flows through the outer tube. Heat shield is half removed for photograph. Fig. 2-a-3. VST chamber. From the top, D2 rich PbLi flows into the VST and turns into droplets through the nozzle which is located at the top of VST chamber. Heat shield is fully removed for photograph. Fig. 2-b-1. A schematic of the D2 concentration monitor. Fig. 2-b-2. A plots of the D2 permeation as a function of time. Results of material Fa and Fs are plotted on a shame chart. T=300PD2=1×10⁵ Pa, tube thickness 1mm. Vertical axis is arbitrary scale not calibrated, only relative comparison is effective. Alfa iron (Fa) Fe>99.9% 1) Experimental setup. A schematic diagram of the experimental setup is shown in Fig. 3-a. Fig. 3-a. A schematic of VST experimental setup. Setup is consisted of a VST chamber which includes a droplet formation nozzle, a VST mass flow monitoring unit (MFv), a deuterium (D2) gas dissolution unit (DD), an electromagnetic pump (EMP), two concentration monitoring units (CMa, CMb), and vacuum pumping units. D2 is dissolved by permeation through an iron tube wall and is circulated by EMP. Liquid PbLi is turned into droplets by nozzles in VST, and while falling in a vacuum chamber, the dissolved D2 is recombined and released into a vacuum. The experimental temperature is between 375 and 450 . Liquid PbLi nozzle flow velocity is between 1.5 ms -1 and 3.0 m s -1 . A concentration of dissolved D2 in PbLi is measured as the permeation* through a monitor wall at CMb and CMa. A calibration unit (CU) is deployed to convert QMS reading of D2 partial pressure in Ampere into the mass flow rate. * The flow rate of PbLi is between 0.5 and 1.5 litter per minutes, the velocity effects to the permeation is neglected. Fig. 3-b. A plots of Mb, Ma, the permeated D2 mass flow as a function of time at CMb and CMa. Pd, the dissolved D2 gas pressure at DD, and R, the PbLi flow rate, are also plotted on a same chart. By the Pd valve open, Mb and Ma increase. By a shut down of Pd, Mb and Ma also decrease. The left side vertical scale is the QMS D2 partial gas current, scale is arbitrary and not yet calibrated. A comparison between Ma and Mb has no meaning. BACKGROUND CURRENT STATUS 2) Obtained results. As shown in Fig. 3-b, D 2 concentration dissolved in PbLi, is successfully monitored at CMb and CMa. 3) Discussions. The permeated D 2 mass flow Mb and Ma are one order of magnitude less than those of pre-estimated values. Probable causes are so far predicted as D 2 Leak in a PbLi flow loop Incorrect analysis model Sieverts’ constants not appropriate. [3] A. Sagara et al., Fus. Sci & Tech. 68 (2015) 303-307.

Experimental Validation of Tritium Recovery System ID: xxx

  • Upload
    others

  • View
    3

  • Download
    0

Embed Size (px)

Citation preview

Experimental Validation of Tritium Recovery System from Liquid PbLi by Vacuum Sieve Tray Concept

Fumito Okinoa, Yukinori Hamajib, Juro Yagia, Teruya Tanakab, Satoshi Konishia, Akio Sagarab, and Takeo Murogab

a Institute of Advanced Energy, Kyoto Universityb National Institute for Fusion Science

[email protected]

VERIFICATION CAMPAIGN PROCEDURES

Based on successful Proof of Principle, Vacuum Sieve Tray (VST)[1] as shown in Fig. 1, development is in technical demonstration / maturity phase.

Tritium Extraction Efficiency (TEE) from liquid PbLi is a significant function of a liquid breeding blanket (LBB). Design review of ITER Test Blanket Module (TBM) program, categorized VST tritium extraction method [2] as still less technically matured. Probable issues area) TEE degradation by the dense distribution of multiple nozzle arrays. b) Unstable performance in continuous operation and risk of degradation in long term operation.

- Purpose of this study -To identify dynamic characteristics and reliability of VST under multiple droplets conditions.

1) Setup fabrication. As shown in Fig. 2-a-1, Fig. 2-a-2 and Fig. 2-a-3.The VST setup was integrated into the liquid metal test loop Oroshhi-2[3] at the

National Institute for Fusion Science (NIFS). By the waves of Laboratory shut-down, the schedules were extremely delayed. Function checks of the D2 dissolution into PbLi and permeation through concentration monitor are still underway.

Hereafter, obtained results of the basic functionchecks are reported.

2) D2 concentration monitor.As shown in Fig. 2-b-1, A schematic of the D2 concentration monitor and basic

dimension is depicted. The concentration of dissolved D2 in PbLi is measured using the permeation mass flow through a concentration monitor wall.

As a monitor wall material, the α (Alfa) iron (Fa) is preferred due to its high permeability and machinability. However, the material strength at high temperature (375 ℃ to 450 ℃) is not reported. STKM-11A JIS G3445 (Fs), low carbon engineering purpose iron STKM-11A (Fs) C<0.12 %, Si<0.35%, Mn<0.6%, P<0.04%, S< 0.04%, is applied due to the high temperature durability and commercial feasibility.

A comparison of the D2 permeation between the Fa and Fs tube is shown in Fig. 2-b-2. A ratio of obtained permeability was Fs / Fa = 0.38, which is not equivalent but operable as a permeation monitor material.

1) The VST technology for tritium extraction from PbLi is demonstrated inthe Oroshhi-2 loop at an engineering scale.

2) Following demonstration campaigns have started.Mass balance verification to ensure consistency with theory.TEE measurements to verify multiple nozzle effects.24h reliable operation to demonstrate VST engineering TRL.

CONCLUSION

ID: xxx

•This research is supported by NIFS Collaboration Research Program NIFS18KOBF039.

ACKNOWLEDGEMENTS / REFERENCES

Fig. 1. A schematic of VSTTritium is efficiently recovered from liquid PbLidroplets while falling in a vacuum. The internal dispersion caused by the spherical oscillation contributes the enhancement.

[1] F. Okino et al., Feasibility analysis of vacuum sieve tray for tritium extraction in the HCLL test blanket system, Fus. Eng. Des. 111 (2016) 1748-1753.[2] I. Ricapito et al., Tritium technologies and transport modelling: main outcomes from the European TBM Project, Fus. Eng. Des. (2018) https://dosi.org/10.1016/j.fusengdes.2018.01.023.

Fig. 2-a-1 (Left). The concentration monitor Before (CMb).Permeated D2 gas through the monitor wall is conducted to the QMS.

Fig. 2-a-2 (Right) The D2 dissolving tube (DD) which is made of a double tube system, D2 gas is filled inside tube. PbLi flows through the outer tube. Heat shield is half removed for photograph.

Fig. 2-a-3. VST chamber.From the top, D2 rich PbLi flows into the VST and turns into droplets through the nozzle which is located at the top of VST chamber. Heat shield is fully removed for photograph.

Fig. 2-b-1. A schematic of the D2 concentration monitor.

Fig. 2-b-2. A plots of the D2 permeation as a function of time. Results of material Fa and Fs are plotted on a shame chart.T=300℃ PD2=1×10⁵ Pa, tube thickness 1mm. Vertical axis is arbitrary scale not calibrated, only relative comparison is effective. Alfa iron (Fa) Fe>99.9%

1) Experimental setup.A schematic diagram of the experimental setup is shown in Fig. 3-a.

Fig. 3-a. A schematic of VST experimental setup. Setup is consisted of a VST chamber which includes a droplet formation nozzle, a VST mass flow monitoring unit (MFv), a deuterium (D2) gas dissolution unit (DD), an electromagnetic pump (EMP), two concentration monitoring units (CMa, CMb), and vacuum pumping units. D2 is dissolved by permeation through an iron tube wall and is circulated by EMP. Liquid PbLi is turned into droplets by nozzles in VST, and while falling in a vacuum chamber, the dissolved D2 is recombined and released into a vacuum. The experimental temperature is between 375 ℃ and 450 ℃. Liquid PbLinozzle flow velocity is between 1.5 ms-1 and 3.0 m s-1. A concentration of dissolved D2 in PbLi is measured as the permeation* through a monitor wall at CMb and CMa. A calibration unit (CU) is deployed to convert QMS reading of D2 partial pressure in Ampere into the mass flow rate. * The flow rate of PbLi is between 0.5 and 1.5 litter per minutes, the velocity effects to the permeation is neglected.

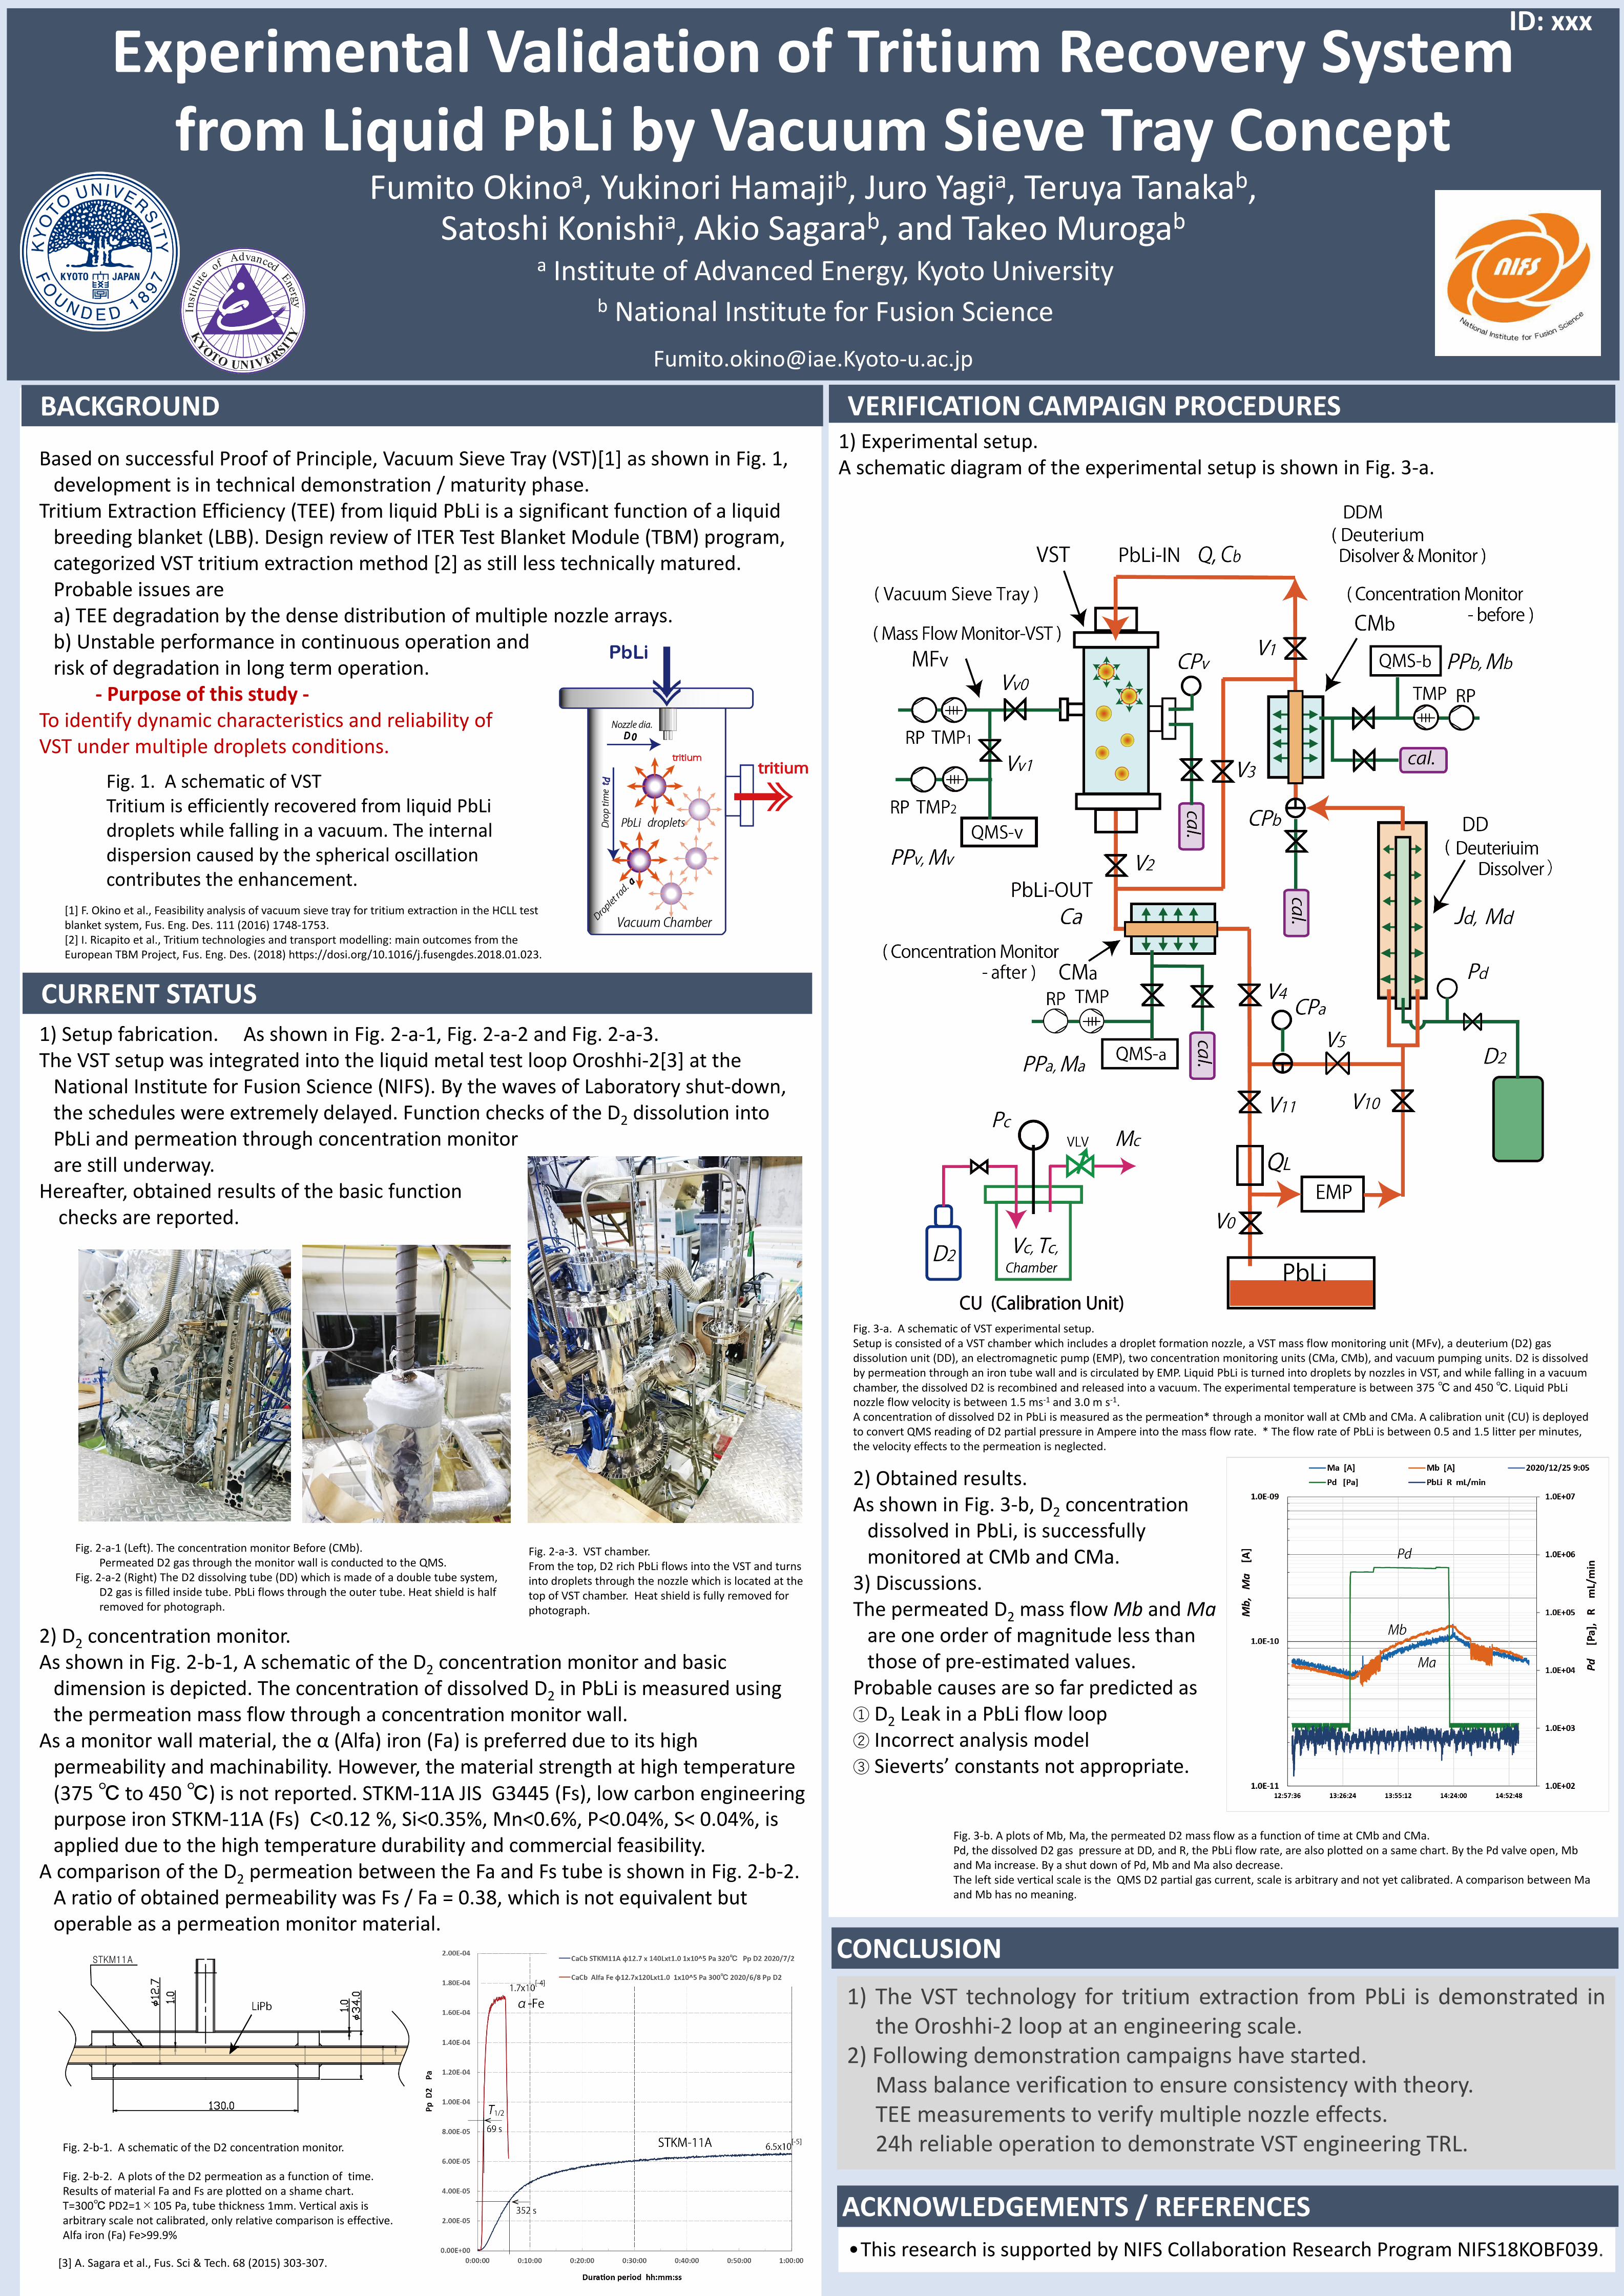
Fig. 3-b. A plots of Mb, Ma, the permeated D2 mass flow as a function of time at CMb and CMa.Pd, the dissolved D2 gas pressure at DD, and R, the PbLi flow rate, are also plotted on a same chart. By the Pd valve open, Mb and Ma increase. By a shut down of Pd, Mb and Ma also decrease. The left side vertical scale is the QMS D2 partial gas current, scale is arbitrary and not yet calibrated. A comparison between Ma and Mb has no meaning.

BACKGROUND

CURRENT STATUS

2) Obtained results.As shown in Fig. 3-b, D2 concentration

dissolved in PbLi, is successfully monitored at CMb and CMa.

3) Discussions.The permeated D2 mass flow Mb and Ma

are one order of magnitude less than those of pre-estimated values.

Probable causes are so far predicted as① D2 Leak in a PbLi flow loop② Incorrect analysis model③ Sieverts’ constants not appropriate.

[3] A. Sagara et al., Fus. Sci & Tech. 68 (2015) 303-307.