Embed Size (px)
Citation preview

Experimental Results on a 1.5 MW, 110 GHz Gyrotronwith a Smooth Mirror Mode Converter
David S. Tax & Eunmi M. Choi & Ivan Mastovsky & Jeffrey M. Neilson &
Michael A. Shapiro & Jagadishwar R. Sirigiri & Richard J. Temkin &
Antonio C. Torrezan
Received: 31 May 2010 /Accepted: 15 September 2010 /Published online: 7 October 2010# Springer Science+Business Media, LLC 2010
Abstract We present an internal mode converter (IMC) design for a 1.5 MW, 110 GHzgyrotron operating in the TE22,6 mode. The launcher, designed using the codes Surf3d andLOT, converts the cavity waveguide mode into a nearly pure Gaussian beam. The Gaussianbeam output from the launcher is shaped by a series of 4 smooth, curved mirrors to providea circular output beam with a flat phase front at the gyrotron window. By employingsmooth mirrors rather than mirrors with phase correcting surfaces, such an IMC is lesssensitive to alignment issues and can more reliably operate with high efficiency. The IMCperformance was verified by both cold test and hot test experiments. Beam patternmeasurements in each case were in good agreement with theoretical predictions. The outputbeam was of high quality with calculations showing that the Gaussian Beam content was95.8±0.5% in both hot and cold test.
Keywords Gyrotron . Internal mode converter . Gaussian beam . Efficiency
1 Introduction
There are very few types of sources capable of efficiently supplying high power in themillimeter wave frequency range. Applications such as electron cyclotron heating andcurrent drive (ECH, ECCD) in nuclear fusion experiments require large amounts of power,on the order of MWs, at frequencies above 100 GHz. For such applications, there is onlyone source that can meet the requirements: the gyrotron.
The gyrotron is a vacuum electron device that converts the perpendicular energy of anelectron beam emitted by a powerful magnetron injection gun (MIG) into microwave powerin a rotating TE mode near cutoff of an open resonator cavity in the presence of a static
J Infrared Milli Terahz Waves (2011) 32:358–370DOI 10.1007/s10762-010-9720-2
D. S. Tax (*) : E. M. Choi : I. Mastovsky :M. A. Shapiro : J. R. Sirigiri : R. J. Temkin :A. C. TorrezanPlasma Science and Fusion Center, Massachusetts Institute of Technology, Cambridge, MA 02139, USAe-mail: [email protected]
J. M. NeilsonCalabazas Creek Research Inc., San Mateo, CA 94404, USA

magnetic field. The schematic of MIT’s 1.5 MW, 110 GHz gyrotron is shown in Fig. 1. Atunable gun coil at the MIG cathode allows for alteration of the magnetic compression ratiowhich enables tuning of important electron beam parameters like the ratio of perpendicularto parallel electron velocity α and the beam radius rb. The beam passes through a smoothcylindrical cavity within the bore of a superconducting magnet where the interactionbetween the electron beam and the waveguide mode takes place. The walls in the nextregion of the tube are tapered to optimize the efficiency of the interaction and to increasethe wall radius to the optimal size of the internal mode converter (IMC). The microwavepower then propagates through the IMC and is extracted through a window, while the spentelectron beam passes through to the collector.
For high power gyrotrons, like those required for plasma heating in nuclear fusionexperiments, high efficiency is very important not only to minimize the prime powerrequired for operation, but also to guarantee satisfactory operation over the lifespan of thedevice. The overall efficiency of the gyrotron is naturally limited by the interactionefficiency between the electron beam and the microwaves; however, in practice, efficiencieswill be lower than the theoretical value. This efficiency drop occurs due to a variety ofreasons including effects relating to physical principles, such as a secondary after-cavityinteraction [1, 2], and experimental effects relating to the design and construction of thecomponents, such as the IMC.
The IMC is tasked with converting power from the high order TE mode in the gyrotroncavity into a more useful form, like a Gaussian beam in free space. The IMC consists of alauncher that transforms the cavity mode into a Gaussian beam and a set of mirrors that willdirect the power towards the window. The IMC performance can be quantified in a coupleof ways. First, there may be excessive lost power in the IMC arising from excessive Ohmicloss in the launcher, from reflection of power back towards the gun, or from losses due tostray radiation, that is power emitted from the launcher which is not intercepted by thesurfaces of the mirrors. Another measure of the performance of the IMC is the quality of theoutput beam, where we define the highest quality beam as an output whose mode content isdescribed by a pure fundamental Gaussian beam with a flat phase front at the window. ForECH applications, the Gaussian beam emitted by the gyrotron will be coupled into largecylindrical corrugated waveguide for transmission to the reactor chamber where it will beused to heat the plasma. The transmission efficiency of the gyrotron power is directlyrelated to the Gaussian beam content of the output beam. For a beam with low Gaussian
Fig. 1 Schematic of MIT 1.5 MW, 110 GHz gyrotron with an internal mode converter. Annular electronbeam is shown in red.
J Infrared Milli Terahz Waves (2011) 32:358–370 359

beam content or one that is highly elliptical, there will be additional loss due to theexcitation of higher order modes in the large, overmoded transmission lines connecting thegyrotron and the target reactor [3, 4]. In addition, misalignments between the beam andthe transmission lines, via tilt or offset, can also result in increased loss, however manysystems will implement a matching optics unit (MOU) to eliminate such effects. An MOUcould also be implemented with the IMC described in this paper. Recent calculations haveshown that about 95% Gaussian beam content would be required to satisfy ITER’stransmission line loss allowance based on the latest designs [5]. The IMC is thus an integralcomponent not just in terms of the efficiency of the gyrotron itself, but also in terms of thegyrotron’s effectiveness for its various applications.
In this paper, we discuss the mode converter that was built and installed on a 1.5 MW,110 GHz gyrotron operating in the TE22,6 mode. We present the launcher design byCalabazas Creek Research using the codes Surf3d and LOT [6] as well as the design for aset of four smooth, curved mirrors that shape the elliptical Gaussian beam output of thelauncher into a circular beam with a flat phase front at the gyrotron window. The IMCperformance was verified by both cold test and hot test experiments, whose results will bediscussed.
2 Mode converter design
The gyrotron’s internal mode converter (IMC) is comprised of two sections: a launcherwhere the cavity’s TE mode is altered via wall perturbations to emit a Gaussian beam, and aset of mirrors which shape the launched fields to provide a circular output with the correctbeam waist at the window. While many IMC designs employ mirrors with phase correctingsurfaces to improve the Gaussian content of the beam, the design presented here only usessmooth curved mirrors. Due to the layout of the gyrotron, namely the diameter of the tubeand the distance from the launcher tip to the window, a 4 mirror system is required and willconsist of 3 smooth curved mirrors and one mirror, mirror 3, that is perfectly flat.
The launcher is a cylindrical waveguide that has a helical cut at the output to launch themicrowave power onto the surface of the first mirror [7]. The walls of the launcher aredimpled, generating a mode mixture within the launcher and forming a Gaussian fielddistribution along the surface of the wall that propagates out according to the helical cut.Though analytical expressions can be used to determine the necessary wall profile,numerical codes are better suited to optimize the launcher design in order to maximizeperformance. One such code is the Launcher Optimization Tool (LOT), developed byCalabazas Creek Research (CCR). LOT takes a wall deformation of general form:
rðf; zÞ ¼ r0 þ kzþX
l
X
m
almðzÞ cosðHlmðzÞ � lfÞ ð1Þ
where r0 is the average wall radius, κ is the tapered slope and the spline points of cubicsplines alm(z) and Hlm(z) are the free parameters. A series of modes whose mixture willbunch the fields both longitudinally and azimuthally is then considered. These modes willhave similar caustic radii to the TE22,6 mode and the longitudinal bunching modes will haveinterference lengths close to the launcher cut length while the azimuthal bunching modeswill have transverse wave numbers close to that of the TE22,6 mode. The azimuthalbunching modes are thus of the form TE22+/-3,6-/+1 and the longitudinal bunching modes areof the form TE22+/-1,6. The full set of modes used in the launcher simulations were as
360 J Infrared Milli Terahz Waves (2011) 32:358–370

follows: TE18/19/20,7, TE21/22/23,6, TE24/25/26,5, TE24,6, TE16,8, TE17,8. The mode mixture thatis generated within the launcher due to the wall perturbations is calculated and theoptimization process then aims to minimize the field along the helical launcher cut andmaximize the Gaussian content at the aperture. To determine the radiated field from theaperture, the code employs a coupled mode theory along with a Stratton-Chu formulation ashas been done previously [8]. The improvement in the pre-shaped beams emitted by theselatest launchers has greatly helped in improving the overall efficiency of the IMC and thequality of the output beams, and has also allowed for simplifications in the design of themirror system.
Previously, in order to get output beams with very high Gaussian beam content, manyIMCs employed phase correcting surfaces on two of the mirrors, meaning that their surfaceswere not simply smooth [9]. Using simulation codes, the field distribution at the first mirrorwas calculated. Then, knowing that a particular beam waist and field distribution is desiredat the window location, a phase retrieval code [10] would be employed to calculate thenecessary mirror surfaces to satisfy the transition [11]. While such a method in theory canprovide a nearly perfect Gaussian beam output, when considering that the real fieldsemitted by the launcher may not be identical to the simulated fields and that the alignmentof the mirrors will not necessarily be exact, it is understandable that in practice, the IMCwill not perform quite as expected. With more recent launchers designed using the latestcodes, phase correcting surfaces on the mirrors are unnecessary. Designing a set of mirrorsthus simplifies to applying Gaussian beam optics along with the aid of numericalsimulations to determine the focal radii of the smooth mirrors that will focus the beam tothe proper waist and proportion at the window.
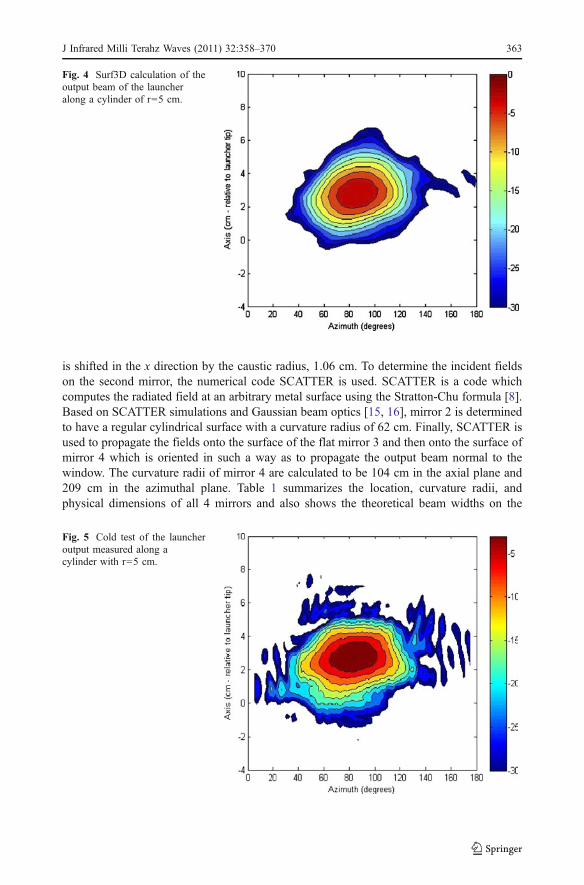
We now apply these principles to the design of an IMC for a 1.5 MW, 110 GHz gyrotronoperating in the TE22,6 mode. The gyrotron operates at a voltage of 96 kV with 3 μs pulsesand a beam current of 40 A. The main magnetic field is 4.3 T and the α value, the ratio oftransverse to axial electron velocity, is 1.4. The IMC design constraints are the input to thelauncher, which will be the fields of a TE22,6 mode within a waveguide of radius 2.096 cm,and the physical dimensions of the whole system which must fit inside the tube and providean output beam normal to and centered through the gyrotron window. The launcher wallprofile is designed using the LOT code. The designed launcher is 16.4 cm long with a slightuptaper of 0.35° and the profile of the dimpled walls is shown in Fig. 2. The wallperturbations of Fig. 2 generate a mixture of modes within the launcher as the wavepropagates down the waveguide which results in the field pattern along the waveguidesurface seen in Fig. 3. The launcher geometry is then exported to the code Surf3D forverification of the output beam. Surf3D is a computer code that calculates the rf fieldscattered from a metal surface by solving the electric field integral equation for an unknownsurface current using the method of moments [12, 13]. The simulated output calculated bySurf3D along a cylindrical surface at the launcher tip with a radius of 5 cm is shown inFig. 4. The output beam has high Gaussian content and is without significant sidelobes upto the −30 dB level.
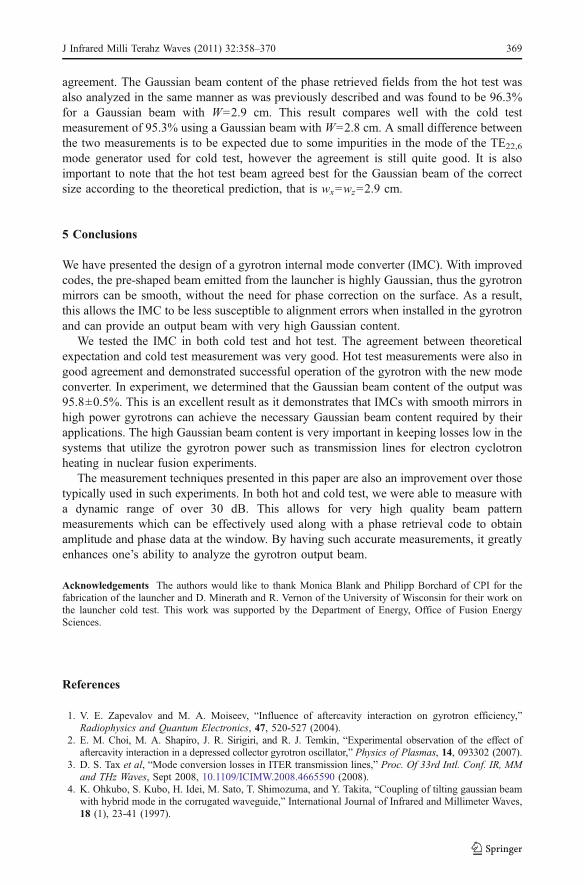
Since the design of the mirrors is based on the output of the launcher, it was important toconfirm the theoretically predicted beam pattern with a measurement. A cold testmeasurement of the launcher output was performed by our collaborators at the Universityof Wisconsin, R. Vernon and D. Minerath, since they had a readily available scanner systemcapable of measuring data in cylindrical planes. The result of their measurement is shown inFig. 5. The agreement between theory and measurement is quite good as the 9 dB beamwidths of 2.95 cm along the axis and 60° along the azimuth from the theoretical calculationof Fig. 4 agree well with their respective values from the measurement of 2.9 cm and 70° in
J Infrared Milli Terahz Waves (2011) 32:358–370 361

Fig. 5. We do note that the sidelobes in the measurement are somewhat larger, reachingthe −20 dB level, but are nonetheless still quite small. The small discrepancy betweentheory and experiment is likely attributed to impurities in the TE22,6 mode generator [14]that is necessary to perform these low power tests, however other sources of error such asmachining errors in the launcher and misalignments in the measurement system may alsoplay a role [9].
The mirror system is comprised of 4 smooth mirrors. The first two mirrors shape thebeam along one axis each, with mirror 1 shaping the beam in the vertical plane (x) andmirror 2 shaping the beam in the axial plane (z). Mirror 3 is perfectly flat and is presentonly due to the orientation of the gyrotron, while mirror 4 is the only mirror to havecurvature along both axes. The layout of the system of mirrors of the IMC is shown inFig. 6. The mirror system design begins by analyzing the radiated field pattern from thelauncher obtained via Surf3D and using it to propagate the fields to the location of mirror 1,a cylindrical surface with a radius of 5 cm around the launcher. The first mirror must also beshifted by the caustic radius due to the way the fields are radiated from the launcher. Thesurface of the first mirror is defined by a parabolic cylinder with a focal length of 5 cm and
Fig. 3 Field intensity along the wall of the launcher. Left side shows the launcher input where thewaveguide is unperturbed while the right side shows the launcher cut.
Fig. 2 Optimized wall profile forthe launcher calculated by thecode LOT. The dimples along thesurface of the wall shape themicrowave fields within thelauncher, generating the field in-tensities along the wall shown inFig. 3.
362 J Infrared Milli Terahz Waves (2011) 32:358–370
is shifted in the x direction by the caustic radius, 1.06 cm. To determine the incident fieldson the second mirror, the numerical code SCATTER is used. SCATTER is a code whichcomputes the radiated field at an arbitrary metal surface using the Stratton-Chu formula [8].Based on SCATTER simulations and Gaussian beam optics [15, 16], mirror 2 is determinedto have a regular cylindrical surface with a curvature radius of 62 cm. Finally, SCATTER isused to propagate the fields onto the surface of the flat mirror 3 and then onto the surface ofmirror 4 which is oriented in such a way as to propagate the output beam normal to thewindow. The curvature radii of mirror 4 are calculated to be 104 cm in the axial plane and209 cm in the azimuthal plane. Table 1 summarizes the location, curvature radii, andphysical dimensions of all 4 mirrors and also shows the theoretical beam widths on the
Fig. 4 Surf3D calculation of theoutput beam of the launcheralong a cylinder of r=5 cm.
Fig. 5 Cold test of the launcheroutput measured along acylinder with r=5 cm.
J Infrared Milli Terahz Waves (2011) 32:358–370 363

surface of each. With the system of mirrors fully defined, the output fields at the windowlocation can then be simulated using SCATTER. The field amplitude is shown in Fig. 7,while the phase distribution along each axis is shown in Fig. 8. The theoretical beam at thewindow location is circular with beam waists wx=wz≈2.9 cm and the phase front is flat inthe region where the field amplitude is within 3 dB of the peak value.
3 Cold test results
To perform the cold test measurements, we used a TE22,6 mode generator [14]. The modegenerator converts the fundamental mode of rectangular WR-8 waveguide into the TE22,6
mode in a cylindrical waveguide with the proper dimensions for the launcher. In order toverify the performance of the IMC, we would like to accurately measure the beam pattern atthe window location. For this task, we use a 3-axis scanner along with a measurementsystem. For the measurements, we opted to use a vector network analyzer (VNA),specifically the Agilent E8363B PNA, along with a set of F band (90–140 GHz) Olesonmillimeter-wave heads. The VNA provides for very accurate, repeatable results and if thetransmission through the system is sufficiently high then it can provide excellent dynamicrange and low SNR. To measure the field patterns, we mounted the receiving head of theVNA to the 3-axis scanner and attached a small cut waveguide antenna, allowing us tosample the fields over a small area. Scanning using this technique is quite fast, and we werethus able to get rather large grids for the data, typically 50×50 points, with a resolution ofabout 3 mm.
While the VNA is capable of measuring both the amplitude and the phase of the radiatedfields, we found it more reliable to only rely on the amplitude data. The main reasons forthis were the increased sensitivity in the phase measurement to slight misalignmentsbetween the scanner and the IMC and increased noise in the phase measurement around the
launcher
M1
M2
M3
M4
window
z
y
x
launcher
M1 M4M2M3window
z
x
y
Fig. 6 Layout of the IMC mirror system. Left: side view, Right: axial view.
Table 1 IMC mirror system specifications.
Beam size (Wx,Wz)[cm]
Mirror Center (xm,ym,zm)[cm]
Mirror size (dx,dz)[cm]
CurvatureRx
CurvatureRz
M1 (2.2,1.13) (1.059,5,0) (10,5) 10 cm Flat
M2 (2.53,1.69) (0,-5,5.038) (10.2,6.8) Flat 62 cm
M3 (2.71,2.474) (0,11,12.48) (10.9,10) Flat Flat
M4 (3.11,3.11) (0,-10,22.55) (14,14) 209 cm 104 cm
Window (2.93,2.93) (0,25.4,22.55) (9.754,9.754) Flat Flat
364 J Infrared Milli Terahz Waves (2011) 32:358–370

edges of the beam. An alternative approach to obtaining the phase is to measure theamplitude in several planes and then to apply a phase retrieval code to recover the phasevalues. Since the experimental setup allows for quick measurements in several planes, thisapproach was logical.
The phase retrieval method is the same that was used on previous mode converterdesigns where 2 mirrors have phase correcting surfaces [11]. The method involves takingmeasured amplitude data in at least two planes. An initial phase, a flat phase of 0 forexample, is assigned to the first measurement plane. These fields, amplitude and phase, arethen propagated forward to the second measurement plane. At the second plane, we retainthe propagated phase values, however the propagated amplitude values are replaced by theexperimentally measured amplitudes. This combination of experimental amplitudes andcalculated phases are then propagated back to the first plane. A convergence parameter isdefined by the difference between the propagated amplitudes and the experimentally
-24
-21
-18
-15
-12
-9
-6
-3
0
18 20 22 24 26 28-6
-4
-2
0
2
4
6
x(cm
)
z(cm)
Fig. 7 Theoretical field patternof the output beam at thewindow location.
Fig. 8 Phase of the output beamat the window location alongeach axis.
J Infrared Milli Terahz Waves (2011) 32:358–370 365

measured amplitudes. The process of replacing the propagated amplitudes with theexperimentally measured amplitudes and propagating to the other measurement plane isrepeated until the convergence criterion is met at which point accurate amplitude and phasedata has been recovered. With amplitude and phase values known in a particular plane, thefields at other locations may also be determined.
By measuring the fields directly at the window location, we can quickly verify the sizeand shape of the beam. Figure 9 shows the beam pattern measured at the window locationalong with a marking showing the size of the window itself. Scans of other planes along theaxis of the beam showed that the beam is indeed focusing approximately at the location ofthe window. At the window location, we measured a Gaussian beam waist of wx=2.7 cmand wz=2.9 cm which compares well to the beam waist of wz=wx=2.9 cm of the theoreticaloutput beam at the window in Fig. 5. We were able to obtain a dynamic range of over 30dB in such cold test measurements.
As mentioned in the introduction, the Gaussian beam content is an important parameterin determining the resultant loss of the gyrotron power within a transmission line. In orderto calculate the Gaussian content of the output beam, we require both amplitude and phasedata, and thus perform measurements in several planes and apply the phase retrievalalgorithm to extract phase values at the window location. The Gaussian beam content isdetermined using the following expression:
GB% ¼RAGaussianðax;az;W ; x; zÞA»
Experimentalðx; zÞdxdz���
���2
RAGaussianðax;az;W ; x; zÞj j2dxdz R AExperimentalðx; zÞ
�� ��2dxdz: ð2Þ
where AExperimental is the complex measured fields, AGaussian is the complex theoreticalfields of a round Gaussian beam with beam waist W and tilt angles αx and αz, and *represents the complex conjugate. When calculating Gaussian beam content, we allow for asmall tilt in the theoretical Gaussian beam by optimizing the GB% over the angles αx andαz. This is done because a perceived tilt may be present in the phase retrieved Gaussianbeam resulting from a small misalignment of the measurement system. This will occur
Z (cm)
X (
cm)
-6 -4 -2 0 2 4 6-6
-4
-2
0
2
4
6
-30
-25
-20
-15
-10
-5
0Fig. 9 Cold test measurement ofthe output beam at the windowlocation.
366 J Infrared Milli Terahz Waves (2011) 32:358–370

when the scanner is not perfectly parallel to the window and the center of the Gaussianbeam will shift from plane to plane. Using this method, we calculated a Gaussian beamcontent of 95.3% for a Gaussian beam with W=2.8 cm. This is very good result as suchhigh quality output beams are required to keep transmission line losses at an acceptablelevel on projects like ITER.
4 Hot test results
The IMC was installed on a 1.5 MW, 110 GHz pulsed gyrotron operating in the TE22,6
mode whose schematic is shown in Fig. 1. The gyrotron utilizes 3 μs pulses with a mainmagnetic field of 4.3 T and operates nominally at 96 kV and 40 A to produce a power of1.5 MW. This high-power operating point however is located along the edge of theparameter space where stable excitation of the TE22,6 mode occurs and operation canpotentially be somewhat unstable over longer periods of time. As a result, for the purposesof this experiment, we elect to operate at the more stable operating point of 98 kV and 43 Awith an output power of 1.2 MW. The launcher performance should be identical at thissecond, more stable operating point.
Just like in the cold test, we would like to obtain accurate field patterns of the Gaussianoutput beam of the gyrotron. For this experiment, we use a 2-axis scanner and an rf diode tomeasure the fields. We connect a programmable variable attenuator to the diode and mountit on the scanner. Again, we connect a cut waveguide antenna to measure the fields over asmall area as we move it across the measurement plane. At each point, rather than recordingthe diode signal, we instead choose to record the level of attenuation that results in the samediode signal. This method allows us to eliminate any nonlinear behavior in the dioderesponse and also serves to protect the diode from large signals that would otherwisedamage it and render it useless. The downside of this approach is that scans takesignificantly longer to perform than they do when using the VNA in cold test since theattenuation must be ramped down slowly in order to avoid saturating the diode. To furtherprotect the diode, we include a fixed attenuator that ensures the power reaching the diode is
Z (cm)
X (
cm)
-15 -10 -5 0 5 10 15-15
-10
-5
0
5
10
15
-35
-30
-25
-20
-15
-10
-5
Fig. 10 Beam pattern measuredin hot test 1 m from thegyrotron window.
J Infrared Milli Terahz Waves (2011) 32:358–370 367

not too high at the beam center. Since this measurement technique requires more time thanthe VNA measurement, data grids were kept smaller, typically using 25×25 points andresolutions on the order of 1 cm.
Unlike in cold test, it is impossible to measure the fields directly at the window in the hot testexperiment. In fact, it is not advisable to measure right up close near the window either sincepower can be reflected back into the gyrotron and the power received by the measuring antennawould be unnecessarily high. As a result, it is necessary to apply the phase retrieval method thatwas described in the previous section. In order to determine the amplitude and phase of thefields at the window, we simply need to measure the amplitudes in several planes far from thegyrotron. For this experiment, we opted to measure the fields along planes located 80, 100, and120 cm from the gyrotron window. The field pattern measured in the plane 1 m away from thegyrotron window is shown in Fig. 10. Using this measurement technique, we are able toachieve a dynamic range of over 40 dB. Measurements are also highly repeatable with lownoise, having error bars of approximately ±0.3 dB at each point as a result of a slight variationin diode voltage from pulse to pulse as well as the necessity of including a small range ofdiode voltages that will be deemed constant voltage in order to keep scan times reasonable.
Applying the phase retrieval code to the measured field patterns yields the beam at thewindow shown in Fig. 11. The beam waists determined from the phase retrieved beam arewx=2.9 cm and wz=3.0 cm. Table 2 compares the beam waists measured in both hot andcold test with the theoretical beam calculated using SCATTER, and all values are in good
Z (mm)
X (
mm
)
-40 -30 -20 -10 0 10 20 30 40-40
-30
-20
-10
0
10
20
30
40
-30
-25
-20
-15
-10
-5
0Fig. 11 Calculated output beamusing the phase retrievalmethod based on measuredamplitudes in several planes farfrom the gyrotron.
Table 2 Comparison of beam waists measured experimentally with theoretically calculated values.
Gaussian Beam Waists
wx (cm) wz (cm)
Calculation 2.9 2.9
Cold Test 2.7 2.9
Hot Test 2.9 3.0
368 J Infrared Milli Terahz Waves (2011) 32:358–370
agreement. The Gaussian beam content of the phase retrieved fields from the hot test wasalso analyzed in the same manner as was previously described and was found to be 96.3%for a Gaussian beam with W=2.9 cm. This result compares well with the cold testmeasurement of 95.3% using a Gaussian beam with W=2.8 cm. A small difference betweenthe two measurements is to be expected due to some impurities in the mode of the TE22,6
mode generator used for cold test, however the agreement is still quite good. It is alsoimportant to note that the hot test beam agreed best for the Gaussian beam of the correctsize according to the theoretical prediction, that is wx=wz=2.9 cm.
5 Conclusions
We have presented the design of a gyrotron internal mode converter (IMC). With improvedcodes, the pre-shaped beam emitted from the launcher is highly Gaussian, thus the gyrotronmirrors can be smooth, without the need for phase correction on the surface. As a result,this allows the IMC to be less susceptible to alignment errors when installed in the gyrotronand can provide an output beam with very high Gaussian content.
We tested the IMC in both cold test and hot test. The agreement between theoreticalexpectation and cold test measurement was very good. Hot test measurements were also ingood agreement and demonstrated successful operation of the gyrotron with the new modeconverter. In experiment, we determined that the Gaussian beam content of the output was95.8±0.5%. This is an excellent result as it demonstrates that IMCs with smooth mirrors inhigh power gyrotrons can achieve the necessary Gaussian beam content required by theirapplications. The high Gaussian beam content is very important in keeping losses low in thesystems that utilize the gyrotron power such as transmission lines for electron cyclotronheating in nuclear fusion experiments.
The measurement techniques presented in this paper are also an improvement over thosetypically used in such experiments. In both hot and cold test, we were able to measure witha dynamic range of over 30 dB. This allows for very high quality beam patternmeasurements which can be effectively used along with a phase retrieval code to obtainamplitude and phase data at the window. By having such accurate measurements, it greatlyenhances one’s ability to analyze the gyrotron output beam.
Acknowledgements The authors would like to thank Monica Blank and Philipp Borchard of CPI for thefabrication of the launcher and D. Minerath and R. Vernon of the University of Wisconsin for their work onthe launcher cold test. This work was supported by the Department of Energy, Office of Fusion EnergySciences.
References
1. V. E. Zapevalov and M. A. Moiseev, “Influence of aftercavity interaction on gyrotron efficiency,”Radiophysics and Quantum Electronics, 47, 520-527 (2004).
2. E. M. Choi, M. A. Shapiro, J. R. Sirigiri, and R. J. Temkin, “Experimental observation of the effect ofaftercavity interaction in a depressed collector gyrotron oscillator,” Physics of Plasmas, 14, 093302 (2007).
3. D. S. Tax et al, “Mode conversion losses in ITER transmission lines,” Proc. Of 33rd Intl. Conf. IR, MMand THz Waves, Sept 2008, 10.1109/ICIMW.2008.4665590 (2008).
4. K. Ohkubo, S. Kubo, H. Idei, M. Sato, T. Shimozuma, and Y. Takita, “Coupling of tilting gaussian beamwith hybrid mode in the corrugated waveguide,” International Journal of Infrared and Millimeter Waves,18 (1), 23-41 (1997).
J Infrared Milli Terahz Waves (2011) 32:358–370 369

5. M. A. Shapiro, E. J. Kowalski, J. R. Sirigiri, D. S. Tax, R. J. Temkin, T. S. Bigelow, J. B. Caughman, andD. A. Rasmussen, “Loss estimate for ITER ECH transmission line including multimode propagation,”Fusion Science and Technology, 57 (3), 196-207 (2010).
6. J. M. Neilson, “Optimal synthesis of quasi-optical launchers for high-power gyrotrons,” IEEETransactions on Plasma Science, 34, 635-641 (2006).
7. A. A. Bogdashov and G. G. Denisov, “Asymptotic theory of high-efficiency converters of higher-orderwaveguide modes into eigenwaves of open mirror lines,” Radiophysics and Quantum Electronics, 47 (4),283-296 (2004).
8. M. Blank, K. Kreischer, and R. J. Temkin, “Theoretical and experimental investigation of a quasi-opticalmode converter for a 110-GHz gyrotron,” IEEE Transactions on Plasma Science, 24 (3), 1058-1066(1996).
9. M. P. Perkins, R. Cao, J. M. Neilson, R. J. Vernon, “A high efficiency launcher and mirror system for usein a 110 GHz TE22,6 mode gyrotron,” International Journal of Infrared and Millimeter Waves, 28 (3),207-218 (2007).
10. A. V. Chirkov, G. G. Denisov, and N. L. Aleksandrov, “3D wavebeam field reconstruction from intensitymeasurements in a few cross sections,” Optics Communications, 115, 449-452 (1995).
11. D. R. Denison, T. S. Chu, M. A. Shapiro, and R. J. Temkin, “Gyrotron internal mode converter reflectorshaping from measured field intensity,” IEEE Transactions on Plasma Science, 27 (2), 512-519 (1999).
12. J. M. Neilson, “Surf3D and TOL: computer codes for design and analysis of high-performance QOlaunchers in gyrotrons,” 29th International Conference on Infrared and Millimeter Waves, Karlsruhe,Germany, 667-668, Sept. 27 – Oct. 1, 2004.
13. J. M. Neilson and R. Bunger, “Surface integral equation analysis of quasi-optical launchers,” IEEETransactions on Plasma Science, 30 (3), 794-799 (2002).
14. C. Moeller, “A coupled cavity whispering gallery mode transducer,” Conf. Digest 17th Int. Conf. onInfrared and Millimeter Waves, Pasadena, CA, M3.7 (Dec. 1992).
15. P. F. Goldsmith, Quasioptical Systems: Gaussian Beam Quasioptical Propagation and Applications,Wiley Publisher, 1998.
16. D. H. Martin and J. W. Bowen, “Long-wave optics,” IEEE Transactions on Microwave Theory andTechniques, 41(10), 1676-1690 (1993).
370 J Infrared Milli Terahz Waves (2011) 32:358–370