Embed Size (px)
Citation preview

Energy Procedia 54 ( 2014 ) 199 – 210
Available online at www.sciencedirect.com
ScienceDirect
1876-6102 © 2014 A. Vyas Pareshkumar Published by Elsevier Ltd. This is an open access article under the CC BY-NC-ND license (http://creativecommons.org/licenses/by-nc-nd/3.0/).Selection and peer-review under responsibility of Organizing Committee of ICAER 2013doi: 10.1016/j.egypro.2014.07.263
4th International Conference on Advances in Energy Research 2013, ICAER 2013
Experimental Investigation on Energy Efficiency of Electrical Utilities in Process Industries through Standard Energy
Conservation Practices Vyas Pareshkumar A.a*, Bhale Purnanad V.b
aOffice of the Dy. Director Boilers,Surat 395007,India bDept.of Mechanical Engineering,SVNIT,Surat 395007,India
Abstract
In this research paper energy uses and energy conservation opportunities for process industry is presented. It has been found that process industries consume a substantial amount of energy. Excessive use of energy is usually associated with many process plants in India. The study is based on the realization that enormous potential exists for cost effective improvements in the existing energy using equipments. Through the method of energy audit power rating, operation time, power factor and other important details of all the machines/equipments were collected for the selected industry. The measured data was analysed to find energy conservation opportunity. Energy saving techniques like, energy efficient pumps, stopping of air leakages, air compressor efficiency improvement was considered for energy conservation. Energy saving details was calculated with cost benefit analysis. Energy conservation implementation program was carried out for Centrifugal pumping system, Air compressor system, as per the management consent and requirement in the the selected industry. It has resulted in total saving of 2,29,369 electric units (kWh/year) and annual energy saving of Rs. 13,43,670 with an investment of Rs 2,45,000 . © 2014 The Authors. Published by Elsevier Ltd. Selection and peer-review under responsibility of Organizing Committee of ICAER 2013.
Keywords:Energy Audit ; Energy Conservation ; Air Compressor System ; Centrifugal Pumping System.
1. Introduction
The textile cluster of city Surat (Gujarat, India) is one of the prime clusters famous for synthetic sarees and dress materials. Around 400 industries are housed working for dyeing and printing of synthetic and cotton cloth. 726 GWh of electricity, 315 million SCM of natural Gas and 2.3 million tons of coal is used by the cluster annually.
* Corresponding author. Tel.: +91-7600006133; fax: +91-0261-2471932.
E-mail address:[email protected]
© 2014 A. Vyas Pareshkumar Published by Elsevier Ltd. This is an open access article under the CC BY-NC-ND license (http://creativecommons.org/licenses/by-nc-nd/3.0/).Selection and peer-review under responsibility of Organizing Committee of ICAER 2013

200 A. Vyas Pareshkumar and V. Bhale Purnanad / Energy Procedia 54 ( 2014 ) 199 – 210
That accounts for nearly 1.2 million tons of oil equivalent of energy use. The overall energy saving potential in the cluster is about 1.5 lakh tons of oil equivalents, which is 13 per cent of its total power consumption. The cost of electrical and thermal energy as percentage of manufacturing cost varies between 12 and 15%.The energy cost is next to the raw materials cost. [1]
Energy Audit is the key to a systematic approach for decision-making in the area of energy management. It attempts to balance the total energy inputs with its use, and serves to identify all the energy streams in a facility. As per the Energy Conservation Act, 2001, of India , Energy Audit is defined as “the verification, monitoring and analysis of use of energy including submission of technical report containing recommendations for improving energy efficiency with cost benefit analysis and an action plan to reduce energy consumption”. [2]
1.1. Energy consumption in SME’s
Small and Medium Enterprise (SME) sector makes up for a very large part of the industrial structure in any country. In India, this sector is often characterized by the use of outdated technologies. SME’s in India are generally considered as less efficient in material and energy use compared to larger companies. A recent study by the Bureau of Energy Efficiency, India (BEE), which takes into consideration the SME sector, revealed that the overall energy saving potential of the clusters is about 72,432 TOE (Ton of oil equivalent) which is 27.4 per cent of the total energy consumption in SME’s. Though individually the SMEs may not have a significant effect on the environment and resource use, but together they exert a substantial impact. More so, given their large numbers in emerging economies like India and China, there is a growing need to address the problems of pollution and the efficiency of use of energy and raw materials that these enterprises pose. [3]
BEE (India) has also carried out one survey for Surat textile cluster and following are the recommendations. Possible areas of Energy Efficiency and Energy Conservation • Installation of variable frequency drives for Jet machine pumps, ID and FD fans, Drum washers, oil circulation
pumps, printing machines, air compressors will reduce energy consumption by about 20 to 25%. • Replace inefficient and local make pumps with new optimum sized and efficient pumps. • Install temperature control valves for all process equipments – Jet Machines, Drum machines, Stenters, Jigger
machines etc. • Improve boiler efficiency, replace faulty and mismatch traps, avoid bypass of steam taps etc.
1.2. The Air Distribution Sub-System
The Compressed Air & Gas Institute (CAGI) refers to the compressed air supply as the “Fourth Utility”, right alongside water, gas and electricity. Inefficiencies in compressed air systems can therefore be significant. Energy savings from system improvements can range from 20 to 50 percent or more of electricity consumption. A properly managed compressed air system can save energy, reduce maintenance, decrease downtime, increase production and improve product quality. Only 10-30% of energy reaches the point of end-use, and balance 70-90% of energy of the power of the prime mover being converted to unusable heat energy and to a lesser extent lost in form of friction, misuse and noise An optimum compressed air distribution is an energy pipeline like an electricity cable which transports compressed air energy with as few losses as possible in practice, compressed air tubes (main and distribution lines ) are frequently selected without taking energetic issues into consideration with the result that 80 out of 100 firms, often 50 % and more of the compressed air energy are destroyed before they can reach the usage points. [4]
The pressure drop from the air receiver in the compressor to the final connection should not exceed 0.1 bar in an optimally designed compressed air network. The pressure loss is split into <= 0.03 bar for the Mainline; <= 0.03 bar for the Distribution line ; < = 0.04 bar for the connection. [5] Air leaks are the single greatest source of energy loss in manufacturing facilities with compressed air systems. Leaks can waste 20–50% of a compressor’s output. Power losses increases exponentially as the diameter of hole increases. [6,7]Leakage rates are a function of the supply pressure in an uncontrolled system and increase with higher system pressures. Leakage rates are proportional to the square of the orifice diameter.[8]The cost of compressed-air leaks is the cost of the energy required to compress the volume of lost air, from atmospheric pressure to the compressor’s operating pressure. The cost of compressed-air

A. Vyas Pareshkumar and V. Bhale Purnanad / Energy Procedia 54 ( 2014 ) 199 – 210 201
leaks increases as the diameter of the leak increases. One of the ways to reduce leaks is to lower the demand air pressure of the system. The lower the pressure differential across an orifice or leak, the lower the rate of flow, so reduced system pressure will result in reduced leakage rates. Stabilizing the system header pressure at its lowest practical range will minimize the leakage rate for the system. [9]
1.3. Energy savings due to reduction in discharge pressure
A rule of thumb for systems in the 100 psig range is: for every 2 psi increase in discharge pressure, energy consumption will increase by approximately 1 percent at full output flow. For systems in the 100 psig range with 30 to 50 percent unregulated usage, a 2 psi increase in header pressure will increase energy consumption by about another 0.6 to 1.0 percent because of the additional unregulated air being consumed. The combined effect results in a total increase in energy consumption of about 1.6 to 2 percent for every 2 psi increase in discharge pressure for a system in the 100 psig range with 30 to 50 percent unregulated usage.
The energy wasted in compressed-air systems because of poor installation and maintenance can account for up to 50% of the energy consumed by the compressor, and it is believed that about half of this amount can be saved by practicing energy conservation measures. [9]
Operating compressed-air systems at the lowest functional pressure that meets production requirements will result in energy saving. For example, reducing pressure settings by 13 kPa will reduce energy consumption by 1%. Another example is when reducing the pressure for about (70–84 kPa), 5–6% savings of compressed-air electrical demand could be saved [7, 10].
1.4. Centrifugal pumping system
The Overall system efficiency of a pumping system is very low as explained under. Motor output power = 90% of 100 = 90 Std motor efficiency 90 % Coupling output = 98% of 90 = 88.2 Coupling efficiency 98 % Pump output = 77% of 88.2 = 67.9 Pump efficiency 77 % Throttle output = 66% of 67.9 = 44.82 Throttle efficiency 66 % Pipe output = 69% of 44.82 = 30.93 Pipe efficiency 69 %
The system loses a great deal of power. 100 units of power are input, but the system delivers only 31 units of power out. This represents a 31% efficient system. There is a lot of room for improvement.
2. Preparation for energy consumption analysis
2.1. Instruments Details Electrical portable load manager model ALM 10 was used to measure important electrical data like ampere,
voltage, power factor etc. Hand held ultrasonic flow meter was used to measure water flow. It can measure real time flow rate in pipelines without any disturbance to process. Ultrasonic flow meter is a non-contact flow measurement device designed to measure the velocity of liquid within a closed conduit. Ultrasonic flow meter usually uses clamp-on type flow transducers which don't block flow, thus no pressure drop and almost free of maintenance. 2.2 Process industry details
Following fig. 1 and 2 shows process diagram from Raw material to finished product, Water distribution and Air distribution system.

202 A. Vyas Pareshkumar and V. Bhale Purnanad / Energy Procedia 54 ( 2014 ) 199 – 210
Fig. 1 Process diagram
a b
Fig.2 (a) Raw Water (b) Air compressor System
3. Methodology
3.1 Energy audit activity
Before conducting a detailed energy audit for the industry a pre audit meeting was held with the owner, manager engineer and appropriate plant personnel who are familiar with the physical conditions and day-to-day operation of the industry. An auditor is a certified energy auditor and senior technical personnel with sufficient exposure in conducting a detailed energy audit to guide and supervise the audit progress. This has been done to ensure that the data collection was carried out reliably. Following is the procedure of an energy audit. (a) First a meeting was held with the manager/maintenance engineer to introduce the members of the audit group. The engineer then explained manufacturing process and energy-consuming machineries, and provided available operation and maintenance records for review. (b) Then after the maintenance engineer took the audit team to the manufacturing facility for locations and the accessibility of measuring points. Respective machine operator was also introduced and purpose of audit was also briefed. (c) Manuals have been referred to know the specifications. (d) The calibration status of instruments were verified and corrected where necessary.
Printing Rotary
Zero - Zero
Folding
Jet M/C Padding
Loop
Washing
Hydro St
ente
r
Packing
Grey
Supply pump
Borewell
Over HeadWater Tank
All
Sten
ter M
achi
nes
All
Dru
ms,
Zero
Z A
ll Je
t Mac
hine
Col
our K
itche
n
Off
ice
use
B1 B2
All
Prin
ting
Mac
hine
Padd
ing
Mac
hine
Rot
ary
M/c
Compressor-2 A
ll St
eant
er m
/c
All
Jet M
/c
All
Dru
m m
/c
Compressor-1
All
Prin
ting
M/c
Padd
ing
M/c
Rot
ary
&Lo
op M
/c
Compressor-3

A. Vyas Pareshkumar and V. Bhale Purnanad / Energy Procedia 54 ( 2014 ) 199 – 210 203
3.1.1 Air compressor system Volumetric efficiency
Following data are collected with measuring instruments and calculations were made for efficiency and percentage air leakages. Input voltage , current, power factor : Measured with portable load analyzer Running hours : Installed running hour meters (fig.3) Tank volume : Length, diameter measured with measure tape Discharge air pressure : Measured with calibrated pressure gauge Actual tank filling time : Measured with calibrated stop watch
From above mentioned data following were calculated to arrive at conclusion. Input kW/ hour = √3 × V × I × COS Φ
Actual air generation =
Required tank filling time (sec) =
Existing specific power consumption =
Compressor efficiency =
Ideal specific power consumption =
Power loss per day in Rs Annual power loss (Rs) = Power loss per day × 26 × 12
Payback in months =
a b
Fig. 3 (a & b) Installation of running hour meter for air compressor

204 A. Vyas Pareshkumar and V. Bhale Purnanad / Energy Procedia 54 ( 2014 ) 199 – 210
Estimation of air leakage
The major opportunity to save energy is in the prevention of leaks in the compressed air system. Following is the procedure to find out percentage air leakage. (1) Shut off compressed air operated equipment (or conduct test when no equipment is using compressed air). (2) Run the compressor to charge the system to set pressure of operation (3) Note the sub-sequent time taken for ‘load’ and ‘unload’ cycles of the compressors. For accuracy, take ON &OFF times for 8 – 10 cycles continuously. Then calculate total ‘ON’ Time (T) and Total ‘OFF’ time (t). The system leakage is calculated as: % leakage = T × 100 / (T + t)
(or) System leakage (m3/minute) = Q × T / (T + t) Where T = Time on load in minutes and t = Time on unload in minutes
3.1.2 Centrifugal pumping system
Centrifugal pumps are used to transfer and supply water as per requirement. From measured data actual hydraulic efficiency was calculated. Following parameters were measured with measuring instruments. Input voltage, current, power factor: Measured with portable load manager. Actual head: Measured with calibrated pressure gauge. Actual discharge: Measured with ultrasonic flow meter. Running hours: Installed running hour meters.
From above mentioned data following were calculated to arrive at conclusion.
Input kW per hour = √3 × V × I × COS Φ Present water discharge per day = measured flow (m3/hr) × existing pump running hrs
Pump hydraulic power Pump shaft power
=
=
Pump efficiency
=
=
=
Unit consumption per day = calculated input kW / hr × existing pump running hrs Annual power loss (Rs) = Power loss per day (Rs) × 26 ×12 Payback in months =

A. Vyas Pareshkumar and V. Bhale Purnanad / Energy Procedia 54 ( 2014 ) 199 – 210 205
a b
Fig. 4 (a) Ultrasonic flow meter (b) surface preparation
Above fig.4 shows ultrasonic flow meter and experimental setup to measure water flow. Before taking readings for flow measurement pipe surface has to be cleaned. If pipe surface is not cleaned wrong data may be acquired by the instruments. For cleaning pipe surface dirt, dust, paint etc. are removed with hacksaw blade and different grade of emery paper. Then grease is applied to ensure air tight surface between measuring probe and pipe surface. 3.2 Detail calculation of implemented energy efficiency measures 3.2.1 Air compressor System Air leakage test:
T-on - Average On Time (T) (min) = 38 T off- Average Off Time (t) (min) = 28 % Air leakage = T / (T + t) × 100 = 57.58 % Annual cost of power for comp 3 (Rs.) = Unit rate× Annual power consumption = 5.50 × (674.3 × 26 × 12) = 11,57,098 Annual power loss due to leakages (Rs.) = Annual power cost x % Air leakage = 666257 Power can be saved by plugging leakage in % = 75 (from experience with other similar industry) Annual saving by leakage prevention (Rs.) = Power saved by plugging 75 % leakage = 499693 Investment required in plugging leakages (Rs) = 50000 (from experience with other similar industry) Payback in months = (Investment(Rs)×12) ÷ Saving (Rs/Year) = 1.20
Volumetric Efficiency measurement COMPRESSOR NO. = 1 2 3 Hp = 40 30 40 Motor RPM = 1440 1440 1440 Voltage = 410 412 414 Current = 43 35 45 Power Factor = 0.95 0.95 0.95 Power consumption per hour = [√3 × V × I × COSΦ] = 29.01 23.73 30.65 Average working hrs = 24 12 22 Compressor RPM = 1440 1440 1440 Compressor Capacity (m3/min) = 4.4 2.94 5.4 Tank Volume (m3) = 1.076 1.076 1.076 Air pressure (Kg/cm2) = 6 7 4 Total air volume (m3) = (Tank Volume × Air Pressure) = 6.456 7.532 4.304
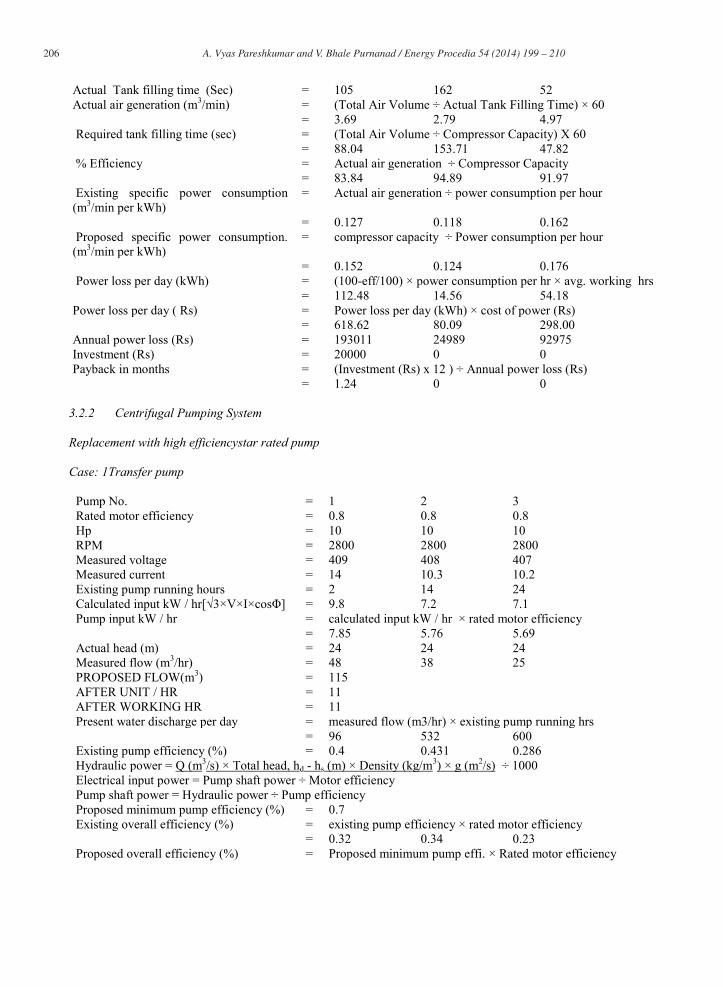
206 A. Vyas Pareshkumar and V. Bhale Purnanad / Energy Procedia 54 ( 2014 ) 199 – 210
Actual Tank filling time (Sec) = 105 162 52 Actual air generation (m3/min) = (Total Air Volume ÷ Actual Tank Filling Time) × 60 = 3.69 2.79 4.97 Required tank filling time (sec) = (Total Air Volume ÷ Compressor Capacity) X 60 = 88.04 153.71 47.82 % Efficiency = Actual air generation ÷ Compressor Capacity = 83.84 94.89 91.97 Existing specific power consumption (m3/min per kWh)
= Actual air generation ÷ power consumption per hour
= 0.127 0.118 0.162 Proposed specific power consumption. (m3/min per kWh)
= compressor capacity ÷ Power consumption per hour
= 0.152 0.124 0.176 Power loss per day (kWh) = (100-eff/100) × power consumption per hr × avg. working hrs = 112.48 14.56 54.18 Power loss per day ( Rs) = Power loss per day (kWh) × cost of power (Rs) = 618.62 80.09 298.00 Annual power loss (Rs) = 193011 24989 92975 Investment (Rs) = 20000 0 0 Payback in months = (Investment (Rs) x 12 ) ÷ Annual power loss (Rs) = 1.24 0 0
3.2.2 Centrifugal Pumping System Replacement with high efficiencystar rated pump Case: 1Transfer pump
Pump No. = 1 2 3 Rated motor efficiency = 0.8 0.8 0.8 Hp = 10 10 10 RPM = 2800 2800 2800 Measured voltage = 409 408 407 Measured current = 14 10.3 10.2 Existing pump running hours = 2 14 24 Calculated input kW / hr[√3×V×I×cosΦ] = 9.8 7.2 7.1 Pump input kW / hr = calculated input kW / hr × rated motor efficiency = 7.85 5.76 5.69 Actual head (m) = 24 24 24 Measured flow (m3/hr) = 48 38 25 PROPOSED FLOW(m3) = 115 AFTER UNIT / HR = 11 AFTER WORKING HR = 11 Present water discharge per day = measured flow (m3/hr) × existing pump running hrs = 96 532 600 Existing pump efficiency (%) = 0.4 0.431 0.286 Hydraulic power = Q (m3/s) × Total head, hd - hs (m) × Density (kg/m3) × g (m2/s) ÷ 1000 Electrical input power = Pump shaft power ÷ Motor efficiency Pump shaft power = Hydraulic power ÷ Pump efficiency Proposed minimum pump efficiency (%) = 0.7 Existing overall efficiency (%) = existing pump efficiency × rated motor efficiency = 0.32 0.34 0.23 Proposed overall efficiency (%) = Proposed minimum pump effi. × Rated motor efficiency

A. Vyas Pareshkumar and V. Bhale Purnanad / Energy Procedia 54 ( 2014 ) 199 – 210 207
= 0.56 Existing specific power consumption (m3/kW)
= (measured flow m3) ÷ calculated input kW / hr
= 4.89 5.27 3.51 Existing unit consumption per day = calculated input kW / hr × existing pump running hrs = 19.64 100.88 170.84 Total unit consumption = 19.60 +100.94 +171.36 = 291.36 After unit consumption/day (single pump) = after unit kW/hr × after pump running hrs = 121 Saving in unit/day = 291.36 – 121 = 170.36 Saving achieved per day(Rs) = Saving in unit/day × Price per unit (Rs) = 170.36 × 5.5 = 936.96 Annual Saving (Rs) = 936.96 × 26 ×12 = 292332.70 Investment required (Rs) = 35000 Payback in months = (Investment required (Rs) × 12 ) ÷ Saving per year = 1.44
Case:2 Supply pump Similar procedure is followed for supply pump I and II and results are discussed in the next section.
4. Results and discussion
Implemented energy conservation details
Energy saving implementation activity was carried out in one of the process industry and following are the results. 4.1 Air compressor system
In the said company three number air compressor are installed. Before energy conservation measures total electricity consumption of three air compressors was 1400 unit per day measured. Following energy saving measures are implemented. (1) PID controller is installed and different air pressure setting is set for three different compressors. (2) Air line network rearranged (common header is installed) and Automatic moisture drain valve also installed. (3) Air leakages are arrested. Volumetric efficiency of compressor no 1 is to be enhanced. 4.1.1 Air Leakage test
Air leakage test was conducted and about 58 % leakage was measured. By investment of around Rs. 50000 in servicing of air distribution network it can be minimized. 4.1.2 Air compressor performance evaluation
Volumetric efficiency of all three air compressor was measured. Results show poor volumetric efficiency in case of air compressor no. 1. By proper servicing efficiency can be improved.
Table 1. Air compressor performance details.
Description hp m3/min % volumetric efficiency
Specific power consumption (kwh/m3)
Annual power loss(Rs)
Investment required(Rs)
Payback period (months)
Air compressor # 1 40 4.4 83.84 7.62 193011 20000 1.24
Air compressor # 2 30 2.94 94.89 7.08 24989 0 0

208 A. Vyas Pareshkumar and V. Bhale Purnanad / Energy Procedia 54 ( 2014 ) 199 – 210
a b
a b
Air compressor # 3 40 5.4 91.97 9.72 92975 0 0
Table 2. Air compressor system cost benefit analysis
Energy-Saving Measures
Investment (Rs)
Annual Savings (Rs)
Simple Payback Period (Months)
Expected Lifetime (operating hours)
Improve Efficiency of Compressor No. 1
20000 193011 1.24 14400
Stop Air Leakages in Department.
50000 499693 1.20 Req. Regular Maintaince
Total 70000 692704
Following snaps from fig. 5 and 6 shows modification activity carried out to obtain cost savings.
Fig. 5 (a) Modification in air distribution network (b) Installation of PID controller
Fig. 6 (a) Installation of Auto moisture drain (b) Setting of new discharge pressure set points
4.2 Centrifugal pumping system Replacement with high efficiency star rated pump
Hydraulic efficiency was calculated for Transfer and Supply pumps. It was found very poor. So new energy efficient pumps with proper specifications were installed for both applications. Fig. 7 shows set up of implementation. Three pumps of 10 hp each were used to pump water from underground tank to overhead tank.

A. Vyas Pareshkumar and V. Bhale Purnanad / Energy Procedia 54 ( 2014 ) 199 – 210 209
Table 3. Transfers pump performance evaluation.
Description hp Head (meter)
Flow (m3/hr)
Current (amp)
Input kW/hr
% efficiency % Overall efficiency
Transfer pump # 1 10 24 48 14 7.85 40.0 32
Transfer pump # 2 10 24 38 10.3 5.76 43.1 34
Transfer pump # 3 10 24 25 10.2 5.69 28.6 23
One 10 hp mono sub pump, 20 meter Head and 100 m3/hr discharge capacity is installed.
Table 4. Transfer pump cost benefit summary.
Energy-Saving Measure Investment (Rs.)
Annual Savings (Rs.)
Simple Payback Period (Months)
Expected Lifetime
(operating hours)
Replace Transfer Pump No. 1,2 and 3 by single Energy Efficient pump
35000 292332 1.44 14400
Total 35000 292332
Two 10 hp centrifugal pumps were used to supply water from one sump to another.
Table 5. Supply pump performance evaluation.
Description hp Head
(meter)
Flow (m3/hr)
current
(amp)
Input kW/hr
% efficiency % Overall efficiency
Supply pump # 1 10 22 42 10.5 5.26 50 40
Supply pump # 2 10 22 45 10.2 5.13 55 44
One single energy efficient pump of 3 HP; 6 meter head and 100 m3/hr capacity is installed. Since the pumps are meant for supply of fluid from one sump to another actual observations revealed that 6 m head is sufficient to carry out this activity.
Table 6. Supply pump cost benefit summary
Energy-Saving Measure Investment (Rs.)
Annual Savings (Rs.)
Simple Payback Period (Months)
Expected Lifetime
(operating hours)
Replace supply Pump No. 1 & 2 by single Energy Efficient pump
30000 230000 1.57 14400
Total 30000 230000
Fig. 7 Set up of old and new transfer and supply pumps
OLD PUMP 1
OLD PUMP 2
OLD PUMP3 NEW PUMP IN SUMP
OLDPUMP 2
OLD PUMP 1 NEW PUMP

210 A. Vyas Pareshkumar and V. Bhale Purnanad / Energy Procedia 54 ( 2014 ) 199 – 210
Following table 7 shows summary of implemented energy conservation measures with important cost benefit analysis.
Table 7. Implemented measures summary.
Steps taken
Saving In Units (kWh / Year)
Actual investment
(Rs)
Energy cost saving per year
(Rs)
Pay back (month)
Single Energy efficient pump of 3 HP ; 6 meter head ; 100 m3/hr discharge capacity is installed (supply pump) 41817 30000 230000 1.57
Single mono sub pump of 10 hp ;20 meter head ;100 m3/hr discharge capacity is installed (transfer pump) 53152 35000 292332 1.44
PID controller is installed; Different air pressure setting is set for three different compressors. Air line network rearranged (common header) Automatic moisture drain valve also installed.
134400 180000 821338 2.67
Total 229369 2,45,000 13,43,670
5. Conclusion
Energy conservation implementation program was carried out for Centrifugal pumping system, Air compressor system, as per the management consent and requirement in selected industry. For air compressors volumetric efficiency was found poor and there was a scope for improvement. Similarly, loss due to air leakages is also worked out. So several steps like modification of air distribution work, PID controller with different set points, compressor maintenance work is carried out. This has resulted in annual saving of Rs. 821338. Since efficiency in all supply and transfer pumps observed on lower side, energy efficient pump with proper specifications is installed. This resulted in annual savings of Rs. 2,30,000 and 2,92,332. Hence, total saving of Rs.13,43,670 is achieved with the investment of Rs. 2,45,000. Payback period for above measures was in the range of 1.44 to 2.67 months i.e. less than three months.
Acknowledgements
Authors deeply acknowledge the support provided by the management of the company and Mr. Bharat Patel for his valuable guidance.
References
[1] “energy efficiency plan for SMEs in Gujarat” . Business Standard . mumbai /ahmedabad edition,june 29,2010 .Available online http://www.business-standard.com
[2] “General aspects of energy management and audit” ,Guide book 1 for National Certification Examination for Energy Managers and Auditors, bureau of energy efficiency,india,2005, Available on www.bee-india.nic.in
[3] Kapur Shilpi , Plannet Earth, Fiscal reforms, SMEs hope , Date: 10 October 2011, Available online at at http://www.teriin.org [4] “energy efficiency in electrical utilities” , Guide book 3 for National Certification Examination for Energy Managers and Auditors, bureau of
energy efficiency,india,2005, Available on www.bee-india.nic.in [5] Ali Hasanbeigi, energy- efficiency improvement opportunities for the textile industry.E.O. Lawrence Berkeley National
Laboratory,Washington. DC Resource Dynamics Corporation [6] Facts air distribution.drucklufteffizient. 07 compressed air facts. www.druckluft-effizient.de. [7] Kaya D, Phelan P, Chau D, Sarac HI. Energy conservation in compressed-air systems. International Journal of Energy Research
2002;26:837–49. [8] Galitsky C, Worrell E. Energy efficiency improvement and cost saving opportunities for the vehicle assembly industry. Lawrence Berkeley
National Laboratory 2008 [LBNL-50939-Revision]. [9] U.S. DOE. Minimize compressed air leaks; 2010, Available online at: http://www.energystar.gov/ia [10] Saidur R, Rahim NA, Hasanuzzaman MA, Review on compressed-air energy use and energy savings. Renewable and Sustainable Energy
Reviews 2010;14:1135–53


![Untitled-3 []€¦ · MEMBER OF CAGI Compressed Air & Gas Institute . ' neuron Ei.c E E E E E . Title: Untitled-3 Author: Praveen Narayanan S Created Date](https://img.dokumen.tips/doc/110x75/5f06b8787e708231d4196656/untitled-3-member-of-cagi-compressed-air-gas-institute-neuron-eic.jpg)