Embed Size (px)
Citation preview

Experimental Evidence on Tax Compliance
Gareth D. Myles University of Exeter and Institute for Fiscal Studies Lecture 2 CES, February 2014

LECTURE OUTLINE
This lecture is the second in a series of three on the economics of tax compliance
It explores the experimental approach to understanding tax compliance
The topics covered include: The methodology of experimental economics Evidence from tax compliance experiments Increasing external validity by extending the
pool of subjects
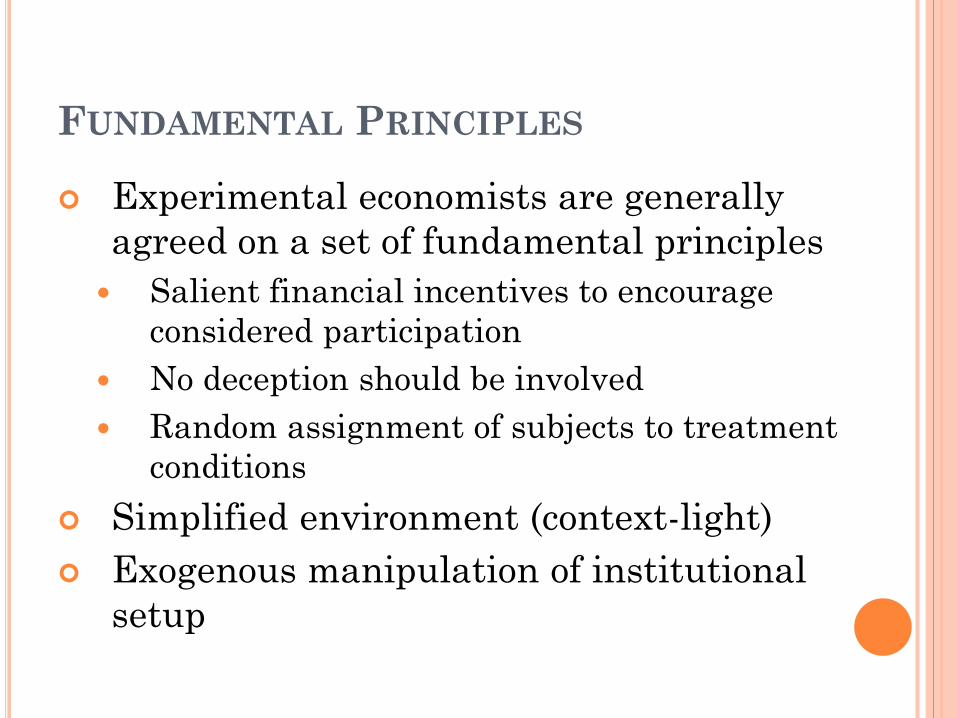
FUNDAMENTAL PRINCIPLES
Experimental economists are generally agreed on a set of fundamental principles Salient financial incentives to encourage
considered participation No deception should be involved Random assignment of subjects to treatment
conditions Simplified environment (context-light) Exogenous manipulation of institutional
setup
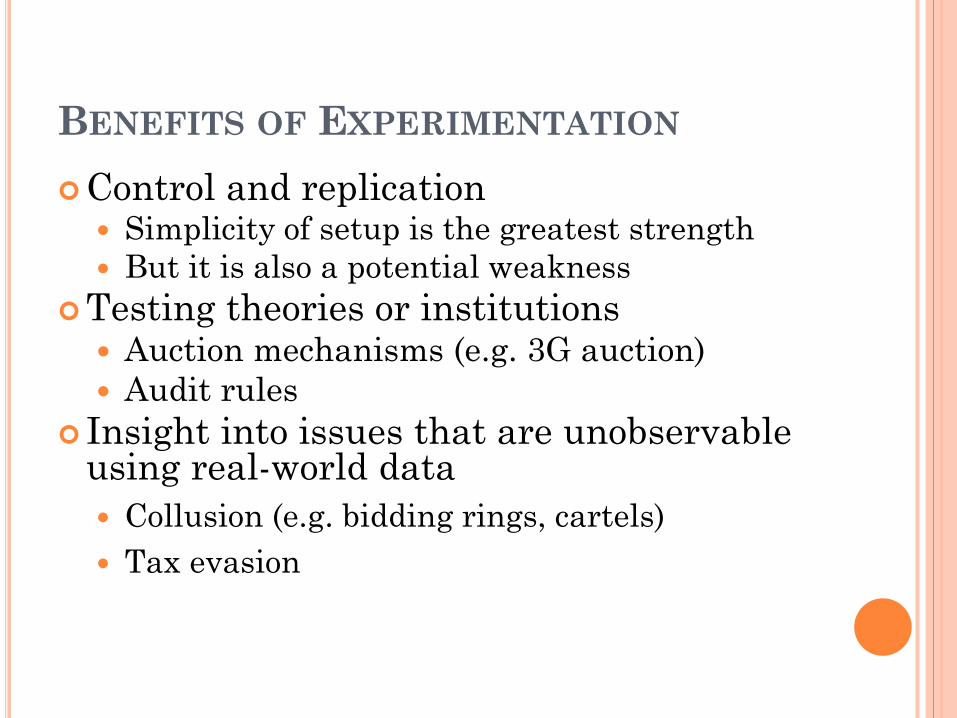
BENEFITS OF EXPERIMENTATION Control and replication
Simplicity of setup is the greatest strength But it is also a potential weakness
Testing theories or institutions Auction mechanisms (e.g. 3G auction) Audit rules
Insight into issues that are unobservable using real-world data Collusion (e.g. bidding rings, cartels) Tax evasion
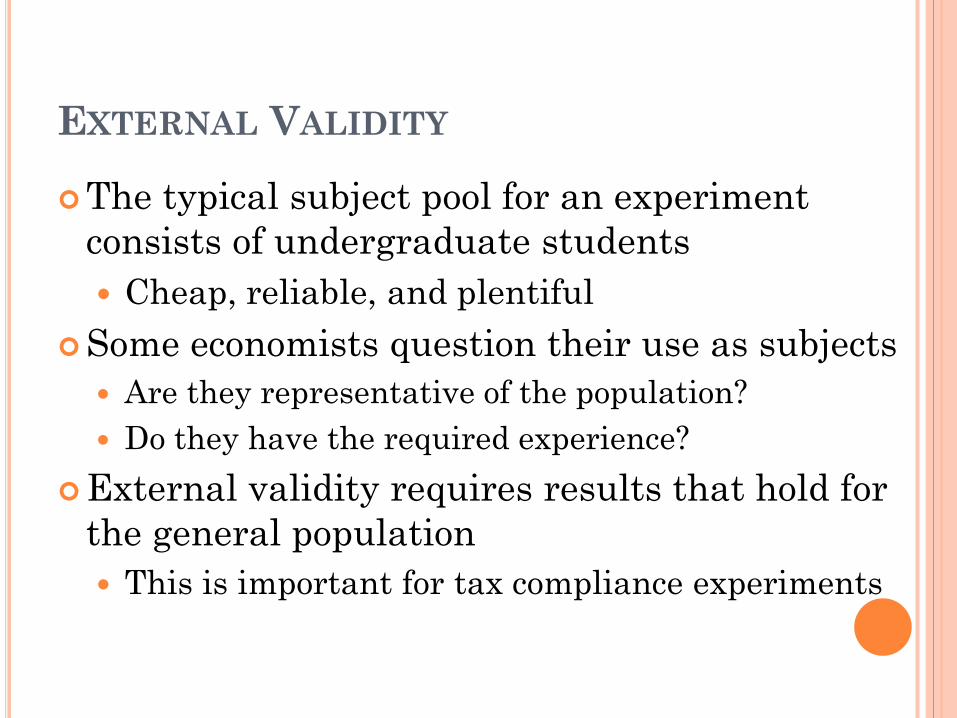
EXTERNAL VALIDITY
The typical subject pool for an experiment consists of undergraduate students Cheap, reliable, and plentiful
Some economists question their use as subjects Are they representative of the population? Do they have the required experience?
External validity requires results that hold for the general population This is important for tax compliance experiments
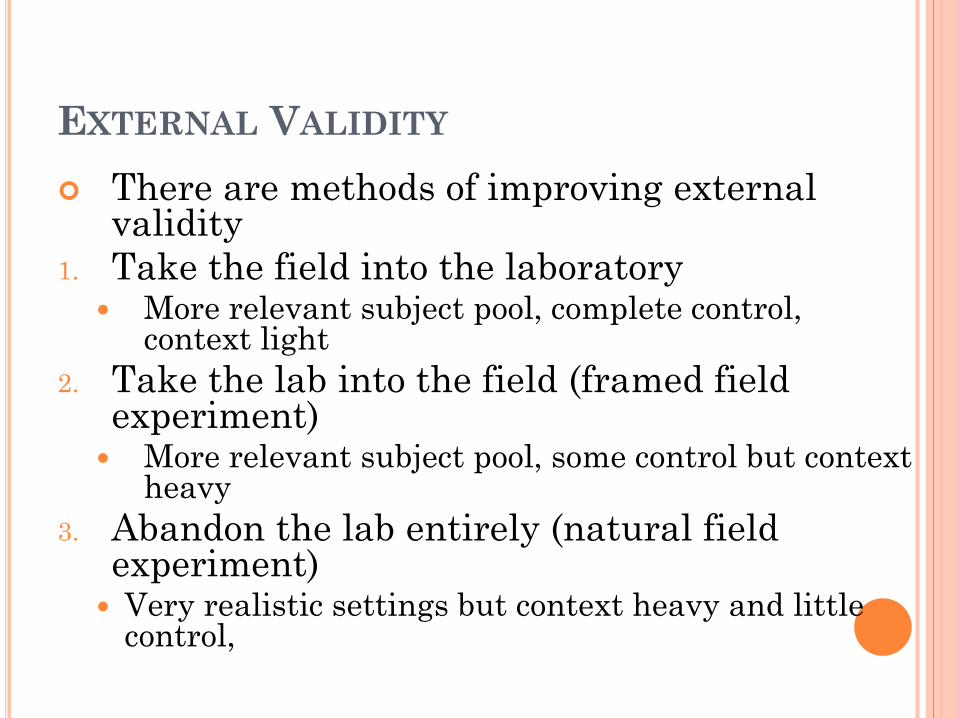
EXTERNAL VALIDITY There are methods of improving external
validity 1. Take the field into the laboratory
More relevant subject pool, complete control, context light
2. Take the lab into the field (framed field experiment) More relevant subject pool, some control but context
heavy 3. Abandon the lab entirely (natural field
experiment) Very realistic settings but context heavy and little
control,
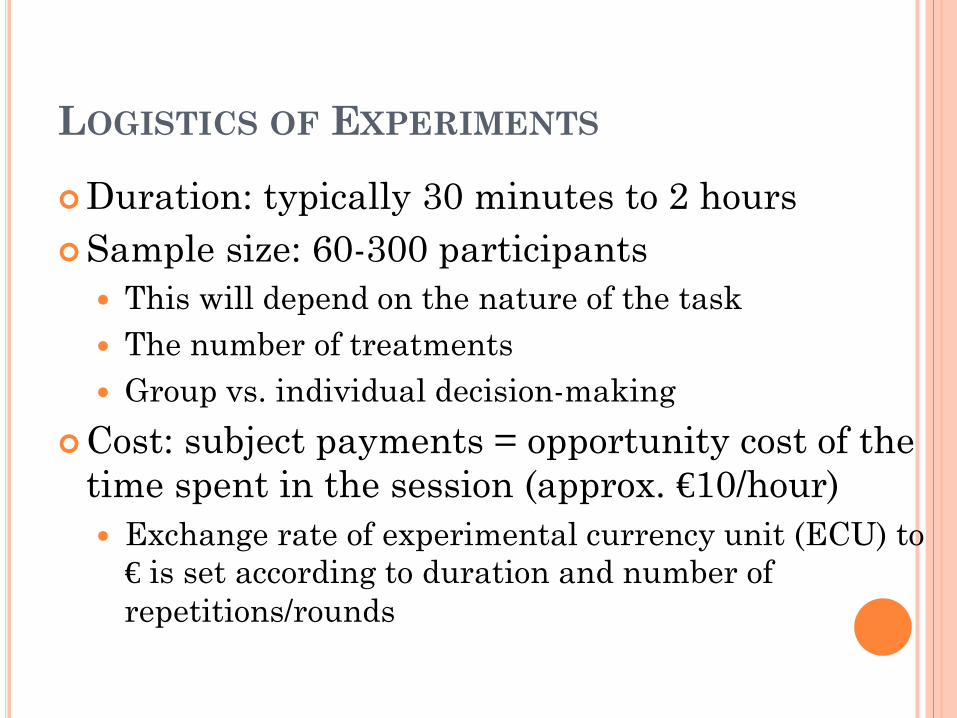
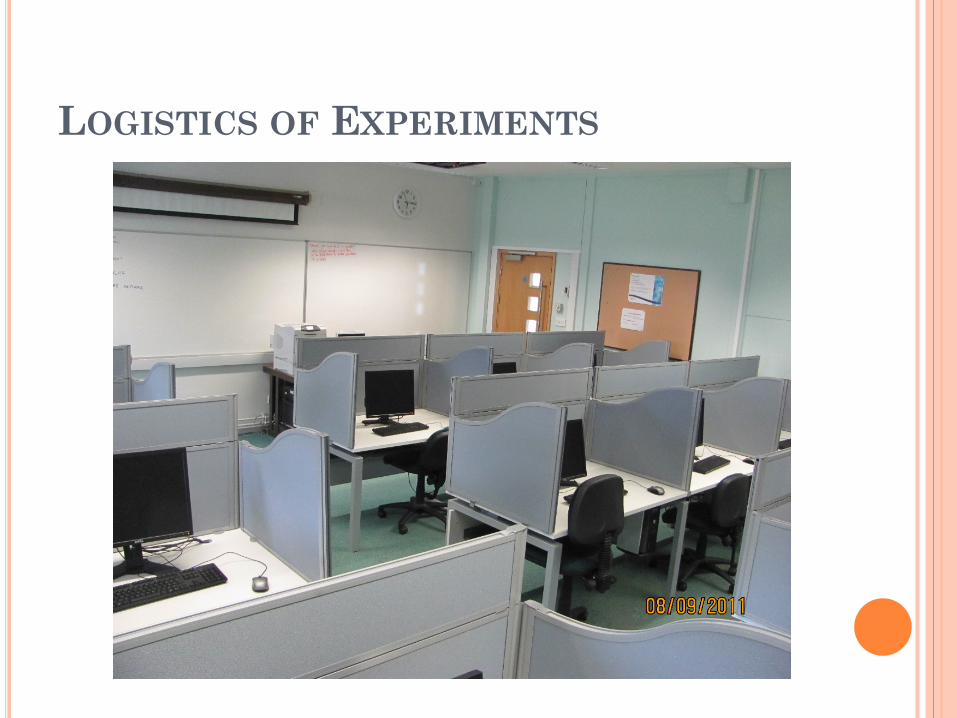
LOGISTICS OF EXPERIMENTS
Duration: typically 30 minutes to 2 hours Sample size: 60-300 participants
This will depend on the nature of the task The number of treatments Group vs. individual decision-making
Cost: subject payments = opportunity cost of the time spent in the session (approx. €10/hour) Exchange rate of experimental currency unit (ECU) to
€ is set according to duration and number of repetitions/rounds
LOGISTICS OF EXPERIMENTS

LOGISTICS OF EXPERIMENTS
Most experiments have been undertaken in laboratories
Some have set in the field We have used laboratory experiments But have also used online experiments Going online allows access to a broader subject
pool But presents technical programming challenges Simultaneity presents special difficulties
COMPLIANCE EXPERIMENTS
Basic framework is the Yitzhaki version of the Allingham and Sandmo model
A taxpayer makes an income tax return which is audited with some fixed probability
If audited the payoff the correct tax payment is paid plus a fine on unpaid tax The fine is proportional to amount undeclared
If not audited the payoff is income less the tax due on original return

COMPLIANCE EXPERIMENTS Taxpayer has income Y but reports income X If caught income is Yc = (1 – t)Y – Ft(Y - X) If not caught income is Yn = Y – tX Expected utility is given by E[U(X)] = pU(Yc) + (1 – p)U(Yn) In experiments utility can be linear so E[U(X)] = (1 – t)Y + tE[1 – p[1+F]]
COMPLIANCE EXPERIMENTS Stage 1: Subjects earn/are given earnings (Y)
Earning your own income substantially changes attitudes (Cherry et al. 2002)
Stage 2: Subjects decide how much to report (X) Given a tax rate t, fine F, and probability of audit, p
Stage 3: Audit occurs If caught, subjects pay appropriate fine
Stage 4: Payoffs are determined and round ends The 4 stages are then repeated for several
rounds
BRIEF SURVEY Main focus has been on effects of t, F, and p Higher p leads to higher compliance
More compliance than predicted by the standard model (subjects overweight p?)
Reported income-audit elasticity in 0.1-0.2 range (Friedland et al. 1978, Beck et al. 1991, Alm et al. 1992, 1993)
Impact is small and non-linear (Alm et al. 1992) Audited individuals report more income post-audit
than non-audited ones. (Spicer and Hero 1985, Webley, 1987)
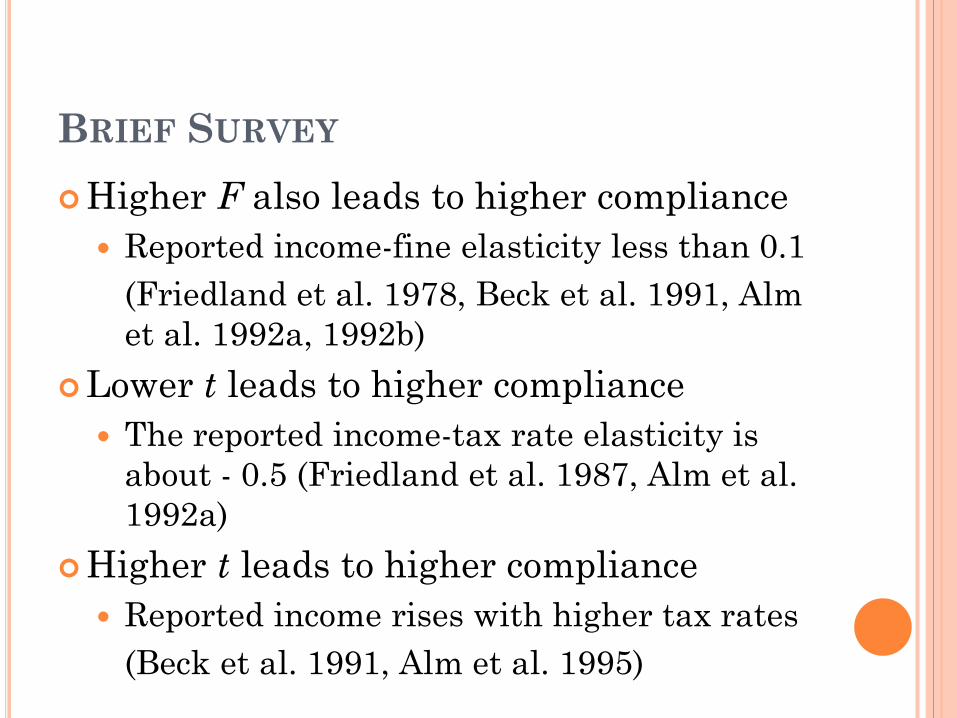
BRIEF SURVEY Higher F also leads to higher compliance
Reported income-fine elasticity less than 0.1 (Friedland et al. 1978, Beck et al. 1991, Alm
et al. 1992a, 1992b) Lower t leads to higher compliance
The reported income-tax rate elasticity is about - 0.5 (Friedland et al. 1987, Alm et al. 1992a)
Higher t leads to higher compliance Reported income rises with higher tax rates (Beck et al. 1991, Alm et al. 1995)

BRIEF SURVEY Uncertainty on p, F or t also affects compliance
Effect linked to public good (Alm et al. 1992a) ‘Cutoff’ audit rules can be more effective than
purely random auditing Collins and Plumlee 1991; Alm et al. 1993
Withholding systems seem not to affect compliance Unexpectedly underwithheld subjects behave no
differently to those who anticipate underwithholding
Behavior of those under- or over-withheld is similar (Martinez-Vazquez et al. 1992)
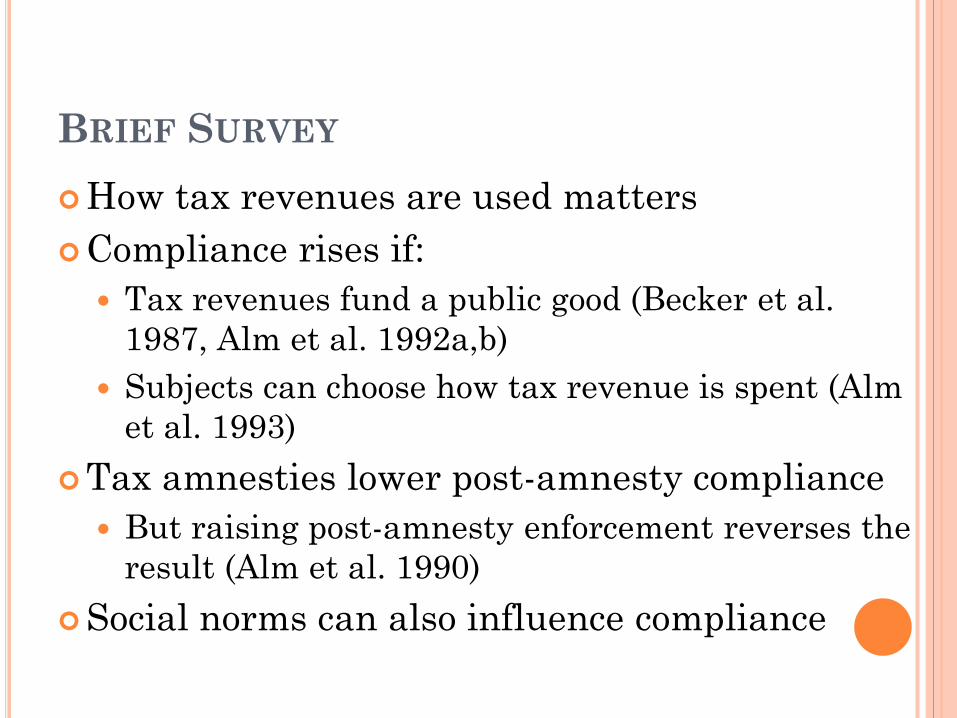
BRIEF SURVEY How tax revenues are used matters Compliance rises if:
Tax revenues fund a public good (Becker et al. 1987, Alm et al. 1992a,b)
Subjects can choose how tax revenue is spent (Alm et al. 1993)
Tax amnesties lower post-amnesty compliance But raising post-amnesty enforcement reverses the
result (Alm et al. 1990) Social norms can also influence compliance
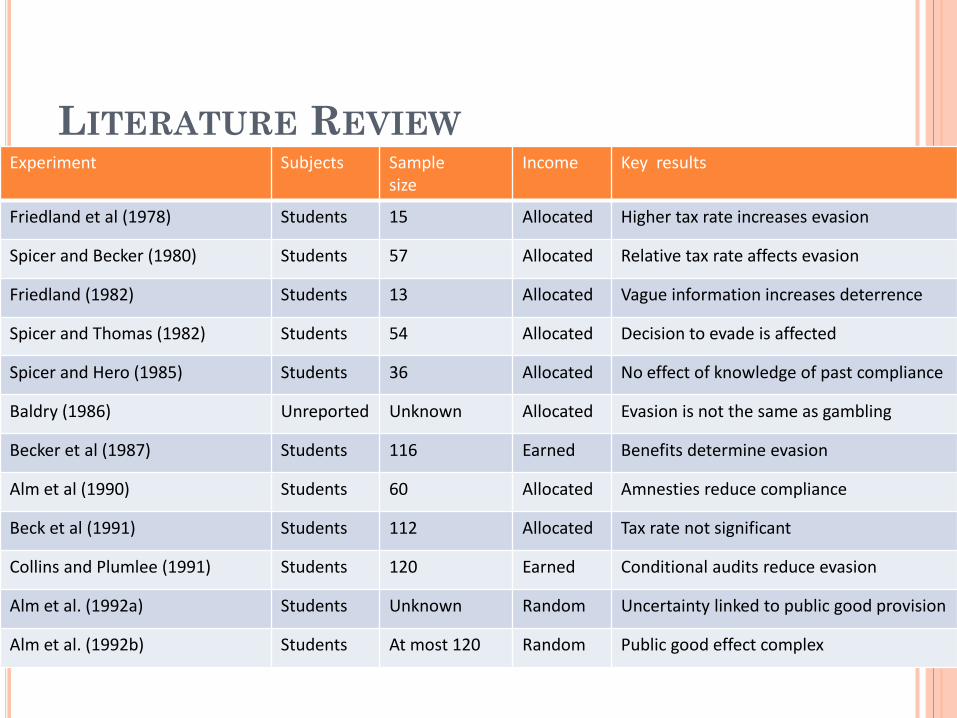
LITERATURE REVIEW Experiment Subjects Sample
size Income Key results
Friedland et al (1978) Students 15 Allocated Higher tax rate increases evasion
Spicer and Becker (1980) Students 57 Allocated Relative tax rate affects evasion
Friedland (1982) Students 13 Allocated Vague information increases deterrence
Spicer and Thomas (1982) Students 54 Allocated Decision to evade is affected
Spicer and Hero (1985) Students 36 Allocated No effect of knowledge of past compliance
Baldry (1986) Unreported Unknown Allocated Evasion is not the same as gambling
Becker et al (1987) Students 116 Earned Benefits determine evasion
Alm et al (1990) Students 60 Allocated Amnesties reduce compliance
Beck et al (1991) Students 112 Allocated Tax rate not significant
Collins and Plumlee (1991) Students 120 Earned Conditional audits reduce evasion
Alm et al. (1992a) Students Unknown Random Uncertainty linked to public good provision
Alm et al. (1992b) Students At most 120 Random Public good effect complex
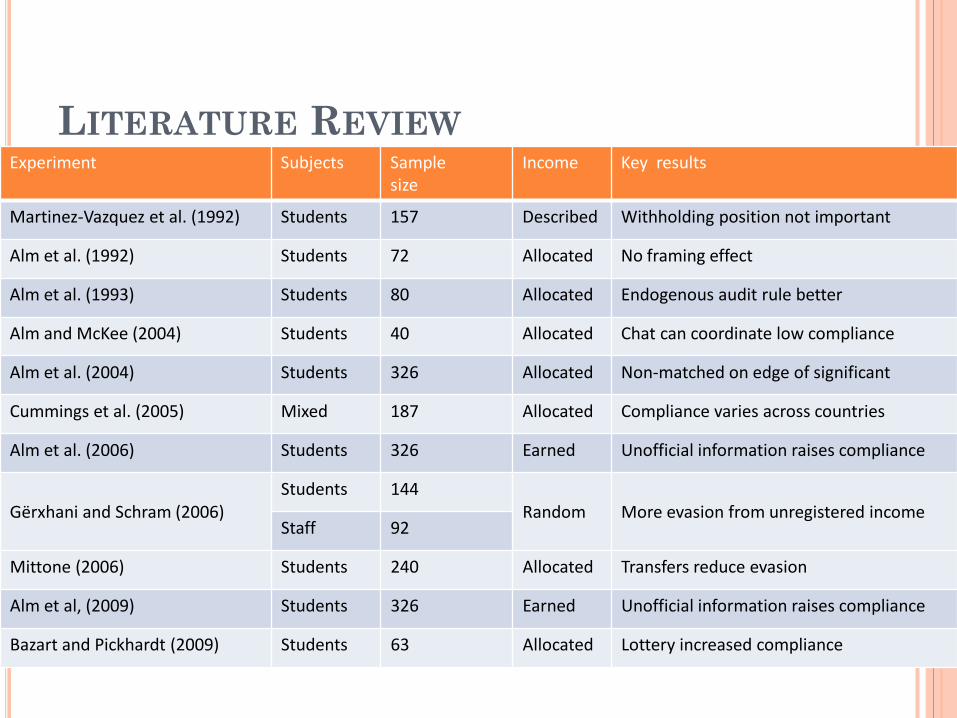
LITERATURE REVIEW Experiment Subjects Sample
size Income Key results
Martinez-Vazquez et al. (1992) Students 157 Described Withholding position not important
Alm et al. (1992) Students 72 Allocated No framing effect
Alm et al. (1993) Students 80 Allocated Endogenous audit rule better
Alm and McKee (2004) Students 40 Allocated Chat can coordinate low compliance
Alm et al. (2004) Students 326 Allocated Non-matched on edge of significant
Cummings et al. (2005) Mixed 187 Allocated Compliance varies across countries
Alm et al. (2006) Students 326 Earned Unofficial information raises compliance
Gërxhani and Schram (2006) Students 144
Random More evasion from unregistered income Staff 92
Mittone (2006) Students 240 Allocated Transfers reduce evasion
Alm et al, (2009) Students 326 Earned Unofficial information raises compliance
Bazart and Pickhardt (2009) Students 63 Allocated Lottery increased compliance
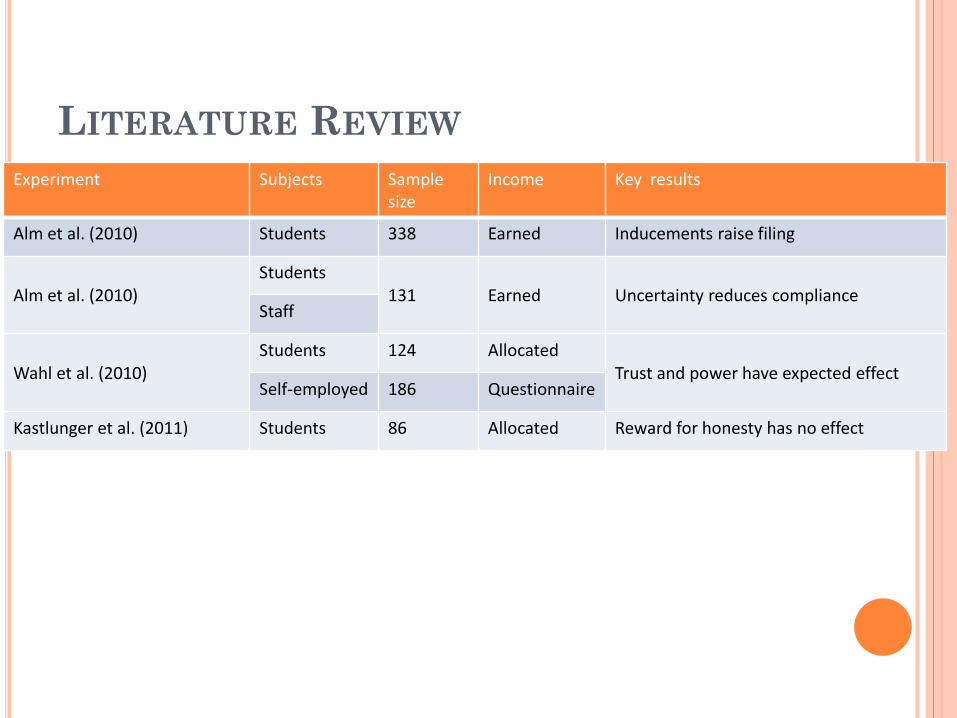
LITERATURE REVIEW Experiment Subjects Sample
size Income Key results
Alm et al. (2010) Students 338 Earned Inducements raise filing
Alm et al. (2010) Students
131 Earned Uncertainty reduces compliance Staff
Wahl et al. (2010) Students 124 Allocated
Trust and power have expected effect Self-employed 186 Questionnaire
Kastlunger et al. (2011) Students 86 Allocated Reward for honesty has no effect
IS TAX EVASION A GAMBLE?
We recently ran a version of Baldry (1986) Participants were enrolled randomly in
one of two experiments In one experiment Part A involved tax
compliance In the other experiment Part A involved a
risky decision (portfolio allocation) For both experiments Part B tested
attitude to risk
IS TAX EVASION A GAMBLE?
What does the model predict about behaviour for tax compliance?
For all sets of parameter it was the case that p < 1/[1 + F]
So the model predicts every participant should have been non-compliant
Non-compliance might vary between participants
But the optimal strategy to maximise expected income is to declare nothing
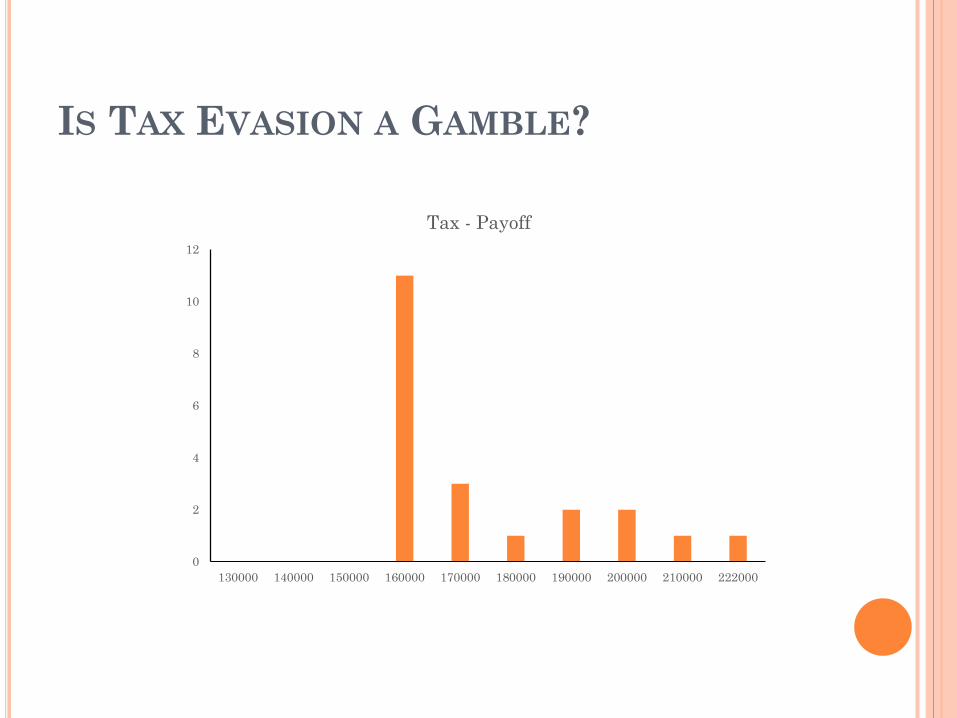
IS TAX EVASION A GAMBLE?
The data did not match these predictions 10 participants out of 21 declared honestly Only 4 declared nothing every time Some participants were partially non-
compliant The choices are summarised in the
histograms that follow

IS TAX EVASION A GAMBLE?
0
2
4
6
8
10
12
10 20 30 40 50 60 70 80 90 100
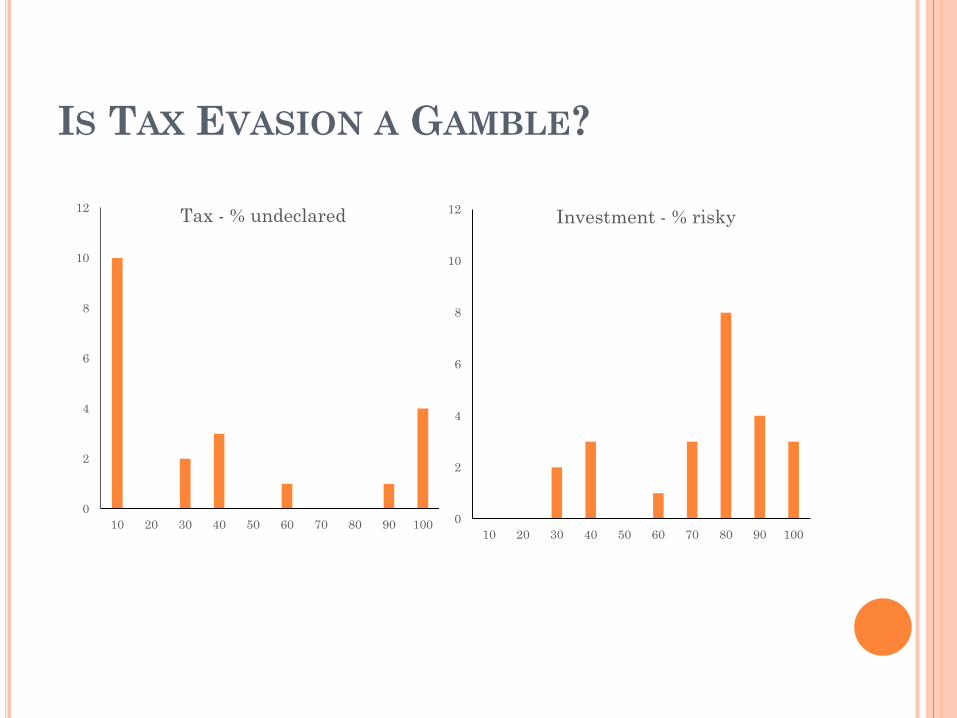
Tax - % undeclared
IS TAX EVASION A GAMBLE?
0
2
4
6
8
10
12
130000 140000 150000 160000 170000 180000 190000 200000 210000 222000
Tax - Payoff
IS TAX EVASION A GAMBLE?
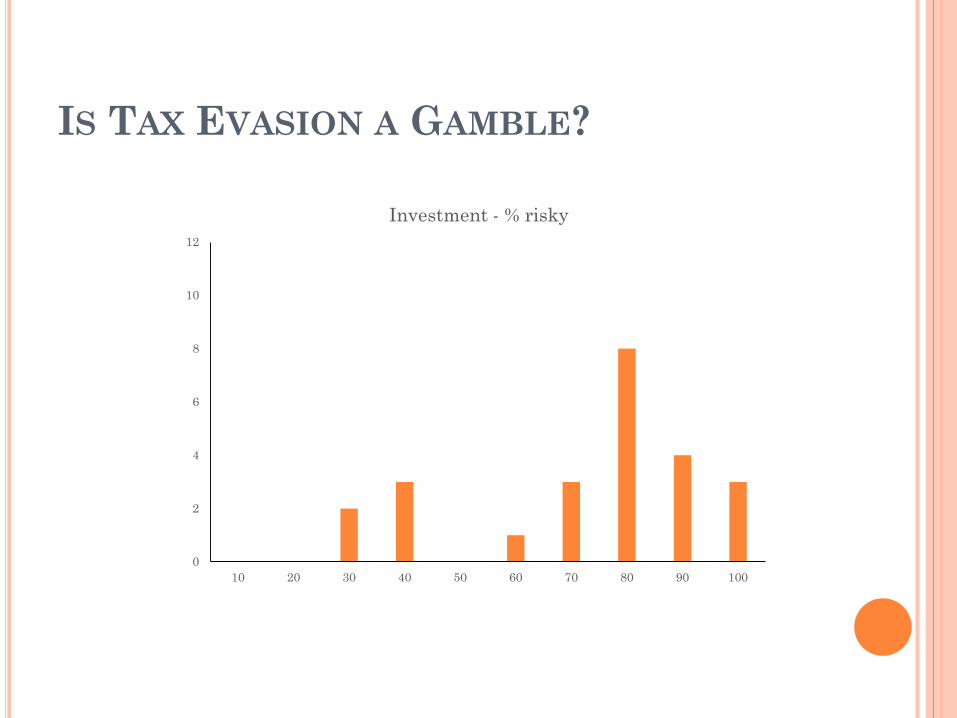
The risky decision involved the allocation of saving to assets in a portfolio
There was a risky asset and a safe asset The payoffs were structured so that the
risky asset was a better-than-fair bet The optimal strategy to maximise
expected income was to put everything into the risky asset
The histograms summarise the responses
IS TAX EVASION A GAMBLE?
0
2
4
6
8
10
12
10 20 30 40 50 60 70 80 90 100
Investment - % risky
IS TAX EVASION A GAMBLE?
0
2
4
6
8
10
12
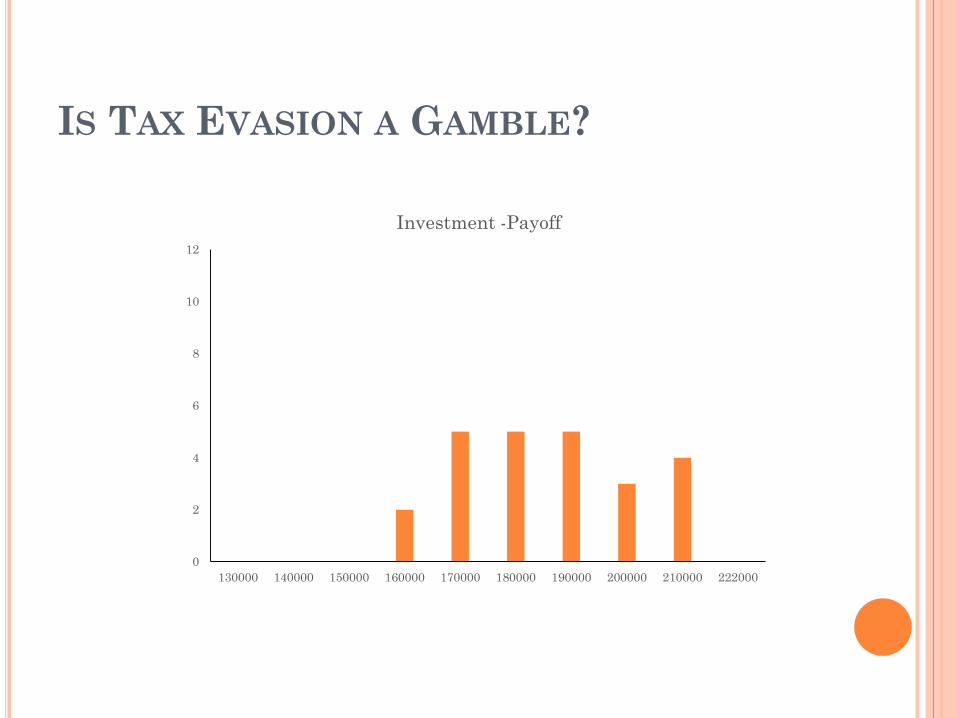
130000 140000 150000 160000 170000 180000 190000 200000 210000 222000
Investment -Payoff
IS TAX EVASION A GAMBLE?
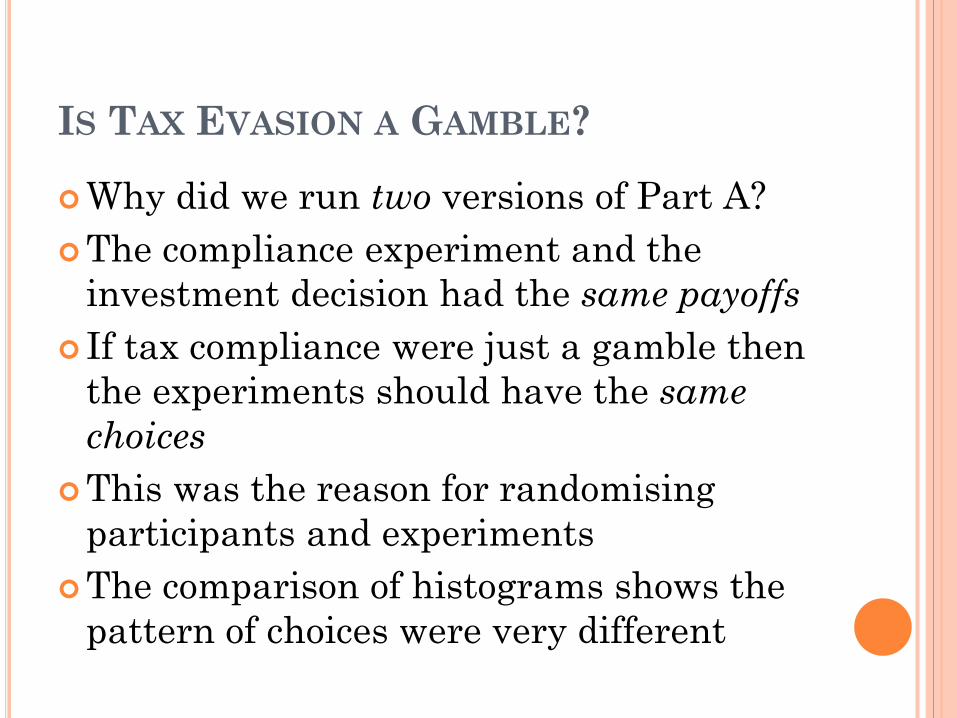
Why did we run two versions of Part A? The compliance experiment and the
investment decision had the same payoffs If tax compliance were just a gamble then
the experiments should have the same choices
This was the reason for randomising participants and experiments
The comparison of histograms shows the pattern of choices were very different
IS TAX EVASION A GAMBLE?
0
2
4
6
8
10
12
10 20 30 40 50 60 70 80 90 100
Tax - % undeclared
0
2
4
6
8
10
12
10 20 30 40 50 60 70 80 90 100
Investment - % risky
0
1
2
3
4
5
6
7
8
9
10
0 1 2 3 4 5 6 7 8 9 10 11
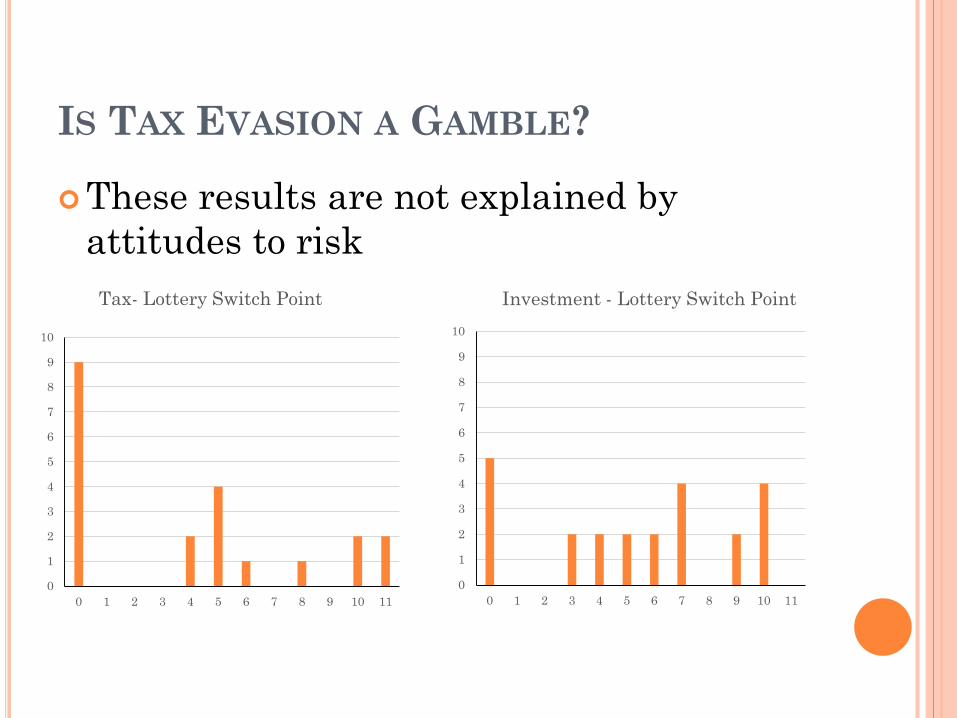
Tax- Lottery Switch Point
IS TAX EVASION A GAMBLE?
These results are not explained by attitudes to risk
0
1
2
3
4
5
6
7
8
9
10
0 1 2 3 4 5 6 7 8 9 10 11
Investment - Lottery Switch Point
IS TAX EVASION A GAMBLE?
This experiment on framing was first reported by Baldry in 1986
It always works! He concluded from the results that tax
compliance was not just a gamble The comparison between the results
shows that the orthodox analysis is not adequate
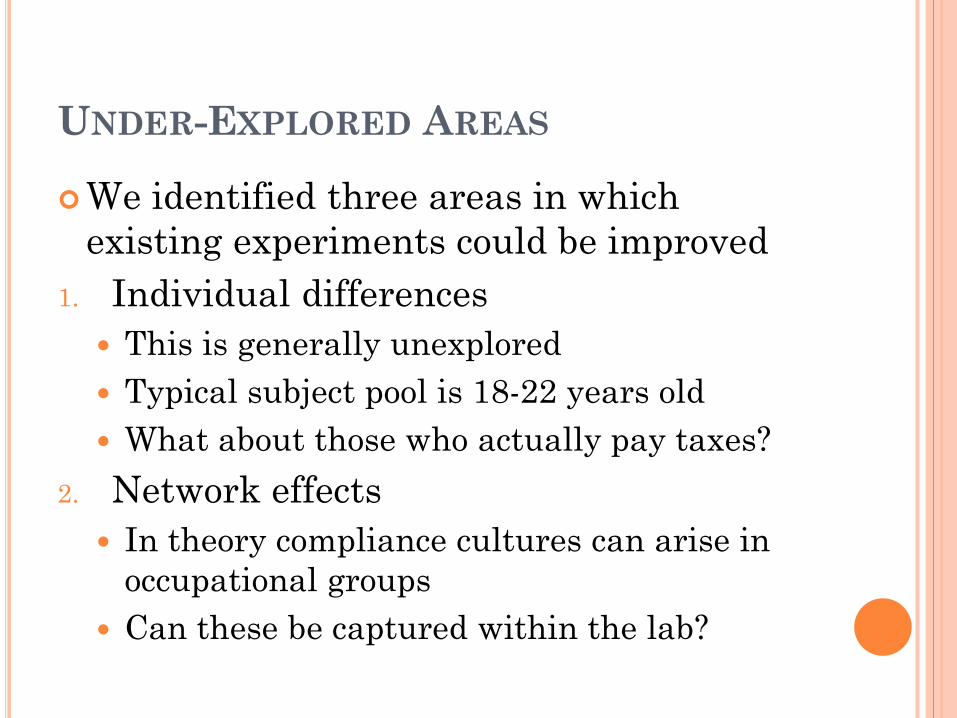
UNDER-EXPLORED AREAS
We identified three areas in which existing experiments could be improved
1. Individual differences This is generally unexplored Typical subject pool is 18-22 years old What about those who actually pay taxes?
2. Network effects In theory compliance cultures can arise in
occupational groups Can these be captured within the lab?
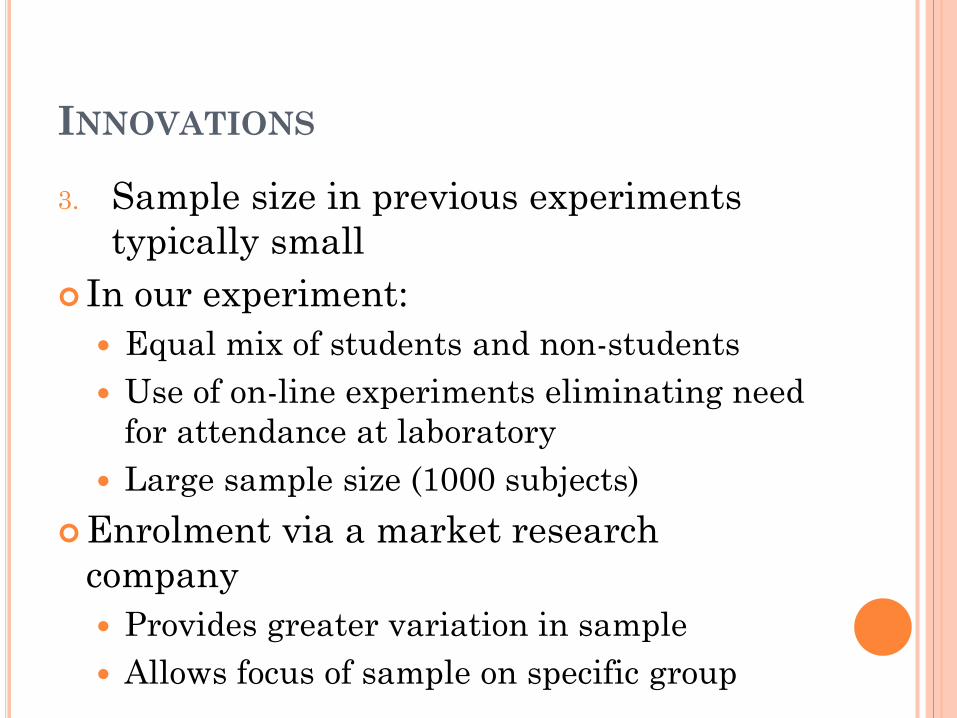
INNOVATIONS
3. Sample size in previous experiments typically small
In our experiment: Equal mix of students and non-students Use of on-line experiments eliminating need
for attendance at laboratory Large sample size (1000 subjects)
Enrolment via a market research company Provides greater variation in sample Allows focus of sample on specific group
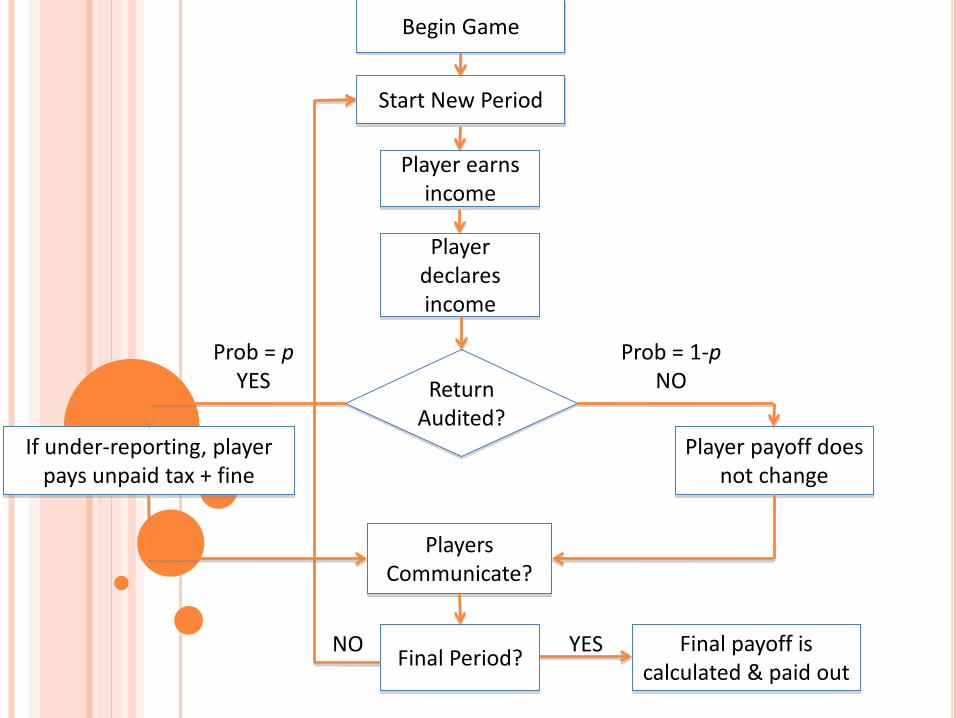
Begin Game
Start New Period
Player earns income
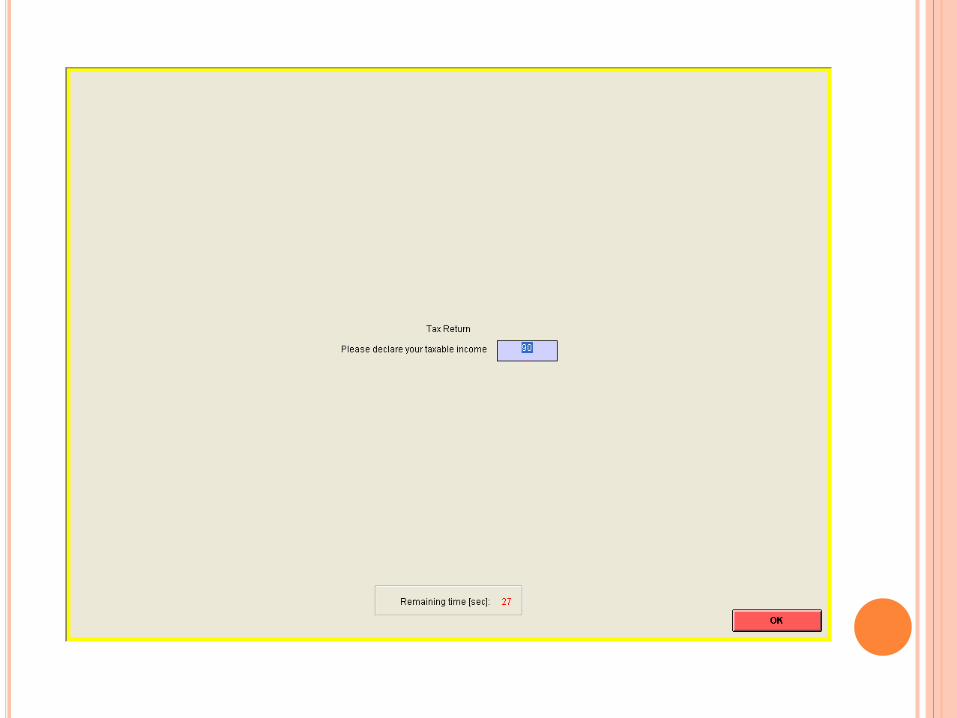
Player declares income
Return Audited?
If under-reporting, player pays unpaid tax + fine
Player payoff does not change
Players Communicate?
Final Period? Final payoff is calculated & paid out
YES NO
Prob = p YES
Prob = 1-p NO
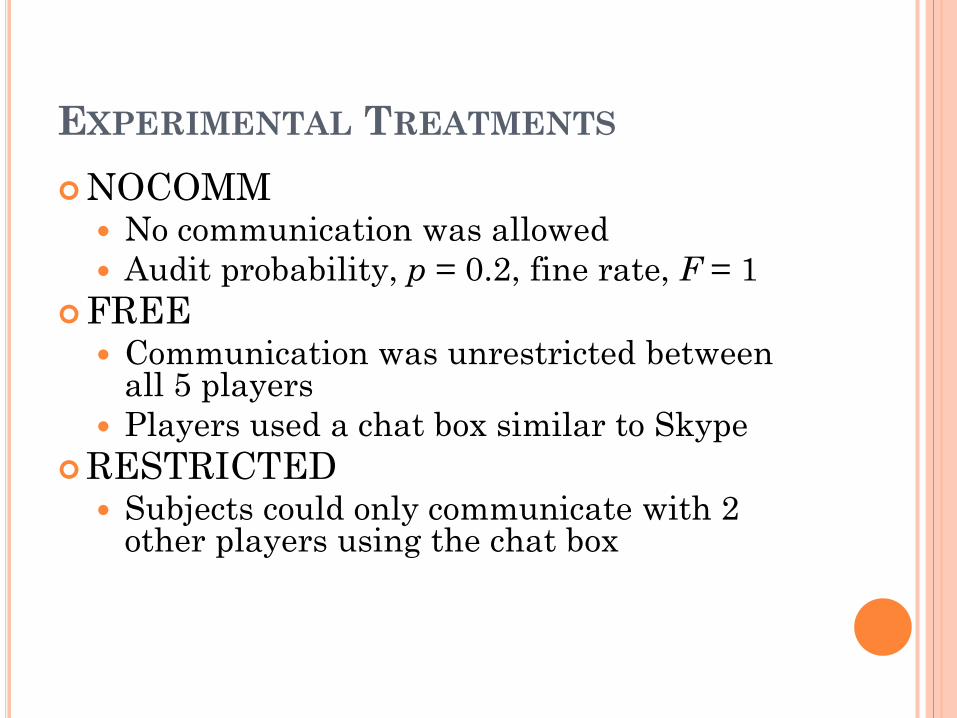
EXPERIMENTAL TREATMENTS NOCOMM
No communication was allowed Audit probability, p = 0.2, fine rate, F = 1
FREE Communication was unrestricted between
all 5 players Players used a chat box similar to Skype
RESTRICTED Subjects could only communicate with 2
other players using the chat box

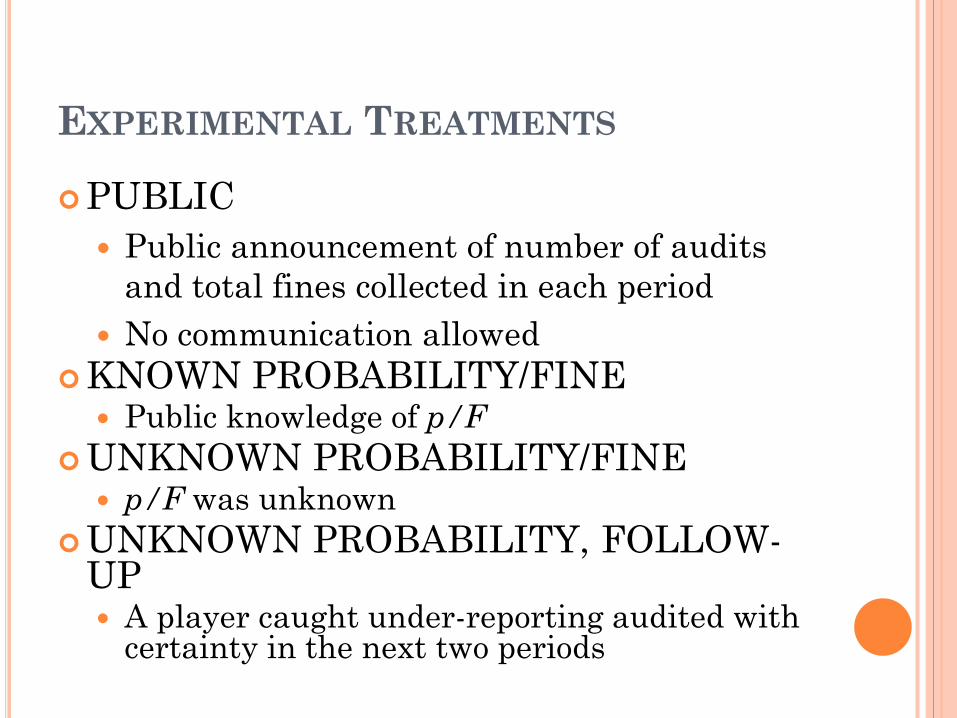
EXPERIMENTAL TREATMENTS
PUBLIC Public announcement of number of audits
and total fines collected in each period No communication allowed
KNOWN PROBABILITY/FINE Public knowledge of p/F
UNKNOWN PROBABILITY/FINE p/F was unknown
UNKNOWN PROBABILITY, FOLLOW-UP A player caught under-reporting audited with
certainty in the next two periods
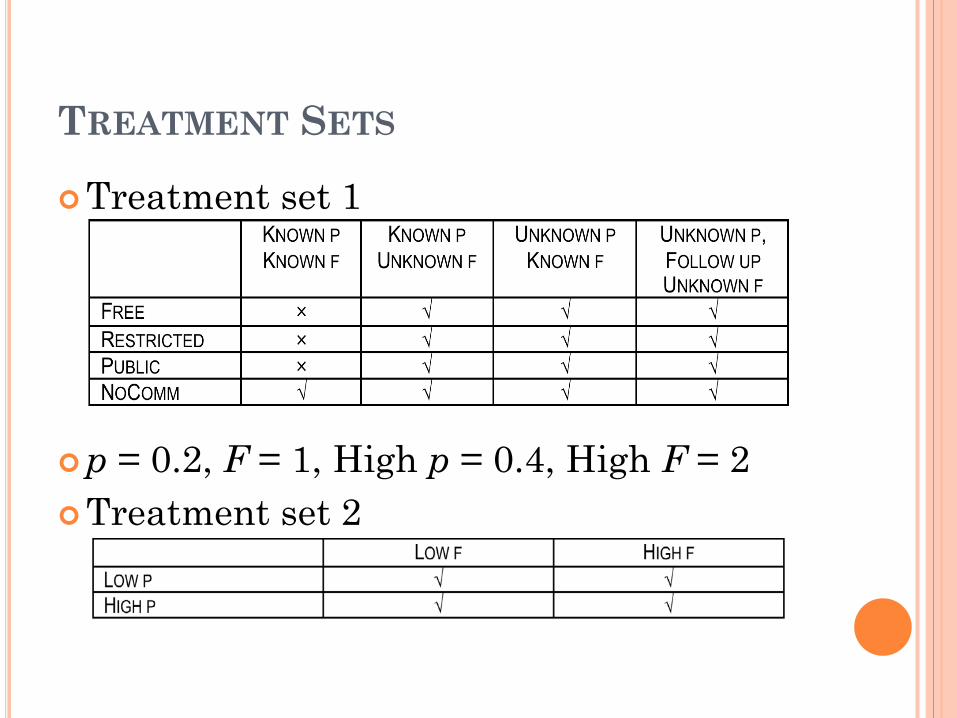
TREATMENT SETS
Treatment set 1
p = 0.2, F = 1, High p = 0.4, High F = 2 Treatment set 2
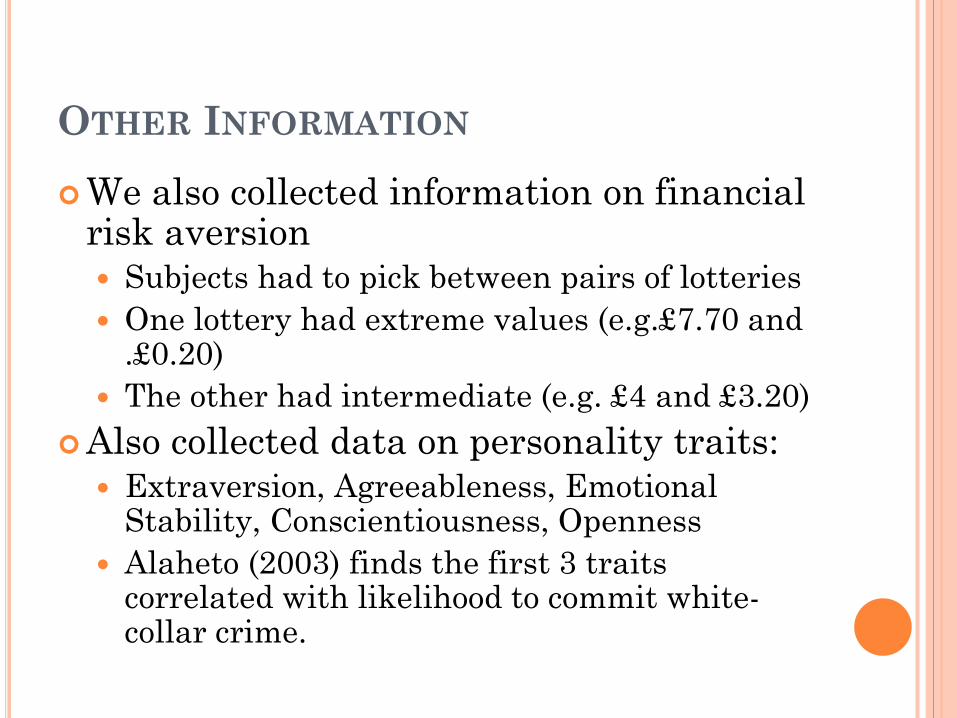
OTHER INFORMATION We also collected information on financial
risk aversion Subjects had to pick between pairs of lotteries One lottery had extreme values (e.g.£7.70 and
.£0.20) The other had intermediate (e.g. £4 and £3.20)
Also collected data on personality traits: Extraversion, Agreeableness, Emotional
Stability, Conscientiousness, Openness Alaheto (2003) finds the first 3 traits
correlated with likelihood to commit white-collar crime.
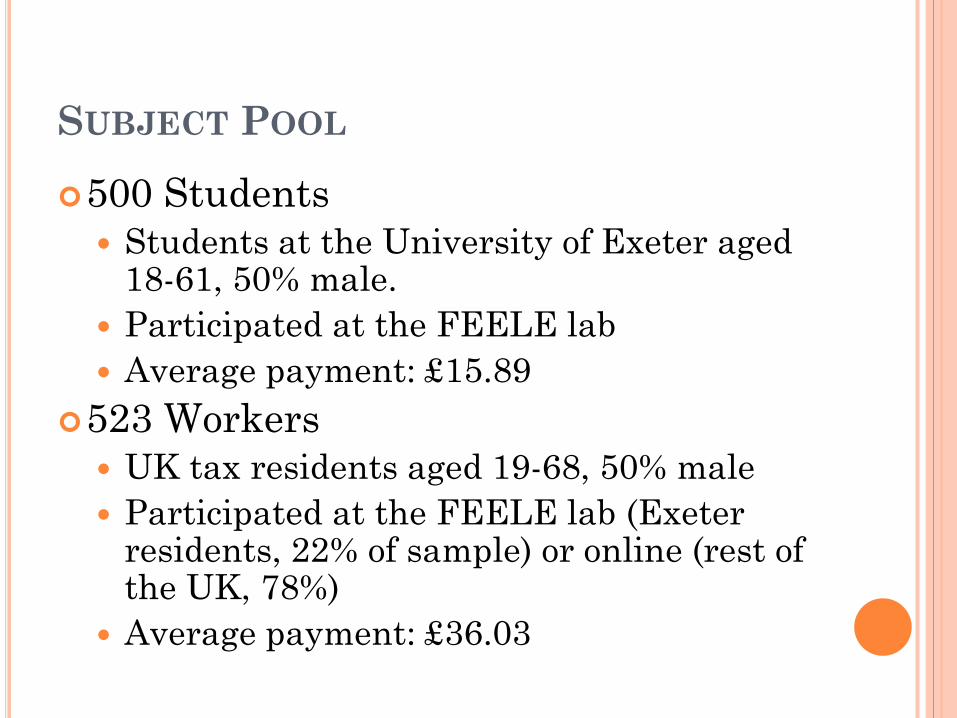
SUBJECT POOL 500 Students
Students at the University of Exeter aged 18-61, 50% male.
Participated at the FEELE lab Average payment: £15.89
523 Workers UK tax residents aged 19-68, 50% male Participated at the FEELE lab (Exeter
residents, 22% of sample) or online (rest of the UK, 78%)
Average payment: £36.03
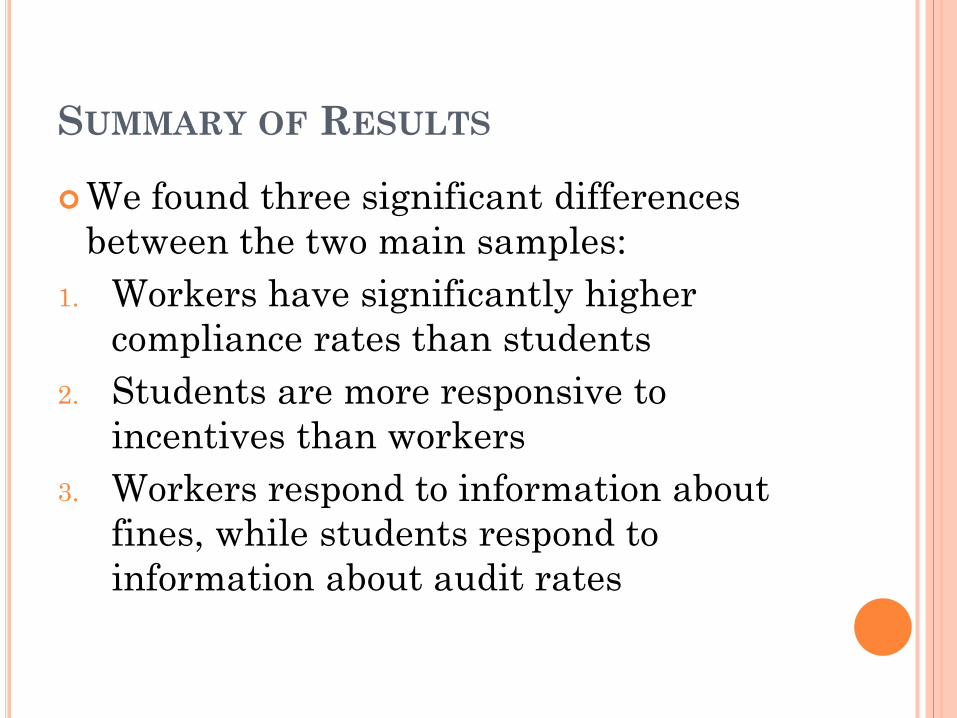
SUMMARY OF RESULTS
We found three significant differences between the two main samples:
1. Workers have significantly higher compliance rates than students
2. Students are more responsive to incentives than workers
3. Workers respond to information about fines, while students respond to information about audit rates

SUMMARY OF RESULTS
Social networks had very little impact on compliance but weak evidence that communication led to a higher rate of tax compliance among workers
Publicising aggregated information about evaders has no significant effect on compliance by workers or students
A known audit rate causes non-complying students to declare a lower proportion of their income but has no effect on worker compliance behaviour
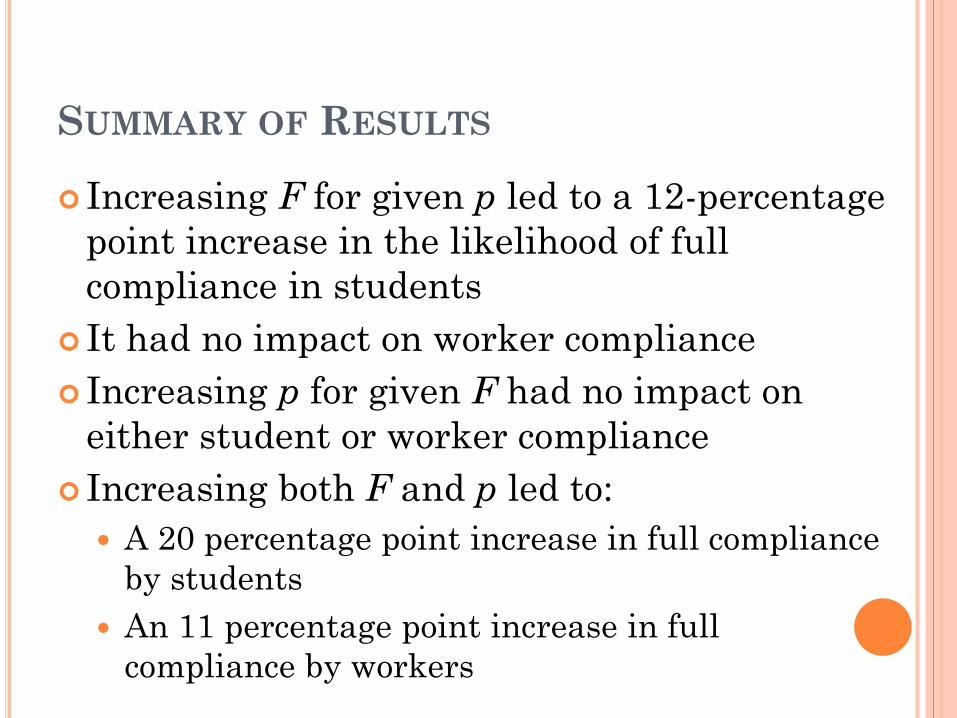
SUMMARY OF RESULTS
Increasing F for given p led to a 12-percentage point increase in the likelihood of full compliance in students
It had no impact on worker compliance Increasing p for given F had no impact on
either student or worker compliance Increasing both F and p led to:
A 20 percentage point increase in full compliance by students
An 11 percentage point increase in full compliance by workers
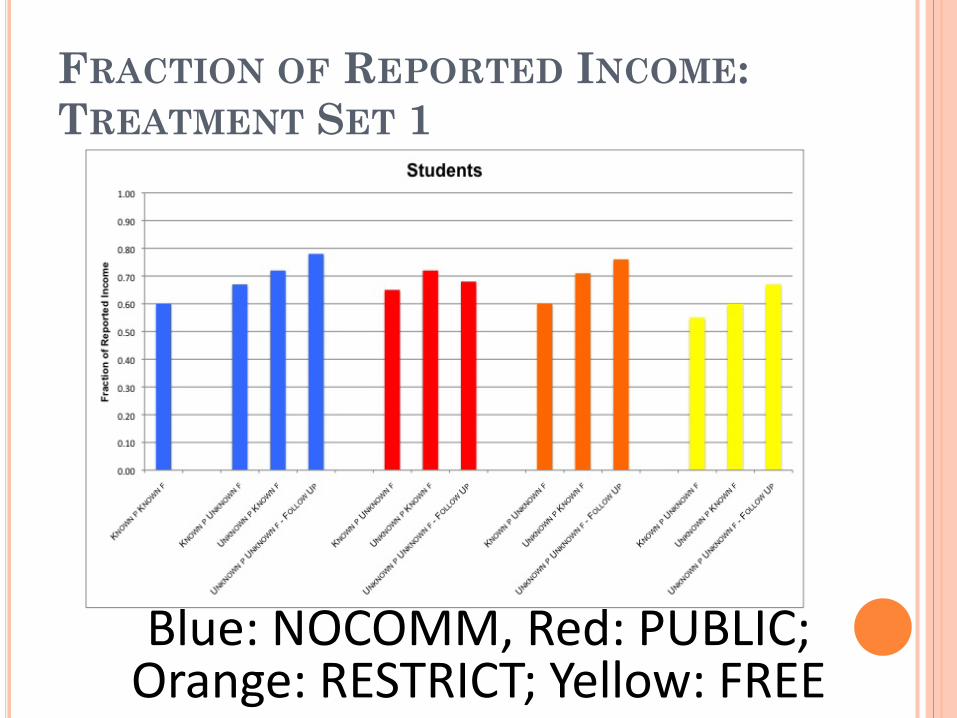
FRACTION OF REPORTED INCOME: TREATMENT SET 1
Blue: NOCOMM, Red: PUBLIC; Orange: RESTRICT; Yellow: FREE

FRACTION OF REPORTED INCOME: TREATMENT SET 1
Blue: NOCOMM, Red: PUBLIC; Orange: RESTRICT; Yellow: FREE

EFFECT OF CHANGING THE FINE SIZE AND THE AUDIT RATE
0,00
0,10
0,20
0,30
0,40
0,50
0,60
0,70
0,80
0,90
1,00
KNOWN P KNOWN F HIGH P LOW F LOW P HIGH F HIGH P HIGH F
Frac
tion
of R
epor
ted
Inco
me
Students
Workers
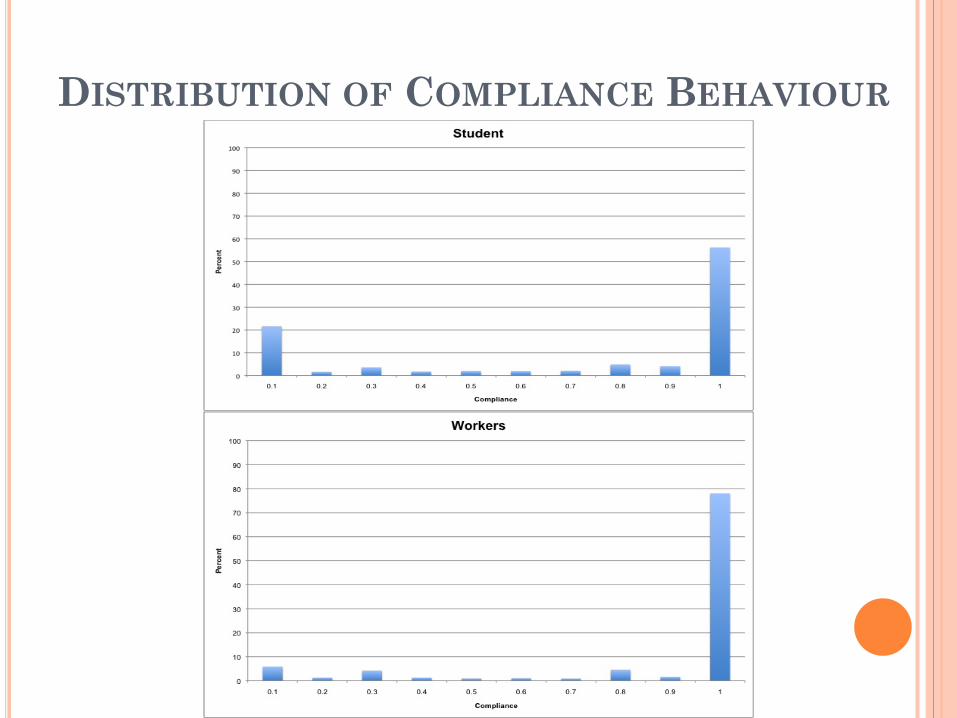
DISTRIBUTION OF COMPLIANCE BEHAVIOUR
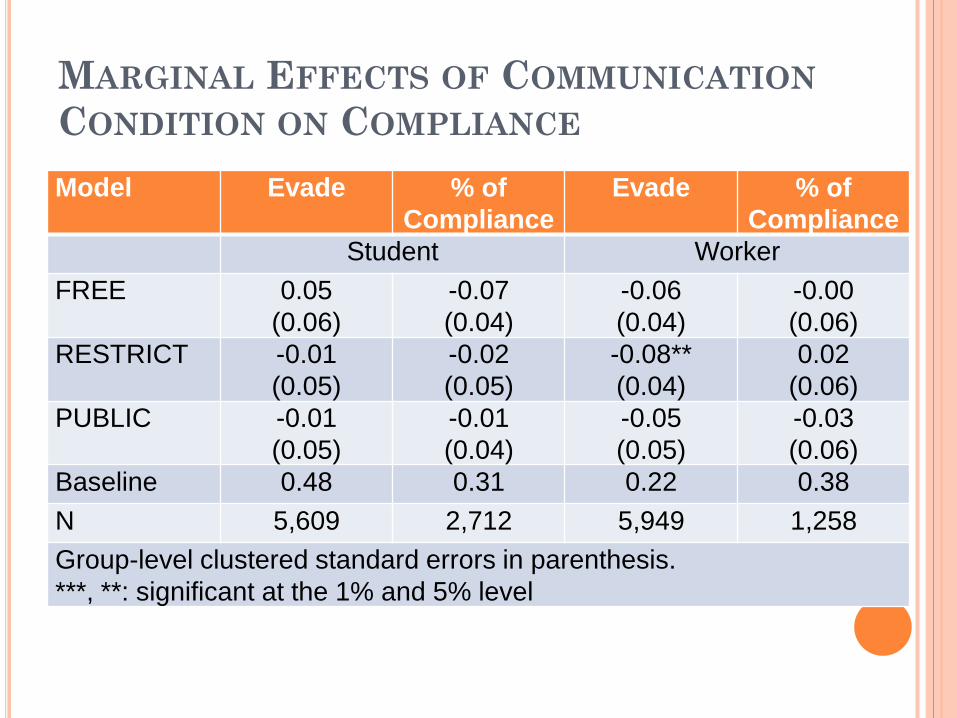
MARGINAL EFFECTS OF COMMUNICATION CONDITION ON COMPLIANCE Model Evade % of
Compliance Evade % of
Compliance Student Worker
FREE 0.05 (0.06)
-0.07 (0.04)
-0.06 (0.04)
-0.00 (0.06)
RESTRICT -0.01 (0.05)
-0.02 (0.05)
-0.08** (0.04)
0.02 (0.06)
PUBLIC -0.01 (0.05)
-0.01 (0.04)
-0.05 (0.05)
-0.03 (0.06)
Baseline 0.48 0.31 0.22 0.38 N 5,609 2,712 5,949 1,258 Group-level clustered standard errors in parenthesis. ***, **: significant at the 1% and 5% level
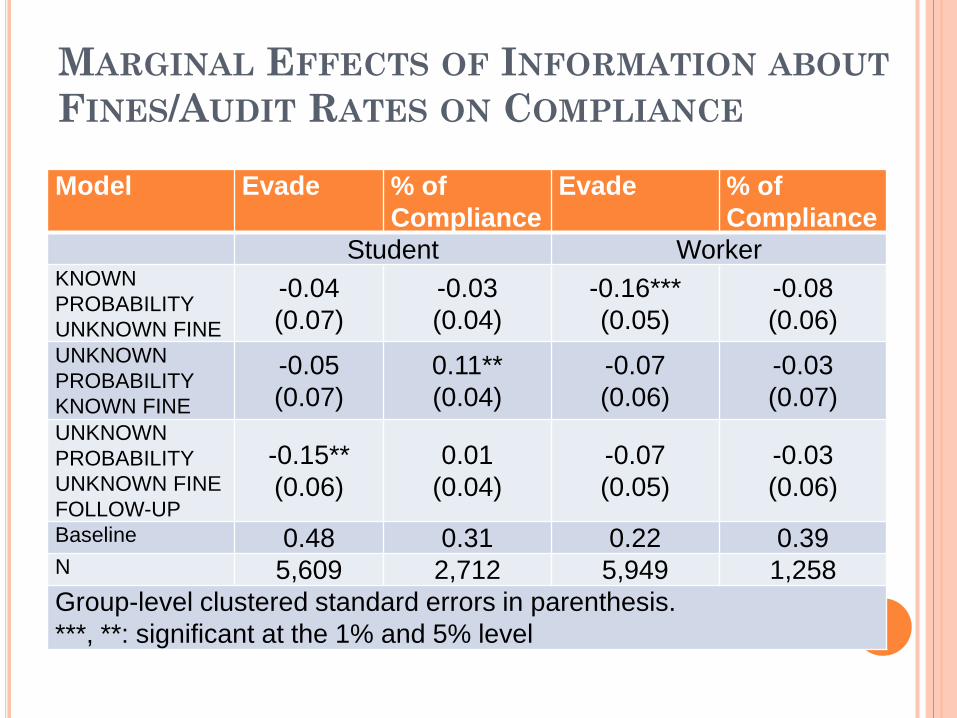
MARGINAL EFFECTS OF INFORMATION ABOUT FINES/AUDIT RATES ON COMPLIANCE
Model Evade % of Compliance
Evade % of Compliance
Student Worker KNOWN PROBABILITY UNKNOWN FINE
-0.04 (0.07)
-0.03 (0.04)
-0.16*** (0.05)
-0.08 (0.06)
UNKNOWN PROBABILITY KNOWN FINE
-0.05 (0.07)
0.11** (0.04)
-0.07 (0.06)
-0.03 (0.07)
UNKNOWN PROBABILITY UNKNOWN FINE FOLLOW-UP
-0.15** (0.06)
0.01 (0.04)
-0.07 (0.05)
-0.03 (0.06)
Baseline 0.48 0.31 0.22 0.39 N 5,609 2,712 5,949 1,258 Group-level clustered standard errors in parenthesis. ***, **: significant at the 1% and 5% level
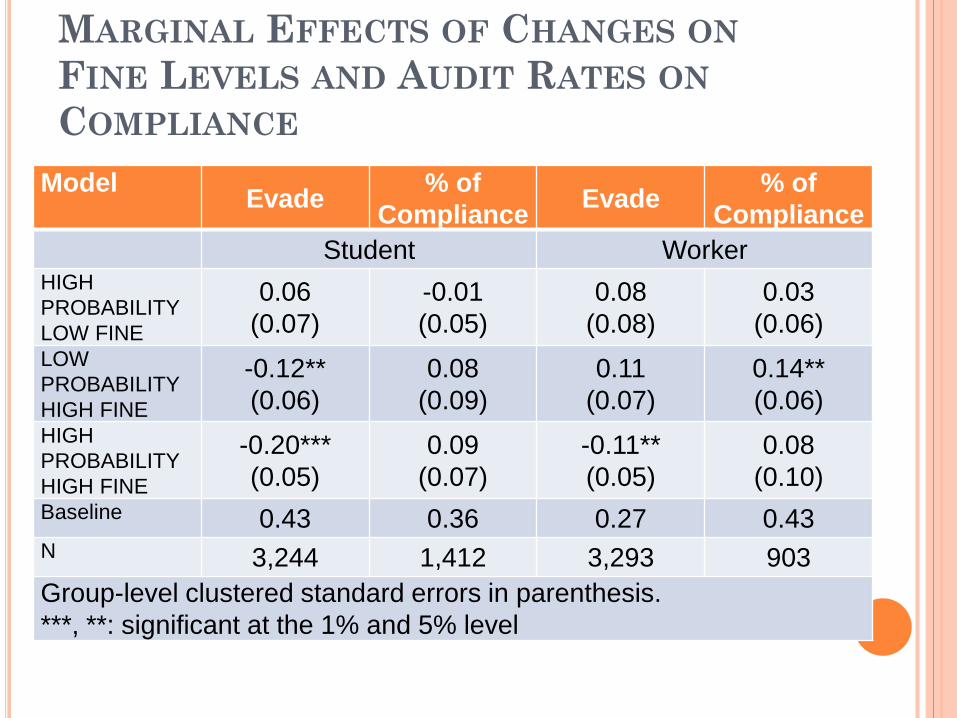
MARGINAL EFFECTS OF CHANGES ON FINE LEVELS AND AUDIT RATES ON COMPLIANCE
Model Evade % of Compliance Evade % of
Compliance Student Worker
HIGH PROBABILITY LOW FINE
0.06 (0.07)
-0.01 (0.05)
0.08 (0.08)
0.03 (0.06)
LOW PROBABILITY HIGH FINE
-0.12** (0.06)
0.08 (0.09)
0.11 (0.07)
0.14** (0.06)
HIGH PROBABILITY HIGH FINE
-0.20*** (0.05)
0.09 (0.07)
-0.11** (0.05)
0.08 (0.10)
Baseline 0.43 0.36 0.27 0.43 N 3,244 1,412 3,293 903 Group-level clustered standard errors in parenthesis. ***, **: significant at the 1% and 5% level
OTHER FACTORS AFFECTING COMPLIANCE
1 extra ECU in taxable income resulted in a 0.5 (0.6) percentage point increase in declared income by workers (students)
Being audited but not caught in a given period significantly reduced the likelihood of evasion in the subsequent period 12 percentage points for students 7 percentage points for workers
OTHER FACTORS AFFECTING COMPLIANCE
Subjects audited and caught were more likely to evade in the following period than those who were audited and not caught because they had fully declared their income
The same applies to those audited and caught in the first five periods of the experiment
Risk aversion was not a significant predictor of tax compliance
IMPLICATIONS
Results support the behavioural perspective that individuals act on a subjective probability
A similar argument explains why awareness of the audit rate does not affect compliance behaviour
A joint increase of the audit rate and the fine rate was effective perhaps because of credibility
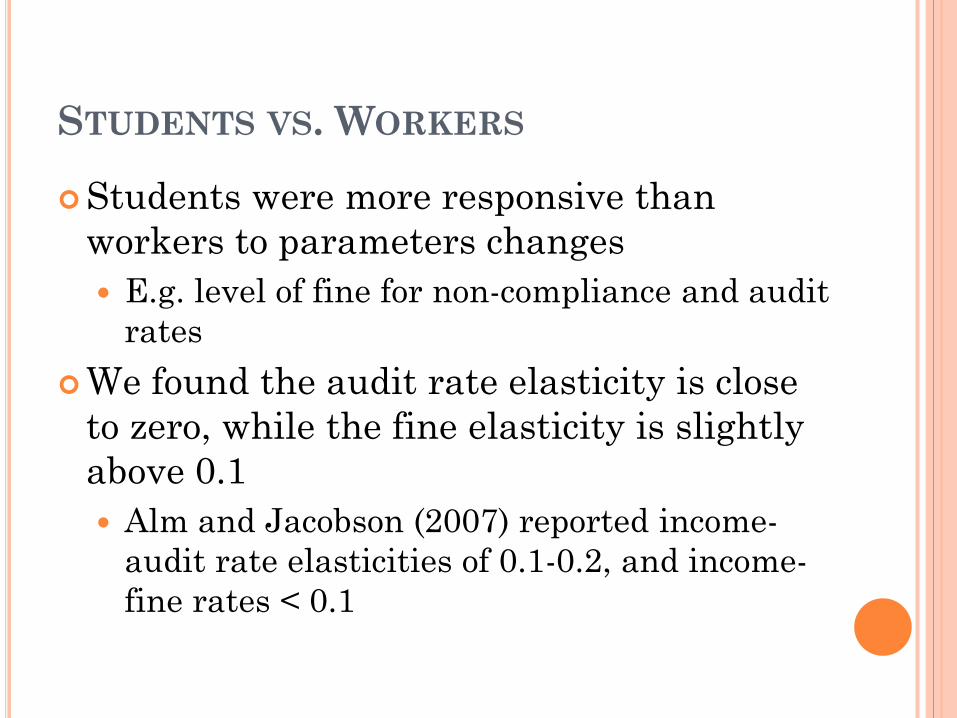
STUDENTS VS. WORKERS
Students were more responsive than workers to parameters changes E.g. level of fine for non-compliance and audit
rates We found the audit rate elasticity is close
to zero, while the fine elasticity is slightly above 0.1 Alm and Jacobson (2007) reported income-
audit rate elasticities of 0.1-0.2, and income-fine rates < 0.1

STUDENTS VS. WORKERS
Workers have a higher compliance rate in the experiment than students…
… but students are more responsive to the incentives than workers
Workers respond to changes in information about the fine rate…
… students respond to changes in information about the audit rate
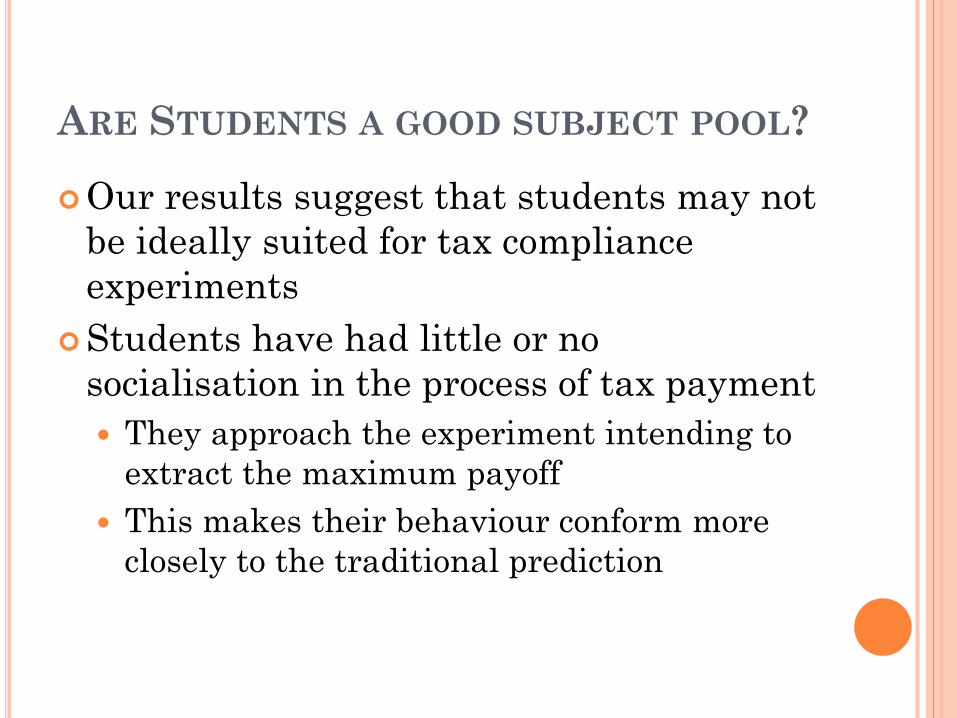
ARE STUDENTS A GOOD SUBJECT POOL?
Our results suggest that students may not be ideally suited for tax compliance experiments
Students have had little or no socialisation in the process of tax payment They approach the experiment intending to
extract the maximum payoff This makes their behaviour conform more
closely to the traditional prediction
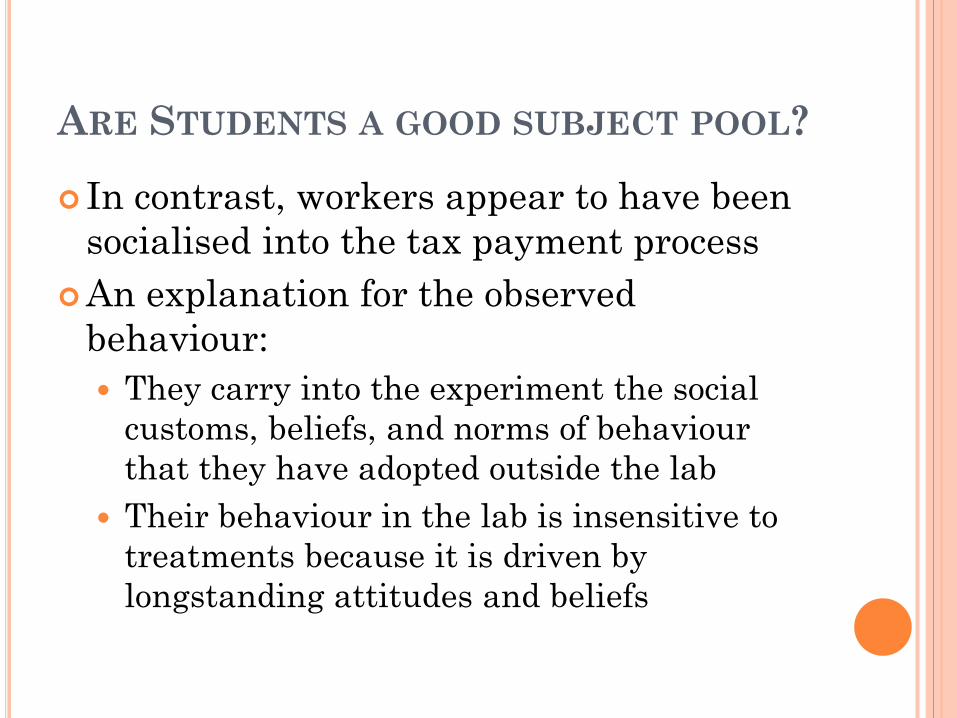
ARE STUDENTS A GOOD SUBJECT POOL?
In contrast, workers appear to have been socialised into the tax payment process
An explanation for the observed behaviour: They carry into the experiment the social
customs, beliefs, and norms of behaviour that they have adopted outside the lab
Their behaviour in the lab is insensitive to treatments because it is driven by longstanding attitudes and beliefs

CONCLUSIONS
Experiments can test theories and generate data
Good design is critical for success External validity is important especially if
results relevant for policy Tax experiments have produced a range of
results Most have had small student samples Students behave differently to workers Social custom model explains observations

FURTHER READING Alm, J., Cherry, T., Jones, M.L., and McKee, M. (2010)
"Taxpayer information assistance services and tax compliance behavior", Journal of Economic Psychology, 31, 577 - 586.
Alm, J., Cherry, T., and McKee, M., and Jones, M.L. (2009) "Encouraging filing via tax credits and social safety nets", The IRS Research Bulletin, Number 1500.
Alm, J., Cherry, T., and McKee, M., and Jones, M.L. (2010) "Investigating behavioral responses to positive inducements for filing tax returns", Working paper 10-11, Appalachian State University.
Alm, J., Cronshaw, M.B., and McKee, M. (1993) "Tax compliance with endogenous audit selection rules", Kyklos, 46, 27 - 45.
Alm, J., Deskins, J., and McKee, M. (2004) "Tax evasion and entrepreneurship: the effect of income reporting policies on evasion", Working paper, Georgia State University.
FURTHER READING Alm, J., Deskins, J., and McKee, M. (2007) "Do individuals
comply on income not reported by their employer", Working paper 07-34, Georgia State University.
Alm, J., Jackson, B.R., and McKee, M. (1992a) "Institutional uncertainty and taxpayer compliance", American Economic Review, 82, 1018 - 1026.
Alm, J., Jackson, B.R., and McKee, M. (1992b) "Estimating the Determinants of Taxpayer Compliance with Experimental Data", National Tax Journal, 45, 107 - 114.
Alm, J., Jackson, B.R., and McKee, M. (2009) "Getting the word out: enforcement information dissemination and compliance behavior", Journal of Public Economics, 93, 392 - 402.
Alm, J., McClelland, G.H., and Schulze, W.D. (1992) "Why do people pay taxes?" Journal of Public Economics, 48, 21 - 38.

FURTHER READING Alm, J. and McKee, M. (2004) "Tax compliance as a
coordination game", Journal of Economic Behavior and Organization, 54, 297 - 312.
Alm, J., McKee, M., and Beck, W. (1990) "Amazing grace: tax amnesties and tax compliance", National Tax Journal, 43, 23 - 37.
Barile, L. (2012) "Does tax evasion affect firms' internal control? Some evidence from an experimental approach", Labsi Working Papers, N.39.
Baldry, J.C. (1986) "Tax evasion is not a gamble", Economics Letters, 22, 333 - 335.
Bazart, C., and Pickhardt, M. (2009) "Fighting income tax evasion with positive rewards: experimental evidence", University of Montpellier Working Papers, No. 09-01.
Beck, P.J., Davis, J.S., and Jung, W.-O. (1991) "Experimental evidence on taxpayer reporting behaviour", The Accounting Review, 66, 535 - 558.
FURTHER READING Becker, W., Büchner, H.-J., and Sleeking, S. (1987) "The
impact of public transfer expenditures on tax evasion", Journal of Public Economics, 34, 243 - 252.
Collins, J.H. and Plumlee, R.D. (1991) "The taxpayer's labor and reporting decision: the effect of audit schemes", The Accounting Review, 66, 559 - 576.
Cummings, R.G., Martinez-Vazquez, J., McKee, M., and Torgler, B. (2005) "Effects of tax morale on tax compliance: experimental and survey evidence", Leitner Program Working Papers, No. 22.
Friedland, N. (1982) "A note on tax evasion as a function of the quality of information about the credibility of threatened fines: some preliminary research", Journal of Applied Social Psychology, 12, 54 - 59.
FURTHER READING Friedland, N., Maital, S. and Rutenberg, A. (1978) "A
simulation study of income taxation", Journal of Public Economics, 10, 107 - 116.
Gërxhani, K. (2007) "Explaining gender differences in tax evasion: the case of Tirana, Albania", Feminist Economics, 13, 119 - 155.
Gërxhani, K., and Schram, A. (2006) "Tax evasion and income source: a comparative experimental study", Journal of Economic Psychology, 27, 402 - 422.
Harrison, G.W., and List, J.A. (2004) "Field Experiments", Journal of Economic Literature, 42, 1009 - 1055.
Kastlunger, B., Muehlbacher, S., Kirchler, E., and Mittone, L. (2011) "What goes around comes around? Experimental evidence of the effect of rewards on tax compliance", Public Finance Review, 29, 150 - 167.
FURTHER READING Kleven, H.J., Knudesn, M.B., Kreiner, C.T., Pedersen, S., and
Saez, E. (2011) "Unwilling or unable to cheat? Evidence from a tax audit experiment in Denmark", Econometrica, 79, 651 - 692.
Martinez-Vazquez, J., Harwood, G.B., and Larkins, E.R. (1992) "Withholding position and income tax compliance: some experimental evidence", Public Finance Review, 20, 152 - 174.
Mittone, L. (2006) "Dynamic behaviour in tax evasion: an experimental approach", The Journal of Socio-Economics, 35, 813 - 835.
Slemrod, J., Blumenthal, M., and Christian, C. (2001) "Taxpayer response to an increased probability of audit: evidence from a controlled cxperiment in Minnesota", Journal of Public Economics, 79, 455 - 483.
Spicer, M.W. and Hero, R.E. (1985) "Tax evasion and heuristics: a research note", Journal of Public Economics, 26, 263 - 267.
FURTHER READING Spicer, M.W. and Thomas, J.E. (1982) "Audit probabilities and
the tax evasion decision: an experimental approach", Journal of Economic Psychology, 2, 241 - 245.
Wahl, I., Kastlunger, B., and Kirchler, E. (2010) "Trust in authorities and power to enforce tax compliance: an empirical analysis of the "slippery slope framework"", Law and Policy, 32, 383 - 406.