Embed Size (px)
Citation preview
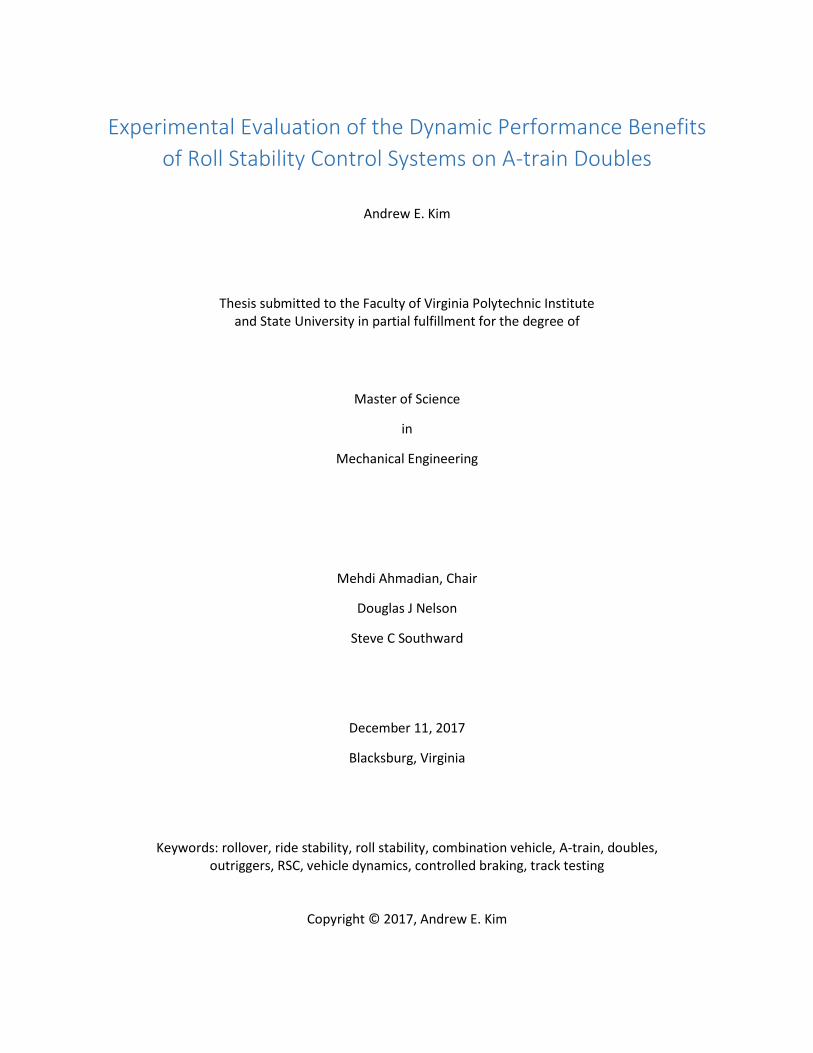
Experimental Evaluation of the Dynamic Performance Benefits
of Roll Stability Control Systems on A-train Doubles
Andrew E. Kim
Thesis submitted to the Faculty of Virginia Polytechnic Institute and State University in partial fulfillment for the degree of
Master of Science
in
Mechanical Engineering
Mehdi Ahmadian, Chair
Douglas J Nelson
Steve C Southward
December 11, 2017
Blacksburg, Virginia
Keywords: rollover, ride stability, roll stability, combination vehicle, A-train, doubles, outriggers, RSC, vehicle dynamics, controlled braking, track testing
Copyright © 2017, Andrew E. Kim

Experimental Evaluation of the Dynamic Performance Benefits of Roll
Stability Control Systems on A-train Doubles Andrew E. Kim
Abstract The ride stability of an A-train 28-foot double tractor trailer when outfitted with different Roll Stability
Control (RSC) systems with the same payload and suspension configurations is studied experimentally for
various dynamic maneuvers. The primary goal of the study is to determine the effect of different
commercially-available RSC systems on the extent of improvements they offer for increasing roll stability
of commercial vehicles with double trailers, when subjected to limit-steering maneuvers that can rise
during highway driving. A semitruck and two 28-foot trailers are modified for enduring the forces and
moments that can result during testing. A load structure is used for placing the ballast loads within the
trailers at a suitable height for duplicating the CG height of the trailers during their commercial use.
Outriggers and jackknifing arresting mechanisms are used to prevent vehicle damage and ensure safety
during the tests. The test vehicle is equipped with multiple sensors and cameras for the necessary
measurements and observations. The analog and video data are time-synced for correlating the
measurements with visual observation of the test vehicle dynamics in post-processing.
An extensive number of tests are conducted at the Michelin Laurens Proving Grounds (MLPG) in Laurens,
SC. The tests include evaluating each RSC system with different maneuvers and speeds until a rollover
occurs or the vehicle is deemed to be unstable. The maneuvers that are used for the tests include: double
lane change, sine-with-dwell, J-turn, and ramp steer maneuver. Both a steering robot and subjective driver
are used for the tests. The test data are analyzed and the results are used to compare the three RSC
systems with each other, and with trailers without RSC. The test results indicate that all three RSC systems
are able to improve the speed at which rollover occurs, with a varying degree. For two of the systems,
the rollover speed gained, when compared with trailers without RSC, is marginal. For one of the systems,
there are more significant speed gains. Since most RSC systems are tuned for a conventional tractor-
trailer, additional testing with some of the systems would be necessary to enable the manufacturers to
better fine-tune the RSC control scheme to the dynamics of double trailers.

Experimental Evaluation of the Dynamic Performance Benefits of Roll
Stability Control Systems on A-train Doubles Andrew E. Kim
General Audience Abstract The safety of driven semi-trailer trucks towing two trailers is analyzed in a study created to examine the
behavior of the vehicle and its units during high speed, high maneuvering circumstances. The rolling over
of a specific test truck is studied to study the ability of a common large vehicle to succeed in evasive or
emergency maneuvers. Focus on the rolling over of a truck is placed in this project, as large freight vehicle
rollovers are among the most popular and most dangerous type of accidents on highways today. A semi-
trailer truck with two trailers, or double trailer vehicle, is instrumented with sensors and cameras to study
several different characteristics associated with vehicle operation and conditions that incite rollover. The
behavior of a double trailer vehicle is complicated due to the additional rotation joint between the
adjacent trailers, where typical semi-trailer trucks (18-wheelers) only incorporate one: between the
towing tractor and the towed trailer.
Commercially available electronic appliances called Roll Stability Control (RSC) systems were designed to
automatically control and apply the vehicle brakes under rollover conditions, and are installed and used
individually to evaluate any improvements on the test vehicle’s ability to stay upright. Information
regarding RSC system operation can be found.
All vehicle testing is completed at a professional vehicle testing location in Laurens, SC and the same four
test maneuvers are used to determine the effectiveness of each of the five RSC systems tested using data
collected with the instrumented sensors. Different types of RSC systems exist due to different manners of
operation, and are discussed in this document and analyzed. This project develops the conclusion that the
five systems used during testing all improve vehicle stability, but provide differing results in doing so,
largely due to their different operations. Therefore, commercially available RSC systems are proven to
work differently and provide different results. Recommendations for further testing of RSC systems is
provided.
Although no recommendations are made regarding the tested RSC systems, the collected data show large,
double trailer freight vehicles are more stable when using any of the tested commercially available RSC
systems, especially during evasive maneuvering or emergency situations. These findings can bring
immediate improvements to large freight vehicle operation and safety.

iv
Acknowledgements I would like to thank my family, friends, and my coworkers at the Center for Vehicle Systems and Safety
at Virginia Tech. Without you, this would have been an impossible task. Specific recognition goes towards
my project team: Dr. Andrew Peterson, Dr. Masood Taheri, Dr. Yang Chen, and Dr. Yunbo Hou, who served
as team leaders and personal mentors throughout my time here, and were all responsible for large
portions of the test vehicle preparation and testing. I would additionally like to thank Dr. Steve Southward
and Dr. Doug Nelson for serving on my committee.
I would lastly like to thank Dr. Mehdi Ahmadian for giving me the opportunity to be in this position.
Without your constant belief and support, I simply would not be where I am today. Words cannot explain
how grateful I am.
v
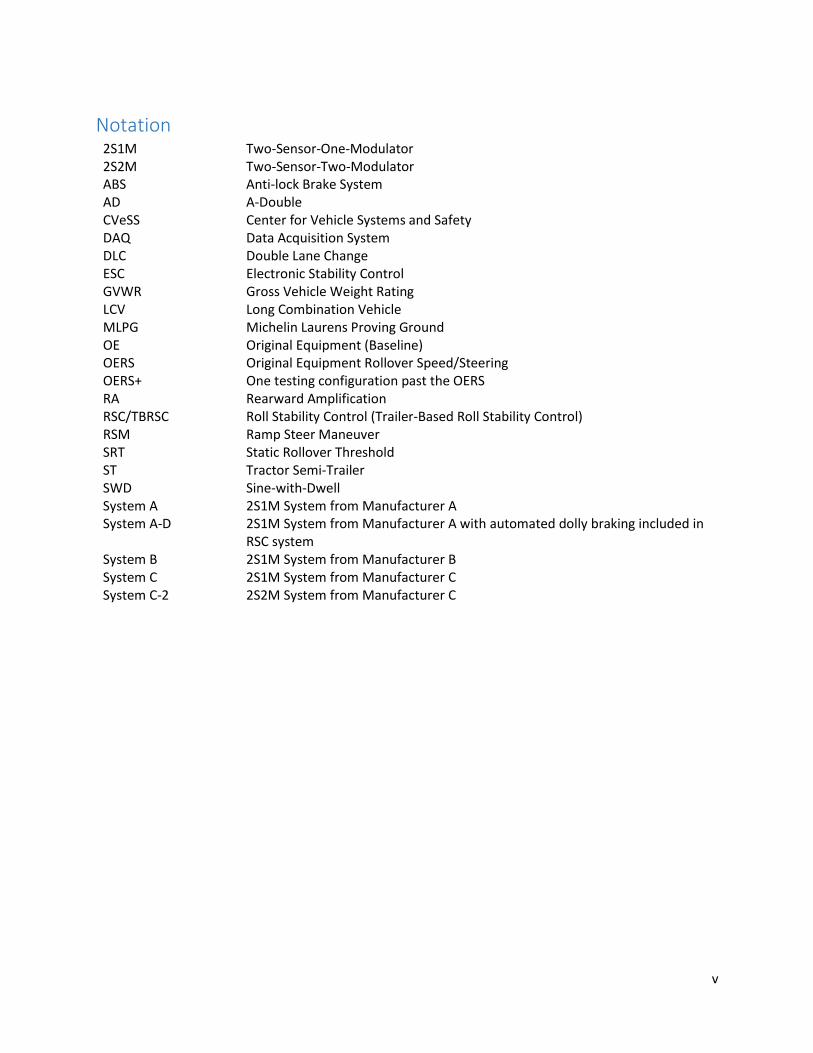
Notation 2S1M Two-Sensor-One-Modulator 2S2M Two-Sensor-Two-Modulator ABS Anti-lock Brake System AD A-Double CVeSS Center for Vehicle Systems and Safety DAQ Data Acquisition System DLC Double Lane Change ESC Electronic Stability Control GVWR Gross Vehicle Weight Rating LCV Long Combination Vehicle MLPG Michelin Laurens Proving Ground OE Original Equipment (Baseline) OERS Original Equipment Rollover Speed/Steering OERS+ One testing configuration past the OERS RA Rearward Amplification RSC/TBRSC Roll Stability Control (Trailer-Based Roll Stability Control) RSM Ramp Steer Maneuver SRT Static Rollover Threshold ST Tractor Semi-Trailer SWD Sine-with-Dwell System A 2S1M System from Manufacturer A System A-D
2S1M System from Manufacturer A with automated dolly braking included in RSC system
System B 2S1M System from Manufacturer B System C 2S1M System from Manufacturer C System C-2 2S2M System from Manufacturer C
vi
Contents Abstract ............................................................................................................................................... ii
General Audience Abstract.…………………………………………………………………………………………………………………….iii
Acknowledgements ...................................................................................................................................... iv
Notation…………………………………………………………………………………………………………………………………………………. v
Contents ....................................................................................................................................................... vi
List of Figures ............................................................................................................................................... ix
List of Tables ............................................................................................................................................... xvi
Chapter 1 Introduction .............................................................................................................................. 1
1.1 Motivation ..................................................................................................................................... 2
1.2 Objectives...................................................................................................................................... 3
1.3 Approach ....................................................................................................................................... 3
1.4 Contribution .................................................................................................................................. 4
1.5 Thesis Organization ....................................................................................................................... 4
Chapter 2 Background Information ........................................................................................................... 5
2.1 Introduction to Rollover ................................................................................................................ 5
2.1.1 Statistics ................................................................................................................................ 5
2.1.2 Rollover ................................................................................................................................. 6
2.1.3 Roll Stability .......................................................................................................................... 7
2.2 Combination Vehicles ................................................................................................................... 9
2.2.1 History ................................................................................................................................... 9
2.2.2 Combination Vehicle Classifications ................................................................................... 11
2.2.3 Combination Vehicle Hitches .............................................................................................. 12
2.2.4 Rearward Amplification ...................................................................................................... 14
2.3 Roll Stability Control (RSC) Systems ............................................................................................ 17
2.3.1 Introduction to RSC ............................................................................................................. 17
2.3.2 RSC and Trailer-Based RSC Operation ................................................................................. 19
2.3.3 Relationship with ABS ......................................................................................................... 22
2.3.4 Past RSC System Studies ..................................................................................................... 23
Chapter 3 RSC Braking Suitability for LCVs & A-Doubles ......................................................................... 27
3.1 Introduction ................................................................................................................................ 27
3.2 Brake Force Distribution in Heavy Vehicles ................................................................................ 27
3.3 Brake Timing Benefits ................................................................................................................. 36

vii
3.3.1 Air Brakes Basics ................................................................................................................. 36
3.3.2 Brake Application and Release Times ................................................................................. 39
3.3.3 Brake Signal Registration Timing Differences between Driver Braking and RSC Braking ... 40
3.4 Summary ..................................................................................................................................... 43
Chapter 4 Track Testing with 28 foot A-Double ...................................................................................... 45
4.1 Mechanical Preparations ............................................................................................................ 45
4.1.1 Outriggers ........................................................................................................................... 46
4.1.2 Anti-Jackknifing System ...................................................................................................... 49
4.1.3 Trailer Reinforcement Beams ............................................................................................. 52
4.1.4 Load Frame.......................................................................................................................... 56
4.1.5 Steering Robot .................................................................................................................... 60
4.1.6 Other Hardware Setups ...................................................................................................... 62
4.2 Data Acquisition System ............................................................................................................. 63
4.2.1 Tractor Hardware ................................................................................................................ 67
4.2.2 Trailer Hardware ................................................................................................................. 70
4.2.3 Junction Box A ..................................................................................................................... 71
4.2.4 Junction Box B ..................................................................................................................... 73
4.2.5 Cameras .............................................................................................................................. 75
4.3 Testing Overview......................................................................................................................... 77
4.3.1 Maneuver 1: J-Turn ............................................................................................................. 78
4.3.2 Maneuver 2: RSM ................................................................................................................ 78
4.3.3 Maneuver 3: DLC ................................................................................................................. 79
4.3.4 Maneuver 4: SWD ............................................................................................................... 80
4.3.5 Maneuvers Summary .......................................................................................................... 81
4.3.6 Test Environment ................................................................................................................ 82
4.4 Summary ..................................................................................................................................... 84
Chapter 5 Roll Stability System Evaluation .............................................................................................. 85
5.1 Bases of Evaluation ..................................................................................................................... 85
5.1.1 Example Evaluation ............................................................................................................. 86
5.2 Single Channel RSC System Performance Study (A vs. B vs. C Study) ......................................... 88
5.2.1 J-turn Results ....................................................................................................................... 88
5.2.2 RSM Results ......................................................................................................................... 94
5.2.3 SWD Results ........................................................................................................................ 98

viii
5.2.4 DLC Results ........................................................................................................................ 106
5.2.5 Summary (A vs. B vs. C) ..................................................................................................... 111
5.3 Dolly RSC Significance Study (A vs. A-D Study) ......................................................................... 113
5.3.1 RSM Results ....................................................................................................................... 113
5.3.2 SWD Results ...................................................................................................................... 117
5.3.3 Summary (A vs. A-D) ......................................................................................................... 123
5.4 Single vs. Dual Channel System Performance Study (C vs. C-2 Study) ...................................... 125
5.4.1 J-turn Results ..................................................................................................................... 125
5.4.2 RSM Results ....................................................................................................................... 130
5.4.3 SWD Results ...................................................................................................................... 133
5.4.4 DLC Results ........................................................................................................................ 137
5.4.5 Summary (C vs. C-2) .......................................................................................................... 141
Chapter 6 Conclusions and Recommendations ..................................................................................... 144
6.1 Conclusions ............................................................................................................................... 144
6.2 Recommendations .................................................................................................................... 146
References ................................................................................................................................................ 148
Appendix ................................................................................................................................................... 151
A Vehicle Parameters ....................................................................................................................... 151
B NI CompactRIO .............................................................................................................................. 153
ix
List of Figures Figure 1-1. A-Double test vehicle. ................................................................................................................. 2
Figure 2-1. Simplified rigid roll plane model of tractor semi-trailer [8]. ....................................................... 8
Figure 2-2. Off-tracking of a tractor semi-trailer vehicle in a 90-degree turn [11]. ...................................... 9
Figure 2-3. Understeer, oversteer, and jackknife [13]. ............................................................................... 10
Figure 2-4. FHWA Vehicle Type Classifications [14]. ................................................................................... 11
Figure 2-5. Fifth wheel hitch (left) and kingpin (right) [16]. ....................................................................... 13
Figure 2-6. A-Train (left) and B-Train (right) secondary trailer mount comparison [18]. ........................... 14
Figure 2-7. The two most commonly used dollies [17]. .............................................................................. 14
Figure 2-8. Rearward amplification in an A-Double [20]. ........................................................................... 15
Figure 2-9. Trailer lag in an A-Double indicated by lateral accelerations over time [8]. ............................ 16
Figure 2-10. Rearward amplification on A-Dollies (left) and C-dollies (right) [17]. .................................... 17
Figure 2-11. 2S1M and 2S2M RSC systems illustration............................................................................... 20
Figure 2-12. Example RSC system schematic showing basic monitoring and operation [26]. ................... 20
Figure 2-13. General operation flowchart for current trailer-based RSC systems. .................................... 22
Figure 2-14. Brace force vs. wheel slip percentage [29]. ABS works to keep braking within the gray band.
.................................................................................................................................................................... 23
Figure 3-1. Brake distribution FBD for an ST under constant braking. ....................................................... 31
Figure 3-2. Brake force distribution FBD for an AD under constant braking. ............................................. 34
Figure 3-3. Stopping distances for typical trucks at 60 mph on dry road [38]............................................ 37
Figure 3-4. Simplified brake system for an A-Double. ................................................................................ 38
Figure 3-5. Brake chamber pressures during driver-operated braking in an A-Double. ............................ 41
Figure 3-6. Brake chamber pressures at the front trailer during RSC-operated braking in an A-Double. .. 41
Figure 3-7. Brake chamber pressures at the rear trailer during RSC-operated braking in an A-Double. ... 42
Figure 4-1. Vehicle instrumentation. .......................................................................................................... 45
Figure 4-2. CVeSS outrigger schematic. ...................................................................................................... 47
Figure 4-3. Outrigger wheel height. ............................................................................................................ 47
Figure 4-4. Load cell in outriggers. .............................................................................................................. 48
Figure 4-5. Anti-jackknifing system (AJS) ropes and chains diagram. ......................................................... 49
Figure 4-6. Two jackknifing scenarios between Trailers A and B. ............................................................... 50
Figure 4-7. AJS at dolly. ............................................................................................................................... 52
Figure 4-8. Reinforcement beam structures and placement in trailer. ...................................................... 54

x
Figure 4-9. Design of roll reinforcement beams. ........................................................................................ 55
Figure 4-10. Yaw reinforcement structure. ................................................................................................. 56
Figure 4-11. Drop frame trailer and typical loading configuration. ............................................................ 57
Figure 4-12. SOLIDWORKS FEA analysis on load frame. ............................................................................. 58
Figure 4-13. Model of load frame within a trailer. ..................................................................................... 59
Figure 4-14. Entire Load frame system. ...................................................................................................... 60
Figure 4-15. Steering robot hardware in engine bay. ................................................................................. 61
Figure 4-16. Outrigger wheel and vehicle wheel preparation. ................................................................... 62
Figure 4-17. Overall sensor schematic. A total of 30 sensors in total are used. ......................................... 64
Figure 4-18. Power Box in tractor. .............................................................................................................. 67
Figure 4-19. Control Desk in tractor............................................................................................................ 68
Figure 4-20. Steering wheel string potentiometer installation. ................................................................. 69
Figure 4-21. Load cell within outrigger. ...................................................................................................... 71
Figure 4-22. Junction Box A (JBA) and its components. .............................................................................. 73
Figure 4-23. Closer look at JBA’s sensor ports and receptacles. ................................................................. 73
Figure 4-24. JBB and its components. ......................................................................................................... 74
Figure 4-25. Cameras and views, and LED usage. ....................................................................................... 76
Figure 4-26. LED activation timing used for synchronize cameras with offsets. ........................................ 77
Figure 4-27. Steering input for the robot J-turn, or RSM. ........................................................................... 79
Figure 4-28. Diagram of DLC adapted for long combination vehicles [36]. ................................................ 80
Figure 4-29. 0.25 Hz SWD steering inputs for 50-100%. ............................................................................. 81
Figure 4-30. Track 8 at Michelin Laurens Proving Ground via Google Earth. ............................................. 83
Figure 5-1. Activation time and warning time definitions. ......................................................................... 86
Figure 5-2. Plot of example data for RSC evaluation. ................................................................................. 87
Figure 5-3. Example multiple dataset figure. .............................................................................................. 88
Figure 5-4. Passenger side outrigger contacts at both trailers during J-turns in 2S1M study, from OERS to
+10.5% mph. ............................................................................................................................................... 89
Figure 5-5. Front trailer passenger outrigger contacts during J-turns in 2S1M study, from OERS to +10.5%
mph. ............................................................................................................................................................ 90
Figure 5-6. Rear trailer passenger outrigger contacts during J-turns in 2S1M study, from OERS to +10.5%
mph. ............................................................................................................................................................ 90

xi
Figure 5-7. RSC activation times at the front trailer for J-turns in 2S1M study, from OERS + 2.6% to
+10.5% mph. ............................................................................................................................................... 91
Figure 5-8. Front trailer passenger warning times during J-turns in 2S1M study, from OERS + 2.6% to
+10.5% mph.. .............................................................................................................................................. 92
Figure 5-9. Front trailer passenger outrigger contact improvement during J-turns in 2S1M study, from
OERS + 2.6% to +10.5% mph. ...................................................................................................................... 93
Figure 5-10. Rollover speed threshold improvement over baseline for both trailers during J-turns in
2S1M study. ................................................................................................................................................ 94
Figure 5-11. Front trailer passenger outrigger contacts during ramp steer maneuvers in 2S1M study,
from OERS to +15% mph. ............................................................................................................................ 95
Figure 5-12. RSC activation times at the front trailer during ramp steer maneuvers in 2S1M study, from
OERS to +15% mph. .................................................................................................................................... 96
Figure 5-13. Front trailer passenger warning times during ramp steer maneuvers in 2S1M study, from
OERS to +15% mph. .................................................................................................................................... 96
Figure 5-14. Front trailer passenger outrigger contact improvement during ramp steer maneuvers in
2S1M study, from OERS + 2.5% to +7.5% mph. .......................................................................................... 97
Figure 5-15. RSC system rollover speed threshold improvement over baseline during ramp steer
maneuvers in 2S1M study. .......................................................................................................................... 98
Figure 5-16. GPS results of a 90% sine-with-dwell test via Google Earth. There are two steering actions in
a SWD. ......................................................................................................................................................... 98
Figure 5-17. Outrigger contacts at both trailers during sine-with-dwells in 2S1M study, from OERS to
+20% steering.............................................................................................................................................. 99
Figure 5-18. Front trailer outrigger contacts during sine-with-dwells in 2S1M study, from OERS to +20%
steering. .................................................................................................................................................... 100
Figure 5-19. Rear trailer outrigger contacts during sine-with-dwells in 2S1M study, from OERS to +20%
steering. .................................................................................................................................................... 100
Figure 5-20. RSC activations at both trailers during first steering of sine-with-dwells in 2S1M study, from
OERS to +20% steering. ............................................................................................................................. 101
Figure 5-21. RSC activations at both trailers during second steering of sine-with-dwells in 2S1M study,
from OERS to +20% steering. .................................................................................................................... 102
Figure 5-22. Warning times at both trailers during sine-with-dwells in 2S1M study, from OERS + 10% to
+20% steering............................................................................................................................................ 102

xii
Figure 5-23. SWD course cones used to measure inward tracking. Understeer measured by number of
cones hit. ................................................................................................................................................... 103
Figure 5-24. Vehicle inward tracking distance during sine-with-dwells in 2S1M study, from OERS - 20% to
+10% steering............................................................................................................................................ 104
Figure 5-25. RSC system outrigger contact improvement for OERS+10 % steering sine-with-dwell test.105
Figure 5-26. RSC system rollover steering threshold improvement over baseline during sine-with-dwell
tests. .......................................................................................................................................................... 105
Figure 5-27. Outrigger contacts at both trailers during double lane changes in 2S1M study, from OERS to
+3.7% mph. ............................................................................................................................................... 106
Figure 5-28. Rear trailer outrigger contacts during double lane changes in 2S1M study, from OERS to
+3.7% mph. ............................................................................................................................................... 107
Figure 5-29. GPS results for a double lane change test via Google Earth. There are three steering actions
in a DLC. .................................................................................................................................................... 107
Figure 5-30. RSC activation times during the first steering of double lane changes in 2S1M study, from
OERS to +3.7% mph. ................................................................................................................................. 108
Figure 5-31. RSC activation times during the second steering of double lane changes in 2S1M study, from
OERS to +3.7% mph. ................................................................................................................................. 108
Figure 5-32. RSC activation times during third steering of double lane changes in 2S1M study, from OERS
to +3.7% mph. ........................................................................................................................................... 109
Figure 5-33. Warning times of both trailers during double lane changes in 2S1M study, from OERS to
+3.7% mph. ............................................................................................................................................... 109
Figure 5-34. Outrigger contact improvement for OERS and OERS + 1.9% steering double lane changes.
.................................................................................................................................................................. 110
Figure 5-35. Outrigger contact improvements of all systems for all maneuvers at a speed or steering one
increment past the OERS. ......................................................................................................................... 112
Figure 5-36. OERS threshold improvements of all systems for all maneuvers. ........................................ 112
Figure 5-37. Front passenger outrigger contacts during ramp steer maneuvers in dolly study, from OERS
to +5% mph. .............................................................................................................................................. 113
Figure 5-38. Front trailer activation times during ramp steer maneuvers in dolly study, from OERS to +5%
mph. .......................................................................................................................................................... 114
Figure 5-39. Front trailer warning times during ramp steer maneuvers in dolly study, from OERS to +5%
mph. .......................................................................................................................................................... 115

xiii
Figure 5-40. System A and A-D front trailer passenger outrigger contact improvements for ramp steer
maneuvers in dolly study, from OERS to +5% mph. ................................................................................. 116
Figure 5-41. System A and A-D rollover speed threshold improvement over baseline for ramp steer
maneuvers in dolly study. ......................................................................................................................... 116
Figure 5-42. Outrigger contacts at both trailers for sine-with-dwells in dolly study, from OERS to +10%
steering. .................................................................................................................................................... 117
Figure 5-43. Outrigger contacts at front trailer during OERS +10% steering sine-with-dwell in dolly study.
.................................................................................................................................................................. 118
Figure 5-44. Outrigger contacts at rear trailer during OERS +10% steering sine-with-dwell in dolly study.
.................................................................................................................................................................. 118
Figure 5-45. RSC activation times during first steering of sine-with-dwells in dolly study, from OERS -10%
to +10% steering. ...................................................................................................................................... 119
Figure 5-46. RSC activation times during second steering of sine-with-dwells in dolly study, from OERS -
10% to +10% steering. .............................................................................................................................. 120
Figure 5-47. Warning time for both trailers during OERS +10% steering sine-with-dwell in dolly study. 120
Figure 5-48. Vehicle inward tracking distance during OERS +10% steering sine-with-dwell in dolly study.
.................................................................................................................................................................. 121
Figure 5-49. System A and A-D outrigger contact improvement for OERS + 10% steering sine-with-dwell.
.................................................................................................................................................................. 122
Figure 5-50. System A and A-D rollover steering threshold improvement over baseline during sine-with-
dwells. ....................................................................................................................................................... 122
Figure 5-51. Outrigger contact improvements of Systems A & A-D for ramp steer maneuvers and sine-
with-dwells at a speed or steering one increment past the OERS. .......................................................... 124
Figure 5-52. OERS threshold improvements of Systems A & A-D for ramp steer maneuvers and sine-with-
dwells. ....................................................................................................................................................... 124
Figure 5-53. Passenger outrigger contacts at both trailers for J-turns in 2S2M study, from OERS to
+10.5% mph. ............................................................................................................................................. 126
Figure 5-54. Passenger outrigger contacts at front trailer during J-Turns in 2S2M study, from OERS to
+10.5% mph. ............................................................................................................................................. 126
Figure 5-55. Passenger outrigger contacts at the rear trailer during J-turns in 2S2M study, from OERS to
+10.5% mph. ............................................................................................................................................. 127

xiv
Figure 5-56. RSC activation times at the front trailer during J-turns in 2S2M study, from OERS to +10.5%
mph. .......................................................................................................................................................... 128
Figure 5-57. Passenger warning times at the front trailer during J-turns in 2S2M study, from OERS to
+10.5% mph. ............................................................................................................................................. 128
Figure 5-58. Front passenger side outrigger contact improvements of Systems C and C-2 over baseline
during J-turns in 2S2M study, from OERS + 2.6% to +5.3% mph. ............................................................. 129
Figure 5-59. Rollover speed improvement of Systems C and C-2 during J-turns in 2S2M study. ............. 130
Figure 5-60. Passenger outrigger contacts at the front trailer during ramp steer maneuvers in 2S2M
study, from OERS + 7.5% to +15% mph. ................................................................................................... 131
Figure 5-61. RSC activation times at the front trailer during ramp steer maneuvers in 2S2M study, from
OERS + 7.5% to +15% mph. ....................................................................................................................... 131
Figure 5-62. Passenger warning times at the front trailer during ramp steer maneuvers in 2S2M study,
from OERS + 7.5% to +15% mph. .............................................................................................................. 132
Figure 5-63. Outrigger contacts at both trailers during sine-with-dwells in 2S2M study, from OERS to
+20% steering............................................................................................................................................ 133
Figure 5-64. RSC activations at both trailers during first steering of sine-with-dwells in 2S2M study, from
OERS to +20% steering. ............................................................................................................................. 134
Figure 5-65. RSC activation at both trailers during second steering of sine-with-dwells in 2S2M study,
from OERS to +20% steering. .................................................................................................................... 134
Figure 5-66. Warning time at both trailers during sine-with-dwells in 2S2M study, from OERS + 10% to
+20% steering............................................................................................................................................ 135
Figure 5-67. Vehicle inward tracking distance during sine-with-dwells in 2S2M study, from OERS -20% to
+20% steering............................................................................................................................................ 136
Figure 5-68. Rollover steering improvements of Systems C and C-2 for sine-with-dwells. ...................... 137
Figure 5-69. Outrigger contacts at both trailers during double lane changes in 2S2M study, from OERS to
+3.7% mph. ............................................................................................................................................... 138
Figure 5-70. RSC activation times during first steering of double lane changes in 2S2M study, from OERS
to +3.7% mph. ........................................................................................................................................... 139
Figure 5-71. RSC activation times during second steering of double lane changes in 2S2M study, from
OERS to +3.7% mph. ................................................................................................................................. 139
Figure 5-72. RSC activation times during third steering of double lane changes in 2S2M study, from OERS
to +3.7% mph. ........................................................................................................................................... 140

xv
Figure 5-73. Warning times at both trailers during double lane changes in 2S2M study, from OERS to
+3.7% mph. ............................................................................................................................................... 140
Figure 5-74. Steering wheel input for eight different OERS + 1.9% double lane change tests. ............... 141
Figure 5-75. Outrigger contact improvements of Systems C and C-2 for all maneuvers at a speed or
steering one increment past the OERS. .................................................................................................... 142
Figure 5-76. OERS threshold improvements of Systems C and C-2 for all four maneuvers. .................... 143
Figure A-1. Vehicle parameters for brake distribution calculations. ........................................................ 151

xvi
List of Tables Table 2-1. Combination vehicle classifications and properties. ................................................................. 12
Table 3-1. Free body diagram nomenclature and description. .................................................................. 30
Table 3-2. Brake distribution for each axle in a ST and AD with the same tractor at 0.6 g deceleration... 35
Table 3-3. Trailer brake contributions under different constant deceleration rates for both ST and AD. . 36
Table 4-1. Typical Load Properties for 28’ drop frame trailer. ................................................................... 57
Table 4-2. Trailer load characteristics. ........................................................................................................ 59
Table 4-3. Overall sensor list and details. ................................................................................................... 65
Table 4-4. Summary of proposed test maneuvers. ..................................................................................... 78
Table 4-5. Maneuver characteristics comparison. ...................................................................................... 82
Table 4-6. Testing schedule at MLPG for this study. ................................................................................... 82
Table 4-7. Forecast of testing days from RSC weeks. ................................................................................. 83
Table A-1. Vehicle parameters for brake distribution calculations………………………………………….……………151
Table B-1. Pin out table for JBA in Trailer A………………………………………………………………………………………….152
Table B-2. Pin out table for JBB in Trailer B………………………………………………………………………………………….153

1
Chapter 1 Introduction
With the recent surge in production and usage of multi-trailer combination vehicles within the trucking
industry for increased logistical efficiency, the large number of accidents involving long combination
vehicle rollover has increasingly raised concerns. These large vehicles suffer from intrinsic design faults
and resultant lower directional stabilities than passenger vehicles, and A-Doubles are both the most
frequently used and least stable among them. Because of the instabilities, namely in the roll direction, of
these long combination vehicles, roll stability controls systems, or RSC systems, have lately been
implemented across the trucking industry in efforts to aid their roll stabilities.
Roll stability control systems are commercially-available active vehicle safety systems that assist drivers
in maintaining stability and control over their vehicle by monitoring rollover conditions and automatically
applying brakes when deemed necessary. These control systems check several variables, most notably the
lateral acceleration of the vehicle unit on which it is installed to determine impending rollover.
Unfortunately, past studies, such as the National Highway Traffic Safety Administration’s (NHTSA’s)
evaluation for their Federal Motor Vehicle Safety Standard (FMVSS) No. 136, have found both tractor- and
trailer-based RSC systems to be inferior to Electronic Stability Control (ESC) systems. These evaluations
are deemed unfair towards long combination vehicle usage of RSC systems not only due to the fact that
these studies only use one of many commercially available RSC systems, but also because they test a
tractor semi-trailer rather than a multi-trailer vehicle. This thesis does not provide a comparison of RSC
systems to ESC systems on a long combination vehicle, as ESC testing is outside the scope of this project.
Rather, this thesis focuses on the benefits of commercially-available RSC systems on LCVs, as well as the
measurable performance differences between different RSC systems.
The Center for Vehicle Systems and Safety (CVeSS) at Virginia Tech has put effort towards studying the
efficacy of different commercially-available trailer-based RSC systems on a double-trailer vehicle called an
A-Double. The A-Double test vehicle, shown in Figure 1-1, is instrumented with mechanical safety
structures, mechanical test structures, and a data acquisition system to safely collect vehicle data through
extensive track testing, and to capture the operational performances of trailer-based RSC systems.
The RSC systems discussed in this project are all trailer-based, but operate in several different ways. Three
separate comparative studies are conducted:
1. Evaluation of three double-sensor-single-modulator (2S1M) systems from different
manufacturers

2
2. Evaluation of one of the three 2S1M systems on the dolly
3. Evaluation of one of the 2S1M systems in a slightly different configuration in which two
modulators (one for each side) are used. This configuration is commonly referred to as a
double-sensor-double-modulator or 2S2M system.
Figure 1-1. A-Double test vehicle.
1.1 Motivation
The primary motivation for this research is to evaluate the effectiveness and operational benefits of
trailer-based RSC systems for long combination vehicles. It is intended to highlight any difference that
may exist in the performance of RSC systems available from different U.S.-based manufacturers.
Past studies have extensively examined the effectiveness of Electronic Stability Control (ESC) systems for
controlling oversteer and understeer conditions. Comparatively, fewer studies have been done with RSC
systems for combination vehicles, in particular for double and triple configurations. This research is
intended to close the gap and provide a comprehensive evaluation of RSC systems for 28-ft double trailers
in A-train configuration, which is the most common form of LCVs in the U.S.
Of particular interest is the extent to which RSC systems can reduce or control rearward amplification that
occurs in multiple trailer arrangements. Rearward amplification (RA) is the increased ratio of lateral
accelerations between the leading unit (tractor) and the rear trailer unit, and reducing it is essential for

3
improving vehicle roll stability. RA is more prevalent in the rear trailer(s) of long combination vehicles
(LCVs) than in tractor semi-trailers because of both increased total vehicle length and existence of an
additional articulation point between adjacent trailers. The increased demands of the more complex
dynamics of trucks with double trailers would perhaps make RSC systems more essential safety equipment
when compared with tractor semitrailers.
1.2 Objectives
The primary objectives of this study are to:
1) Evaluate the roll stability benefits of roll stability control systems for commercial trucks with two
A-train double trailers (commonly known as “A-Doubles”),
2) Determine any differences among various RSC systems marketed in the U.S.,
3) Establish any safety benefits that may be gained from equipping not only the two trailers but also
the dolly with an RSC system,
4) Assess any performance differences between RSC systems with one or two modulators, and
5) Provide general recommendations for future testing of commercial trucks with RSC systems.
1.3 Approach
The above objectives are achieved through track testing an instrumented vehicle at the Michelin Laurens
Proving Ground (MPLG) in Laurens, SC. The test vehicle is instrumented with various sensors and with
video cameras for measuring both in analog and video forms the dynamics of the tractor and trailers
during various maneuvers. A steering robot is used for conducting the selected maneuvers in a repeatable
manner. The maneuvers selected for the tests are double lane change, J-hook (or J-turn), and sine-and-
dwell. In addition to conducting the maneuvers with a steering robot, a subjective test driver is used to
conduct some of the tests, as repeatedly as possible.
The tests are conducted at various speeds and in increasing sequence until rollover occurs. Two outriggers
on each trailer are used to “catch” the trailers from rolling on their sides. The outriggers are designed
such that they do not significantly alter the dynamics of the trailers. Additionally, they are equipped with
load cells to measure the ground contact forces in order to assess the severity of the rollover.
Three different commercially-available systems are tested on both trailers. In one case, the dolly is also
equipped with the RSC. In the case of another system, the RSC is tested in both single- and double-
modulator configurations. The test results for each system are compared with each other, and with a no-
RSC configuration. The comparisons are used to establish a series of recommendations, mainly on the roll

4
stability improvements achieved by each system. Other aspects of the systems, such as cost effectiveness,
ease of installation, operational efficiency, durability, and sustainability, fall outside the scope of this study
and are not considered.
1.4 Contribution
This study provides a comprehensive evaluation of RSC systems for long combination vehicles, in
particular for A-Doubles. The study sheds light on how different systems perform under different dynamic
conditions. The test evaluations also provide an excellent roadmap for future test studies that may involve
other vehicle configurations, such as trucks with triple trailers.
1.5 Thesis Organization
This document consists of six chapters. Chapter 1 provides an introduction. Chapter 2 includes background
information regarding roll stability in commercial vehicles, long combination vehicle classifications, and
general RSC information, including how these systems work. Chapter 3 discusses the differences in brake
characteristics of a tractor semi-trailer and A-Double that can lead to theoretical differences in RSC
efficacy between the two vehicle configurations. Chapter 4 details the preparation of the A-Double test
vehicle, including the installation of the outriggers and data acquisition. It also includes other aspects of
the tests, such as the details on the maneuvers, test procedures, etc. Chapter 5 provides a comprehensive
analysis of the data collected during track testing. Chapter 6 summarizes the findings of the study and
provides recommendations for any additional future testing on other vehicle configurations.

5
Chapter 2 Background Information
The purpose of this chapter is to provide background information on what rollover is and what factors
influence a vehicle’s roll stability. It will also include a discussion on different long combination vehicles
(LCVs) and how various coupling hitches influence their roll stability. The chapter ends with an overview
of RSC systems, a description of general operation, and a review of some of the past studies for roll
stability of articulated vehicles.
2.1 Introduction to Rollover
Heavy vehicles (defined as trucks with a gross vehicle weight rating (GVWR) greater than 10,000 pounds)
continue to be the leader in freight transport methods in North America. The data shows an increasing
trend to their usage, with the number of registered heavy trucks increasing steadily from 2011 to 2015
[1]. In step with this, the revenue of specialized long-distance freight trucking has increased steadily from
2008 to 2015 [2]. Naturally, with an increase in the number of heavy vehicles on the roads comes an
increase in accidents involving them.
Due to their integral role in U.S. commerce, heavy vehicle accidents not only affect those directly involved,
but also the businesses and companies that rely on the trucking industry for transporting commercial and
consumer goods. Therefore, the safe operation of heavy vehicles is of utmost importance. Among all the
dangers intrinsic to operating large mechanical vehicles, rollover incidents are of special concern and
consideration due to a high center of gravity. Not only are rollover incidents one of the largest causes of
severe injury and fatalities on the road (especially highways) for passenger cars, they are even more so
for heavy commercial trucks. The lower directional stability exhibited by larger freight vehicles will always
pose serious safety risks. This section will illustrate just how dangerous rollovers are, as well as how
rollover and roll stability are defined.
2.1.1 Statistics According to a study conducted by the Federal Motor Carrier Safety Administration (FMCSA), there were
approximately 415,000 police-reported crashes involving heavy trucks in 2015. Of those, 83,000 (20%)
resulted in injury and 3,598 (0.08%) resulted in death [3]. Both of these statistics saw increases from the
2014 numbers: 82,000 injuries, and 3,429 families, resulting in 12% and 5% increases, respectively. Of
these 3,598 fatal crashes, 166 were caused by rollover as the first event, with countless others not
necessarily directly caused by rollover, but were associated with and included large trucks overturning [3].
Only 2.1% of the 9.1 million passenger car accidents in 2010 involved rollovers, but rollovers still

6
accounted for almost 35% of all fatalities from passenger vehicle crashes that year [4]. Although rollover
incidents and accidents are not as numerous as those caused by other reasons such as collision, they have
higher injury and fatality rates than other types of crashes. In fact, it was concluded by Green in 2002 that
rollover accidents are the deadliest kinds of accidents, particularly on ramps and inclines off highways [5].
There are two types of rollover: untripped and tripped. Most rollover accidents are of the latter type, in
which an external object on the road serves as a tripping or collision mechanism. Up to 95% of single-
vehicle rollovers are tripped [6]. However, it was found by Dilich and Goebelecker in 1997 that the great
majority of rollovers were due to driver error, which includes misjudging road curves, speeding, drifting
off roads, and being physically or emotionally impaired [7]. In fact, the Large Truck Crash Causation Study
(LTCCS) conducted by the National Highway Traffic Safety Administration (NHTSA) and the Federal Motor
Carrier Safety Administration (FMCSA) discovered that 45% of the 239 rollover crashes between 2001 and
2003 were due to speeding. These reasons correlate highly with tripped rollovers, and many can be
avoided with higher-level driver responsibilities, attentiveness, and experience. On the other hand,
untripped rollovers usually occur during high-speed avoidance maneuvers (and can be thought of as
maneuver-induced rollovers), and are more inevitable and therefore more dangerous. Because of this,
this study uses testing maneuvers to produce untripped rollovers.
2.1.2 Rollover Most large vehicle accidents are caused by directional instability, and largely fall into three categories: (1)
roll instability or rotation about the longitudinal axis, (2) yaw instability or rotation about the vertical axis,
and (3) trailer yaw oscillation or rotation about the lateral axis. When the lateral forces on the vehicle
surpass the stabilizing moment provided by the vehicle’s wheels and track (most likely during a cornering
maneuver), the vehicle will fall under the first category and roll. This lateral force causes the body’s center
of gravity to laterally extend past the wheels, thus causing the vehicle body to overturn.
While both light and heavy vehicles exhibit directional instability in all three rotation modes, heavy
vehicles are more prone to rollover than lighter, smaller vehicles mainly due to a high center of gravity.
The design of larger vehicles is why the performance limit of heavy vehicles is characterized by a loss of
roll stability, instead of the typical loss of yaw stability used for lighter vehicles. Therefore, consideration
of roll dynamics was chosen to be the focus of this study.
Rollover occurs when a vehicle loses directional control about its longitudinal axis, but rotation about the
vertical axis, or yaw, plays a large part in the dynamics of a rollover as well. When cornering is initiated, a
slip angle and thus a lateral force are generated from the steering input and the front wheels turning. A

7
resulting rear wheel slip angle and lateral force follows, and the vehicle starts rotating along its vertical
axis. This yaw response occurs from the steady-state turning. As the trailer begins its yaw response, the
attached trailers follow in similar fashion. The semi-trailer’s (rear) tires develop lateral force and their own
yaw response forms. When any of the lateral forces at the units’ tires produced by yaw responses exceeds
the respective friction limit with the ground, the tire loses control and causes the vehicle to either
oversteer or understeer. In LCVs, this loss of tire-to-ground traction can also cause trailers to swing in or
out of the intended path, and in worst-case scenarios, can cause jackknifing and rollover. When the
generated lateral forces result in lateral accelerations that exceed the vehicle’s SRT, rollover occurs.
Because of the interplay of yaw and roll, both must be considered when evaluating LCV ride stability and
safety. It is important to note that yaw dynamics complicate, but can also stabilize, roll behavior for
articulated vehicles [8]. This is further discussed in Chapter 3.
2.1.3 Roll Stability The roll stability, or the propensity for a vehicle to stay upright during cornering, can be quantified in a
number of ways, but this paper will consistently use a maximum lateral acceleration threshold. This lateral
acceleration threshold is a basic method of quantifying roll stability, and is referred to as a static rollover
threshold, or an SRT. SRT values can range from a lower limit of around 0.2 g’s for individual cases of heavy
trucks, to an upper limit of over 1.4 g’s for shorter passenger cars [8]. Roll stability limits for heavy freight
vehicles are much lower than passenger vehicles because of their low track width to center of gravity (cg)
height ratio [5]. For loaded heavy trucks, the rollover threshold is below 0.5 g’s of lateral acceleration,
compared to that of passenger cars which are always greater than 1.0 g. The lateral acceleration rollover
limits for most heavy vehicles have been reported to be around 0.3 to 0.6 g’s [6].
This wide range is largely due to the fact that SRTs depend on several factors, the most important of which
are vehicle type, vehicle weight, weight distribution, vehicle roll stiffness and other suspension properties,
cornering maneuver, and tire and road conditions. Figure 2-1 and Equation 2-1 provide a model for the
relationship between several variables to a vehicle’s basic roll characteristics. This steady-state roll
stability has been linked to the probability of rollover in an accident by Winkler et al. [9].
Figure 2-1 shows a tractor semi-trailer from behind in the yz-plane in a simplified free-body diagram during
cornering. This simplified model treats the vehicle, the tires, and the suspensions as a lumped-element,
and tackles lateral roll only. Using Conservation of Momentum, an equation for roll moment can be
derived from the forces on a vehicle during a steady-state turn:

8
Figure 2-1. Simplified rigid roll plane model of tractor semi-trailer [8].
𝑊 ∗ ℎ ∗ 𝑎𝑦 = (𝐹2 − 𝐹1) ∗𝑇
2− 𝑊 ∗ ∆𝑦 (2-1)
where 𝑊 is weight, ℎ is the cg height, 𝑎𝑦 is lateral acceleration, 𝐹𝑖 is the vertical tire load, 𝑇 is the track
width, and ∆𝑦 is the cg lateral motion due to body roll. Equation 2-1 is also known as the roll equilibrium
equation for a rigid body, and lumps the vehicle into a single roll plane while assuming the vehicle will roll
about its roll center indicated by a white circle on Figure 2-1. Figure 2-1 shows the major factors involved
in rollover events: speed, weight, centrifugal force, track width, and center of gravity height. Speed
directly affects the lateral accelerations experienced when the vehicle corners or changes direction. The
ratio of cg height, ℎ, and track width, 𝑇, is an important factor that determines at what lateral
accelerations a vehicle tips over. The weight of a vehicle, 𝑊, affects rollover in multiple ways: (1)
distribution can change cg locations along all axes, and (2) the heavier a vehicle is, the more prone it is to
rollover [10]. Thus, rollover is more likely to occur when the vehicle has fully-loaded trailers. Tractor semi-
trailers are typically loaded to its maximum GVWR of 80,000 lbs. One type of LCV called an A-Double is
usually loaded to their maximum volume rather than weight rating, so is typically significantly lighter but
has higher cg’s than that of tractor semi-trailers. These differences are the main causes for different roll
stabilities between the two vehicle types.

9
Figure 2-1 and Equation 2-1, however, only apply to single trailer vehicles, as roll dynamics become more
complicated as additional units are incorporated. Rollovers for multi-trailer vehicles are a more significant
problem than for single trailer vehicles, and the different types of these vehicles will be introduced in the
following chapter.
2.2 Combination Vehicles
2.2.1 History Commercial needs have called for a wide range of designs for both trucks and trailers. Since the two largest
costs in the trucking industry are fuel and labor, the desire for larger trailers to move more payload per
trip and driver grew quickly. As more emphasis was placed on cost effectiveness, trucks became bigger
and longer, which was not very practical for road use. As trucks eventually started towing 53’ semi-trailers
to meet the demand of commercial shipping, they began reaching maneuverability limits due to a
combination of their rigidity and length. By constructing vehicles that instead towed trailers with shorter
wheelbases and an extra articulation point between them, very long and maneuverable vehicles that met
commercial shipping needs were created. These long combination vehicles (LCVs), or multi-trailer
vehicles, such as double and triple trailer trucks quickly, became popular with the help of some recent
dramatic aerodynamics and tire rolling resistance improvements.
Although larger single trailer vehicles would allow the larger towing yields, dividing a truck’s payload into
smaller and separable units has a couple of advantages. Firstly, LCVs allow the ability to pick up and drop
off entire trailers, further improving logistics for many businesses. Secondly, an extra articulation point
along the vehicle body allows for better maneuverability, especially during low-speed cornering, as a
normal 53’ tractor semi-trailer combination tends to off-track inward of a turn, as shown in Figure 2-2.
Figure 2-2. Off-tracking of a tractor semi-trailer vehicle in a 90-degree turn [11].

10
Large vehicles can lose directional stability quite easily, and many of these incidents occur from quick
maneuvers, such as avoiding obstacles around a curve or a tractor slipping through turns. When a tractor
and its trailer loses directional stability or control during a curve or turn like the one shown in Figure 2-2,
either understeering or oversteering events may occur. Understeering is described as a loss of directional
control in a vehicle in which the front or steering wheels’ traction to the road is exceeded by the lateral
forces exhibited by the vehicle. This causes the front wheels to slide instead of roll, thereby not turning
the vehicle enough to follow the road path. Oversteering is the same dynamic but with the rear wheels
instead of the front. As a result, the rear of the vehicle will swing out of the turn or curve, and the vehicle
will turn too much compared to what was intended. This can be accompanied by spinning of the vehicle.
Oversteering is considered the more dangerous of the two, because while both events result in a loss of
control over the vehicle, oversteering is a yaw-unstable event compared to the yaw-stable event that is
understeering. Understeering sees no increase in vehicle rotation in accordance to increased steering
wheel angles, while oversteering does.
When combination vehicles oversteer, a frightening phenomenon called jackknifing can follow. If a tractor
is oversteering and the semi-trailer is understeering, jackknifing occurs at a certain critical speed [12]. Due
to a spin from a loss of traction at its rear, the tractor will spin towards its towed unit. The towed unit
continues forward due to its mass and momentum, further worsening the tractor spinning and hitting the
trailer, resulting in a combination vehicle looking like the one shown in the bottom image of Figure 2-3.
Unfortunately, one of the downsides of extra articulation points in LCVs is a higher risk of jackknifing. If a
truck jackknifes, there is high probability that a rollover will follow. Therefore, jackknifing is another
vehicle dynamic that must be avoided in efforts to increase ride and roll stabilities.
Figure 2-3. Understeer, oversteer, and jackknife [13].
Jackknifing

11
2.2.2 Combination Vehicle Classifications While there are many different types of heavy vehicles, those mentioned in this study only pertain to
Classes 8, 9, 11, 12, and 13 from the Federal Highway Administration’s classifications. These classes are
divided by axle and towed unit type, as seen in Figure 2-4. These vehicles will be referred to as
combination or articulated vehicles, as they use a towing mechanism (a tractor) and at least one towed
unit (trailer). Depending on the number of towed units and the hitches used, combination vehicles can be
categorized into seven generic categories that span these five classes. These categories are shown in Table
2-1, and the most common vehicle configurations, the conventional tractor and 52’ semi-trailer
combination (the WB64 semi-trailer) and the conventional A-Double with 28’ semi-trailers (the western
A-Double), are highlighted in blue. Table 2-1 also contains the features of the families, such as what the
combination vehicle is comprised of and what hitches are used to attach the units.
Figure 2-4. FHWA Vehicle Type Classifications [14].

12
Table 2-1. Combination vehicle classifications and properties.
Combination Hitches # of Towed
Semi-trailers Illustration
3-axle Straight Truck
N/A N/A
5-axle Tractor Semi-Trailers
Fifth wheel 1
A-train Doubles Fifth wheels,
A-Dolly
2
B-Train Doubles Fifth wheels 2
C-Train Doubles Fifth wheels,
B-dolly 2
A-Train Triples Fifth wheels,
A-Dollies 3
C-Train Triples Fifth wheels,
C-dollies 3
The hitches listed in Table 2-1 are designed to allow rotational freedom so that connected units are not
rigid. The constraints and freedoms provided by these hitches complicate the vehicle’s roll dynamics, and
also result in the A-train doubles being the least stable vehicle of the group. Details regarding the hitches
of an A-Double are provided in the following Subsection 2.2.3. The combination of the A-Double being
both the most common and least stable LCV in the U.S. is the motivation behind this project’s testing of
RSC efficacy with an A-Double.
2.2.3 Combination Vehicle Hitches The most common of all commercial heavy vehicles is the widely used 53’ tractor semi-trailer, or the WD-
64 conventional tractor semi-trailer. This vehicle is a simple combination of a tractor and semi-trailer, as
shown in Table 2-1. This unit uses a single semi-trailer connected to a tractor via fifth wheel, which permits
relative yaw and pitch motions between the two units, but not roll. This is due to the design of the fifth
wheel hitch and semi-trailer kingpin, shown in Figure 2-5. Fancher’s yaw-roll simulation study in 1987
concluded that fifth wheel hitches couple the roll dynamics of the two connected units very strongly [15].

13
Figure 2-5. Fifth wheel hitch (left) and kingpin (right) [16].
There are several types of LCVs differentiated by the number of towed trailers and the type of coupling
used between the trailers. A converter dolly is an inter-trailer coupling unit that “converts” a semi-trailer
to a full trailer, and is usually used between adjacent trailers in LCVs. By connecting subsequent trailers
with converter dollies, long combination vehicles can be built up. Dollies hold both a coupling point to the
back of a vehicle, as well as a fifth wheel hitch to mount semitrailers. As will be discussed in this section,
due to the use of converter dollies in filling the greater number of articulation points in LCVs, the stability
of long combination vehicles is reduced, especially in quick steering maneuvers, such as evasive actions.
The key difference between the three dollies is how they are coupled to the back of the lead trailer. B-
dollies are extensions of the rear axle of the lead trailer, while A- and C-dollies incorporate pintle hitch
couplings, as shown in Figure 2-6. This design difference yields great changes in directional stabilities, as
pintle hitch couplings decouple the roll motions of the connected units [15].
The two most commonly used dollies in North America are the A- and C- dollies. A-Dollies are most
frequently used by common freight carriers due to logistical efficiency: A-Dollies are easier and quicker to
connect and disconnect then are C-dollies, and cost less to maintain mostly due to larger tire wear from
the latter [17]. The ease of use found in A-Dollies is due to the implementation of a single drawbar, or a
single coupling, to connect or disconnect a towing vehicle to a towed unit. C-dollies, on the other hand,
use a double coupling system. This is illustrated in Figure 2-6. Double and triple trailer configurations that
integrate A-Dollies are called A-Doubles and A-triples, and the same naming convention applies for those
that use C-dollies.

14
Figure 2-6. A-Train (left) and B-Train (right) secondary trailer mount comparison [18].
Figure 2-7. The two most commonly used dollies [17].
A-Dollies suffer tremendously from the use of pintle hitches, as problems mainly arise from its
implementation of a single drawbar, shown in both Figures 2-6 and 2-7. A single pintle connection allows
rotation about all directions with respect to the towing unit, and is why many consider A-Dollies to be
weak roll-coupling mechanisms [19]. C-dollies, however, incorporate a second pintle hitch to eliminate
yaw between the dolly and the preceding semi-trailer. A phenomenon called rearward amplification (RA)
occurs most severely in A-trains due to the failure of A-Dollies to do the same, and worsens the roll
stability of A-trains since yaw and roll dynamics are coupled.
2.2.4 Rearward Amplification A main contribution to rollover events for large combination vehicles such as doubles and triples is the
previously introduced phenomenon of “rearward amplification.” Rearward amplification, or RA, refers to
the increase of ratio of the lateral accelerations of the towed trailers to that of the tractor. Figure 2-8
shows the results of a study of a double tanker following a simple lane change maneuver. The last trailer
of the double exhibited the most rearward amplification, and trailers closer to the tractor exhibited less.

15
This principle of rearward amplification holds true for triples as well. This phenomenon is the biggest
reason for the significantly different dynamics between LCVs and other heavy vehicles, such as tractor
semi-trailer vehicles.
Figure 2-8. Rearward amplification in an A-Double [20].
Another crucial aspect of rearward amplification is the lag that following trailers experience during
dynamic movements. A driver and tractor can be fully completed with a turn or lane change by the time
the rest of the vehicle completes the maneuver. Figure 2-9 displays the rearward amplification in a two-
second lane change maneuver by a double. As shown in the plot, both lateral acceleration and the roll
angle of the trailers increase from and lag behind those of the tractor [8]. At around 3 s, the tractor
recovers from its maneuver while the second trailer is experiencing its maximum lateral acceleration. This
lag becomes even more dangerous when the driver is inexperienced, as the tractor has a tendency to
isolate the driver from the rest of the vehicle. Without understanding rearward amplification and its lag,
a driver may continue in high frequency steering without knowing that the rear trailer is experiencing
dangerous levels of lateral acceleration. In addition, the lag is also applied when the vehicle is braked, so
preventive action must be taken very quickly to stop potential rollover.
Rearward amplification is highly undesired because of its effects on even the simplest and slowest of LCV
maneuvers, as amplified low-level lateral accelerations can cause units to roll over. The combination of

16
trailer lag, the increase of lateral acceleration due to rearward amplification, and cab isolation from rear
trailer behavior, helps to explain why heavy combination vehicle rollover can happen quite easily.
Rearward amplification also increases the probability of vehicle off-tracking and jackknifing, both of which
are highly undesired outcomes during vehicle operation, but are outside of this study’s scope.
Figure 2-9. Trailer lag in an A-Double indicated by lateral accelerations over time [8].
Figure 2-9 displays this phenomenon for a doubles configuration vehicle, but the lateral acceleration
results for both a tractor semi-trailer and double during an obstacle-avoidance maneuver can be
interpreted. Many have compared articulated vehicles to a whip, where the longer the vehicle and whip
are, the faster the end moves. The rearward amplification of a 5-axle tractor semi-trailer of a 27’ semi-
trailer is about 1, while that of a conventional 27’ double is around 2.0 [21]. The natural increase in lateral
acceleration found in “cracking the whip” has caused doubles to be considered quite discernably the less
stable of the two vehicle types.
Among the doubles, ADs are notoriously known for their roll instabilities as they exhibit worse (higher)
rearward amplifications than B-dollies and C-dollies [20, 21]. Many studies have proven C-dollies to be
more effective and safer for high-speed heavy vehicle usage. A widely-cited study by Winkler and the
University of Michigan Transportation Research Institute displayed this best by their testing of light
commercial vehicles (LCVs). Winkler’s results showed a reduction in rearward amplification in LCVs that
used C-dollies, and a driver proclivity towards C-dollies as well [17]. Figure 2-10 shows the lateral
acceleration plots for loaded triples using A-Dollies and C-dollies, which indicate that C-dollies tend to

17
reduce the increase of lateral accelerations for towed units due to rearward amplification [17]. A-Dollies,
however, show the opposite trend. Figure 2-10 further illustrates that A-trains are significantly less stable
than other types of LCVs, even though they are the most commonly used, and thus have the largest room
and need for improvement.
Figure 2-10. Rearward amplification on A-Dollies (left) and C-dollies (right) [17].
Vehicles that use A-Dollies exhibit the worst rearward amplification trailer lag mentioned before as well.
Many have found that pitch arrangements that provide roll coupling allow lateral accelerations of
following units that are actually combatted by the out-of-phase roll of the preceding units [22, 23], and
stabilized. A-Dollies fail to take advantage of this stabilizing opportunity. Because this lag and rearward
amplification are highly related to the maneuver and its steering frequency, several testing maneuvers
must be used to fully analyze their effects on A-Doubles. The reasoning behind selected maneuvers will
be discussed in Chapter 4.
As usage of combination vehicles (mainly A-Doubles) increases throughout the US, the emergence of
trailer-based RSC systems as a primary system used for inhibiting vehicle roll during cornering has become
more prominent. The focus of most of these RSC systems is to reduce RA, and as will be discussed in
Section 2.3, RSC systems largely operate through the monitoring of lateral accelerations.
2.3 Roll Stability Control (RSC) Systems
This section will cover a brief history and general description of RSC systems. A complete RSC system
includes many algorithm modules, state estimation calculations, and vehicle dynamics analyses [24]. This
information is highly proprietary to RSC system manufacturers and trailer manufacturers, so this section
will only detail very basic information regarding RSC systems and their operation.
2.3.1 Introduction to RSC There are two active stability control systems for heavy vehicles available in the market today: (1)
electronic stability control (ESC) systems, and (2) roll stability control (RSC) systems. While both ESC and

18
RSC systems were developed to assist roll instability in primarily untripped rollover events, ESC systems
also additionally tackle yaw instabilities. Another key difference between the two is the area of application
for the two systems, as ESC systems are only for tractors and buses, while RSC systems can be installed
on tractors, buses, and semi-trailers. Therefore, hereafter, the term RSC will mean the tractor-based RSC
systems, while the trailer-based RSC systems will be referred to as just that.
Active roll control for road vehicles itself is quite new, as the earliest documented case was MIT’s
motorcycle-based machine in 1968 [25]. This prototype used a feedback system of measured body roll
angle and applied realignment moment between the body and the rear axle. With the improvement of
sensor capabilities and latency, more sophisticated roll control methods came about. The idea of modern
roll stability control systems has been documented by several companies and authors, with one of the
more popular designs belonging to Ford Motor Company via US Patent 6,263,261 [26]. Extensive research
has already been completed on the benefit of ESC on the ride stability of tractor semi-trailers, and in 2012,
NHTSA established Federal Motor Vehicle Safety Standard (FMVSS) No. 136 that required ESC (which
included RSC system features) on truck tractors with a gross vehicle weight rating (GVWR) greater than
26,000 pounds. ESC systems in truck tractors were designed to mitigate vehicle rollovers after NHTSA saw
its FMVSS No. 126 successfully lower untripped rollover incidents for light vehicles. The implementation
of ESC had significantly reduced the number of fatal crashes by 36% for passenger cars and 70% for light
trucks and vans from 1997-2003 [27]. Such success led to Ford and Volvo adding RSC to their rendition of
ESC (AdvanceTrac) as they looked to mitigate rollover in larger vehicles [24]. Currently, there are no
government regulations regarding the use of trailer-based RSC systems.
Another large reason for RSC popularity other than their operational effectiveness is their economical
utility. Diminishing the number of rollover crashes is clearly beneficial to all, but when the average cost of
injury and fatal rollover accidents are $462,000 and $1,143,000, respectively, for large combination trucks
[28], the biggest winner is the trucking industry. Analysis of the costs of RSC systems that have been
incurred by the trucking industry by the Federal Motor Carrier Safety Administration (FMCSA) concluded
that companies see positive returns on 5-year investments as company image and vehicle maintenance
both benefit from less rollover incidents [28]. More specifically, costs which the use of RSC systems help
avoid include:
Labor costs (less overall training needed, less driver turnover)
Driver injury compensation (settlements)
Damage costs (vehicle and cargo, delivery delays, towing, company image)

19
Environmental costs (clean-up)
Legal costs (property damage, court costs, legal fees)
2.3.2 RSC and Trailer-Based RSC Operation Like ESC systems, RSC systems rely on several sensors – most notably roll rate sensors, wheel speed
sensors, and accelerometers – to identify roll instability. RSC modules communicate with these sensors
with CAN communication as they take a combination of lateral acceleration, roll rate, and wheel speed
readings to determine the severity and rate at which the vehicle is tilting [24]. Critical thresholds for
several variables, such as roll angle, roll rate, wheel speed, wheel lift angle, or lateral acceleration, are set
at vehicle startup based on air suspension spring pressures and estimated trailer payloads.
When the system predicts impending roll based on the roll information relative to the critical thresholds,
brake pressures are applied at each axle (and the engine retarder for only tractor-based RSC systems) to
both safely slow and therefore stabilize the vehicle. By regulating the amount of braking at each tire of
the vehicle, directional stability can be maintained. For example, to control roll, braking at the outside
wheels is generally applied during cornering. This reduces lateral forces, keeping the inside wheels on the
ground and reducing the likelihood of rollover. Another result of controlled braking is the deliberate
leaning of the vehicle into corners inward of the vehicle centerline to create a stabilizing roll moment.
Braking capabilities of RSC systems depend on the hardware of the system. Although the controllers and
black boxes of systems are highly proprietary and secret operational information, hardware differences
between RSC systems are very clear and open to the public. Some RSC systems, for example, can include
converter dolly brakes in RSC brake operation. Some systems can incorporate connectivity between the
RSC operations at multiple trailers, applying RSC at neighboring trailers after one is activated. One last
example are systems that divide axle brake efforts to provide individual wheel braking capabilities. This is
done by using multiple brake control modulators to control brake efforts at each side of every axle.
Systems that group brake efforts across an axle usually use one modulator and a wheel speed sensor at
each wheel, and either wheel can call for system activation. These systems are called 2S1M systems, for
two sensors and one modulator. Similarly, 2S2M systems use a wheel speed sensor and a modulator for
each wheel on an axle. Figure 2-11 illustrates the two types of systems.

20
Figure 2-11. 2S1M and 2S2M RSC systems illustration.
An example of an RSC system black box is shown through US Patent 6,263,261 B1 schematic shown in
Figure 2-12, indicating the variables from which this specific RSC system gathers information. As always,
the algorithms and specifics within the controller are highly proprietary. Figure 2-12 also shows the
distribution of braking forces to all tires as four blocks labeled FR, FL, RL, and RR are linked to the brake
control block, indicating that this system is a one-modulator system.
Figure 2-12. Example RSC system schematic showing basic monitoring and operation [26].
RSC manufacturers have their own patented methods of tuning the controller in charge of selecting
thresholds and used sensors. For informative purposes, the Roll Stability Control system developed at
Ford Motor Company in 2003 will be discussed as an example. Again, controller algorithm modules such
as wheel lift detection and brake hydraulics enhancement are highly proprietary, and will not be included.
However, a quick summary of the vehicle roll dynamics estimation will be discussed.

21
Ford’s algorithm of identifying roll used several roll plane (a vehicle’s yz-plane) coordinate systems. The
first is used to find the road’s angle (for banks); the second is used to determine the relative wheel lift
angle; and the third is used for the body angle compared to the vehicle’s suspension (for the body frame).
This method would always use a relative body roll angle rather than assuming that the road is always flat.
Along with these coordinate systems, the RSC system uses a cluster of sensors that includes a roll rate
sensors, a yaw rate sensor, a lateral accelerometer, and a longitudinal accelerometer. Imminent body roll
and wheel departure estimations were made from the RSC sensor cluster and these coordinate systems,
along with significant arithmetic. As is the case for all safety systems in vehicles, maximum latency
between system operation and accident occurrence is of utmost priority. Therefore, control strategies are
used along with these calculations to supply applied brake pressures to overcome optimal vehicle body
roll countering, as well as to overcome brake hydraulics delays that the vehicle may experience.
RSC systems today have refined the calculations, control strategies, and required hardware to deliver the
quickest braking response possible. According to NHTSA, RSC systems now only require an electro-
pneumatic brake application valve, one lateral accelerometer, and an ECU, making retrofitting quite
simple compared to ESC retrofitting. RSC systems, however, continue to measure the same variables as
did Ford: wheel speed, wheel lift, lateral acceleration, and suspension pressure. Wheel lift is the first
indication of occurring rollover, so wheel departure detection is one of the most significant features of
any RSC system. Relative body roll angle, or the angle of the vehicle body to the road surface, remains the
most important variable in directly measuring the potential of rollover for a maneuver. Many of the
current RSC system manufacturers use lateral acceleration as the key measured variable to do so. As
mentioned earlier, starting thresholds for the measured variables are calculated as well, as RSC systems
improve performance as vehicle parameters are updated and the system is tuned accordingly. The
flowchart in Figure 2-13 explains a general logic usage of RSC system controllers today. An important
advantage of current RSC systems is the capability of tuning the controllers for modified performance,
such as changing the lateral acceleration threshold for more or less intrusive brake applications. Finding
the fine line for lateral acceleration threshold is difficult, and tuning parameters are kept highly secret by
manufacturers and are outside the scope of this project.

22
Figure 2-13. General operation flowchart for current trailer-based RSC systems.
2.3.3 Relationship with ABS It is important to note that RSC systems do not improve or add braking functionality to a vehicle. Instead,
RSC systems simply make decisions on when to apply brakes, and therefore RSC system performances are
directly related to the vehicle’s braking system maintenance and performance. With the introduction of
ABS, or anti-lock braking systems, drivers do not need to worry about how to apply brakes, as ABS provides
maximum brake force and efficiency by avoiding wheel lock.
ABS is a safety system supplement used in vehicles to prevent wheel slip and wheel lock during braking,
and to maintain traction between the road surface and the vehicle’s wheels. When the vehicle’s brakes
are applied too hard (usually in emergency braking situations), the force of the brake pads at the wheel
are higher than the forces of the wheel gripping the road, causing the wheel to stop spinning and “lock
up.” A locked tire is incapable of generating any lateral forces at its contact patch with the ground and
therefore loses directional stability. This loss of directional stability can cause understeering and
oversteering mentioned earlier in this chapter. Since oversteering occurs with a lack of control at the rear
tires, brake systems are almost always designed for wheel lock-up to occur at the front axle. Wheel lock-
ups at the front axle cause the vehicle to understeer or plow forward, while wheel lock-ups at the rear
axle cause the vehicle to oversteer or spinning out.
Typical ABS systems consist of an ECU, wheel speed sensors, and valves in order to monitor the rotational
speed of each of the vehicle’s wheels. Upon detecting a wheel rotational speed slower than the speed of
the vehicle when braking (a condition indicative of impending wheel lock), the ABS valves release the

23
pressure at the brakes, allowing the wheel to rotate once more. The ratio between the actual speed of
wheel rotation under braking to the free-rolling speed of rotation is called wheel slip. Wheel slip increases
as deceleration increases under increased brake pedal application effort. A limit of brake force is
eventually met, however, and any additional brake effort past this limit causes wheel lock and wheel skid.
The brakes are applied again once the tire is capable of providing the most efficient braking, i.e. the wheel
slip falls to the ideal range of between 15-25%. This process can be repeated continuously several times
per second. The wheel slip ratio versus brake force plot below can be used to explain why this brake
pressure modulation is done. The main function of ABS is to keep the wheel slip ratio in this slip tolerance
band of 15-25% wheel slip in order to maximize brake force when decelerating. This range is shaded in
gray in Figure 2-14 below. Any braking outside this band is less than optimal and results in increased
stopping distances and higher probabilities of losing directional stability.
Figure 2-14. Brace force vs. wheel slip percentage [29]. ABS works to keep braking within the gray band.
ABS therefore provides maximum brake performance during braking and emergency events. ABS and
stability control systems such as RSC and ESC work hand in hand, delivering maximum brake performance
at the right times in order to slow a vehicle and stabilize its heading. ESC and RSC systems can be thought
of as extensions to ABS.
2.3.4 Past RSC System Studies Several studies of the effectiveness of tractor-based RSC systems with heavy vehicles have been
conducted already, but few consist of trailer-based RSC systems. Those completed on RSC systems,

24
however, have rather mixed results, or skip trailer-based RSC testing on vehicles with more than one
articulation point (doubles and triples) completely.
Common backing for ESC over both tractor- and trailer-based RSC systems is found, as many organization
studies have found RSC systems to be barely beneficial if at all. But almost all of these studies were not
conducted on LCVs. For example, the University of Michigan Transportation Research Institute (UMTRI)
has stated that ESC systems slightly outperformed RSC systems in preventing rollovers [30] for five-axle
tractor semi-trailers only, and did not include benefit estimates for multi-trailer combination vehicles
(LCVs). Another example was from NHTSA’s latest work on the roll stabilities of heavy vehicles.
NHTSA has been studying heavy vehicle rollover dynamics since the mid-1990s, and active roll stability
control systems more recently. NHTSA has recommended ESC and TBRSC over RSC systems in both
performance and cost-effectiveness aspects in its FMVSS No. 136 analysis [31]. However, NHTSA used a
vehicle cost per equivalent life saved ratio to determine this, while stating that retrofitting trailer-based
RSC systems was “extremely costly and not cost effective.” This is contradictory to what manufacturers
have said in 2017 [32]. Also, NHTSA’s study was conducted on a set of test vehicles that did not include a
single LCV: two tractors with ESC that were swapped and connected to the same 53’ semi-trailer with RSC,
and three large buses. As said before, a great deal of evaluation on tractor semi-trailers has been done,
as NHTSA additionally tested five baseline tractor semi-trailers as a comparison control in FMVSS 136,
while not even mentioning any LCVs. In addition, while it tested several maneuvers within the study,
NHTSA used only one maneuver (a 150-foot J-turn) to measure the effectiveness of a trailer-based RSC
system, claiming this one maneuver was adequate enough to differentiate the ESC and trailer-based RSC
performances. The biggest source of censure to this claim is that rearward amplification depends on the
maneuver [20], so only using one maneuver to evaluate an articulated vehicle is flawed. Chapter 4 will
provide more explanation as to why several maneuvers are needed, as well as why the J-turn reveals
rearward amplification the least. NHTSA used wheel-lift as a qualitative representative of rollover while
not quantifying how fast or how much the vehicle actually rolled. It is true that wheel lift is an indicator
of rollover, but the two are not synonymous, as wheel lift can happen at numerous axles without vehicle
rollover. Finally, it should be noted that NHTS only tested one of the several trailer-based RSC systems
available in the market today. In summary, NHTSA’s FMVSS 136 mandated ESC on heavy vehicles, but did
not properly test trailer-based RSC systems and also ignored LCVs.
Although RSC support among tractor semi-trailer users is partial, other studies have shown a possibility
for greater potential in trailer-based RSC performance in LCV applications. Sampson and Cambridge

25
University modeled a trailer-based active roll control system for LCV roll simulations. Sampson modeled
several maneuvers, including steady state cornering, a step steering input, and a double lane change
steering input, and successfully studied the effect of rearward amplification on his LCVs, effectively
mimicking driving maneuvers experienced on the road. However, due to his RSC system model
incorporating elements not normally implemented (anti-roll bars) in the modern RSC industry, his findings
of a 27% increase in rollover threshold for his B-double, and 24% for his A-Double [33], should be taken
lightly if compared to potential real driving dynamics for LCVs running trailer-based RSC systems only.
Some LCV investigations have even advised against ESC usage without the aid of trailer-based RSC systems
[34], and others claim that RSC systems are more practical. The claims of the latter type develop from the
fact that LCVs implementing only ESC tend to jackknife more. The dynamics behind this are discussed
further in Chapter 3. A rare published study of the roll dynamics of LCVs using a trailer-based RSC system
was conducted by Hou and Virginia Tech in 2016. Hou’s study involved an A-train double test vehicle
instrumented with both ESC at the tractor and RSC at the two trailers, and focused on a comparative
benefits/drawbacks study of the performance of the two systems in LCVs. The ESC-only configuration
allowed the vehicle to complete the same 150-foot J-turns used by NHTSA at a speed of 12.1% higher than
baseline without rollover, and the trailer-based RSC-only configuration produced a slightly smaller
improvement at 8.3% [35]. Despite the small improvement in rollover speed threshold, the ESC-only
configuration caused the vehicle to oversteer during the J-turn maneuvers. Due to the fear of jackknifing
and thus a severe rollover accident, Hou recommended the sole usage of a trailer-based RSC system over
that of an ESC system.
Many logistics companies do not hold ownership of both tractors and trailers, but still implement LCVs for
their commercial needs through renting. Some, unable to manipulate the tractors they use on their own
accord, must solely rely on improving the roll stabilities of their trailers. Based on past studies of modern
trailer-based roll stability control, an evaluation of an LCV through vehicle instrumentation and testing
would produce a solid conclusion about the performance of trailer-based RSC systems with LCVs. Since A-
train doubles are both the most common and the least stable LCV in North America, the test vehicle should
be an A-train double.
Lastly, available RSC system manufacturers all implement different operation specifics. There are many
areas for unique features, such as interunit communication or additional measured variables. NHTSA’s
study [13, 31, 36] not only missed testing LCVs with trailer-based RSC systems, but they only used one RSC
system. To gain a better, more reliable performance analysis of trailer-based RSC systems, multiple RSC

26
systems from different manufacturers should be tested. Several maneuvers should be tested as well in
order to evaluate trailer-based RSC systems on the effects of rearward amplification on more static and
more dynamic movements.

27
Chapter 3 RSC Braking Suitability for LCVs & A-Doubles
This chapter covers the characteristics of air brake systems used on heavy vehicles: trailer(s) contribution
to total vehicle braking effort and brake signal timings. A comparison between an A-Double and a tractor
semi-trailer is made to highlight better suitability and performance of trailer-based RSC systems for LCVs
as compared with tractor semi-trailers.
3.1 Introduction Due to several reasons introduced in Chapter 2, adding an active stability control system onto solely the
trailers is the only option for many in the trucking industry. The motivation behind the study proposed by
this thesis revolves around the hypothetical increase in trailer-based RSC system performance on LCVs
such as A-Doubles over that on single-trailer vehicle configurations like tractor semi-trailers. RSC systems
use brake application in stabilizing vehicle trailers, and while most passenger cars use hydraulic brakes,
this choice is unwise in heavy vehicles due to the length of articulated vehicles. A theoretical RSC
performance difference arises from two main aspects of the pneumatic brake systems found in US heavy
vehicles. As supplementary trailers are added to a vehicle configuration, both the application and release
times of the brakes and the load transfer during deceleration change considerably. This chapter will cover
the details regarding both by comparing the characteristics of the two most commonly used combination
vehicles: the thoroughly-studied tractor semi-trailer and an A-Double.
3.2 Brake Force Distribution in Heavy Vehicles This section introduces a simplified science of determining braking force distribution under constant
braking conditions, using a braking system analysis which aligns with the largely-adopted UN Braking
Regulations 13 and 13H. The fundamental theory behind these analyses assume no lateral variation in the
wheel and brake forces acting on the vehicle during braking. They also do not include advanced braking
technologies such as ABS and RSC, as they are intended for extreme conditions usage rather than sub-
optimal braking system design compensation. Although RSC systems are used for increasing roll stabilities,
they do so by simply slowing the vehicle and its trailers to stabilize them. A theorized RSC system
performance increase arises from a theoretical increase in trailer brake contribution between a tractor
semi-trailer (ST) and an A-Double (AD). A higher trailer brake contribution to that of the entire vehicle
would result in better braking by a trailer-based RSC system, and help even more in vehicle stabilization.
It should be noted that this chapter does not cover the full 3D dynamic simulation of a road vehicle during
braking, e.g. a multiple degree of freedom model including longitudinal, lateral, and vertical forces and

28
motions, as the dynamic behavior of articulated vehicles is highly non-linear and complicated. This in-
depth look at the dynamics of articulated vehicles during braking is outside the scope of this project.
Instead, a rigid vehicle in dynamic equilibrium is presented with a 2D bicycle model and is used to
determine the braking contributions made by each axle of heavy vehicles to determine if an additional set
of trailer brake axles can affect vehicle braking and therefore vehicle stabilization. No advanced braking
technologies, such as ABS and ESC/RSC, are included in the analysis. The equations used to determine the
braking distributions for the two free body diagrams are discussed below. Again, these equations are not
equations of motion, but rather quasi-static weight transfer equations satisfying Newton’s first law of
equilibrium and second law of motion.
The primary function of a vehicle braking system is decelerating the vehicle. Under both accelerating and
decelerating conditions, a vehicle undergoes weight transfer as rotation about the lateral axis, or pitch,
occurs and the vehicle dips or rises between the axles. In the simplified analysis methods presented in this
section, this longitudinal weight transfer is modeled as vertical deflections at the axles, causing changes
to the dynamic normal reactions at the road surface at each axle, presented in the bicycle models below.
In real-world conditions, lateral weight transfer generated by vehicle roll contributes to the normal
reactions at the tires when braking along a curved road. Again, due to the complexity of a 3D model for
an articulated vehicle, this analysis assumes the vehicle is not cornering during braking to simplify all
lateral forces and contributions to be zero.
Braking performances vary directly with the tire mechanics with the road, as they provide the grip
between the vehicle and the road. Many factors can affect a tire’s ability to provide the proper braking
forces. As tire wear accumulates through vehicle operation, braking performance and safety are both
compromised. The friction coefficient between the road and the tire can vary because of environmental
factors, such as slippery roads due to rain or ice. Fortunately, as will be mentioned in Chapter 4, new tires
were installed at the beginning of each RSC testing week, and the weather for the testing days was very
similar, so nearly constant tire/road relationship parameters were sustained during actual testing. For the
purposes of this analysis, tire mechanics and dynamic forces from the road surface are ignored. The
braking weight transfer is simplified and calculated using the rate of braking, the vehicle units’
wheelbases, and their centers of gravity heights. A deceleration rate of 0.6 g’s was chosen as the rate of
braking, which many car manufacturers view as a sensible design target for basic braking system design
without ABS [37]. The basic theory behind braking presented in this section starts from the quasi-static
approach and assumes no ABS or ESC/RSC operation.

29
When designing braking systems for an articulated vehicle, each unit is considered separately. The same
approach is used in this analysis determining the braking force distribution. Since couplings such as fifth
wheels and pintle hitches are shared by two units, two vertical and two horizontal forces are displayed at
each in both figures. In general, towing units experience the load of the trailer at the fifth wheel, and
trailers experience the supporting normal force of the fifth wheel. Again, under-braked trailers are
generally better arrangements for articulated vehicles, so the tractors experience a negative horizontal
force at the fifth wheels, and the trailers a positive horizontal force.
Figures 3-1 and 3-2 show the 2D free body diagrams of an ST and an AD, respectively, under simplified
dynamic braking conditions. In Figure 3-1, the ST only has two vehicle units while in Figure 3-2, the AD has
four, as the dolly was modeled separately. Unit numbers are encircled in red. Both diagrams display
color-coded forces, with normal reactions at the tires displayed in blue, braking forces in green, vehicle
unit forward momentums in yellow, and vehicle unit weights in orange. A red vertical line in Figure 3-2 is
shown to split the vehicle into halves. Each of these vehicle halves is comprised of two vehicle units. Table
3-1 lists the variables found in Figures 3-1 and 3-2, and provides descriptions for them. The parameter
values used in this analysis are listed in the Appendix.
As seen in Figure 3-2, the converter dolly is modeled separately from the rear trailer. Although small and
seemingly with negligible weight compared to the rest of the vehicle, the converter dolly transfers vertical
load to the rear of the first semi-trailer. Since the converter dolly drawbar is short, the resultant load
transfer is large enough to significantly load the front trailer’s rear axle.
Normal forces at each tire are shown as vertical forces that support the weight and weight transfer during
braking. The rear axles of the tractor and semi-trailer are assumed to be close enough to treat the two
axles as one, located in between the two tire contact locations. The brake forces at each tire are shown
as lateral forces counteracting the momentum of vehicle units. Interunit couplings significantly affect the
braking and the braking performance of the vehicle regardless of the type of braking system it is fitted
with, so fifth wheels and pintle hitches, both of which allow pitch rotation, are modeled as well. The fifth
wheel coupling must be capable of withstanding the lateral forces from accelerating and braking while
carrying a portion of the towed trailer weight, and is thus modeled with both horizontal and vertical forces
for both units. The drawbar at the pintle hitch connects the two halves of the vehicle and transmits both
horizontal and vertical forces between them. Under braking conditions, it is assumed that the drawbar is
in compression, meaning the tractor is decelerating more than the attached trailer. Under-braked trailers
(relative to the tractor) are generally considered to be the better arrangement [37].

30
The equations used to determine the braking distributions for the two free body diagrams are discussed
below. Again, these equations are not equations of motion, but rather quasi-static weight transfer
equations satisfying Newton’s first law of equilibrium and second law of motion. The ST in Figure 3-1 will
be covered first, followed by the AD in Figure 3-2.
Table 3-1. Free body diagram nomenclature and description.
𝑃, 𝑃𝑡𝑖, 𝑃𝐷 Vehicle unit weight of tractor, trailer i, or dolly (N)
𝑁𝑖 Dynamic normal reaction at the road surface of axle i under braking conditions (N)
𝑇𝑖 Brake force at the tire of axle i under braking conditions (N)
𝑧 Braking/decelerating rate of the vehicle in terms of g’s. Usually quoted as a decimal (g)
𝐿1 Horizontal distance from the tractor’s front axle to the tractor’s cg (m)
𝐿2 Horizontal distance from the tractor’s cg to the tractor’s rear axle (m)
𝐿3 Horizontal distance from the front trailer’s front axle to its cg (m)
𝐿4 Horizontal distance from the front trailer’s cg to its rear axle (m)
𝐿5 Horizontal distance from the rear trailer’s front axle to its cg (m)
𝐿6 Horizontal distance from the rear trailer’s cg to its rear axle (m)
𝐿𝐷 Horizontal distance from the dolly’s cg to its axle (m)
𝐸1 Wheelbase of tractor
𝐸2 Wheelbase of front trailer
𝐸3 Wheelbase of rear trailer
𝑐1 Tractor fifth wheel coupling horizontal position relative to its rear axle (m)
𝑐2 Tow hitch horizontal position relative to front trailer’s rear axle (m)
𝑐3 Tow hitch horizontal position relative to dolly’s axle (m)
𝑐4 Dolly fifth wheel coupling horizontal position relative to its axle (m)
ℎ1 Tractor cg height (m)
ℎ2 Tractor fifth wheel height (m)
ℎ3 Front trailer cg height (m)
ℎ4 Tow hitch height (m)
ℎ5 Dolly fifth wheel height (m)
ℎ6 Rear trailer cg height (m)
ℎ𝐷 Dolly cg height (m)

31
Figure 3-1. Brake distribution FBD for an ST under constant braking.
ℎ1 ℎ3
ℎ2
𝐿1 𝐿2 𝐿3 𝐿4
𝐸1 𝐸2
𝑁1 𝑁2 𝑁3
𝑁4
𝑃 𝑃𝑡
𝑇1 𝑇2 𝑇3
𝑇4
𝑃𝑧 𝑃𝑡𝑧
𝑐1
2
1

32
Considering the tractor part (unit 1) of the ST free body diagram (FBD) shown in Figure 3-1 as a separate
unit from the trailer (unit 2), the summation of vertical and horizontal forces are shown in Equation 3-1
and 3-2 below:
𝑁1 − 𝑃 + 𝑁2 − 𝑁4 = 0 (3-1)
𝑇1 + 𝑇2 − 𝑃𝑧 − 𝑇4 = 0 (3-2)
Taking the moments about the contact point between the front wheels and the road determines Equation
3-3:
𝑁4(𝐸 + 𝑐1) + 𝑃𝐿1 − 𝑁2𝐸 − 𝑃𝑧ℎ − 𝑇4ℎ3 = 0 (3-3)
Doing the same for the trailer, but taking the moments about the fifth wheel coupling, provides the
following equations:
𝑁4 + 𝑁3 − 𝑃𝑡 = 0 (3-4)
𝑇4 + 𝑇3 − 𝑃𝑡𝑧 = 0 (3-5)
𝑃𝑡𝑎2 − 𝑁3𝐸2 − 𝑇3ℎ3 − 𝑃𝑡𝑧(ℎ3 − ℎ2) = 0 (3-6)
Brake system designs for articulated vehicles are complicated since the towing units must be designed to
operate with and without the towed trailers, while still having braking systems that are as efficient as
possible. Due to the vertical and horizontal forces transmitted between vehicle units during braking, some
sort of variable braking distribution would be required to avoid braking system performance degradation
of the tractor with the addition of towed trailers. Instead, a fixed braking ratio system is upheld under the
assumption of optimum braking distribution, or when the braking on each axle is proportional to the
normal load supported by the axle [37]. This means that the braking efficiency is 1, which can only occur
at one braking rate, which is specified as 𝑧 = 𝑧1. These assumptions yield the following equations used to
determine the braking forces at each tire for both the ST and the AD, where i is axle i:
𝑇1
𝑁1=
𝑇2
𝑁2=
𝑇3
𝑁3= ⋯ =
𝑇𝑖
𝑁𝑖= 𝑧1 (3-7)
∑ 𝑋𝑖𝑛𝑖 = 1 (3-8)
The braking force distribution can then be determined for a specific rate of deceleration, z, and a brake
system can be designed around a preferred deceleration rate for the less stable and more dangerous

33
vehicle configuration with the trailer(s). As mentioned above, a z value of 0.6 g’s was chosen, which many
car manufacturers view as a sensible design target for basic braking system design without ABS [6, 37].
Equations 3-1, 3-2, 3-3, 3-4, 3-6, and 3-7 (split into equations for 𝑇1, 𝑇2, and 𝑇3) were used with vehicle
parameters available in the Appendix to determine the braking force distribution for a conventional WD-
64 tractor semi-trailer vehicle decelerating at 0.6 g’s. The same process was completed for producing
brake force distribution analysis equations for the conventional A-Double vehicle shown in Figure 3-2.
Resolving forces both vertically and horizontally for the AD tractor yields the following two equations:
𝑁1 − 𝑃 + 𝑁2 − 𝑁4 = 0 (3-9)
𝑇1 + 𝑇2 − 𝑃𝑧 − 𝑇4 = 0 (3-10)
Taking the moments about the contact between the front wheels and the road determines Eq. 3-11:
𝑁4(𝐸1 + 𝑐1) + 𝑃𝐿1 − 𝑁2𝐸1 − 𝑃𝑧ℎ1 − 𝑇4ℎ2 = 0 (3-11)
Doing the same for the trailer, but taking the moments about the fifth wheel coupling, provides the
following equations:
𝑁4 + 𝑁3 − 𝑃𝑡1 − 𝑁5 = 0 (3-12)
𝑇4 + 𝑇3 − 𝑇5 − 𝑃𝑡1𝑧 = 0 (3-13)
𝑃𝑡1(𝐿3 − 𝑐1) − 𝑁3(𝐸2 − 𝑐1) − 𝑇3ℎ2 − 𝑃𝑡1𝑧(ℎ3 − ℎ2) + 𝑁5(𝐸2 + 𝑐2 − 𝑐1) = 0 (3-14)
Unit 3 (converter dolly) equations were completed in the same fashion, with the moment equation taken
about the pintle hitch location, and are listed below as Equations 3-15 to 3-17. Unit 4 (the rear trailer)
equations were created in the same fashion as Unit 2 equations, and are listed below as Eq. 3-18 to 3-20.
𝑁6 − 𝑃𝐷 + 𝑁5 − 𝑁8 = 0 (3-15)
𝑇5 − 𝑇8 + 𝑇6 − 𝑃𝐷𝑧 = 0 (3-16)
𝑇8(ℎ5 − ℎ4) + 𝑃𝐷𝑧(ℎ4 − ℎ𝐷) − 𝑇6ℎ4 + 𝑃𝐷(𝑐3 − 𝐿𝐷) + 𝑁8(𝑐3 + 𝑐4) − 𝑁6𝑐3 = 0 (3-17)
𝑁8 + 𝑁7 − 𝑃𝑡2 = 0 (3-18)
𝑇8 + 𝑇7 − 𝑃𝑡2 = 0 (3-19)
𝑃𝑡2𝐿5 − 𝑃𝑡2𝑧(ℎ6 − ℎ5) − 𝑇7ℎ5 − 𝑁7𝐸3 = 0 (3-20)

34
Figure 3-2. Brake force distribution FBD for an AD under constant braking.
ℎ1 ℎ3
ℎ2 ℎ4 ℎ5
ℎ𝐷
ℎ6
𝐿1 𝐿2 𝐿3 𝐿4 𝑐3
𝑐2 𝐸1 𝐸2 𝐸3
𝐿5 𝐿6
𝑁1 𝑁2 𝑁3 𝑁6 𝑁7
𝑁4 𝑁5
𝑁5
𝑁8 𝑃
𝑃𝑡1 𝑃𝑡2
𝑇1 𝑇2 𝑇3 𝑇6 𝑇7
𝑇5
𝑇4 𝑇8
𝑃𝑧 𝑃𝑡1𝑧 𝑃𝑡2𝑧
𝑐1
1
2 4
3
𝐿𝐷

35
The used parameters are available in the Appendix. The same tractor was used for both the ST and the
AD; the weights for the trailers for the AD were measured using a scale, while the ST’s trailer was
determined from the difference between the max GWVR of a WD-64 semi-trailer truck of 80,000 lbs. This
approach was used since STs are usually loaded to maximum GWVR, while ADs are loaded to maximum
trailer volume rather than weight.
Using the calculated brake forces at each axle, the braking force distribution throughout the vehicle can
be determined by taking the ratio of the brake force at each axle to the combined normal reactions of all
the axles, or the total weight of the vehicle. This agrees with Equation 3-8, where the summation of the
braking force distributions is equal to one. Equations 3-21 and 3-22 below display the calculations for the
braking distributions at each axle i, 𝑋𝑖, for the ST and the AD, respectively. Table 3-2 shows the results for
both the ST and the AD under constant braking at 0.6 g’s.
𝑋𝑖 =𝑇𝑖
𝑃+𝑃𝑡 (3-21)
𝑋𝑖 =𝑇𝑖
𝑃+𝑃𝑡1+𝑃𝑡2+𝑃𝐷 (3-22)
Table 3-2. Brake distribution for each axle in a ST and AD with the same tractor at 0.6 g deceleration.
Brake Distribution Tractor Semi-trailer A-Double
𝑋1 .1946 .2498
𝑋2 .4553 .3129
𝑋3 .3501 .1548
𝑋6 .1815
𝑋7 .1072
Tractor .6499 .5565 Difference
Trailers .3501 .4435 .0934 or 9.34%
Table 3-2 shows that the trailers of the AD contribute more to the total vehicle braking effort under
constant deceleration, as the trailer brake axles contribute around 44.4% of the braking compared to the
35.0% found at the ST trailer axle. This indicates higher vehicle decelerations when using trailer-based RSC
systems and therefore applying brakes only at the trailers in ADs than in STs. Table 3-3 presents the trailer
distribution results for different constant deceleration rates of both vehicles, and shows the general
conclusion to be the same. Harder braking, and therefore higher decelerations, cause more weight
transfer to the tractor, calling for higher tractor braking contribution and lower trailer braking

36
contribution. Table 3-3 shows an increase in trailer braking contribution as the deceleration rate is
increased, implying an even larger trailer-based RSC influence difference between an ST and AD during
emergency braking.
Adding trailer and trailer brakes decreases tractor contribution and distributes the total vehicle brake
effort more along the vehicle. Trailer-based RSC systems may therefore contribute more in ADs than they
do in STs, as higher trailer-brake decelerations can yield higher vehicle stability.
Table 3-3. Trailer brake contributions under different constant deceleration rates for both ST and AD.
Deceleration (g) ST Trailers AD Trailers Difference Dolly Contribution
0.2 .3915 .4728 .0813 .1760
0.3 .3809 .4653 .0844 .1776
0.4 .3705 .4580 .0875 .1790
0.5 .3602 .4507 .0905 .1803
0.6 .3501 .4435 .0934 .1815
0.7 .3402 .4364 .0962 .1826
0.8 .3304 .4294 .0990 .1836
0.9 .3208 .4225 .1017 .1844
1 .3114 .4157 .1043 .1852
2 .2246 .3521 .1275 .1903
The analysis produced an interesting observation regarding the braking contributions made by the dolly’s
axle: as braking efforts and deceleration rate increase, the dolly braking contribution increases. The dolly
contributions are included in the last column of Table 3-3 above. This draws weight towards testing an
RSC system that includes the dolly brakes in the vehicle’s RSC braking application.
3.3 Brake Timing Benefits
3.3.1 Air Brakes Basics Pneumatic brake systems largely originated from application on railway vehicles in order to decrease the
high number of train crashes back in 1869, and were invented by George Westinghouse, the founder of
the Westinghouse Air Brake Company, or WABCO. The basic operation of the pneumatic system called for
charged air to be sent down pipelines to initiate the brake system and release the brakes using the charged
air signal. This system was essentially fail-safe, and became the basis for the modern air brake system

37
used by heavy vehicles today. Their ease of installation and fail-safety were key reasons for pneumatic
brake systems to be used with heavy vehicles over hydraulic brake systems.
Compressed air brake systems are now commonly used on heavy trucks and buses and consist of many
parts and valves in order to complete different functions and fail-safety. Past studies have shown that the
response times typically exhibited by air brake systems are good enough to provide sufficient braking
performance in these heavy commercial vehicles, both in deceleration rates and vehicle stopping
distances. Figure 3-3 displays the stopping distance results from a study performed by Day when
comparing hydraulic and air brake systems on typical trucks when braking is initiated at 60 mph on a dry
road. It should be noted that hydraulically-braked vehicles still perform better due to primarily higher
torque at the front brakes, which also attribute to better braking force distribution under empty trailer
conditions [37]. It is known, however, that the increased stopping distances over hydraulic brake systems
is largely due to the braking application and release timing lags in air brake systems.
Figure 3-3. Stopping distances for typical trucks at 60 mph on dry road [38].
The basic operation of an air brake system largely consists of compressed air in tanks, the brake pedal,
and two separate pneumatic circuits called the supply circuit and the control circuit. A heavily simplified
diagram of the air brake system found in an articulated vehicle is shown in Figure 3-4. The red lines
symbolize the control circuit, while the blue represents the supply circuit. The supply system has the main
responsibility of compressing, storing, and supplying high-pressure air to the brakes as well as the control
system, as Figure 3-4 displays the beginning of the control system sprouting from the primary and
secondary tanks. The control system is responsible for sending a brake application signal initiated by the
brake pedal. The brake pedal is also called the foot valve. The amount of air pressure applied at the brakes
depends on the brake pedal application force, as harder pedal presses cause higher air pressures and vice
versa. The compressor replenishes the supply reservoirs as well as the tanks located throughout the
vehicle.

38
Figure 3-4. Simplified brake system for an A-Double.

39
Air brake systems consist of many different parts such as double check valves and safety valves, and
involve busy tubing systems; the system shown in Figure 3-4 is highly simplified. This simplification was
made since the focus of Figure 3-4 is demonstrating the length of tubing required for a pneumatic signal
sent through the control circuit by the brake pedal to reach the front and rear trailers. It is important to
know that other factors, such as the use of valves, coiled tubing, and tractor brake adjustment levels, also
add to the tractor and trailer brake lags. It has been predicted, due to the large volumes of air that need
to be moved through the system, that LCVs such as an AD will have considerably longer brake application
and release times than an ST.
3.3.2 Brake Application and Release Times FMVSS 121 provided pneumatic timing requirements for brake application and release for heavy vehicles.
However, these timings covered the times between the registration of the service signal at the brake
valves and when a specified psi was reached within the brake chamber, rather than the times between
brake pedal application and the registration of the service signal at different parts of the vehicle. Both
types of timings contribute to brake application time and will be covered in this chapter, although a direct
comparison between an AD and an ST is only available in the first type: brake application and release
times in accordance to FMVSS 121 by NHTSA.
NHTSA tested brake timings for 24 tractor semi-trailer combinations and 7 double trailer combinations.
Gladhand timing of all towing vehicles were connected to a test rig to evaluated to measure the apply and
release times of brakes for different attached trailers. Unfortunately, it was found that the FMVSS 121
trailer test rig was much faster than actual tractors in providing a control signal to attached trailers.
Therefore, the timing results of trailers with the test rig are not representative of actual tractors in real
world conditions. The test rig was reported to apply a control line pressure four times faster than, and
released twice as fast as, the fastest tractor evaluated.
Still, comparisons between semi-trailer combinations and double trailer combinations using similar length
and diameter pneumatic tubing and the same tractor are still valid using NHTSA’s results. It was
determined from their testing that doubles combinations have relatively slow brake timings, as the sheer
length of pneumatic tubing through which the control signal much flow is must longer than that in a semi-
trailer combination. Interestingly, test results for an ST and an AD using the same tractor and same front
trailer produced different average application and release times at the front trailer measured from the
first movement of the brake pedal [39]. The application and release times for the ST trailer were faster

40
than those exhibited by the AD. Although the actual results are inapplicable to real world timings, it is safe
to assume that the trends remain the same under comparable conditions.
3.3.3 Brake Signal Registration Timing Differences between Driver Braking and RSC Braking Brake response time is defined as the time between brake pedal activation to a certain “level of
effectiveness” [40]. For pneumatic brake systems, brake response time is measured as the time between
brake pedal application to the instant when a certain pressure level is reached in the brake chamber. The
analysis presented in this section differs slightly, as a brake registration time is measured from the instant
of brake pedal application to any pressure experienced at the brake chambers, as the brake chamber
pressure for any significant braking is unknown or unspecified for the test vehicle, and cannot be
measured without torque sensors at each braked wheel.
The following plots in Figure 3-5, 3-6, and 3-7 show the significant differences in time in brake registration
when comparing pedal-application braking and RSC-application braking in a conventional A-Double.
Figure 3-5 presents the brake chamber pressures at the driver and passenger side brakes for both the
front and rear trailer during braking initiated by brake pedal application. The black dashed line in the plot
represents the time during which the brake pedal was pressed by the driver. Figures 3-6 and 3-7 show the
driver and passenger side brake chamber pressures at the front trailer and rear trailer, respectively, during
braking with RSC system activations. The dashed black line here represents RSC activation, and the pink
line is an event flag for one of the tests conducted in this study.

41
Figure 3-5. Brake chamber pressures during driver-operated braking in an A-Double.
Figure 3-6. Brake chamber pressures at the front trailer during RSC-operated braking in an A-Double.

42
Figure 3-7. Brake chamber pressures at the rear trailer during RSC-operated braking in an A-Double.
It can be seen that RSC systems, upon determining imminent rollover, apply a brake signal to the
respective trailers on which they are installed, and thus instantaneously deliver braking force using the
trailer’s air tank. On the other hand, pedal-application braking delivers a pneumatic signal that must travel
through the vehicle lines before applying brake pressures. Although this application pressure is released
immediately, the time that the pneumatic signal takes to travel the length of the vehicle is simply too large
for evasive or emergency situations, especially on the highway. As seen in Figure 3-5, the braking of the
rear trailer (+3 seconds after brake pedal application) lags behind that of the front trailer (+2 seconds after
brake pedal application), as logically it takes longer for the rear trailer to receive a pneumatic signal than
for the front trailer. Since rearward amplification affects the rear trailer further, this brake lag experienced
at the last trailer is even worse than it seems.
Brake release times are an important aspect of brake registration time as well, and again, RSC systems
show instantaneous brake release times. Longer lags than those seen in brake application times are
present for the pedal-applied braking, as the front trailer takes around 3.5 seconds and the rear trailer
takes 5 seconds to release their brakes after the pedal is released.

43
It should be noted that the dip in brake chamber pressures at 10-14 seconds in Figure 3-5 occurs from the
driver releasing the brake pedal enough to not reach the necessary threshold to apply brake pressure,
while technically still applying the brake pedal. Regardless, lags in the front and rear trailer brake chamber
pressures are still visible within that time period. A sudden spike is seen in the RSC-activated brake
chamber pressures at the front trailer at 3-4 seconds in Figure 3-6. This spike occurs due to ABS releasing
pressure in a predicted wheel lockup case, only for the ABS action to be canceled upon further
calculations. Small jumps in pressure are seen right before the first RSC activations in Figures 3-6 and 3-7.
These are test pulses sent by the RSC modulators as they check the vehicle’s roll conditions.
Unfortunately, a similar approach in determining the brake registration lag for an ST is unavailable due to
a lack of a semi-trailer. It is also unavailable through literature despite a comprehensive review of brake
timing studies. However, it is fair to assume that the brake registration lag of an ST is lower than those
shown in an AD in consideration of two facts: NHTSA’s study results showing ST valves and glad hands
reacting faster than those in the AD, and the longer vehicle length and therefore longer pneumatic line
length of an air brake system in an AD over that found in an ST.
In conclusion, trailer-based RSC systems will have a larger influence on the braking timings of an AD than
on an ST since brake pedal signals must travel longer distances in an AD under driver-operated braking.
This is especially true for the rear trailer of an AD, as rearward amplification also affects it more than the
front trailer. Although the differences between the brake application and release times of driver braking
and RSC braking on an AD seem minimal, the additional 2-3 seconds in lag are invaluable time during
emergency or evasive maneuvers.
3.4 Summary Although past studies on tractor semi-trailers indicate that RSC systems are not effective as a tractor-
based stability control system such as ESC, it is predicted through the presented analyses in this chapter
that trailer-based RSC systems can achieve higher efficiencies on trucks with multiple trailers, such as A-
Doubles, than on tractor semi-trailers. Both the trailer braking contribution to the total vehicle braking
effort and the timing improvements found in RSC usage over driver-operated brake lag show that RSC
systems are more suitable for ADs than they are for STs. It is therefore necessary to evaluate RSC systems
on LCVs, such as a double, due to the combination of the analyses in this chapter and the low number of
related studies regarding RSC performance on LCVs. In addition, as mentioned in Chapter 2, trailer-based
systems can reduce the likelihood of jackknifing when braking [35].

44
The braking analysis in this chapter consisted of highly simplified modeling and constant decelerations on
straight roads, as the high non-linearity found in LCV dynamics in a 3D braking model was outside the
scope of this project. However, field testing is applied to directly evaluate the performance of trailer-
based RSC systems in several braking applications. Brake contribution from the dolly increased with
deceleration rate, so there is some motivation behind evaluating an RSC system that includes dolly brakes.

45
Chapter 4 Track Testing with 28 foot A-Double
This chapter discusses the entirety of the preparation for track testing an experimental 28’ A-Double,
otherwise known as a western double. There were six main points to the vehicle instrumentation: the
anti-jackknifing systems, safety outriggers, load frames, trailer reinforcement beams, the steering robot,
and the data acquisition system. This includes both the mechanical and electrical vehicle instrumentation
completed in order to prepare the vehicle for testing. The chapter ends with a summary and description
of the test maneuvers run during testing, as well as the reasoning behind the test maneuvers chosen.
4.1 Mechanical Preparations
The majority of the efforts undertaken on the mechanical side of vehicle instrumentation were made for
safety concerns and vehicle preservation during testing, and were implemented by a team of five
members. Five of the six main instrumentations will be covered in Section 4.1: the safety outriggers, the
load frames, the trailer reinforcement beams, the anti-jackknifing systems, the steering robot, and the
data acquisition system. The anti-jackknifing system involved a series of ropes and chains to keep the
vehicle units from reaching articulation angles indicative of jackknifing. The steering robot was essential
in providing repeatable testing maneuvers and therefore reliable data via the DAQ system and sensors.
The outriggers were used to determine if the vehicle had rolled during a maneuver while keeping the
vehicle upright. The load frame adjusted the two semi-trailers to simulate a realistic center of gravity and
weight distribution during testing. Finally, the reinforcement beams strengthened the trailer bodies to
withstand forces exerted by load frame and outriggers during roll. Figure 4-1 shows these key
instrumentations. Each of these five will be detailed in the following sections and then the section will
conclude with other preparations made to the vehicle for testing.
Figure 4-1. Vehicle instrumentation.

46
4.1.1 Outriggers
The testing conducted for this study was obviously aimed at evaluating the roll stability of the test vehicle.
Considering the proposed test objective, outriggers to prevent the vehicle from rolling over while still
allowing all indicative signs of rollover were necessary. Outriggers, or projecting structures on a vehicle
that usually aid its lateral stability, would protect the vehicle, its passengers, and the custom installation
work done on it. A thorough literature review was conducted on outrigger designs used in prior roll
stability projects in the particular area of designing outriggers that met all of the following specifications:
The outriggers needed to provide sufficient enough rigidity and strength to save and support a
conventional 28’ A-Double from rollover in extensive testing.
The outrigger contact wheels needed to be strong enough to survive countless hits of various
force magnitudes while being light enough to provide a negligible stabilizing moment.
The outriggers needed to be collapsible in order to transport the test vehicle from its
instrumentation location at CVeSS to the testing facility via highway travel.
The outriggers needed to provide enough sprung mass roll angle to determine that roll was
imminent while also keeping the vehicle upright before lateral accelerations grew too great.
The outrigger wheel heights needed to be adjustable in order for quick changes for conducting
tests with different objectives.
The outriggers and their weight needed to generate the minimum possible effects on trailer
rotational inertia.
The loads experienced by the outrigger contact wheels needed to be distributed evenly onto the
trailer frames.
The outriggers needed to supply enough ground clearance to allow passage under the vehicle.
Considerable design work was done by CVeSS due to the fact that the previous outrigger designs did not
meet all of the comprehensive specifications listed above. Figure 4-2 displays the final design of the
outriggers, which were designed to be mounted to the underside of the two trailers with collapsible
capabilities. As seen in Figure 4-2, the outrigger assembly is made of three main parts: two outboard
beams containing the contact wheel, and the inboard beam used to attach the assembly to the bottom of
each trailer. The outriggers also feature a hinge at the connections of the outboard beams to the inboard
beam to allow for adjustable outrigger wheel heights. Two rows of bolt holes are used to mount the
assembly to the laterally running trailer frame rails under the body.

47
Figure 4-2. CVeSS outrigger schematic.
The CVeSS outrigger design was largely inspired by the latest generation of NHTSA’s safety outriggers [41],
which were used as guidelines and standards. NHTSA’s Class 8 trailer outriggers also feature foldable
outboard beams, adjustable contact wheel heights, and a light but strong contact wheel. CVeSS adopted
these contact wheels made of a high density polyethylene compound which was strong enough to resist
massive contact forces during rollover, and light enough to be negligible even when extended seven feet
laterally out from the trailer walls. After extensive setup testing completed prior to actual track testing,
the wheel height, or the distance between the bottom of the outrigger wheel at seven feet out to the
ground, was set at nine inches, as shown in Figure 4-3. This height was chosen because outrigger contact
meant initial wheel lift at the other side of the vehicle. Figure 4-3 also shows a latch used to secure the
outrigger wheel from reaching heights under 9” during operation unintentionally due to vibrations or
structural fatigue.
Figure 4-3. Outrigger wheel height.
9”

48
The largest difference between the CVeSS outrigger design and that of NHTSA’s (as well as all other trailer
outrigger designs) is the added feature of contact force measuring at the contact wheel. This was done as
an effort to use a novel method in quantifying rollover events instead of simply identifying them with
wheel lift as NHTSA has done in the past. Two large-scale load cells were mounted within the outrigger
inboard beam for this capability, as shown in Figure 4-4. NHTSA designed for and documented a load
rating of 11,000 lbf for their outboard beam due to the massive weight of Class 8 trailer in motion, and a
simple statics analysis determined the necessary load cell measurement range of 0 – 200,000 lbf. These
potential enormous contact forces can be safely measured and evenly distributed to the trailer frames.
The electrical work required for instrumenting and using the load cells calls for the ground clearance
requirement previously mentioned. Figure 4-4 also shows many parts, namely the threaded rod, which
are used to adjust the wheel height and transfer load from the wheel to the high-capacity tension load
cell.
Figure 4-4. Load cell in outriggers.
4.1.2 Anti-Jackknifing System
Although the scope of this study does not involve jackknifing, it was still a major concern for the test
vehicle during track testing. A large effort was taken to prevent any anti-jackknifing for safety precautions
for, again, the vehicle as well as the humans in it. Since the roll and yaw motions are coupled, especially
in aggressive maneuvers, stabilizing the yaw at each of the two articulation points of the test vehicle
without affecting the roll dynamics during maneuvers is difficult. However, a support for the vehicle’s yaw
instability is needed just as the outriggers are needed for its roll instabilities. To accomplish this, CVeSS
Tension load cell
Threaded rod
Inboard beam
Outboard beam

49
used an arrangement of heavy-duty ropes and chains at both articulation points to simply constrain the
maximum articulation angles allowed between adjacent vehicle units.
The primary feature of this anti-jackknifing system, or AJS, is the kinetic energy ropes used with its metal
chains. The ropes absorb kinetic energy when elongated as the articulation angle exceeds a designed
threshold length. This dissipation of yaw inertia is more gradual than other active anti-jackknifing control
systems. The metal chains are used as a backup to the ropes for situations when they are overloaded or
are not quick enough to absorb energy during severe instability, and are accordingly installed in parallel
with the ropes. Contrary to the ropes, the chain only engages at the maximum allowed articulation angle
and therefore when the ropes reach their maximum allowed lengths as well. Additional pintle hooks are
mounted to the corners of both units involved in the two articulation points in order to connect AJS. A
schematic of the AJS installed at both articulation points is shown in Figure 4-5.
Figure 4-5. Anti-jackknifing system (AJS) ropes and chains diagram.
Simple 3-D geometry and math calculations were completed to determine the starting lengths of the rope
and chains after some TruckSIM simulation studies for Case 1 (shown in Figure 4-6) running maneuvers
discussed later in this chapter. If the ropes are too long, both scenarios of jackknifing, as well as trailer-to-
trailer contact, are allowed to happen. If the ropes are too short, the vehicle would no longer act as an A-
Double, but rather a B-double in the manner that Trailer B followed Trailer A’s path seemingly without an

50
articulation point at the dolly. Because of the behavior predicted in the latter, the ropes were included in
the TruckSIM model as springs with high stiffnesses. Variables under consideration were the maximum
articulation angles between two units, as well as yaw inertia moments to purchase the correct strength
rope. Pre-testing experimental trial and error was used to check and adjust lengths when either not
enough vehicle maneuverability was demonstrated, or when too much articulation during test maneuvers
was reached.
As seen in Figure 4-5, there are several more ropes and chains at the dolly than there are at the tractor
end. This is done because there are two degrees of freedom (DoF) at the dolly due to its pintle hitch and
fifth wheel, while the articulation point at the tractor and Trailer A only has one Dof at the fifth wheel.
Two types of jackknifing can arise due to the two DoFs: trailer and dolly jackknifing. Examples of both
types of jackknifing are shown in Figure 4-6, which shows the importance of the longitudinal set of ropes
and chains (colored red in Figure 4-5) and the cross set (yellow ropes and blue chains) in prohibiting these
two jackknifing scenarios between Trailer A and Trailer B.
Figure 4-6. Two jackknifing scenarios between Trailers A and B.
Parallel Set
Cross Set
Scenario 1: Trailer Jackknifing
Scenario 2: Dolly Jackknifing
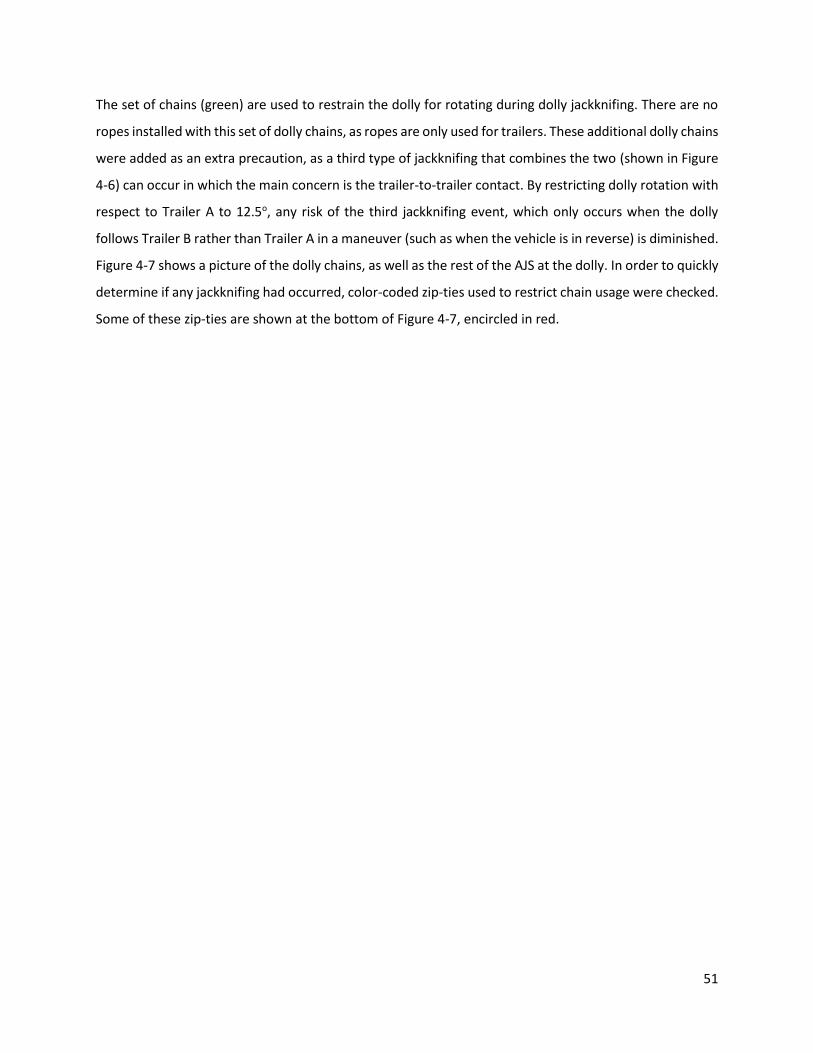
51
The set of chains (green) are used to restrain the dolly for rotating during dolly jackknifing. There are no
ropes installed with this set of dolly chains, as ropes are only used for trailers. These additional dolly chains
were added as an extra precaution, as a third type of jackknifing that combines the two (shown in Figure
4-6) can occur in which the main concern is the trailer-to-trailer contact. By restricting dolly rotation with
respect to Trailer A to 12.5o, any risk of the third jackknifing event, which only occurs when the dolly
follows Trailer B rather than Trailer A in a maneuver (such as when the vehicle is in reverse) is diminished.
Figure 4-7 shows a picture of the dolly chains, as well as the rest of the AJS at the dolly. In order to quickly
determine if any jackknifing had occurred, color-coded zip-ties used to restrict chain usage were checked.
Some of these zip-ties are shown at the bottom of Figure 4-7, encircled in red.
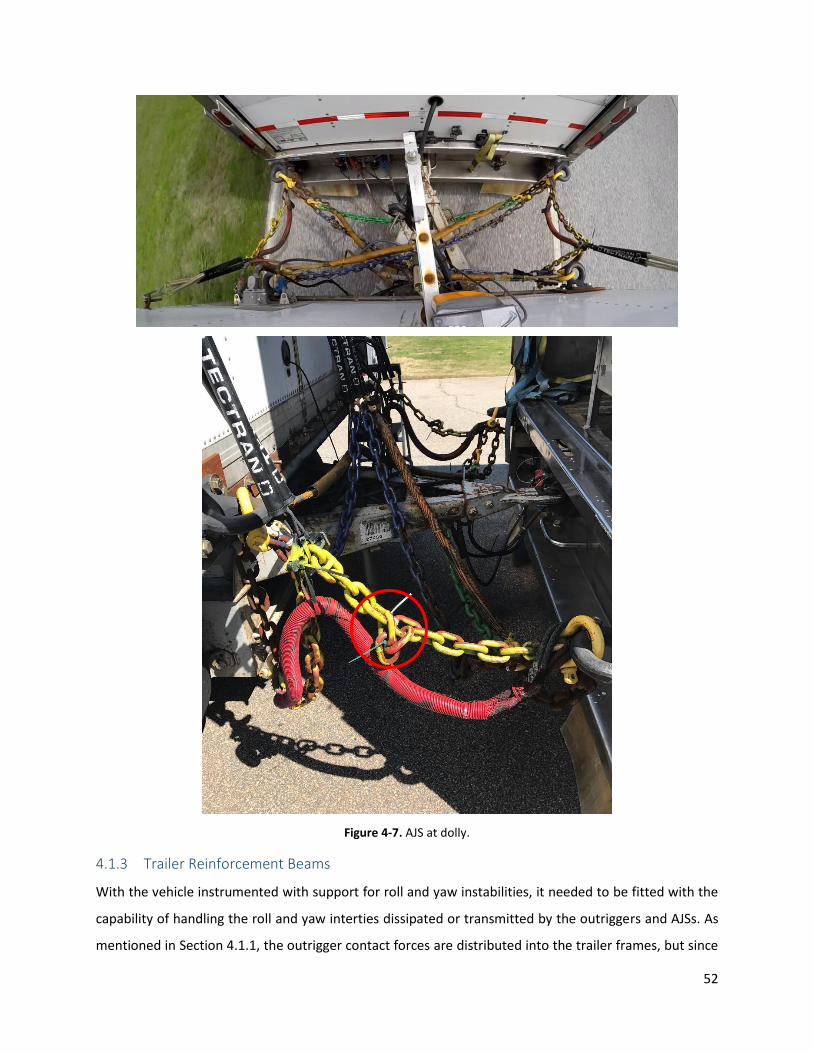
52
Figure 4-7. AJS at dolly.
4.1.3 Trailer Reinforcement Beams
With the vehicle instrumented with support for roll and yaw instabilities, it needed to be fitted with the
capability of handling the roll and yaw interties dissipated or transmitted by the outriggers and AJSs. As
mentioned in Section 4.1.1, the outrigger contact forces are distributed into the trailer frames, but since

53
the semi-trailers are not designed to handle these loads, they can be severely damaged. Also, although
the pintle hooks, ropes, and chains were durable enough to withstand trailer yaw moments, the trailer
walls they were mounted to were not. Because of the need for structural strengthening for the scope of
the study, roll and yaw reinforcement structures were created.
Figure 4-8 shows two views of a Solidworks CAD model of a semi-trailer with the complete reinforcement
beam structure that was installed onto each of the two trailers in red. These structures were assembled
using 4 in square steel rectangular beams along with steel gusset plates and SAE Grade 8 bolts, nuts, and
washers. By mounting these structures to the trailer frame rails, force transfer from the outrigger wheels
and anti-jackknifing systems was carried to the frame rails. The weight of these structures was considered
in the calculation and design of the trailer cg, which is covered in the next subsection. A closer look at the
roll reinforcement structure assembly (RRS) is labeled in Figure 4-8 and is shown in Figure 4-9.

54
Figure 4-8. Reinforcement beam structures and placement in trailer.
Roll Reinforcement Structure
Yaw Reinforcement Structure
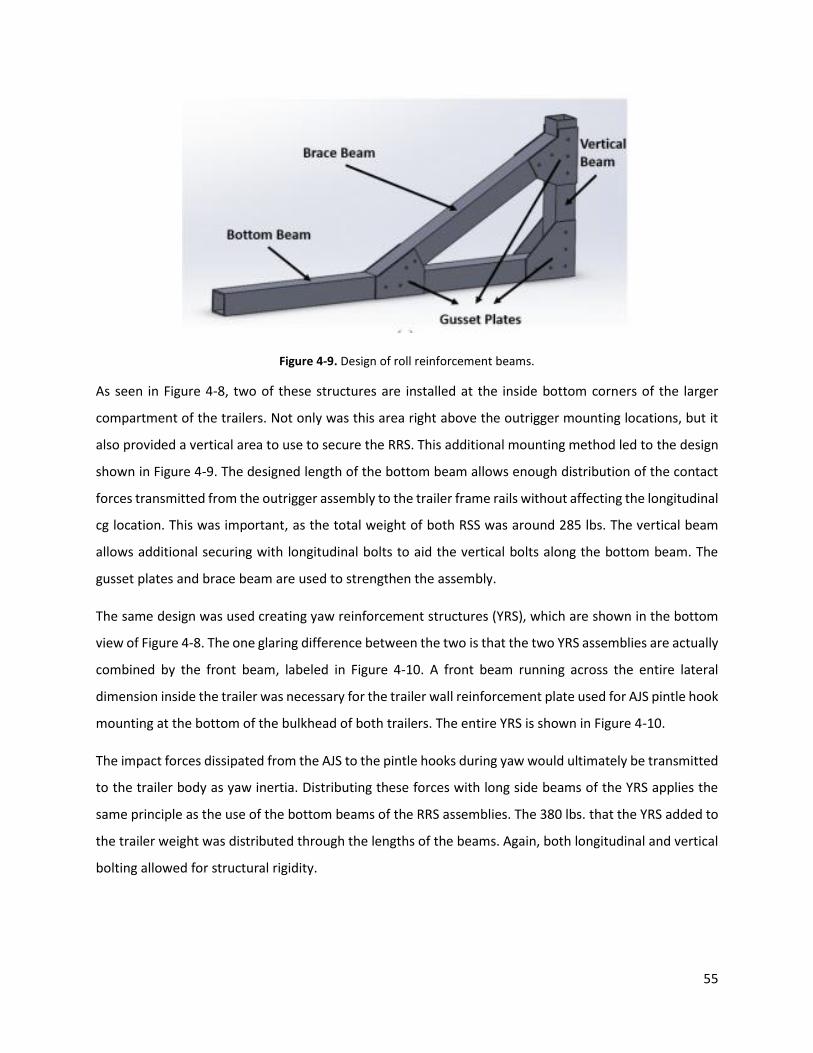
55
Figure 4-9. Design of roll reinforcement beams.
As seen in Figure 4-8, two of these structures are installed at the inside bottom corners of the larger
compartment of the trailers. Not only was this area right above the outrigger mounting locations, but it
also provided a vertical area to use to secure the RRS. This additional mounting method led to the design
shown in Figure 4-9. The designed length of the bottom beam allows enough distribution of the contact
forces transmitted from the outrigger assembly to the trailer frame rails without affecting the longitudinal
cg location. This was important, as the total weight of both RSS was around 285 lbs. The vertical beam
allows additional securing with longitudinal bolts to aid the vertical bolts along the bottom beam. The
gusset plates and brace beam are used to strengthen the assembly.
The same design was used creating yaw reinforcement structures (YRS), which are shown in the bottom
view of Figure 4-8. The one glaring difference between the two is that the two YRS assemblies are actually
combined by the front beam, labeled in Figure 4-10. A front beam running across the entire lateral
dimension inside the trailer was necessary for the trailer wall reinforcement plate used for AJS pintle hook
mounting at the bottom of the bulkhead of both trailers. The entire YRS is shown in Figure 4-10.
The impact forces dissipated from the AJS to the pintle hooks during yaw would ultimately be transmitted
to the trailer body as yaw inertia. Distributing these forces with long side beams of the YRS applies the
same principle as the use of the bottom beams of the RRS assemblies. The 380 lbs. that the YRS added to
the trailer weight was distributed through the lengths of the beams. Again, both longitudinal and vertical
bolting allowed for structural rigidity.

56
Figure 4-10. Yaw reinforcement structure.
4.1.4 Load Frame
In order to provide the most realistic study possible, properly loaded trailers are needed. Therefore,
ideally, a typical loading configuration found in highway-used 28’ drop-frame trailers was also used for
the testing in this project. These drop-frame trailers are frequently employed in the trucking industry for
their improved volumetric spacing, allowing greater logistic efficiency as shipped packages usually carry
more volume than mass. A model of a drop-frame trailer is shown in Figure 4-11.
Also shown in Figure 4-11 is a red mass inside the trailer, which is representative of a typical loading
configuration (according to management within a large trucking industry company) of a drop-frame
trailer: 6,000 lbs. distributed across 75% of the available volume within the trailer. Table 4-1 displays the
numbers behind this typical load, including cg position. The variables presented in Table 4-1, most
importantly the cg location, needed to be replicated in order to simulate the empty test trailers as trailers
with the dynamic characteristics as they are usually loaded.

57
Figure 4-11. Drop frame trailer and typical loading configuration.
Table 4-1. Typical load properties for 28’ drop frame trailer.
Typical Loading
Configuration
Total weight 6,000 lbs.
CG height from ground 74.8 in.
CG longitudinal distance
from bulkhead 170.66 in.
Roll inertia at ground 117839173 𝑙𝑏 ∙ 𝑖𝑛2
Pitch inertia at ground 235916591 𝑙𝑏 ∙ 𝑖𝑛2
Yaw inertia at fifth wheel 450541787.02 𝑙𝑏 ∙ 𝑖𝑛2
A load frame designed by CVeSS was created for this purpose. A double-layered pallet-rack structure
holding sandbags was chosen as the suitable design with the following listed capabilities:
Compensate for the effects of outriggers and reinforcement structures on cg height and moments
of inertia,
Withstand outrigger wheel impact forces and the resulting accelerations from cornering and
braking, and
Take advantage of the vertical volume available in the trailer while circumventing the rolling table
situated in the middle.
The load frame structure allowed for these extra capabilities due to its design, such as the ability to adjust
the height of the pallets and adjust the weight by removing or adding sandbags. These sandbags made up
the remaining weight needed to mimic a loaded trailer.

58
Four I-beams and pallet rack loading beams were used to create the structure of the assembly, and the I-
beams were fixed to the floor and to each other. Several measures were taken in order to secure the load
frames securely, as they would roll with the trailer collectively. L-brackets were used to secure the I-
beams to the rolling table, and steel cables from the four bottom corners of the trailer were used to fix
the load frame further. Another load-supporting frame structure that ran two lateral support racks to back
the two pallet racks was added for further support against rollover.
FEA on the load frame design was done using SOLIDWORKS, and the results are shown in Figure 4-12. As
seen in the figure, the maximum stress of approximately 20,000 lb. from a uniformly-applied 2,500 lb. and
1,259 lb. vertical and lateral force, respectively, is much lower than the yield strength of the assembly
(approximately 36,000 psi).
Figure 4-12. SOLIDWORKS FEA analysis on load frame.
The design for the CVeSS load frame is shown in Figure 4-13. It should be noted that this 3D model does
not include the lateral load supporting frame, securing steel cables, and the 50-lb. sandbags used to make

59
up the rest of the weight. Instead, Figure 4-14 shows the entire side of Trailer B and displays the entire
load frame system.
Figure 4-13. Model of load frame within a trailer.
The total weight of the outriggers, load frame, and reinforcing structure systems was approximately 2,600
lbs. The rest of the 3,400 lbs. were added by sandbags, with 34 in each pallet. Once loaded, the double-
bagged sandbags are secured down within the pallets using wood beams and ratchet straps. The correct
weight and distribution of this load is the second most important need in this study, and the results of the
load frame implementation on both are shown in Table 4-2. These results were considered acceptably
within the range of desired values by the test team.
Table 4-2. Trailer load characteristics.
Typical Loading
Configuration
Instrumented Trailer
Loading % Difference
Total weight 6,000 lbs. 5,980 lbs. -0.002%
CG height from ground 74.8 in. 73.68 in. -1.5%
CG longitudinal distance
from bulkhead 170.66 in. 167.2 in. -2%
Roll inertia at ground 117839173 𝑙𝑏 ∙ 𝑖𝑛2 129415570.94 +9.8%
Pitch inertia at ground 235916591 𝑙𝑏 ∙ 𝑖𝑛2 215165643.01 -8.8%
Yaw inertia at fifth wheel 450541787.02 𝑙𝑏 ∙ 𝑖𝑛2 399924978.36 -11.2%

60
Figure 4-14. Entire Load frame system.
4.1.5 Steering Robot
The single most important aspect of test preparation was the creation of a steering robot. Without several
testing constants, such as tire and road conditions, trailer loading configuration, suspension
characteristics, etc., RSC system comparisons would not be valid. Among these needed constants, steering
input for the same maneuver is absolutely crucial. Having a steering robot to handle steering brings about
several advantages over having a professional driver. Some standard test maneuvers require precise
steering inputs, and the more identical each test run is the better. Also, since both the number of tests
planned is massive and test track availability is limited, testing must be completed over several weeks.
The difference in repeatability found in machines over humans is even larger when the testing is over
several weeks. Obviously there is less error in maneuvering during valuable test track time as well.

61
Most commercially available steering robots for Class 8 tractors regulate the vehicle speed during
operation and also cost nearly $200,000. The steering robot made at CVeSS does neither. The hardware
for the robot is installed in the engine bay and operates by applying a coded steering input directly at the
steering column. A clamp design around the steering column means that this steering robot could be
installed on any steering column of 1.5 in diameter with enough space in the engine bay to accommodate
the hardware shown in Figure 4-15. The steering robot module includes a motor/gearbox/controller unit,
a roller chain to link the motor to the steering column, split spherical roller bearings, and a torque reaction
mount. A disadvantage along with the inability to automate vehicle speed is the need for an additional
operator during vehicle operation to run, control, and modify the robot or steering inputs.
Figure 4-15. Steering robot hardware in engine bay.
For safety, the steering robot engages via control by a Deadman’s switch. At all times when the Deadman’s
switch is not on, the driver has full control of the vehicle. The steering input for every test must be pre-
loaded into the controller with the laptop and appropriate software. Operation of the steering robot
therefore requires another passenger within the cab. As explained before, the CVeSS steering robot does

62
not control the vehicle speed, so the driver is always in control of the throttle, brakes, and gear changes
during vehicle operation. An emergency stop switch was mounted on top of the dashboard to terminate
any undesired, dangerous steering results.
Most of the effort done to install an operational steering robot required extensive controls work and
knowledge. Some electronic discussion regarding the steering robot and data acquisition system will be
discussed in Section 4.2. The controls behind the steering robot will not be covered in this paper.
4.1.6 Other Hardware Setups Several other preparations were made to the vehicle in preparation for testing, the most important of
which was the painting of the vehicle wheels. All axle tires were painted white so that wheel lift and wheel
lock were more easily discernible in testing and in video recording during post analysis. This is shown in
Figure 4-16.
Also shown in Figure 4-16 is one of the outriggers. The outrigger wheels were taped with yellow and black
warning tape for the same purpose of ease of visibility during testing and post analysis of outrigger hits.
Taping of the vehicle wheels was repeated for each set of new tires installed at the beginning of every test
week. New tires ensured similar tire dynamics week to week, allowing valid RSC performance
comparisons. The figure shows a clean central portion of the outrigger wheel, which occurs when enough
rollovers have happened and the tape is ripped off.
Figure 4-16. Outrigger wheel and vehicle wheel preparation.
Several other hardware implementations were undertaken for installing the necessary sensors, and will
be covered in Section 4.2.

63
4.2 Data Acquisition System
This section covers the sensor and data acquisition system instrumentation for the vehicle used for this
study. There were a total of 31 sensors that were calibrated, installed, and used on the vehicle at first, but
only a certain number of them were used for main evaluation of RSC performances. Based on the nature
of RSC systems, it was found that the most important sensors for this study were the trailer pressure
sensors, load cells, steering wheel angle sensor, and accelerometers. The other sensors, such as the LIDAR
sensors (from LEDDAR) and string potentiometers, were found to be more important for collecting
information regarding the vehicle dynamics and suspension. The following sections will cover the details
regarding the installation and purposes of the pressure, load cells, steering wheel angle, and
accelerometer sensors, as well as the data acquisition system used with them – the National Instrument
CompactRIO.
A total of 31 sensors were installed on the vehicle, and even though only four types of sensors were used
for RSC performance gauging, the others were still used to gain valuable information regarding the
dynamics of the vehicle for future analyses. The tractor and trailer suspension information can be used to
model the vehicle in TruckSim to simulate even more configurations than were professionally tested. The
following sections cover both the sensors used for measuring RSC performances.
The overall sensor list and setup are shown in Table 4-3 and Figure 4-17, respectively. Figure 4-17 shows
the general area of the sensors on the vehicle, as well as the LED lights and GoPro cameras. Figure 4-17
also shows how the multiple sensors are powered and managed by junction boxes. These junction boxes
are denoted as JB1 and JB2 for Trailer A and Trailer B, respectively. A third “Power” box is found in the
cab with the data acquisition unit and several sensors. Table 4-3 consists of the sensor type, brand, model,
measurement range, necessary supply voltage, output data format, sensor label, and application. The
sensors detailed in this section are highlighted in blue.

64
Figure 4-17. Overall sensor schematic. A total of 30 sensors in total are used.

65
Table 4-3. Overall sensor list and details.
Sensor Type Brand and Model Measurement
Range
Supply
Voltage
Output
Type Label Application
1 String
potentiometer
Uni Measure – VP510-
10-NJC 0 – 10 in. 25 V Max. Analog SP-3
Suspension travel on driver’s side
– rear trailer
2 String
potentiometer
Uni Measure – VP510-
10-NJC 0 – 10 in. 25 V Max. Analog SP-4
Suspension travel on passenger’s
side – rear trailer
3 String
potentiometer
Uni Measure – VP510-
10-NJC 0 – 10 in. 25 V Max. Analog SP-5
Suspension travel on driver’s side
– tractor
4 String
potentiometer
Uni Measure – VP510-
10-NJC 0 – 10 in. 25 Volts Max. Analog SP-6
Suspension travel on passenger’s
side – tractor
5 String
potentiometer
Uni Measure – HX-
P510-15-NJC-N6-L3M 0 – 15 in. 4.9 – 30 VDC Analog SP-S Steering wheel angle
6 Pressure
transducer
OMEGA – PX329-
200G5V 0 – 200 psi 9 – 30 VDC Analog PS-1 Air tank pressure – rear trailer
7 Pressure
transducer
OMEGA – PX329-
200G5V 0 – 200 psi 9 – 30 VDC Analog PS-2
Airbag pressure on driver’s side –
rear trailer
8 Pressure
transducer
OMEGA – PX329-
200G5V 0 – 200 psi 9 – 30 VDC Analog PS-3
Airbag pressure on passenger’s
side – rear trailer
9 Pressure
transducer
OMEGA – PX329-
200G5V 0 – 200 psi 9 – 30 VDC Analog PS-4
Airbag pressure on driver’s side -
tractor
10 Pressure
transducer
OMEGA – PX329-
200G5V 0 – 200 psi 9 – 30 VDC Analog PS-5
Airbag pressure on passenger’s
side - tractor
11 Load cell OMEGA – LC714 0 – 200,000 lb. 10 VDC (15
VDC max.) Analog LC-1
Outrigger contact force on
driver’s side – rear trailer
12 Load cell OMEGA – LC714 0 – 200,000 lb. 10 VDC (15
VDC max.) Analog LC-2
Outrigger contact force on
passenger’s side – rear trailer
13 Load cell OMEGA – LC714 0 – 200,000 lb. 10 VDC (15
VDC max.) Analog LC-3
Outrigger contact force on
driver’s side – front trailer
14 Load cell OMEGA – LC714 0 – 200,000 lb. 10 VDC (15
VDC max.) Analog LC-4
Outrigger contact force on
passenger’s side – front trailer
15 Laser sensor Omron ZX1-LD600A86 200 – 1,000 mm
(7.87 – 39.37 in.) 30 VDC max. Analog LS-1
Outrigger distance to the ground
on driver’s side – rear trailer

66
16 Laser sensor Omron ZX1-LD600A86 200 – 1,000 mm
(7.87 – 39.37 in.) 30 VDC max. Analog LS-1
Outrigger distance to the ground
on passenger’s side – rear trailer
17 Accelerometer PCB 3713D1FD3G 0 – 3G 6 – 30 VDC Analog A3-3-1 Longitudinal, lateral, and vertical
acceleration – tractor frame
18 Accelerometer PCB 3713E1150G 0 – 50G 6 – 30 VDC Analog A3-50-2 Longitudinal, lateral, and vertical
acceleration – front trailer
19 Accelerometer PCB 3713D1FD3G 0 – 3G 6 – 30 VDC Analog A3-3-2 Longitudinal, lateral, and vertical
acceleration – rear trailer
20 Accelerometer PCB 3741D4HB10G 0-10G 6 – 30 VDC Analog A1-4273 Lateral acceleration – front trailer
21 LIDAR sensor LeddarTech M16 0 – 25 m
(0 – 85 ft) 12 – 24 VDC Digital LD-1
Articulation angle between the
tractor and the front trailer
22 LIDAR sensor LeddarTech M16 0 – 25 m
(0 – 85 ft) 12 – 24 VDC Digital LD-2
Articulation angle between the
front trailer and the rear trailer
23 GPS Garmin GPS 18x-5Hz N/A 5 VDC Digital N/A Tractor travelling speed and path
24 GPS Chang Hong Information
GPS Magnetic Antenna N/A 2.3 – 5.5 VDC Digital N/A Tractor traveling speed and path
25 IMU SparkFun Electronics
LSM9DS1 0 – 8G 1.9 – 3.6 VDC Digital IMU-T
Accelerations and angular rates in
3D – tractor cab
26 IMU SparkFun Electronics
LSM9DS1 0 – 8G 1.9 – 3.6 VDC Digital IMU-A
Accelerations and angular rates in
3D – front trailer
27 IMU SparkFun Electronics
LSM9DS1 0 – 8G 1.9 – 3.6 VDC Digital IMU-B
Accelerations and angular rates in
3D – rear trailer
28 Time of Flight
Sensor
ST Microelectronics
VL53l0X 0 – 2 m 2.6 – 3.5 VDC Digital TF1
Outrigger distance to the ground
on driver’s side – front trailer
29 Time of Flight
Sensor
ST Microelectronics
VL53l0X 0 – 2 m 2.6 – 3.5 VDC Digital TF2
Outrigger distance to the ground
on passenger’s side – front trailer
30 Time of Flight
Sensor
ST Microelectronics
VL53l0X 0 – 2 m 2.6 – 3.5 VDC Digital TF3
Outrigger distance to the ground
on driver’s side – rear trailer
31 Time of Flight
Sensor
ST Microelectronics
VL53l0X 0 – 2 m 2.6 – 3.5 VDC Digital TF4
Outrigger distance to the ground
on passenger’s side – rear trailer

67
4.2.1 Tractor Hardware There are a total of ten total sensors located on the tractor, four of which are located in or on the cab.
This list includes two GPS units, one string potentiometer (steering wheel angle sensor), and an inertial
measurement unit (IMU). There are also a “Power Box” and data acquisition system (LabVIEW
CompactRIO, or cRIO), which are mounted to the cab table at the back seats. The electronics behind the
steering robot will be briefly covered as well.
The Power Box supplies power to all vehicle sensors in conjunction with the two junction boxes in the
trailers. The Power Box is made up of a breadboard circuited with 5V voltage regulators, and supplies a
constant 13V supply, a constant 5V supply, and a switched 13V supply. The three different circuits are
separated in an efficient manner via electric binding posts and ring terminals, as shown in Figure 4-18. A
breadboard is also used to change the original 13V circuit to 5V circuit. Figure 4-18 shows a picture of the
Power Box with binding posts and labels for the three different supply circuits. Several different appliances
are connected to the Power Box. Figure 4-18 also shows two bus bars – one for power and one for ground
– that help clean up the connections for the number of connected appliances. A power output port for a
“Power” cable made up of male-to-male BNC coaxial cable to transfer battery power from the Power box
to the junction box in Trailer A was created. A binding post adapter was used on both ends of the Power
cable as shown in Figure 4-18. The switch used to control the switched 13V power circuit is shown in
Figure 4-19; this circuit is primarily used for LEDs.
Figure 4-18. Power Box in tractor.

68
The data acquisition system, or the cRIO, is placed next to the Power Box. It is powered by the constant
13V circuit in the Power Box and is connected to the laptop with an Ethernet cord for data access. The
13V power source is supplied by four Lithium-Ion battery cells connected in series with a charging port
connector and a power output connector as well. The cables used to connect a battery to the respective
junction box have a fuse soldered for the safety of the data acquisition system. This is shown later in Figure
4-24. The layout for the Control Desk in the tractor is shown in Figure 4-19. More about the cRIO is
available in Appendix B.
Figure 4-19. Control Desk in tractor.
Among the several sensors and appliances installed in the cab or around the tractor, the GPS units, the
tractor accelerometer, the steering wheel angle sensor, and the cab LED are directly used for RSC
evaluation. The two GPS units and LED are routed under the passenger seat and up the passenger door
pillar, as the GPS units are actually mounted outside on the hood, and the LED is mounted under the sun
visor for easy camera vision. The GPS units are used to record the speed and tracking of the tractor during
operation, since the steering robot does not automate vehicle speed. The LEDs on the vehicle are all within
a camera’s view, and are used to synchronize the cameras and data together. More about LED and camera
usage is available in Section 4.2.5.
Cables to back
of tractor Power Box
Battery
cRIO
Laptop
IMU
LED Circuit
(Switched 13V)
Switch
69
It should be noted that the steering wheel angle sensor is not directly connected to the Power Box, but
will be covered in this section. The steering wheel angle sensor is actually a string potentiometer that is
wrapped around the steering column. As the steering column rotates, any retraction or extension of the
string potentiometer is used with the circumference of the 1.5 in diameter steering column and the
tractor’s steering ratio to determine the steering wheel angle. A steering wheel angle sensor is a clean
method of determining whether the steering robot had operated correctly for each test. The mounting of
the steering wheel string potentiometer is shown in Figure 4-20. The steering wheel string potentiometer
is mounted orthogonally to the steering column at the same height as the top of the column. The string
potentiometer wire was then wrapped around the steering column, wrapped in rubber and secured with
zipties, and then calibrated. The cabling for this sensor is routed under the tractor along the chassis and
into Trailer A’s junction box, JBA, through the bulkhead.
Figure 4-20. Steering wheel string potentiometer installation.
The cab frame accelerometer is connected to the junction box in Trailer A, and it is mounted using a
previous bolt hole on a convenient previously-existing yet unused bracket. Although more emphasis is
String
Pot.
Wire
Steering
Column
Orthogonal
Mount
Zipties &
Rubber

70
placed on the lateral accelerations at the trailers, a reference tractor lateral acceleration is needed for
comparison. These accelerometers must be placed near the cg of the vehicle unit on which they are
mounted, and this holds true for those on Trailer A and Trailer B, as will be discussed.
Lastly, the steering robot hardware covered in Section 4.1.5 is controlled by a laptop and electronics in a
suitcase kept in the cab. Again, this document does not provide information regarding the electronics
used in the control scheme, or the control scheme itself. General operation information, however, is
covered. The aforementioned Deadman’s switch was wired together with the LED circuit, or the switched
13V circuit from the Power Box. By doing so, the LEDs flag whenever the steering robot is on via the
Deadman’s switch, and thus whenever testing is underway.
4.2.2 Trailer Hardware This section will cover the installations for the pertinent sensors on both trailers, and will include the load
cells, the LEDS, and the accelerometers. A closer look at the load cells is provided first, because while a
model was shown in Section 4.1.1, no information regarding their installation was given. A picture of the
load cell within the outrigger assembly is shown in Figure 4-21. The figure shows the order of installation
for the parts within the outrigger assembly when observed from left to right: a height adjustment cube,
the Omega load cell, the threaded rod, a height adjustment nut, the second height adjustment cube, and
the second height adjustment nut to finish. It should be noted that installation of the load cell was not as
easy as described, as there was no indication or mechanical design to show at what position the load cell
should be placed in order to point its data cable port in a desirable position with enough ground clearance.
Figure 4-21 shows a configuration in which there is barely enough ground clearance, as the data cable
connector and cable need additional space to bend the cable back up towards the trailer. Small holes were
drilled into the center of both trailers near the outrigger locations where the load cell cables were routed
to their respective junction boxes. Ideally, the load cells would be installed before the outriggers, but due
to a lead time of up to two months, this option was unavailable for the team.

71
Figure 4-21. Load cell within outrigger.
One tri-axial accelerometer was placed on each vehicle unit, and one IMU unit was installed near those
on the trailers for additional lateral acceleration readings for high accuracy measurements. The resolution
of the tri-axial accelerometers is lower than that of the uni-axial accelerometers, so while the tri-axial
accelerometer was mounted in the correct vertical cg height at 1.25 ft from the trailer floor, the uni-axial
accelerometer was not. A mounting assembly made of three L-brackets and two pieces of 8020 structure
were used as a simple method of securing the tri-axial accelerometer. Bolt holes were drilled through the
bottom of the trailer to fix the 8020 structure. The same method of mounting accelerometers was used
at both trailers. A uni-axial accelerometer at Trailer A was installed due to the resolution of the 50g range
tri-axial accelerometer used there. It was simply duct-taped to the 8020 structure at the lateral cg location
as it was only installed as a backup measure on the fly. The IMUs were attached under the same
circumstance.
4.2.3 Junction Box A As mentioned previously, several of the tractor sensors are actually powered by the junction box in Trailer
A, JBA, due to the proximity of JBA to these sensors. A 3.5 in hole was drilled through the front wall in
order to route the cables and wires from the tractor sensors. Figure 4-22 shows the final design of the box
in its entirety, with labels for each part of the box. As seen in Figure 4-22, there are two bar buses that
Inboard Beam
Height Adjustment Cubes
Load Cell
Threaded Rod Height Adjustment Nuts
Data Cable (up to trailer)

72
supply 13V to anything connected to them when their circuit is switched on. The switched 13V supply
comes from the LED wire from the Power Box mentioned in the prior section. There is one power and one
ground bar bus, and these are generally used for the LEDs mounted on Trailer A due their switch-based
activation. A second, smaller breadboard is seen next to the green DB-37 breakout board. The Trailer A
Data Cable is connected to this breakout board and uses a DB-37 connector. This smaller breadboard is
used for two reasons: (1) to supply a constant 5V and (2) to feedback a 5V pulse synced with the LED 5V
switch circuit to the data acquisition system. The cRIO is only capable of reading channels of 0 – 10 volts,
so the 13V supply voltage from the batteries connected to the Power Box must be regulated down. Finally,
a third bus bar can be found above the breakout board in Figure 4.9. This bus bar was not used for general
data acquisition, but was instead added for a specific RSC system which required additional relays for each
trailer to determine activations. All components of the junction boxes are screwed down, with additional
double-sided tape under the Power Board to protect the solders at the underside.
Figure 4-22 shows the sensor ports, which safely and quickly connect or disconnect sensors to the data
acquisition system via a breakout board and breadboard supplying power, or Power Board. By using both
breakout boards and Power Boards, the data acquisition system is made modular, allowing quick
modifications to both the number of sensors and types of sensors. The Power Board voltage is supplied
by power and ground binding posts and the Power Cable, which extends from the Power Box circuit
supplied by the batteries, and provides the same circuit to all soldered sensor ports. The systematic
organization of the sensor ports and custom-made sensor cables allow sensors to use any port. This is
shown in Figure 4-23.
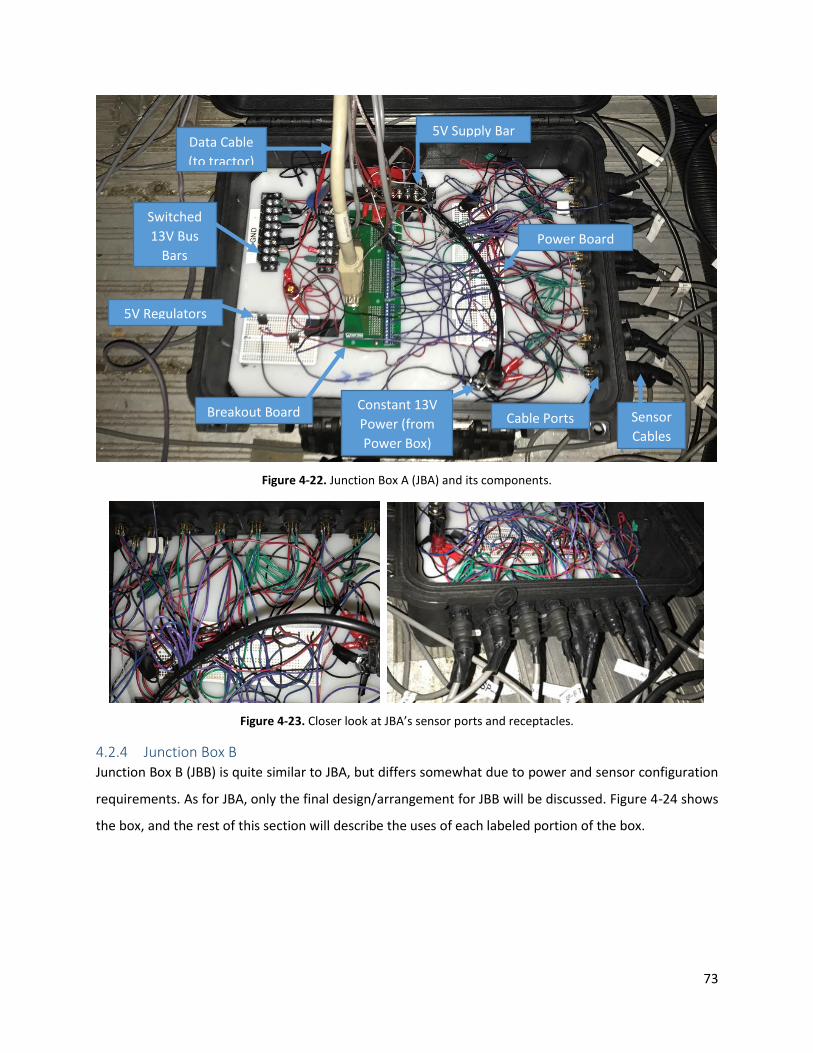
73
Figure 4-22. Junction Box A (JBA) and its components.
Figure 4-23. Closer look at JBA’s sensor ports and receptacles.
4.2.4 Junction Box B Junction Box B (JBB) is quite similar to JBA, but differs somewhat due to power and sensor configuration
requirements. As for JBA, only the final design/arrangement for JBB will be discussed. Figure 4-24 shows
the box, and the rest of this section will describe the uses of each labeled portion of the box.
Switched
13V Bus
Bars
5V Regulators
5V Supply Bar
Constant 13V
Power (from
Power Box)
Breakout Board Cable Ports Sensor
Cables
Power Board
Data Cable
(to tractor)

74
Figure 4-24. JBB and its components.
Another 13V 4-cell battery is used with and located in JBB. JBA’s location at the front of Trailer A was close
enough to use the Power Box’s power circuit, while JBB’s location made it necessary to supply it with its
own power supply. A common ground was run through both junction boxes, however, to counteract any
common ground issues between the two batteries. Several stoppers drilled into the plastic bottom were
used to secure the battery from interfering with any wiring and breadboards. Positive and ground
terminals suppling the battery’s power and ground were used to connect all the electrical utilities in the
box, which are discussed next. The cable used to connect the battery to the junction box again has a fuse
soldered in it.
Several different circuits were needed within JBB due to both different sensor power requirements, as
well as different types of electrical appliances. Multiple breadboards were used to supply these different
powers to numerous targets in a simplified manner. The first breadboard is the main sensor breadboard
located on the right in Figure 4-24. Similar to that in JBA, the main breadboard was connected by soldered
4-Cell Battery
(13V)
Fuse
+ -
Switched
13V Bus
Bars
5V Regulator
Breadboard
Constant 5V
Bus Bar
Breakout Board
Power Board
Binding Posts
Data Cable
(and other
sensor cables

75
wires and by spade connectors at the power and ground terminals. Solder bridges were fashioned
between the sets of five pins to connect the entire rows for power and ground rows. Receptacle port pins
were then connected at these power and ground rows by soldered wires at both ends. The outputs of
these receptacle port output pins were connected to the DB37 breakout board found in the middle of JBB.
The data from the Trailer B sensors are transmitted to the cRIO at the tractor via a 120-ft DB37 cable.
More information about the receptacle ports and breakout board pinout is available in later sections of
this chapter.
The remaining two smaller breadboards were both used to create and provide 5V circuits using 5V voltage
regulators. There were many additions made to JBB that required 5V circuits, so originally only the bottom
mini-breadboard was used to supply that power. As more needs for 5V power were implemented into the
DAQ system, the third bus bar was added to install more applications in a more secure and safer manner
than inserting wires into a breadboard.
The mini-breadboard at the top was used to supply the two Arduino systems with a 5V flag used to sync
up independently gathered data from several Arduino systems in post-processing. A 5V flag was
necessary, as the 13V switchable circuit that the LEDs used was too high for Arduinos to process. At the
end of the project, the time-of-flight sensors used with the Arduino systems were deemed not accurate
enough and were not used. The flag was supplied by the two LED bus bars that actually do not use JBB
battery, but the LED power circuit from the power box. This connection is made by a LED control cable
that connected the JBA bus bar set to the JBB bus bar set. Figure 4-19 serves as a diagram for the
connections of the data acquisition system.
4.2.5 Cameras Cameras were the final hardware used on the truck during testing. Video not only clarifies uncertainties
within data, but also allows easier understanding and analysis of test results. Seven cameras were used
to supplement the analog data acquisition system, six of which were mounted on the vehicle body, with
one camcorder set aside along the test track. These six cameras were placed near and captured views of
inside the cab, in between the two trailers, at Trailer A’s passenger side, at Trailer B’s driver and passenger
sides, and at the dolly’s driver side. LEDs are taped in view of the cameras, and activation timings are used
to synchronize the six cameras and their flags to the analog data using timing offsets. Figure 4-25 displays
the cameras locations and their points of views, and Figure 4-26 displays the synchronization process. A
drone was brought in to take aerial shots of the vehicle during each maneuver, with the sole purpose of
ease of understanding each maneuver.
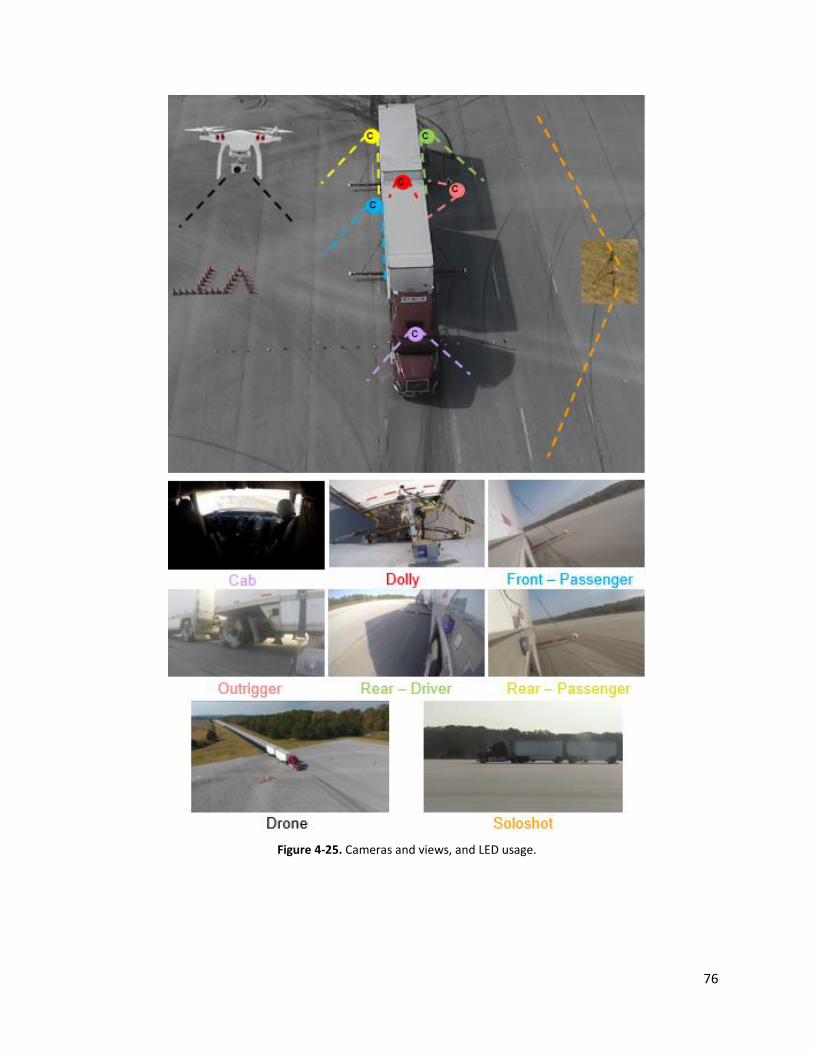
76
Figure 4-25. Cameras and views, and LED usage.

77
Figure 4-26. LED activation timing used for synchronize cameras with offsets.
A video of every test from each of the cameras is available for aid in data analysis. Each test’s starting time
was logged to Excel to bookkeep the massive number of tests. With these videos, uncertain results, such
as outrigger forces used to determine rollover, could be validated or disproved. Making video data clearer
was the reason behind painting the vehicle tires and taping the outrigger wheels.
4.3 Testing Overview A thorough test procedure for studying the stabilities of an articulated truck must involve different
maneuvers, as rearward amplification plays a pivotal role in the dynamics of the vehicle. The selection of
the correct maneuvers to test is of utmost importance. Comprehensive review of potential test
maneuvers to use during track testing of an LCV was completed first, as a combination of NHTSA and the
National Transportation Research Center (NTRC) standards were used. A set of maneuvers thought to
collectively exhibit the gamut of dynamics of LCVs was chosen. These maneuvers are summarized in Table
4-4 and discussed in detail in the remainder of Section 4.3.

78
Table 4-4. Summary of proposed test maneuvers.
Maneuver Replicated Scenario Description Visual
150 ft. J-turn Entry or exit ramp Straight entry with
dropped throttle around a 150 ft. radius 180o turn
Double lane change (DLC)
Lane change at high speeds/ Obstacle
avoidance on straight road
Straight entry with dropped throttle while move to left lane, then back again over 340 ft.
0.25 Hz Sine-with-Dwell
(SWD)
Obstacle avoidance onto curved road
Straight entry with dropped throttle with a sinusoidal steering input
interrupted by a dwell
4.3.1 Maneuver 1: J-Turn Directly taken from NHTSA’s tractor semi-trailer testing in 2011 [36] is the J-turn maneuver. This maneuver
calls for a constant radius turn of 150 ft. with a straight entry and dropped throttle once the turning has
begun. This maneuver replicates the curvature of a curved portion on a highway, which is what most
vehicles in the trucking industry use for travel. NHTSA used both a 150-ft. and 200-ft. radius J-turn, but
only the 150-ft. variation was used as it called for more steering wheel angle during the turn and therefore
more lateral accelerations. The inside and outside radii were marked by cones, and a lane width of 12 ft.
was set to match conventional highway lane width. Contrary to NHTSA’s methods, no test termination
conditions were placed, so rollovers denoted by outrigger contacts did not end the test run. However, any
off-tracking resulted in a bad run, as cones would be knocked over.
J-turns are driver-operated maneuvers that are largely static, as a theoretically constant steering wheel
input is used to rotate the vehicle leftward, and roll dynamics can be studied without yaw. Since there is
driver feedback, roll dynamics are not entirely detached.
4.3.2 Maneuver 2: RSM Both the driver and the steering robot were capable of completing J-turn tests, but the steering robot’s
path had a slight deviation from the J-turn described above, as driver feedback is absent. Instead of path-
following efforts, the steering robot completes J-turns by using a constant steering wheel input. This led
to a variation of the J-turn referred to as a ramp steering maneuver, or RSM. Figure 4-27 displays the
steering input for all speeds.

79
Figure 4-27. Steering input for the robot J-turn, or RSM.
Both driver- and robot-conducted J-turn test sets started at a speed of around 30 mph and increased by
one-mph increments until failure of the evaluated RSC system occurred, marked by severe roll. This
method was repeated for each of the RSC systems under evaluation. Any errors in path-following during
the cornering called for a rerun for that particular speed. The robot J-turns, or the RSMs, obviously failed
to follow the laid path, but as long as the robot was started at the beginning of the J-turn path, no reruns
were called for. Timing references were created for each test maneuver to ensure similar activation
locations.
4.3.3 Maneuver 3: DLC The proposed double lane change maneuver is also taken directly from NHTSA’s testing of a tractor semi-
trailer; it simulates an evasive maneuver into the adjacent lane and back, and was to be completed by a
human driver only. The maneuver specifics are shown in Figure 4-28. Cones are denoted by black squares,
and the dimensions shown have been adapted for LCVs. Again, this maneuver called for a straight vehicle
entry followed by a throttle drop. The dotted line in Figure 4-28 demonstrates the vehicle path. Test runs
were considered successful if the vehicle had followed this path and cleared all cones. Any failures resulted
in a rerun. Again, no terminating conditions were set for this test. The DLC maneuver was chosen, as it is
the clearest presentation and exhibition of rearward amplification, and is a standard performance
maneuver for evaluating RA in combination vehicles due to a sufficient vehicle excitation.

80
Figure 4-28. Diagram of DLC adapted for long combination vehicles [36].
DLC tests were another set of maneuvers that steadily increased the speed in which the vehicle was run
after every successful test. The entering speed generally started at 48 mph and increased in one- or two-
mph increments until severe rollover occurred based on the judgement of the test team. This method was
repeated for each of the RSC systems under evaluation.
4.3.4 Maneuver 4: SWD The sine-with-dwell maneuver was actually designed by NHTSA as a maneuver for studying the yaw
stability of Class 8 trucks. Although it is still a highly dynamic and roll-inducing maneuver, SWD maneuvers
were still included in this study as yaw instability indirectly affects roll instability. A sine-with-dwell, or
SWD, maneuver consists of a sinusoidal steering input with a pause, or dwell, of 1 second after the third
quarter-cycle of the sinusoid is completed. A visual representation is available in Figure 4-29, which shows
the steering input over the full duration of the maneuver. It is important to note that this figure is not a
plot of the vehicle path. This steering maneuver is only completed by the steering robot, as a SWD
maneuver is a prime example of the repeatability and reproducibility found in using a steering robot over
a human driver, no matter the training, due to its complicated design.
NHTSA’s design of the SWD test originated from the results of a slowly increasing steer, or SIS, maneuver
in their tractor semi-trailer testing. The amplitude of the steering input of the SWD is based on the result
of SIS tests when a 0.5 g lateral acceleration was experienced at the tractor. NHTSA’s SWD calls for a 0.5
Hz sinusoidal steering input. The SWD used in this study has been modified to one that uses a 0.25 Hz
sinusoidal steering input instead, with a pause of two seconds instead of one. This change was made in
efforts to adapt NHTSA’s test maneuver for one more suitable for LCVs, as a lower frequency steering
input can sufficiently excite the rear trailer in an A-Double configuration. Unlike other maneuvers, the
0.25 Hz SWD uses an entry speed of 45 mph for all tests. The independent variable for this maneuver is
the ratio of the maximum steering input that is used. The first tests are generally run with increments of
10% until 100% is reached. This 100% refers to the steering input amplitude of ± 250° from the SIS results
aforementioned. Figure 4-29 shows the steering wheel angle inputs for 50%-100%.
Path of Vehicle

81
Figure 4-29. 0.25 Hz SWD steering inputs for 50-100%.
4.3.5 Maneuver Summary Table 4-5 summarizes the four maneuvers and provides ratings for characteristics such as trailer loading,
steering frequency, and repeatability. The stars indicate the maneuvers’ ratings for each characteristic, as
one star means low and five stars mean high. The maneuver’s situational equivalent, steering operation,
effects on both front and rear trailers, steering input rate, repeatability, and overall severity can be found,
and each of the characteristics is explained below.
A maneuver’s situational equivalent indicates which real-world situation best relates to the tested
maneuver, and is usually the reason why the maneuver was chosen for the study. As discussed in each
individual maneuver subsection above, the four maneuvers are either operated by a subjective
professional driver or by a steering robot (in which the speed of the vehicle is still controlled by a human
driver). Rearward amplification plays different roles for different steering actions, and its effects can be
noted by the rear trailer’s excitation for each maneuver (Table 4-5). There are maneuvers in which the
front trailer is more prone to rollover as well, as shown by the front trailer excitation marks in the table.
The steering input rate shows how quickly a steering input changes throughout the test. For example, the
RSM maneuvers hold a steady steering input, while the DLC maneuver incorporates three quick and
consecutive steering actions to direct the vehicle through the cones, as shown in Figure 4-28. The
repeatability found in conducting the tests is also shown in Table 4-5 and shows driver operated pathing
was difficult to keep constant for the J-turn and DLC due to human error and degree of steering difficulty.
The SWD and RSM tests are considered to be the more reliable tests and test results shown in Chapter 5
can be seen as more conclusive. Finally, the overall severity in terms of rollover propensity for each
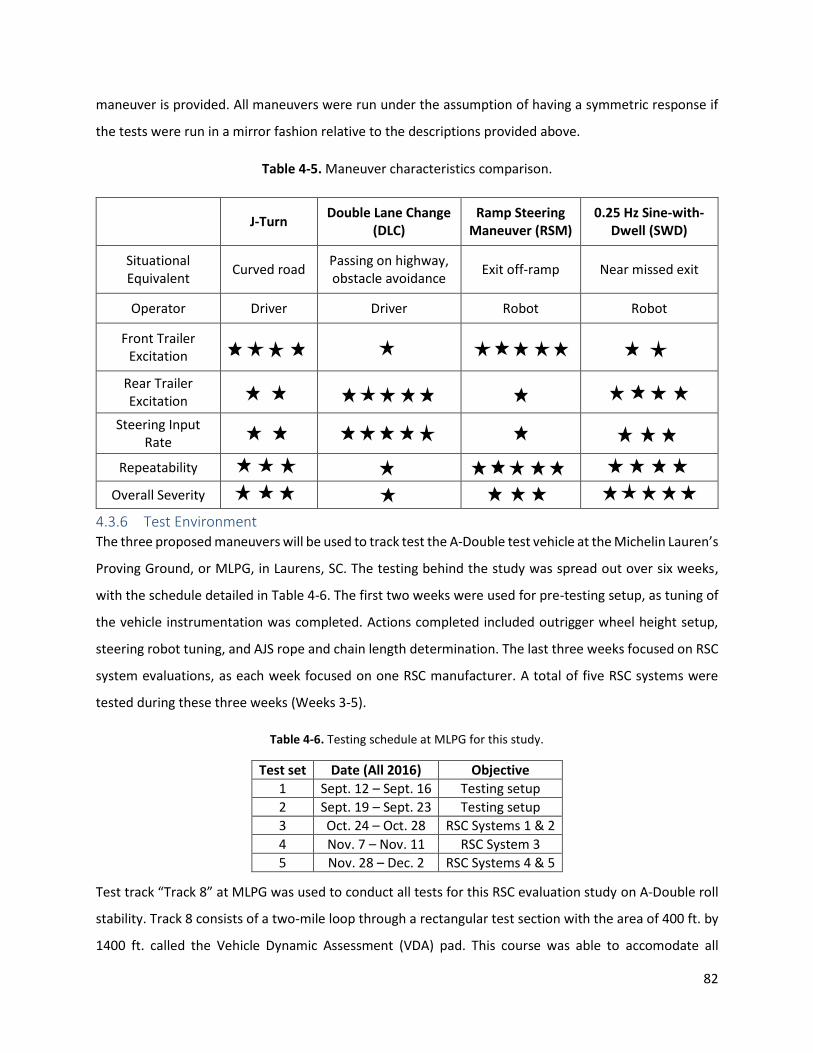
82
maneuver is provided. All maneuvers were run under the assumption of having a symmetric response if
the tests were run in a mirror fashion relative to the descriptions provided above.
Table 4-5. Maneuver characteristics comparison.
J-Turn Double Lane Change
(DLC) Ramp Steering
Maneuver (RSM) 0.25 Hz Sine-with-
Dwell (SWD)
Situational Equivalent
Curved road Passing on highway, obstacle avoidance
Exit off-ramp Near missed exit
Operator Driver Driver Robot Robot
Front Trailer Excitation
Rear Trailer Excitation
Steering Input Rate
Repeatability
Overall Severity
4.3.6 Test Environment The three proposed maneuvers will be used to track test the A-Double test vehicle at the Michelin Lauren’s
Proving Ground, or MLPG, in Laurens, SC. The testing behind the study was spread out over six weeks,
with the schedule detailed in Table 4-6. The first two weeks were used for pre-testing setup, as tuning of
the vehicle instrumentation was completed. Actions completed included outrigger wheel height setup,
steering robot tuning, and AJS rope and chain length determination. The last three weeks focused on RSC
system evaluations, as each week focused on one RSC manufacturer. A total of five RSC systems were
tested during these three weeks (Weeks 3-5).
Table 4-6. Testing schedule at MLPG for this study.
Test set Date (All 2016) Objective
1 Sept. 12 – Sept. 16 Testing setup
2 Sept. 19 – Sept. 23 Testing setup
3 Oct. 24 – Oct. 28 RSC Systems 1 & 2
4 Nov. 7 – Nov. 11 RSC System 3
5 Nov. 28 – Dec. 2 RSC Systems 4 & 5
Test track “Track 8” at MLPG was used to conduct all tests for this RSC evaluation study on A-Double roll
stability. Track 8 consists of a two-mile loop through a rectangular test section with the area of 400 ft. by
1400 ft. called the Vehicle Dynamic Assessment (VDA) pad. This course was able to accomodate all

83
proposed maneuvers and was a perfect test environment. Fortunately, the testing days throughout the
three RSC weeks (3, 4, and 5) had consistently sunny weather of nearly the same temperature. This is
important to rule out possible different tire/ground dynamics every week in combination with new sets
of tires every week. A photo from Google Earth of the track is shown in Figure 4-30. Table 4-7 shows the
forecast for the testing days from the RSC weeks. The test procedure for each of the days generally
focused on one or two maneuvers, and followed the general maneuver procedures detailed in Sections
4.3.1, 4.3.2, and 4.3.3.
Figure 4-30. Track 8 at Michelin Laurens Proving Ground via Google Earth.
Table 4-7. Forecast of testing days from RSC weeks.
Week Date (All 2016) Weather Temperature Precipitation Wind Speed
Week 3 Oct. 26 Sunny 71o/37o 0.00 in. 3 mph
Week 3 Oct. 27 Sunny 77o/46o 0.00 in. 4 mph
Week 3 Oct. 28 Sunny 82o/55o 0.00 in. 4 mph
Week 4 Nov. 9 Sunny 69o/44o 0.00 in. 4 mph
Week 4 Nov. 10 Sunny 68o/33o 0.00 in. 2 mph
Week 4 Nov. 11 Sunny 69o/35o 0.00 in. 4 mph
Week 5 Nov. 30 Sunny 69o/59o 0.51 in. 10 mph
Week 5 Dec. 1 Sunny 60o/41o 0.00 in. 7 mph
Week 5 Dec. 2 Sunny 59o/32o 0.00 in. 2 mph
Access Loop
VDA Pad (400’ x 1400’)

84
4.4 Summary This chapter provided a general description of the instrumentation done on the test vehicle prior to track
testing. The key preparations included:
Safety outriggers: instrumented with load cells and used to quantify rollover occurrence and
severance and keep the vehicle upright
Anti-Jackknifing Systems (AJSs): a series of ropes and chains to dissipate yaw inertia and prohibit
potential jackknifing when needed
Trailer reinforcement beam structures: installed to increase trailer structure strength and ability
to withstand outrigger contact and AJS forces
Trailer load frames: used to replicate a typical 28 ft. trailer loading configuration (total weight, cg
location, and rotational inertias)
CVeSS steering robot: provided repeatability in steering inputs during testing not found with
human drivers
Data acquisition system and sensor instrumentation: gathered and logged data for analysis
This was followed by a description of the maneuvers chosen for RSC evaluation, and of the environment
during the test days at MLPG. Some perceptive over why the proposed maneuvers were selected was also
provided. The four used maneuvers are summarized in Table 4-4 and are as follows: (1) J-turn, (2) RSM,
or robot-operated J-turn, (3) DLC, and (4) 0.25 Hz SWD.

85
Chapter 5 Roll Stability System Evaluation
This chapter provides analysis of the gathered data from track testing as a means of evaluating the
performance of the RSC systems on roll stability of an A-Double. Both images from the cameras and analog
data from the data acquisition system were used in describing the efficacy of a total of five systems
compared to a baseline A-Double vehicle. The chapter starts with a description of the selection process
of data from properly run tests as the first stage of data analysis. The rest of the chapter is split into
separate sections, as results for each of the three conducted studies are discussed by maneuver in detail.
The chapter ends with a summary of the findings.
Three separate studies were conducted in an effort to evaluate RSC systems: a single channel (2S1M) RSC
systems evaluation, an assessment of the significance of dolly brake usage in RSC systems, and a single
channel and dual channel (2S2M) RSC system comparison. As mentioned in Chapter 2, trailer-based RSC
systems can incorporate different hardware, and an example of that was the number of brake modulators
involved at each axle. Two-modulator systems (2S2M) are capable of splitting brake responsibilities at
each axle to individual tires, and an evaluation of the benefits (if any) of 2S2M systems over 2S1M systems
will be completed. Chapter 3 introduced brake contributions for each axle, and it was found that the
converter dolly axle had increasing contributions with deceleration rate. The third study regarding the
benefits (if any) of including dolly brakes in RSC systems will also be conducted.
Three systems will be analyzed during the first study, as similar 2S1M RSC systems from three different
manufacturers will be tested individually, with their individual results compared to the results from the
baseline vehicle’s tests. These systems are System A, B, and C. Two systems will be analyzed in the second
study of dolly significance, as System A will be compared to another of Manufacturer A’s products: System
A-D. System A-D is essentially System A, but with the dolly axle included in the controlled brake
applications by the RSC system. Finally, in the third study of modulator significance, System C will be
compared to System C-2, which is also another product made by Manufacturer C. System C-2 is a 2S2M
version counterpart of System C.
5.1 Bases of Evaluation
The objective of the testing completed was to evaluate the performance of five different RSC systems. All
systems used trailer-based RSC systems at both trailers, and the same ABS system. The test week
consisted of two preparation days and three testing days. No major issues occurred during testing.

86
A total of 136 tests were conducted at Track 8. Additional testing was conducted for most of the
maneuvers, as both robot- and driver-operated steering held inconsistencies. The J-turn and DLC tests
needed constant retesting, due to the difficulty of the maneuver even with a professional test driver, as
maneuver entry speed, path following, and driver feedback proved to be the three largest sources of
discrepancy between tests and weeks. The RSM and SWD tests also needed retesting as robot activation
times and maneuver entry speed needed to be as constant as possible. The availability of Track 8 and the
same professional driver each test week demanded a flexible schedule, so the amount of testing and
retesting was quite limited. The best performed tests were selected for evaluation with the help of GPS
speed, GPS path, cameras, and steering wheel angle data.
There are proprietary and disclosure considerations seen in the data revealed in this chapter and
document, so not all numbers are revealed. This is also the reason why a deeper look at RSC operation
such as braking operation and efficiencies and lateral accelerations throughout tests, are not covered in
this document. The sponsor for this project is to remain unacknowledged.
The following variables were selected for data analysis to display the efficiency of each RSC system:
outrigger contact forces, RSC activation times, and RSC warning times. The outrigger contact forces were
used to qualify rollover and quantify the severity of it, and the RSC activation and warning times were
used to describe how reactive each system was. Activation time refers to the time between maneuver
start to the activation of the RSC system, and warning time refers to the time between the RSC activation
to the time of outrigger (OR) contact. Figure 5-1 displays a timeline that shows the definition of activation
and warning time.
Figure 5-1. Activation time and warning time definitions.
5.1.1 Example Evaluation This section will cover an example evaluation of the variables listed above: outrigger contact, activation
time, and warning time. This process was repeated for each RSC system, for the selected tests in all four
maneuvers. Figure 5-2 displays the three variables in a single plot. The blue event flag line denotes the
start of the test whether it was driver or robot operated. The green event flag line indicates RSC activation
through relay activation. The black plot line represents the outrigger contact force read by the load cell at
a particular outrigger. The maximum outrigger contact force reading was taken at each of the four load

87
cells to measure the severity of the experienced rollover during the specific test. The presented outrigger
forces are the equivalent force exhibited on the edge of the trailers instead of at the outrigger itself. The
activation time and warning time of a particular test use the first outrigger contact rather than the highest.
Figure 5-2. Plot of example data for RSC evaluation.
The data collected are analyzed in this manner, and presented in this document with multiple datasets
starting from the baseline vehicle’s rollover speed (J-turn, RSM, and DLC) or rollover steering (SWD), both
of which will be hereafter referred to as the OERS. In efforts to mask the numbers, figures in this chapter
will use x-axis labeling relative to the OERS, such as in the example outrigger contact force during J-turns
shown in Figure 5-3. No result tables will be included in this thesis, neither in the documentation nor in
the appendix. This chapter will continue to use the color scheme for the different RSC systems seen in
Figure 5-3, as well as a light orange for RSC System A-D, and a purple for RSC System C-2. Both will be
introduced in later sections of this chapter. Also included in Figure 5-3 is the pattern scheme shown in the
legend framed in red, which is also continued throughout this chapter. Graphs such as that shown in Figure
5-3 show four datasets, and will show two sets of overlapped bars. The left side of a vehicle configuration
section is for the front trailer, and the right side is for the rear trailer. Often, these graphs are followed by
graphs that split up the front and rear trailer data. In figures showing specific trailer data, a solid bar
denotes the driver side, and the diagonal striped bar denotes the passenger side. This is apparent in Figure
5-3 as well. Notes regarding the absence of data are present too, as some tests were not conducted for a
specific configuration as seen below.
Activation
Time Warning Time

88
Figure 5-3. Example multiple dataset figure.
5.2 Single Channel RSC System Performance Study (A vs. B vs. C Study)
There were four total maneuvers at MLPG, two of which were conducted with a professional driver and
two that are conducted with the steering robot. The two driver-operated maneuvers were the J-turn and
the DLC, and the results of both are covered in this section.
An evaluation of the performances of the single channel, or 2S1M, RSC systems across multiple maneuvers
is the primary objective of this document. It should be noted that the results of the multiple RSC systems
are held relative to those of the baseline A-Double configuration, and a side-by-side comparison of the
RSC systems is provided to demonstrate that RSC performance can largely differ among commercially
available RSC systems, as well as from maneuver to maneuver for an individual system. Each maneuver
subsection provides an outrigger contacts discussion first, followed by activation time and warning time.
A conclusive performance increase or decrease for each of the RSC systems is provided for each maneuver.
5.2.1 J-turn Results
The first maneuver discussed is the J-turn. The results focus on the front trailer, as it experiences earlier
and more severe roll than does the rear trailer. This occurs most likely due to the design of the test itself,
as both trailers would theoretically roll one after another. However, the speed drop caused by the brakes
stops the rear trailer from following the first trailer’s roll. Since the steering is completely directed to the

89
driver side of the vehicle, analysis efforts focus on the passenger side of the vehicle. Although the rear
trailer exhibited a much lower number of rollovers, it cannot be concluded with certainty that the rear
trailer would not have rolled as often as the front trailer. The lateral momentum of the vehicle could have
largely been dissipated through outrigger contacts.
Figure 5-4 shows that System B experienced the lowest outrigger contact forces, while System C
demonstrated the single highest outrigger force during all J-turn tests. All systems demonstrated rollover
at a speed 2.6% faster than the baseline rollover speed, or OERS. No J-turns with the baseline vehicle were
conducted at a speed 10.5% faster than the OERS, as the vehicle underwent severe roll and yaw dynamics
at OERS+5.3%. It should be noted that usage of all RSC systems led to an improvement in roll severity. It
should be noted that an outrigger contact force threshold of 300 lbf qualified vehicle rollover, and forces
under the rollover contact force threshold did not qualify imminent rollover, but still indicated a high
likelihood for it. This threshold is hereafter shown on all outrigger plots. Tests conducted at OERS+2.6%
were not completed for baseline, System A, or System B, and were consequently left out. Unfortunately,
System A was not tested with J-turns at all and is therefore disregarded in this maneuver study. Figures 5-
5 and 5-6 split the outrigger contact data into a graph of the front trailer and rear trailer, respectively.
Figure 5-6 shows that RSC systems heavily mitigated rollover at the rear trailer.
Figure 5-4. Passenger side outrigger contacts at both trailers during J-turns in 2S1M study, from OERS to +10.5% mph.
562
0 0
1184
612684
1489
933 978
1433
1696
0 0 0
607
0 0
1428
508
0
1002
711
OE B C OE B C OE B C OE B C
OE Rollover Speed +2.6% +5.3% +10.5%
0
200
400
600
800
1000
1200
1400
1600
1800
2000
Maneuver Entry Speed
Forc
e (l
bf)
Front Rear
Passenger Outrigger Contacts at Both Trailers for J-Turns
Estimated rollover contact
threshold
No test

90
Figure 5-5. Front trailer passenger outrigger contacts during J-turns in 2S1M study, from OERS to +10.5% mph.
Figure 5-6. Rear trailer passenger outrigger contacts during J-turns in 2S1M study, from OERS to +10.5% mph.
562
1184
1489
0
612
933
1433
0
684
978
1696
OE Rollover Speed +2.6% +5.3% +10.5%
0
200
400
600
800
1000
1200
1400
1600
1800
2000
Maneuver Entry Speed
Forc
e (l
bf)
OE System B System C
Front Trailer Passenger Outrigger Contacts for J-Turns
No test
0
607
1428
0 0
508
1002
0 0 0
712
OE Rollover Speed +2.6% +5.3% +10.5%
0
200
400
600
800
1000
1200
1400
1600
1800
Maneuver Entry Speed
Forc
e (l
bf)
OE System B System C
Rear Trailer Passenger Outrigger Contacts for J-Turns
No test

91
Activation time and warning time results for the front trailer are shown below for multiple maneuver
entry speeds in Figure 5-7 and 5-8, respectively. These variables only apply to RSC systems, so no baseline
vehicle data is included in graphs that covered them. System B had the lowest outrigger forces, but rather
high activation times. Higher activation times imply longer rollover recognition times, but do not
necessarily relate to rollover performance, as System B had the least severe rollovers. Rollover
recognitions highly depend on the sensor system and algorithm used at the black box, but again due to
proprietary reasons, no details regarding these system modules will be discussed. It is therefore difficult,
if not impossible, to explain the trends in both activation time and warning time. Nevertheless, it is clear
that System C has the smallest activation time standard deviation through the test speed range at only
33.3 ms, and reacted an average 9.87% quicker than System B.
Figure 5-8 shows the warning times for the same entry speeds. Warning time indicates the time between
RSC activation and inevitable rollover in which the driver can prevent roll via correct braking and steering
measures. Standard human reaction is around 0.3 seconds, and applying the brakes takes about another
0.1 seconds. Therefore, a brake activation time of 0.4 seconds is included in all warning plots. System C
demonstrated the highest warning times throughout the majority of the testing, as shown in Figure 5-8.
The largest difference between the warning times of the two systems was 29.46% at OERS+5.3%.
Figure 5-7. RSC activation times at the front trailer for J-turns in 2S1M study, from OERS + 2.6% to +10.5% mph.
2.0562.08
1.976
1.824 1.808
1.872
1.65
1.7
1.75
1.8
1.85
1.9
1.95
2
2.05
2.1
2.15
+2.6% +5.3% +10.5%
Act
ivat
ion
Tim
e (s
)
Maneuver Entry Speed
Front Trailer RSC Activation Timing for J-TurnsSystem B System C
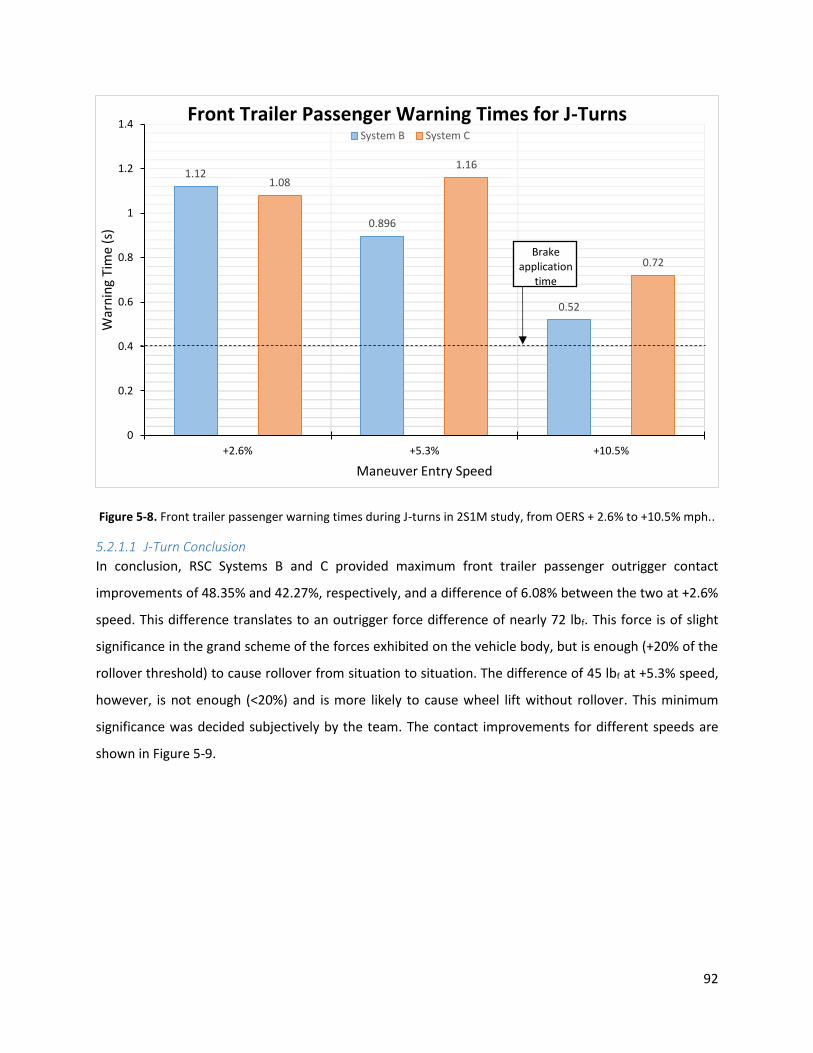
92
Figure 5-8. Front trailer passenger warning times during J-turns in 2S1M study, from OERS + 2.6% to +10.5% mph..
5.2.1.1 J-Turn Conclusion
In conclusion, RSC Systems B and C provided maximum front trailer passenger outrigger contact
improvements of 48.35% and 42.27%, respectively, and a difference of 6.08% between the two at +2.6%
speed. This difference translates to an outrigger force difference of nearly 72 lbf. This force is of slight
significance in the grand scheme of the forces exhibited on the vehicle body, but is enough (+20% of the
rollover threshold) to cause rollover from situation to situation. The difference of 45 lbf at +5.3% speed,
however, is not enough (<20%) and is more likely to cause wheel lift without rollover. This minimum
significance was decided subjectively by the team. The contact improvements for different speeds are
shown in Figure 5-9.
1.12
0.896
0.52
1.08
1.16
0.72
+2.6% +5.3% +10.5%
0
0.2
0.4
0.6
0.8
1
1.2
1.4
Maneuver Entry Speed
War
nin
g Ti
me
(s)
System B System C
Front Trailer Passenger Warning Times for J-Turns
Brakeapplication
time

93
Figure 5-9. Front trailer passenger outrigger contact improvement during J-turns in 2S1M study, from OERS + 2.6% to +10.5% mph.
The rollover speed improvements over baseline for both the front and rear trailers found in using the two
RSC systems are shown in Figure 5-10. Since a rollover at either trailer qualified vehicle rollover, there was
no difference in rollover speed improvement between the two, and the improvment over the baseline
configuration was miniscule.
48.35
37.29
42.27
34.33
+2.6% +5.3%
0
10
20
30
40
50
60
Maneuver Entry Speed
Forc
e Im
pro
vem
ent
(%)
System B System C
Front Trailer Passenger Outrigger Contact Improvement for J-Turns

94
Figure 5-10. Rollover speed threshold improvement over baseline for both trailers during J-turns in 2S1M study.
5.2.2 RSM Results
The RSM maneuver provides an even more gradual approach to trailer rollover than do J-turns, as it
eliminates any driver feedback and uses a constant steering wheel angle input with no dedication to path
following. This maneuver therefore requires its own section, as results differ from those of the closed-
loop J-turn maneuvers. As shown in Figure 5-11, System C was the only system tested at OERS+15% after
not exhibiting any rollover to lower speeds, while the rollover speeds for baseline, System A, and System
B were OERS, OERS+2.5%, and OERS+5%, respectively. System A had the lowest rollover speed, as well as
the highest contact forces recorded among the RSC systems. There were no recorded outrigger contacts
at the rear trailers for the speeds run for any of the systems, so there will be no rear trailer discussion in
this section.
2.6 2.62.6
5.3
Front Trailer Rear Trailer
0
1
2
3
4
5
6
RSC System
Spee
d Im
pro
vem
ent
(%)
System B System C
Rollover Speed Improvement through RSC Usage for J-Turns

95
Figure 5-11. Front trailer passenger outrigger contacts during ramp steer maneuvers in 2S1M study, from OERS to +15% mph.
The three systems had more consistent activation times through OERS and OERS+5% in the RSM
compared to the J-turn, demonstrating the significance that driver feedback has on rollover detection by
the systems. This maneuver has more useful activation and warning time comparisons than that of the J-
turn. The pattern remains the same, however, as System C has the lowest activation times and reacts
more quickly and more proactively. The largest difference in activation times among the three systems
was 0.818 s between System A and System C, as seen in Figure 5-12, and the two also had the largest
outrigger contact force difference as well. At the speed of OERS+7.5%, a difference of 0.448 s was enough
for System B to experience a large contact, and for System C to not rollover at all.
Again, due to a lack of information regarding the specific operation of the systems included in this study,
only a correlation can be made from the activation and warning time results. This means that lower
activation times can either indicate the system has a lower lateral acceleration threshold or reacts quicker
to calculations. An analysis of the brake pressures used by each system is not provided due to a potential
proprietary information leak regarding brake operation and braking efficiency of each system. System C
529
869
980
1065
0
10481097
0 0
944
1037
0 0 0 0
504
OE Rollover Speed +2.5% +5% +7.5% +15%
0
200
400
600
800
1000
1200
Maneuver Entry Speed
Forc
e (l
bf)
OE System A System B System C
Front Trailer Passenger Outrigger Contacts for RSMs
No test
No test
No test
No test

96
also exhibited the longest warning time among the activations that occurred from OERS to OERS+15,
shown in Figure 5-13, even when System C only activated at a higher speed than that of the other systems.
Figure 5-12. RSC activation times at the front trailer during ramp steer maneuvers in 2S1M study, from OERS to +15% mph.
Figure 5-13. Front trailer passenger warning times during ramp steer maneuvers in 2S1M study, from OERS to +15% mph.
2.874 2.8242.618
2.312 2.3842.52 2.448
2.056 2.12 2.064 2 1.92
0
0.5
1
1.5
2
2.5
3
3.5
OE Rollover Speed +2.5% +5% +7.5% +15%
Act
ivat
ion
Tim
e (s
)
Maneuver Entry Speed
Front Trailer RSC Activation Timing for RSMsSystem A System B System C
No test
No test
No test
0.936
0.60.69
0 0
0.856 0.904
0 0 0 0
1.92
OE Rollover Speed +2.5% +5% +7.5% +15%
0
0.5
1
1.5
2
2.5
Maneuver Entry Speed
War
nin
g Ti
me
(s)
System A System B System CFront Trailer Passenger Warning Times for RSMs
No test
No test
No test

97
5.2.2.1 RSM Conclusion
In conclusion, RSC Systems B and C provided a maximum front trailer passenger outrigger contact
improvement of 100%, meaning the vehicle did not roll at a speed at which did baseline. A maximum
difference of 120.64% (seen in Figure 5-14) between systems at OERS+2.5% represents the massive
performance difference that two RSC systems can have. This performance difference caused nearly a 5
mph improvement in rollover speed threshold, as seen in Figure 5-15. The lowest performing system only
provided 1 mph improvement, showing diminutive stability gains. Using the rollover speed of System A
rather than the rollover speed of System C can easily destroy any case advocating RSC usage when, in fact,
the benefits of RSC can be quite helpful.
Figure 5-14. Front trailer passenger outrigger contact improvement during ramp steer maneuvers in 2S1M study, from OERS + 2.5% to +7.5% mph.
-20.64-12.01
100.00
3.65 2.69
100 100 100
+2.5% +5% +7.5%
-40
-20
0
20
40
60
80
100
120
Maneuver Entry Speed
Forc
e Im
pro
vem
ent
(%)
System A System B System C
Front Trailer Passenger Outrigger Contact Improvement for RSMs
Notest

98
Figure 5-15. RSC system rollover speed threshold improvement over baseline during ramp steer maneuvers in 2S1M study.
5.2.3 SWD Results
SWD maneuvers involve leftward and rightward-directed paths as indicated in Figure 5-16, which shows
the GPS results of a 90% SWD test. There are both driver- and passenger-side outrigger hits at both trailers
because of this, as this was the most dynamic maneuver used in this study. The driver-side outrigger
contacts occur during the first steering to the right, and the passenger-side contacts during the second.
Outrigger contact data indicates that System C is the most reactive to the sudden change of direction
during the second steering, and this is later supported by the activation time plots. The tests were run at
the same speed while incrementing the maximum steering amplitude as the dependent variable.
Therefore, SWD results are summarized by improvements in maneuverability rather than in speed.
Figure 5-16. GPS results of a 90% sine-with-dwell test via Google Earth. There are two steering actions in a SWD.
2.5
5
12.5
System A System B System C
0
2
4
6
8
10
12
14
RSC System
Spee
d Im
pro
vem
ent
(%)
Rollover Speed Improvement through RSC Usage for RSMs
1st steering 2nd steering
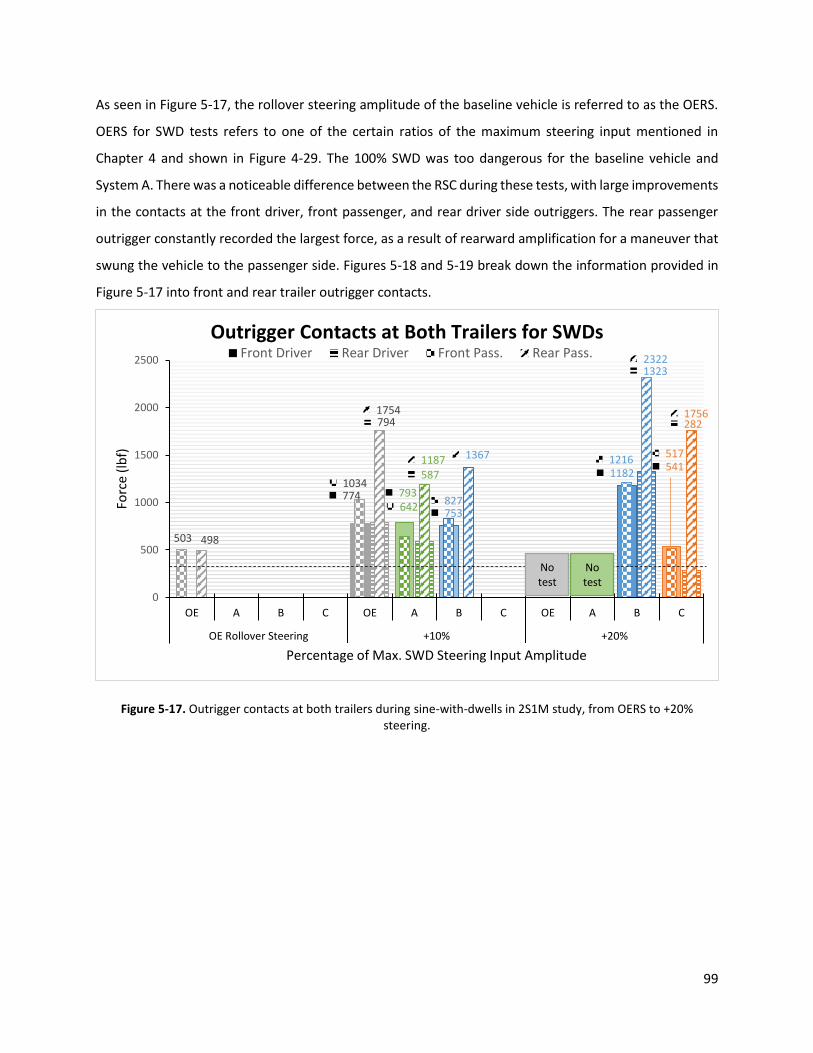
99
As seen in Figure 5-17, the rollover steering amplitude of the baseline vehicle is referred to as the OERS.
OERS for SWD tests refers to one of the certain ratios of the maximum steering input mentioned in
Chapter 4 and shown in Figure 4-29. The 100% SWD was too dangerous for the baseline vehicle and
System A. There was a noticeable difference between the RSC during these tests, with large improvements
in the contacts at the front driver, front passenger, and rear driver side outriggers. The rear passenger
outrigger constantly recorded the largest force, as a result of rearward amplification for a maneuver that
swung the vehicle to the passenger side. Figures 5-18 and 5-19 break down the information provided in
Figure 5-17 into front and rear trailer outrigger contacts.
Figure 5-17. Outrigger contacts at both trailers during sine-with-dwells in 2S1M study, from OERS to +20% steering.
774 793
753
1182541
794
587
1323
282
503
1034
642827
1216517
498
1754
1187 1367
2322
1756
0
500
1000
1500
2000
2500
OE A B C OE A B C OE A B C
OE Rollover Steering +10% +20%
Forc
e (l
bf)
Percentage of Max. SWD Steering Input Amplitude
Front Driver Rear Driver Front Pass. Rear Pass.
Outrigger Contacts at Both Trailers for SWDs
No test
No test

100
Figure 5-18. Front trailer outrigger contacts during sine-with-dwells in 2S1M study, from OERS to +20% steering.
Figure 5-19. Rear trailer outrigger contacts during sine-with-dwells in 2S1M study, from OERS to +20% steering.
0 0 0 0
774 793753
0
1182
541503
0 0 0
1034
642
827
0
1216
517
OE A B C OE A B C OE A B C
OE Rollover Steering +10% +20%
0
200
400
600
800
1000
1200
1400
Percentage of Max. SWD Steering Input Amplitude
Forc
e (l
bf)
Driver Passenger
Front Trailer Outrigger Contacts for SWDs
No test
No test
0 0 0 0
794
587
0 0
1323
282
498
0 0 0
1754
1187
1367
0
2322
1756
OE A B C OE A B C OE A B C
OE Rollover Steering +10% +20%
0
500
1000
1500
2000
2500
Percentage of Max. SWD Steering Input Amplitude
Forc
e (
lbf)
Driver Passenger
Rear Trailer Outrigger Contacts for SWDs
No test
No test

101
The activation times for this maneuver were partitioned to a first, or rightward-directed, steering, and a
second, or leftward-directed, steering, as shown in Figures 5-20 and 5-21. Both driver- and passenger-side
warning times were therefore considered using these results. Figures 5-20 and 5-21 show six datasets for
the three SWD maneuvers discussed: System A’s front and rear trailers, System B’s front and rear trailers,
and System C’s front and rear trailers. The first steering is heavily inclined to rear trailer activations, while
the second steering brought all four outriggers to contact regularly. System B stood out, as it held high
activation times in the OERS+10% and OERS+20% tests, only activating after the entire maneuver was
finished. In fact, Figure 5-22 presents negative warning times for System B, as the system would activate
after the outrigger had contacted and roll had initiated. System B, and any other system that fails to detect
roll when needed, was nothing but a baseline vehicle in those tests. System C, meanwhile, produced a
positive warning time for a maneuver considered to be the most dynamic and strenuous on the vehicle.
Figure 5-20. RSC activations at both trailers during first steering of sine-with-dwells in 2S1M study, from OERS to +20% steering.
0 00 0 0
1.7761.568 1.552
2.6 2.62.5682.68
2.8
2.2962.128 2.128
0
0.5
1
1.5
2
2.5
3
OE Rollover Steering +10% +20%
Act
ivat
ion
Tim
e (s
)
Percentage of Max. SWD Steering Input Amplitude
First Steering RSC Activation Timing ComparisonSys A - Front Sys B - Front Sys C - Front
Sys A - Rear Sys B - Rear Sys C - Rear

102
Figure 5-21. RSC activations at both trailers during second steering of sine-with-dwells in 2S1M study, from OERS to +20% steering.
Figure 5-22. Warning times at both trailers during sine-with-dwells in 2S1M study, from OERS + 10% to +20% steering.
3.896 3.9763.728 3.648 3.5763.536 3.344 3.424
4.328 4.368
0
7.128 7.208
4.064 3.936 4.04
0
1
2
3
4
5
6
7
8
OE Rollover Steering +10% +20%
Act
ivat
ion
Tim
e (s
)
Percentage of Max. SWD Steering Input Amplitude
Sys A - Front Sys B - Front Sys C - Front
Sys A - Rear Sys B - Rear Sys C - Rear
Second Steering RSC Activation Timing Comparison
0
-1.444
0
1.512
0.7360.8321.08
0
1.136 1.12
0.432
0 0
0.272
1.224
-0.288
-3.104
0
-3.168
0.296
A B C A B C
+10% +20%
-3.5
-2.5
-1.5
-0.5
0.5
1.5
2.5
Percentage of Max. SWD Steering Input Amplitude
War
nin
g Ti
me
(s)
Front Driver Front Pass. Rear Driver Rear Pass.
Warning Times at Both Trailers for SWDs
No test

103
The objective of the vehicle in SWD tests is to stay upright while successfully evading an obstacle. In order
to check the latter, cones were set up, as shown in Figure 5-23, every four feet laterally at a distance of
200 ft. where the vehicle’s maximum lateral traveled distance occurred during the maneuver. A total of
17 cones were placed to mark a lateral distance of 64 ft. By logging the number of cones hit for each SWD
test, the amount of inward tracking by each system was recorded, and the differences at respective
rollover speeds were used to determine maneuverability improvements. This loss of maneuverability
when braking is an important aspect of RSC system performance in gauging the ability of a vehicle to
successfully avoid an obstacle without rolling over.
Figure 5-23. SWD course cones used to measure inward tracking. Understeer measured by number of cones hit.
Data of hit cones also shows that the tested RSC systems do not cause much inward tracking relative to
the baseline vehicle’s path. It is important to note that the activation times show that only System C
applied brakes before reaching the cones, so only System C can be treated as a potential comparison
between stock and RSC-using A-Doubles, but there was no difference between baseline and System C, as
shown in Figure 5-24. In fact, for the OERS+10% steering, System C performed better at evading cones
than did the baseline vehicle.

104
Figure 5-24. Vehicle inward tracking distance during sine-with-dwells in 2S1M study, from OERS - 20% to +10% steering.
5.2.3.1 SWD Conclusion
To conclude, RSC System C provided outrigger contact improvements of up to 100% at the steering of
OERS+10%, as no outriggers contacted. Meanwhile, Systems A and B provided an average improvement
of 24.93% and 36.21%, respectively, at all outriggers at the same steering. The maximum difference
between two systems was 102.37% at the front trailer driver-side outrigger, and more importantly, the
difference between outrigger contact forces at the rear trailer passenger-side outrigger was 77.94%. This
large difference between System B and System C arose from the additional 3.192 s that System C worked
with from an earlier activation time. Figure 5-25 shows the outrigger contact force improvements for all
four outriggers at OERS+10% steering.
The outrigger force improvements resulted in a maximum maneuverability of 20.63% before rollover and
a minimum of 9.53%, showing the efficacy of RSC systems in general for wide steering maneuvers, and
potentially large performance differences between RSC systems. Figure 5-26 displays the rollover steering
threshold improvements for the three RSC systems at OERS+10% steering.
16
12
6
2
10
6
2
16
10
9
4
16
10
6
0
-20% -10% OE Rollover Steering +10%
0
2
4
6
8
10
12
14
16
18
Percentage of Max. SWD Steering Input Amplitude
Dis
tan
ce (
ft.)
OE System A System B System CVehicle Inward Tracking Distance (First Steering)
No test

105
Figure 5-25. RSC system outrigger contact improvement for OERS+10 % steering sine-with-dwell test.
Figure 5-26. RSC system rollover steering threshold improvement over baseline during sine-with-dwell tests.
-2.37
37.95
26.0532.34
2.74
20.05
100
22.06
100 100 100 100
Front Driver Front Passenger Rear Driver Rear Passenger
-20
0
20
40
60
80
100
120
Outrigger Location
Forc
e Im
pro
vem
ent
(%)
System A System B System C
Outrigger Contact Improvement for SWD @ +10%
10 9.53125
20.625
System A System B System C
0
5
10
15
20
25
RSC System
Stee
rin
g A
mp
litu
de
Imp
rove
men
t (%
)
Rollover Steering Improvement through RSC Usage for SWDs

106
5.2.4 DLC Results
Figure 5-27 displays the outrigger contacts at both trailers for DLC maneuvers held at OERS to OERS+3.7%.
System A did not have any DLC testing. The baseline vehicle exhibited harsh roll both at OERS mph and
OERS+1.9%, and was withheld from any OERS+3.7% testing. Severe yaw dynamics usually accompanies
maneuvers in which outrigger contacts are present at both sides of a trailer, especially when both contacts
are of high magnitude, such as in the baseline OERS+1.9% test. The double lane change maneuver is highly
dynamic, as rearward amplification plays a pivotal role in the dynamics of the rear trailer. This is evident
in Figure 5-27, as the rear passenger outrigger experiences the highest contact forces as a result of a left-
right-left DLC maneuver.
DLC outrigger contact force results appear to be inconclusive, as severe yaw and roll occur with System C
at OERS and OERS+1.9%, but not at OERS+3.7%. The results also show that there was no rollover speed
threshold improvement, as the rollover speed of the baseline, System B, and System C were the same. A
closer look at Figure 5-27 will expose the fact that System C experienced the only front trailer roll out of
any configuration, and also experienced rear driver outrigger contact at the three speeds. There seems to
be large yaw stability differences between RSC systems, as System B exhibits no front trailer roll in any
test, unlike System C. A closer look at the outrigger contacts at the rear trailer is shown in Figure 5-28.
Figure 5-27. Outrigger contacts at both trailers during double lane changes in 2S1M study, from OERS to +3.7% mph.
0 0
359
0 0 0 0 0
438
1852853
1849
908 403
2529
1794 1734
22312487 2363 2416
857
0
500
1000
1500
2000
2500
3000
OE B C OE B C OE B C
OE Rollover Speed +1.9% +3.7%
Forc
e (l
bf)
Maneuver Entry Speed
Front Driver Rear Driver Front Pass. Rear Pass.
Outrigger Contacts at Both Trailers for DLCs
No tests

107
Figure 5-28. Rear trailer outrigger contacts during double lane changes in 2S1M study, from OERS to +3.7% mph.
Similar to the SWD maneuver, DLCs can be split into three separate steerings (Figure 5-29) which shows
the GPS results for a 55-mph DLC baseline test. The activation times for the two tested RSC systems for
both trailers are shown in Figures 5-30, 5-31 and 5-32, which show the first, second, and third steerings
of a DLC maneuver, respectively. Figure 5-30 shows that System C activated, while System B had not,
implying a more reactive (and possibly more intrusive) RSC system. Figures 5-31 and 5-32 display quite
similar trends in both RSC systems tested, with System C demonstrating shorter activation times. These
differences in activation time again play a large role in the warning times of the systems, as System B
activated too late while System C had operated but not with sufficient time for brake application (Figure
5-33).
Figure 5-29. GPS results for a double lane change test via Google Earth. There are three steering actions in a DLC.
438
0
1852
853
0
1849
908
403
2529
17941734
2231
24872363 2416
857
OE B C OE B C OE B C
OE Rollover Speed +1.9% +3.7%
0
500
1000
1500
2000
2500
3000
Maneuver Entry Speed
Forc
e (l
bf)
Driver Passenger
Rear Trailer Outrigger Contacts for DLCs
No tests
First Steering Third Steering Second Steering

108
Figure 5-30. RSC activation times during the first steering of double lane changes in 2S1M study, from OERS to +3.7% mph.
Figure 5-31. RSC activation times during the second steering of double lane changes in 2S1M study, from OERS to +3.7% mph.
0 0 00
1.72
00 0 0
2.328
0
2.126
0
0.5
1
1.5
2
2.5
OE Rollover Speed +1.9% +3.7%
Act
ivat
ion
Tim
e (s
)
Maneuver Entry Speed
First Steering RSC Activation Timing Sys B - Front Sys C - Front Sys B - Rear Sys C - Rear
0 0 0
3.112 2.984 3.024
4.024 3.8963.544
3.304 3.152 3.072
0
0.5
1
1.5
2
2.5
3
3.5
4
4.5
OE Rollover Speed +1.9% +3.7%
Act
ivat
ion
Tim
e (s
)
Maneuver Entry Speed
Second Steering RSC Activation Timing Sys B - Front Sys C - Front Sys B - Rear Sys C - Rear

109
Figure 5-32. RSC activation times during third steering of double lane changes in 2S1M study, from OERS to +3.7% mph.
Figure 5-33. Warning times of both trailers during double lane changes in 2S1M study, from OERS to +3.7% mph.
4.96 4.856 4.8644.752 4.736 4.52
6.045.784
5.328 5.192 5.08
0
1
2
3
4
5
6
7
OE Rollover Speed +1.9% +3.7%
Act
ivat
ion
Tim
e (s
)
Maneuver Entry Speed
Third Steering RSC Activation TimingSys B - Front Sys C - Front Sys B - Rear Sys C - Rear
0
0.592
0 0 0 00 0 0 0 0 00
0.496
0
0.544
0.032
1.088
-0.68
0.28
-0.784
0.312
-0.72
0.36
B C B C B C
OE Rollover Speed +1.9% +3.7%
-1
-0.5
0
0.5
1
1.5
Maneuver Entry Speed
War
nin
g Ti
me
(s)
Front Driver Front Pass. Rear Driver Rear Pass.
Warning Times at Both Trailers for DLCs
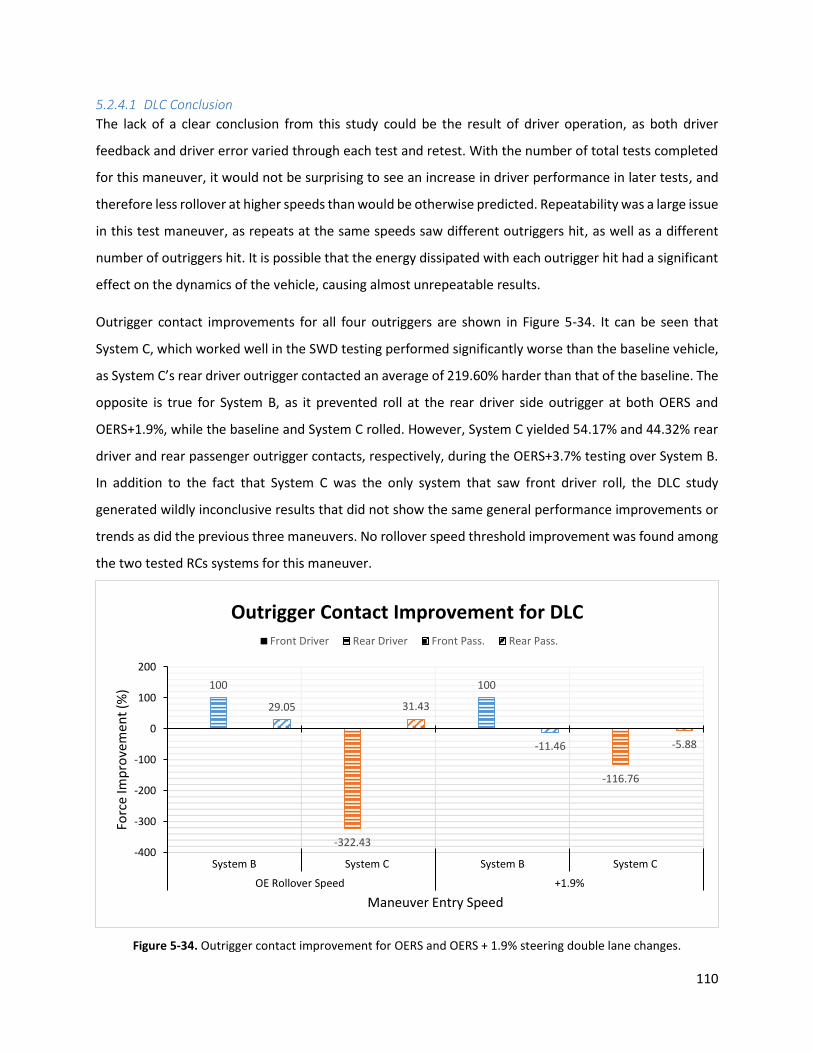
110
5.2.4.1 DLC Conclusion
The lack of a clear conclusion from this study could be the result of driver operation, as both driver
feedback and driver error varied through each test and retest. With the number of total tests completed
for this maneuver, it would not be surprising to see an increase in driver performance in later tests, and
therefore less rollover at higher speeds than would be otherwise predicted. Repeatability was a large issue
in this test maneuver, as repeats at the same speeds saw different outriggers hit, as well as a different
number of outriggers hit. It is possible that the energy dissipated with each outrigger hit had a significant
effect on the dynamics of the vehicle, causing almost unrepeatable results.
Outrigger contact improvements for all four outriggers are shown in Figure 5-34. It can be seen that
System C, which worked well in the SWD testing performed significantly worse than the baseline vehicle,
as System C’s rear driver outrigger contacted an average of 219.60% harder than that of the baseline. The
opposite is true for System B, as it prevented roll at the rear driver side outrigger at both OERS and
OERS+1.9%, while the baseline and System C rolled. However, System C yielded 54.17% and 44.32% rear
driver and rear passenger outrigger contacts, respectively, during the OERS+3.7% testing over System B.
In addition to the fact that System C was the only system that saw front driver roll, the DLC study
generated wildly inconclusive results that did not show the same general performance improvements or
trends as did the previous three maneuvers. No rollover speed threshold improvement was found among
the two tested RCs systems for this maneuver.
Figure 5-34. Outrigger contact improvement for OERS and OERS + 1.9% steering double lane changes.
100
-322.43
100
-116.76
29.05 31.43
-11.46 -5.88
System B System C System B System C
OE Rollover Speed +1.9%
-400
-300
-200
-100
0
100
200
Maneuver Entry Speed
Forc
e Im
pro
vem
en
t (%
)
Front Driver Rear Driver Front Pass. Rear Pass.
Outrigger Contact Improvement for DLC

111
5.2.5 Summary (A vs. B vs. C)
In summary of the single channel RSC system performance study, the following figures have been
generated. Four maneuvers were used to evaluate three different RSC systems, and outrigger contact
forces were used to quantify the roll severity for every rollover. The increase in rollover speed, or steering
for the SWD tests, are the main measure of determining the benefits of RSC systems in general, as well as
those of each specific RSC system tested. The differences between the RSC systems is calculated to
support the notion that there are measureable differences between the efficacies of different
commercially available RSC systems. Figure 5-35 shows the outrigger contact improvements for all three
RSC systems for all four maneuvers at a speed or steering one increment past the OERS. The outriggers
under consideration are the focus for each maneuver, so the J-turn and RSM tests concern the front
passenger side outrigger while the SWD and DLC look at the rear passenger side outrigger.
It can also be seen that although System C generally performed better than System A and System B, the
latter two performed better at different maneuvers. System B brought about a 100% increase (or
prevented roll completely) during the OERS+2.5% RSM, yet provided the worst improvement at 22.06%
for the OERS+10% SWD. System A actually worsened the front passenger-side outrigger contact force by
20.64% during RSM, but yielded a larger improvement over System B for SWD. Even System C, which
dominated SWD improvement results with a 20.63% maneuverability improvement, performed worse
than System B at J-turns. This data shows that RSC system algorithms can be geared towards certain
maneuvers more than others, and that RSC systems’ performances vary from situation to situation. The
OERS threshold improvements are shown in Figure 5-36. Steering improvements are shown on the right-
side axis, and speed improvements are shown on the left-side axis.
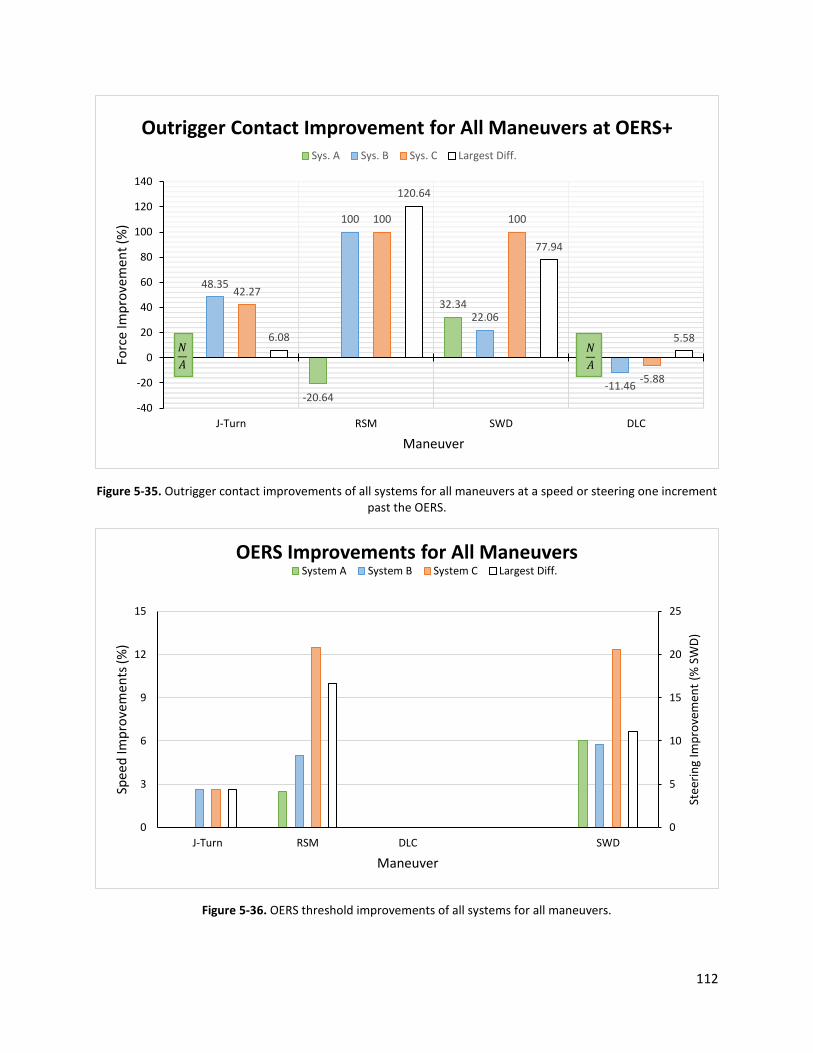
112
Figure 5-35. Outrigger contact improvements of all systems for all maneuvers at a speed or steering one increment past the OERS.
Figure 5-36. OERS threshold improvements of all systems for all maneuvers.
-20.64
32.34
48.35
100
22.06
-11.46
42.27
100 100
-5.88
6.08
120.64
77.94
5.58
J-Turn RSM SWD DLC
-40
-20
0
20
40
60
80
100
120
140
Maneuver
Forc
e Im
pro
vem
ent
(%)
Sys. A Sys. B Sys. C Largest Diff.
Outrigger Contact Improvement for All Maneuvers at OERS+
𝑁
𝐴
𝑁
𝐴
0
5
10
15
20
25
0
3
6
9
12
15
J-Turn RSM DLC SWD
Stee
rin
g Im
pro
vem
ent
(% S
WD
)
Spee
d Im
pro
vem
ents
(%)
Maneuver
OERS Improvements for All ManeuversSystem A System B System C Largest Diff. raxis
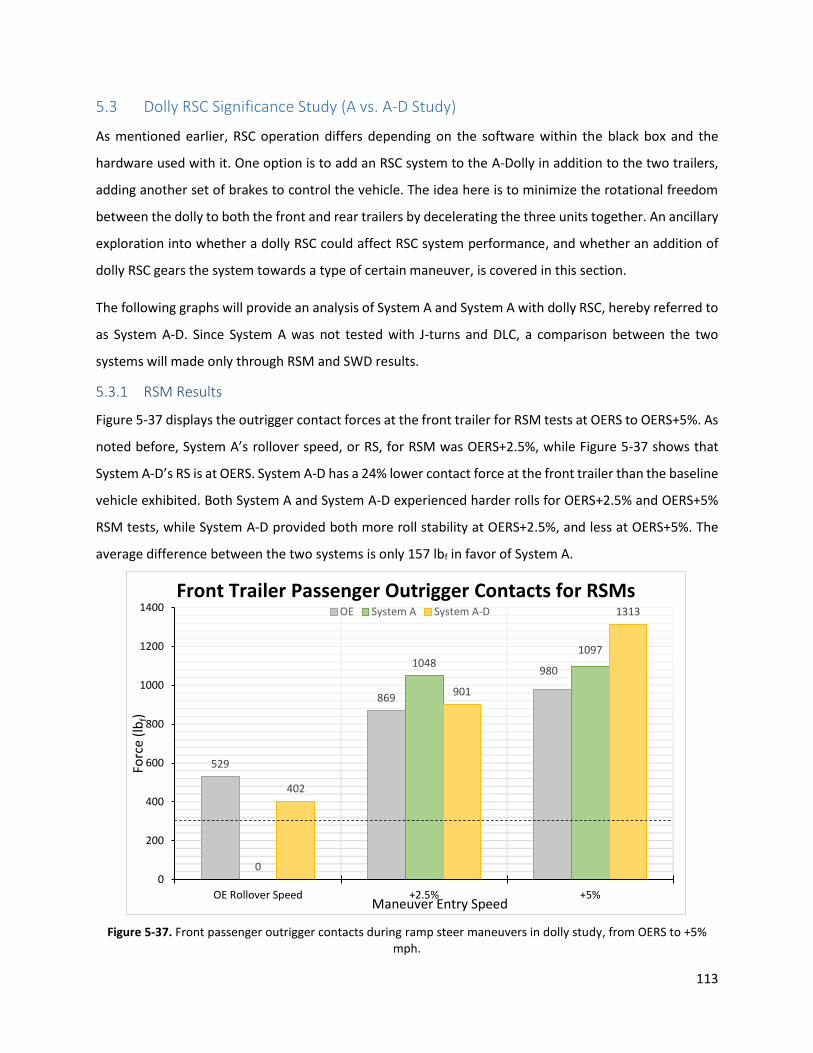
113
5.3 Dolly RSC Significance Study (A vs. A-D Study)
As mentioned earlier, RSC operation differs depending on the software within the black box and the
hardware used with it. One option is to add an RSC system to the A-Dolly in addition to the two trailers,
adding another set of brakes to control the vehicle. The idea here is to minimize the rotational freedom
between the dolly to both the front and rear trailers by decelerating the three units together. An ancillary
exploration into whether a dolly RSC could affect RSC system performance, and whether an addition of
dolly RSC gears the system towards a type of certain maneuver, is covered in this section.
The following graphs will provide an analysis of System A and System A with dolly RSC, hereby referred to
as System A-D. Since System A was not tested with J-turns and DLC, a comparison between the two
systems will made only through RSM and SWD results.
5.3.1 RSM Results
Figure 5-37 displays the outrigger contact forces at the front trailer for RSM tests at OERS to OERS+5%. As
noted before, System A’s rollover speed, or RS, for RSM was OERS+2.5%, while Figure 5-37 shows that
System A-D’s RS is at OERS. System A-D has a 24% lower contact force at the front trailer than the baseline
vehicle exhibited. Both System A and System A-D experienced harder rolls for OERS+2.5% and OERS+5%
RSM tests, while System A-D provided both more roll stability at OERS+2.5%, and less at OERS+5%. The
average difference between the two systems is only 157 lbf in favor of System A.
Figure 5-37. Front passenger outrigger contacts during ramp steer maneuvers in dolly study, from OERS to +5% mph.
529
869
980
0
10481097
402
901
1313
OE Rollover Speed +2.5% +5%
0
200
400
600
800
1000
1200
1400
Maneuver Entry Speed
Forc
e (l
bf)
OE System A System A-D
Front Trailer Passenger Outrigger Contacts for RSMs
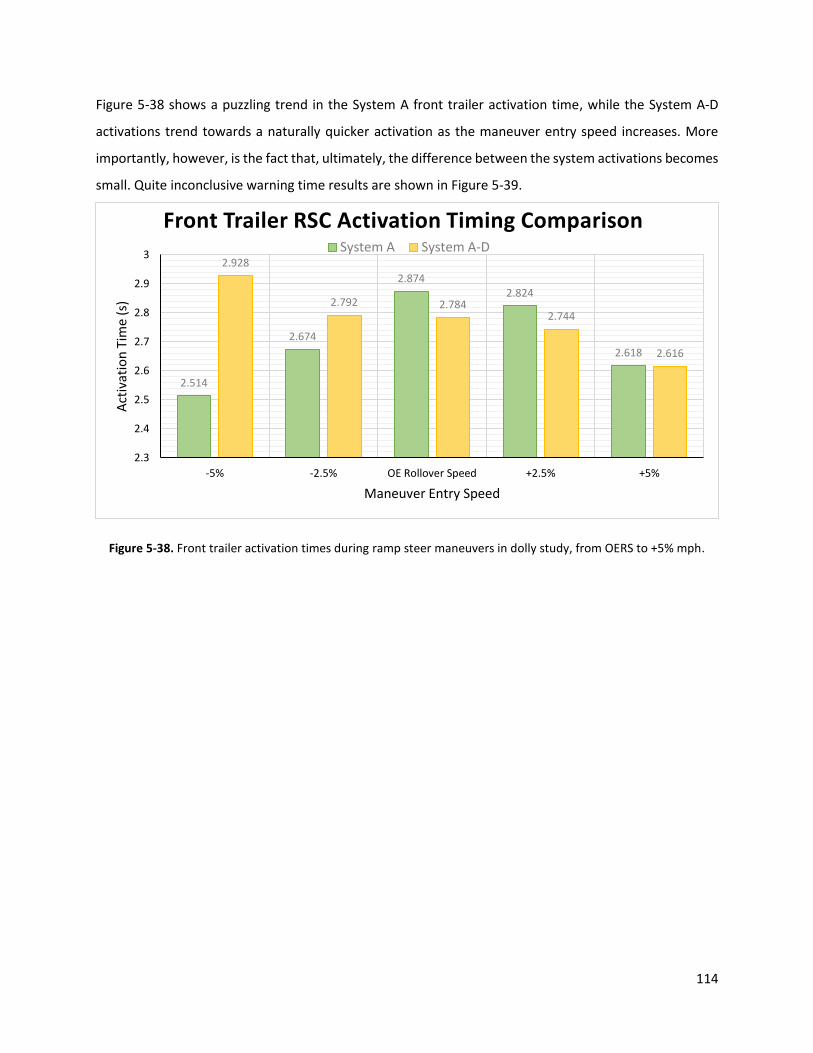
114
Figure 5-38 shows a puzzling trend in the System A front trailer activation time, while the System A-D
activations trend towards a naturally quicker activation as the maneuver entry speed increases. More
importantly, however, is the fact that, ultimately, the difference between the system activations becomes
small. Quite inconclusive warning time results are shown in Figure 5-39.
Figure 5-38. Front trailer activation times during ramp steer maneuvers in dolly study, from OERS to +5% mph.
2.514
2.674
2.8742.824
2.618
2.928
2.792 2.7842.744
2.616
2.3
2.4
2.5
2.6
2.7
2.8
2.9
3
-5% -2.5% OE Rollover Speed +2.5% +5%
Act
ivat
ion
Tim
e (s
)
Maneuver Entry Speed
Front Trailer RSC Activation Timing ComparisonSystem A System A-D

115
Figure 5-39. Front trailer warning times during ramp steer maneuvers in dolly study, from OERS to +5% mph.
5.3.1.1 RSM Conclusion (A vs. A-D)
Outrigger contact, activation data, and warning time data showed small differences between Systems A
and A-D. The only visible difference lay in the fact that System A-D rolled at OERS, one mph earlier than
System A, while activating earlier. This OERS yielded the largest front trailer passenger outrigger contact
improvement of 75.92%, but the average difference through two speeds in which both rolled was only
2.51% in favor of System A. Figure 5-40 shows these outrigger contact improvements. A very small
rollover speed improvement difference is shown in Figure 5-41.
0
0.6
0.69
0.936
0.72
0.584
OE Rollover Speed +2.5% +5%
0
0.1
0.2
0.3
0.4
0.5
0.6
0.7
0.8
0.9
1
Maneuver Entry Speed
War
nin
g Ti
me
(s)
System A System A-D
Front Trailer Passenger Warning Times for RSMs

116
Figure 5-40. System A and A-D front trailer passenger outrigger contact improvements for ramp steer maneuvers in dolly study, from OERS to +5% mph.
Figure 5-41. System A and A-D rollover speed threshold improvement over baseline for ramp steer maneuvers in dolly study.
100
-20.64-12.01
24.02
-3.66
-34.01
OE Rollover Speed +2.5% +5%
-60
-40
-20
0
20
40
60
80
100
120
Maneuver Entry Speed
Forc
e Im
pro
vem
ent
(%)
System A System A-D
Front Trailer Passenger Outrigger Contact Improvement for RSMs
2.50%
0
System A System A-D
0.00%
0.50%
1.00%
1.50%
2.00%
2.50%
3.00%
RSC System
Spee
d Im
pro
vem
ent
(%)
Rollover Speed Improvement through RSC Usage for RSM

117
5.3.2 SWD Results
The next several graphs cover the test results from SWD maneuvers. Figure 5-42 shows the outrigger
contact forces at the front trailer for SWD tests at OERS and OERS+10% steering amplitude. As seen in all
other SWD tests, the rear passenger side outrigger experiences the highest contact forces. System A-D
sees improvement over all four outrigger contacts at OERS+10%, which is the rollover steering for both
systems in this test set. Both System A and System A-D decrease all four outrigger contacts, mostly the
front passenger outrigger contact of 32.34% and 59.45%, respectively. Systems A and A-D perform quite
similarly, as seen in the closer looks at the front and rear trailer outrigger contacts for the second test
shown in Figure 5-42, with small improvements found in System A-D. The front trailer is shown in Figure
5-43 and the rear trailer is shown in Figure 5-44.
Figure 5-42. Outrigger contacts at both trailers for sine-with-dwells in dolly study, from OERS to +10% steering.
0 0
774793
720
0 0
794
587
490
503
0 0
1034
642577
498
0 0
1754
1187
711
0
200
400
600
800
1000
1200
1400
1600
1800
2000
OE A A-D OE A A-D
OE Rollover Steering +10%
Forc
e (l
bf)
Percentage of Max. SWD Steering Input Amplitude
Front Driver Rear Driver Front Pass. Rear Pass.
Outrigger Contacts at Both Trailers for SWDs

118
Figure 5-43. Outrigger contacts at front trailer during OERS +10% steering sine-with-dwell in dolly study.
Figure 5-44. Outrigger contacts at rear trailer during OERS +10% steering sine-with-dwell in dolly study.
774 793
720
1034
642
577
OE A A-D
0
200
400
600
800
1000
1200
Percentage of Max. SWD Steering Input Amplitude
Forc
e (l
bf)
Driver Passenger
Front Trailer +10% SWD Outrigger Contacts
794
587
490
1754
1187
711
OE A A-D
0
200
400
600
800
1000
1200
1400
1600
1800
2000
Percentage of Max. SWD Steering Input Amplitude
Forc
e (l
bf)
Driver Passenger
Rear Trailer +10% SWD Outrigger Contacts

119
Activation times and warning times show just how similarly the two perform. As it holds for any SWD test,
activation times are split into the first and second steerings of the maneuver. Figure 5-45 shows the first
steering activation times, and Figure 5-46 shows the second steering activation times. The minimal
improvements of one system over the other provide negligible differences in real-life rollovers of such
heavy and large vehicles. Figure 5-47 displays the similar warning times of the two systems at +10% SWD.
An argument for inward tracking differences as a measure of performance was again valid for this study
as both systems activated brakes before reaching the cones in SWD tests. The amount of vehicle
understeer is shown in Figure 5-48. There was no significant difference between the inward tracking
between System A and System A-D.
Figure 5-45. RSC activation times during first steering of sine-with-dwells in dolly study, from OERS -10% to +10% steering.
0 0 00 0 0
2.592 2.6 2.62.736
2.522.672
0
0.5
1
1.5
2
2.5
3
-10% OE Rollover Steering +10%
Act
ivat
ion
Tim
e (s
)
Percentage of Max. SWD Steering Input Amplitude
First Steering RSC Activation Timing for SWDsSys A - Front Sys A-D - Front Sys A - Rear Sys A-D - Rear

120
Figure 5-46. RSC activation times during second steering of sine-with-dwells in dolly study, from OERS -10% to +10% steering.
Figure 5-47. Warning time for both trailers during OERS +10% steering sine-with-dwell in dolly study.
3.808 3.896 3.9763.848 3.816 3.9444.328 4.328 4.368
0
4.32 4.36
0
0.5
1
1.5
2
2.5
3
3.5
4
4.5
5
-10% OE Rollover Steering +10%
Act
ivat
ion
Tim
e (s
)
Percentage of Max. SWD Steering Input Amplitude
Sys A - Front Sys A-D - Front Sys A - Rear Sys A-D - Rear
Second Steering RSC Activation Timing for SWDs
0 0
0.832 0.824
0.4320.336
-0.288
0.072
A A-D
-0.4
-0.2
0
0.2
0.4
0.6
0.8
1
1.2
Percentage of Max. SWD Steering Input Amplitude
War
nin
g Ti
me
(s)
Front Driver Front Pass. Rear Driver Rear Pass.
Warning Times at Both Trailers for +10% SWD

121
Figure 5-48. Vehicle inward tracking distance during OERS +10% steering sine-with-dwell in dolly study.
5.3.2.1 SWD Conclusion (A vs. A-D)
As seen in the RSM results for the two systems, there were small differences between the two systems
found in the SWD results. Figure 5-49 presents the outrigger contact improvement for SWD at OERS+10%
steering, and shows the similar performance of the two systems. Figure 5-49 shows all four outriggers for
the OERS+10% steering, and the most important is again the rear passenger side outrigger. The difference
between the two systems there was 27.11%, while the average of the differences at the other outriggers
was a measly 9.30%, with System A-D outperforming System A. This is not enough to create any
measurable differences in roll stability. This holds true for the small maneuverability difference seen
between the two, which is shown in Figure 5-50.
16
12
6
2
10
6
2
18
12
8
0
-20% -10% OE Rollover Speed +10%
0
2
4
6
8
10
12
14
16
18
20
Percentage of Max. SWD Steering Input Amplitude
Trac
k-In
Dis
tain
ce (
ft.)
OE System A System A-DVehicle Inward Tracking Distance (First Steering)
No tests

122
Figure 5-49. System A and A-D outrigger contact improvement for OERS + 10% steering sine-with-dwell.
Figure 5-50. System A and A-D rollover steering threshold improvement over baseline during sine-with-dwells.
-2.37
37.95
26.05
32.34
6.99
44.24
38.31
59.45
Front Driver Front Passenger Rear Driver Rear Passenger
-10
0
10
20
30
40
50
60
70
Outrigger Location
Forc
e Im
pro
vem
ent
(%)
System A System A-D
Outrigger Contact Improvement for SWD at +10%
10 9.6875
System A System A-D
0
3
6
9
12
15
RSC System
Stee
rin
g A
mp
litu
de
Imp
rove
men
t (%
)
Rollover Steering Improvement through RSC Usage for SWDs
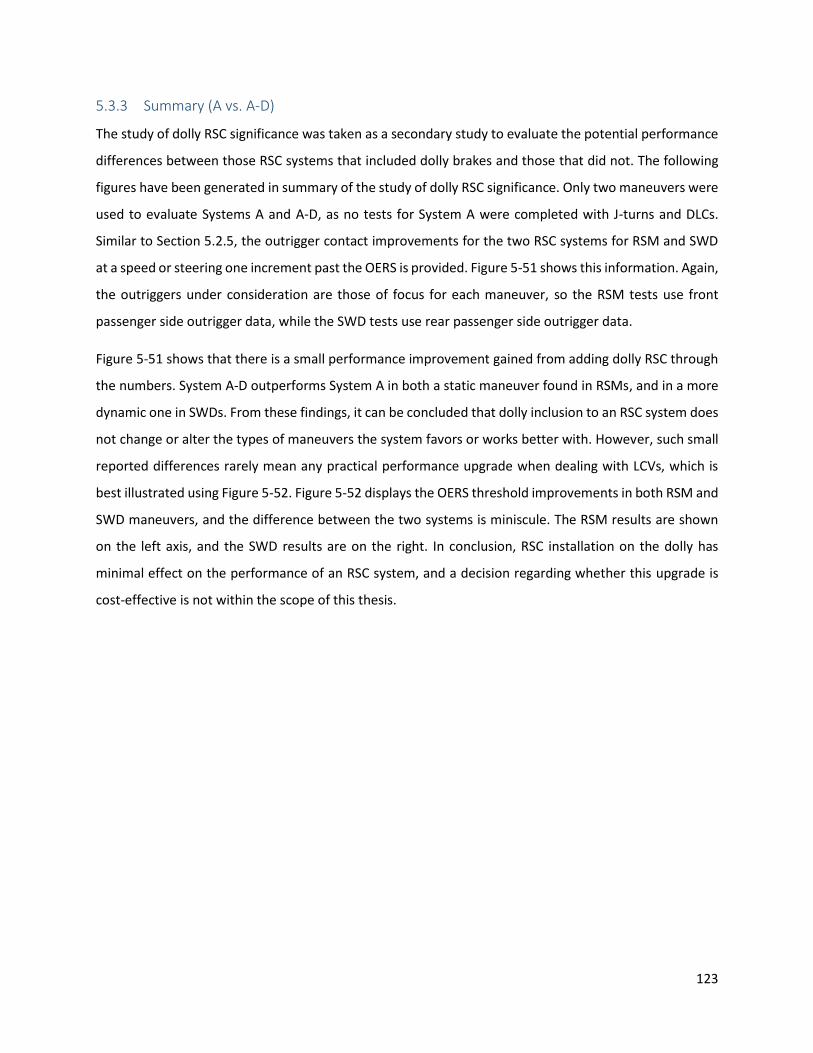
123
5.3.3 Summary (A vs. A-D)
The study of dolly RSC significance was taken as a secondary study to evaluate the potential performance
differences between those RSC systems that included dolly brakes and those that did not. The following
figures have been generated in summary of the study of dolly RSC significance. Only two maneuvers were
used to evaluate Systems A and A-D, as no tests for System A were completed with J-turns and DLCs.
Similar to Section 5.2.5, the outrigger contact improvements for the two RSC systems for RSM and SWD
at a speed or steering one increment past the OERS is provided. Figure 5-51 shows this information. Again,
the outriggers under consideration are those of focus for each maneuver, so the RSM tests use front
passenger side outrigger data, while the SWD tests use rear passenger side outrigger data.
Figure 5-51 shows that there is a small performance improvement gained from adding dolly RSC through
the numbers. System A-D outperforms System A in both a static maneuver found in RSMs, and in a more
dynamic one in SWDs. From these findings, it can be concluded that dolly inclusion to an RSC system does
not change or alter the types of maneuvers the system favors or works better with. However, such small
reported differences rarely mean any practical performance upgrade when dealing with LCVs, which is
best illustrated using Figure 5-52. Figure 5-52 displays the OERS threshold improvements in both RSM and
SWD maneuvers, and the difference between the two systems is miniscule. The RSM results are shown
on the left axis, and the SWD results are on the right. In conclusion, RSC installation on the dolly has
minimal effect on the performance of an RSC system, and a decision regarding whether this upgrade is
cost-effective is not within the scope of this thesis.

124
Figure 5-51. Outrigger contact improvements of Systems A & A-D for ramp steer maneuvers and sine-with-dwells at a speed or steering one increment past the OERS.
Figure 5-52. OERS threshold improvements of Systems A & A-D for ramp steer maneuvers and sine-with-dwells.
-20.64
32.34
-3.66
59.45
16.98
27.11
RSM SWD
-40
-20
0
20
40
60
80
100
Maneuver
Forc
e Im
pro
vem
ent
(%)
Sys. A Sys. A-D Largest Diff.
Outrigger Contact Improvement for RSMs & SWDs at OERS+
0
5
10
15
20
25
0
0.5
1
1.5
2
2.5
3
3.5
4
4.5
5
RSM SWD
Stee
rin
g Im
pro
vem
ent
(% S
WD
)
Spee
d Im
pro
vem
ents
(%)
Maneuver
OERS Threshold Improvements for RSM and SWDSystem A System A-D Largest Diff. raxis

125
5.4 Single vs. Dual Channel System Performance Study (C vs. C-2 Study)
Another option to differentiate RSC operation from one system to another is to change the number of
ABS modulator valves used for braking. For example, the three single-channel RSC systems evaluated
earlier are of a 2S1M configuration, which includes two wheel sensors (one for each wheel), and one ABS
modulator. A 2S2M system allows for distinct control of either side of a trailer and thus individual braking
at each wheel. Figure 2-11 in Chapter 2 shows a simple diagram of the difference between a 2S1M and a
2S2M RSC system. Another key difference between the two systems is the number of activation steps
used. A 2S1M system (RSC System C) has one activation step, while the 2S2M system (RSC System C-2)
has two. Due to the proprietary nature of the operation of the systems, a more detailed description of the
two systems is not provided. This section of this chapter will cover the performance comparison between
a 2S1M system (RSC System C) and an equivalent 2S2M system (RSC System C-2) for all four maneuvers.
5.4.1 J-turn Results
Figure 5-53 shows the passenger outrigger contacts at both trailers in J-turns from OERS to OERS+10.5%.
The baseline vehicle was not tested past OERS+5.3% mph due to roll severity at that speed. System C-2
performed with a 20.22% average improvement from System C over the four speeds in which roll
occurred. Also, while System C displayed rear trailer roll, System C-2 never did. Figures 5-54 and 5-55 show
the front and rear trailer outrigger contacts. Vast performance differences between the two systems can
be noted.

126
Figure 5-53. Passenger outrigger contacts at both trailers for J-turns in 2S2M study, from OERS to +10.5% mph.
Figure 5-54. Passenger outrigger contacts at front trailer during J-Turns in 2S2M study, from OERS to +10.5% mph.
562
0 0
1184
684612
1489
978
533
14501554
1696
1154
0 0 0
607
0 0
1428
0 0
381
0
711
0
OE C C-2 OE C C-2 OE C C-2 OE C C-2 OE C C-2
OE Rollover Speed +2.6% +5.3% +7.9% +10.5%
0
200
400
600
800
1000
1200
1400
1600
1800
Maneuver Entry Speed
Forc
e (l
bf)
Front RearPassenger Outrigger Contacts at Both Trailers for J-Turns
No test
No test
562
1184
1489
0
684
978
1450
1696
0
612533
1555
1154
OE Rollover Speed +2.6% +5.3% +7.9% +10.5%
0
200
400
600
800
1000
1200
1400
1600
1800
2000
Maneuver Entry Speed
Forc
e (l
bf)
OE System C System C-2
Front Trailer Passenger Outrigger Contacts for J-Turns
No test
No test

127
Figure 5-55. Passenger outrigger contacts at the rear trailer during J-turns in 2S2M study, from OERS to +10.5% mph.
Figures 5-56 and 5-57 display the activation time and warning time comparisons of System C and C-2.
System C-2 continues to show improved performance over its single-channel/single-modulator
counterpart, displaying averages of 22.51% and 46.37% improvement in activation timing and warning
time, respectively, over four speeds. By outperforming System C, System C-2 has even larger performance
differences between itself and Systems A, A-D, and B as well.
0
607
1428
0 0 0
381
711
0 0 0 0 0
OE Rollover Speed +2.6% +5.3% +7.9% +10.5%
0
200
400
600
800
1000
1200
1400
1600
Maneuver Entry Speed
Forc
e (l
bf)
OE System C System C-2
Rear Trailer Passenger Outrigger Contacts for J-Turns
No test
No test

128
Figure 5-56. RSC activation times at the front trailer during J-turns in 2S2M study, from OERS to +10.5% mph.
Figure 5-57. Passenger warning times at the front trailer during J-turns in 2S2M study, from OERS to +10.5% mph.
1.824 1.808 1.84 1.872
1.44 1.4241.512
1.312
0
0.2
0.4
0.6
0.8
1
1.2
1.4
1.6
1.8
2
+2.6% +5.3% +7.9% +10.5%
Act
ivat
ion
Tim
e (s
)
Maneuver Entry Speed
Front Trailer RSC Activation Timing for J-TurnsSystem C System C-2
1.081.16
0.888
0.72
1.752
1.296
1.168
1.296
+2.6% +5.3% +7.9% +10.5%
0
0.2
0.4
0.6
0.8
1
1.2
1.4
1.6
1.8
2
Maneuver Entry Speed
War
nin
g Ti
me
(s)
System C System C-2
Front Trailer Passenger Warning Times for J-Turns

129
5.4.1.1 J-Turn Conclusion (C vs. C-2)
RSC System C-2 largely outperformed its single-channel counterpart System C, yielding a peak outrigger
contact force improvement difference of 29.89% between the two systems. The front trailer passenger
outrigger contact improvements for two speeds are shown in Figure 5-58. It is important to note that
System C-2 provided a massive improvement at the rear passenger side outrigger, as a contact force of
711 lbf with System C was decreased to zero (no roll) at OERS+10.5%.
Figure 5-58. Front passenger side outrigger contact improvements of Systems C and C-2 over baseline during J-turns in 2S2M study, from OERS + 2.6% to +5.3% mph.
The rollover speed improvements over baseline for both the front and rear trailers found in using the two
RSC systems are shown in Figure 5-59. Although the RS improvement at the rear trailer is significant, the
there is none at the front trailer for either of the two systems. Since speed improvements were calculated
using roll at either trailer, there is no speed improvement between the two systems. Again, driver
feedback can play a large role in the test results.
42.27
34.33
48.35
64.23
+2.6% +5.3%
0
10
20
30
40
50
60
70
Maneuver Entry Speed
Forc
e Im
pro
vem
ent
(%)
System C System C-2
Front Trailer Passenger Outrigger Contact Improvement for J-Turns
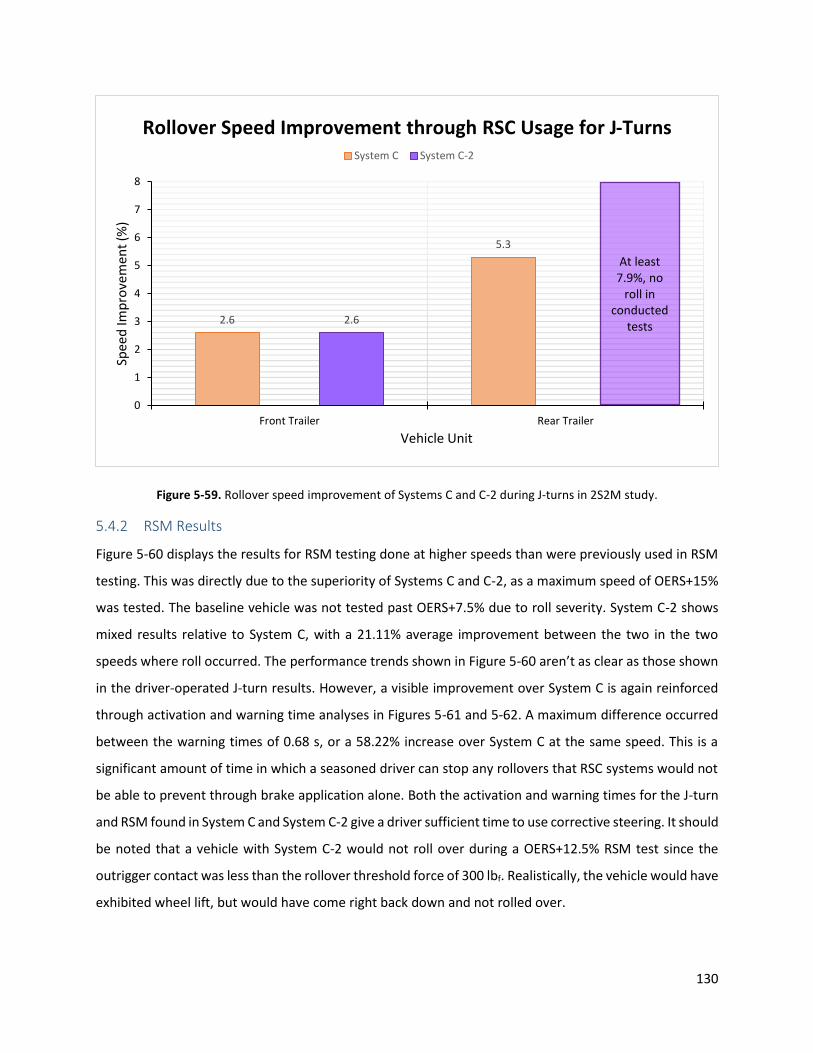
130
Figure 5-59. Rollover speed improvement of Systems C and C-2 during J-turns in 2S2M study.
5.4.2 RSM Results
Figure 5-60 displays the results for RSM testing done at higher speeds than were previously used in RSM
testing. This was directly due to the superiority of Systems C and C-2, as a maximum speed of OERS+15%
was tested. The baseline vehicle was not tested past OERS+7.5% due to roll severity. System C-2 shows
mixed results relative to System C, with a 21.11% average improvement between the two in the two
speeds where roll occurred. The performance trends shown in Figure 5-60 aren’t as clear as those shown
in the driver-operated J-turn results. However, a visible improvement over System C is again reinforced
through activation and warning time analyses in Figures 5-61 and 5-62. A maximum difference occurred
between the warning times of 0.68 s, or a 58.22% increase over System C at the same speed. This is a
significant amount of time in which a seasoned driver can stop any rollovers that RSC systems would not
be able to prevent through brake application alone. Both the activation and warning times for the J-turn
and RSM found in System C and System C-2 give a driver sufficient time to use corrective steering. It should
be noted that a vehicle with System C-2 would not roll over during a OERS+12.5% RSM test since the
outrigger contact was less than the rollover threshold force of 300 lbf. Realistically, the vehicle would have
exhibited wheel lift, but would have come right back down and not rolled over.
2.6
5.3
2.6
Front Trailer Rear Trailer
0
1
2
3
4
5
6
7
8
Vehicle Unit
Spee
d Im
pro
vem
ent
(%)
System C System C-2
Rollover Speed Improvement through RSC Usage for J-Turns
At least 7.9%, no
roll in conducted
tests

131
Figure 5-60. Passenger outrigger contacts at the front trailer during ramp steer maneuvers in 2S2M study, from OERS + 7.5% to +15% mph.
Figure 5-61. RSC activation times at the front trailer during ramp steer maneuvers in 2S2M study, from OERS + 7.5% to +15% mph.
1065
0
461504
0
229
544
+7.5% +12.5% +15%
0
200
400
600
800
1000
1200
Maneuver Entry Speed
Forc
e (l
bf)
OE System C System C-2Front Trailer Passenger Outrigger Contacts for RSMs
No test
No test
2 2.0161.92
1.584 1.576 1.6
0
0.5
1
1.5
2
2.5
+7.5% +12.5% +15%
Act
ivat
ion
Tim
e (s
)
Maneuver Entry Speed
Front Trailer RSC Activation Timing ComparisonSystem C System C-2

132
Figure 5-62. Passenger warning times at the front trailer during ramp steer maneuvers in 2S2M study, from OERS + 7.5% to +15% mph.
5.4.2.1 RSM Conclusion (C vs. C-2)
The RSM results from this study are difficult to analyze simply due to the sheer roll stability advantages of
the two systems at hand. Both Systems C and C-2 were tested to OERS+15%, and rolled at OERS+12.5% in
RSM tests, two speeds at which neither the baseline vehicle nor other RSC systems were tested. The only
reference points to compare these two systems in this maneuver are themselves, and a comparison
between the two has been discussed above. It is clear that neither system rolled at either OERS or
OERS+7.5%. These were the last two speeds tested with the baseline configuration.
The performance increase from System C in RSM is less than that seen for J-turns, which saw no rise in
rollover speed threshold. The same holds true for RSM results, as both System C and System C-2 yielded
a 5 mph rollover speed threshold. Even though there were no measurable differences between the
rollover speed improvement of System C and System C-2, clear differences between the warning times of
the two systems are present. These differences could definitely produce larger rollover speed differences,
as drivers have more time to react and prevent rollover when the RSC systems themselves cannot.
0
1.168 1.128
0
1.848
1.512
+7.5% +12.5% +15%
0
0.5
1
1.5
2
Maneuver Entry Speed
War
nin
g Ti
me
(s)
System C System C-2Front Trailer Passenger Warning Times for RSMs

133
5.4.3 SWD Results
A comparison of SWD results for Systems C and C-2 are shown below. Figure 5-63 displays the outrigger
contact forces at the front trailer for SWD tests at OERS, OERS+10%, and OERS+20% steering amplitude.
Again, the rear passenger side outrigger experiences the highest contact forces. System C-2 rolls earlier
at OERS+10% than does System C, yielding a higher maneuverability improvement for the latter over the
former. System C-2 does not roll at the front driver side however, due to earlier first steering activation
times, which are shown in Figure 5-64. On the other hand, System C-2 has a harder contact at the front
passenger side outrigger. The driver side outriggers contact during the first steering of a SWD, which is
quite quasi-static, and the passenger side outriggers contact as the vehicle whips back towards the left.
This initially generated the theory that System C would be better at dealing with dynamic maneuvers,
while System C-2 would perform better for more static maneuvers such as the J-turn and RSM. This theory
is supported further in Figures 5-64 and 5-65, which show the first and second steering activation times.
The differences in activation time between the two systems diminishes from the first and second
steerings.
Figure 5-63. Outrigger contacts at both trailers during sine-with-dwells in 2S2M study, from OERS to +20% steering.
774
0
541
794 282
589
503
0 0
1034
0
517674
498
0 0
1754
0
1181
1756
1899
0
500
1000
1500
2000
OE C C-2 OE C C-2 OE C C-2
OE Rollover Steering +10% +20%
Forc
e (l
bf)
Percentage of Max. SWD Steering Input Amplitude
Front Driver Rear Driver Front Pass. Rear Pass.
Outrigger Contacts at Both Trailers for SWDs
No tests

134
Figure 5-64. RSC activations at both trailers during first steering of sine-with-dwells in 2S2M study, from OERS to +20% steering.
Figure 5-65. RSC activation at both trailers during second steering of sine-with-dwells in 2S2M study, from OERS to +20% steering.
Figure 5-66 shows the largest recorded warning time exhibited by System C-2 at the rear passenger
outrigger, even though it had the largest contact. With driver feedback, this contact may have been
decreased considerably. The higher warning times found in System C-2 J-turn and RSM tests are gone in
SWD tests, except for at the rear driver side outrigger. Since the first steering of the SWD is similar to a
1.7761.568 1.552
1.344 1.32 1.264
2.2962.128 2.128
1.776 1.848 1.816
0
0.5
1
1.5
2
2.5
OE Rollover Steering +10% +20%
Act
ivat
ion
Tim
e (s
)
Percentage of Max. SWD Steering Input Amplitude
First Steering RSC Activation Timing ComparisonSys C - Front Sys C2 - Front Sys C - Rear Sys C2 - Rear
3.5363.344 3.4243.28 3.368 3.472
4.064 3.936 4.043.808 3.96
4.224
0
0.5
1
1.5
2
2.5
3
3.5
4
4.5
OE Rollover Steering +10% +20%
Act
ivat
ion
Tim
e (s
)
Percentage of Max. SWD Steering Input Amplitude
Sys C - Front Sys C2 - Front Sys C - Rear Sys C2 - Rear
Second Steering RSC Activation Timing Comparison

135
static, constant steering such as in J-turns and RSMs, this large warning time occurs. Figure 5-66 shows
the warning times for both trailers at OERS+10% and OERS+20% steering results for Systems C and C-2.
Figure 5-66. Warning time at both trailers during sine-with-dwells in 2S2M study, from OERS + 10% to +20% steering.
System C-2 activates more quickly in SWD maneuvers than any other RSC system included in this entire
study, giving the biggest chance for brake application to cause understeer in the SWD. Yet there is still no
evidence that inward tracking during evasive maneuvers occurs due to RSC usage (Figure 5-67). Again, it
should be noted that this conclusion was reached for the systems tested, and not for all RSC systems.
0 0
0.736
00 0
1.12
0.504
0 0
1.224
1.688
0
0.360.296
0.2
C C-2 C C-2
+10% +20%
0
0.2
0.4
0.6
0.8
1
1.2
1.4
1.6
1.8
2
Percentage of Max. SWD Steering Input Amplitude
War
nin
g Ti
me
(s)
Front Driver Front Pass. Rear Driver Rear Pass.
Warning Times at Both Trailers for SWDs

136
Figure 5-67. Vehicle inward tracking distance during sine-with-dwells in 2S2M study, from OERS -20% to +20% steering.
5.4.3.1 SWD Conclusion (C vs. C-2)
At OERS+10% steering, all four outriggers of the baseline vehicle contacted while none of the System C
vehicle configuration did so. System C-2 showed a 32.69% decrease in outrigger contact force at the rear
trailer passenger side outrigger at this speed, meaning that System C-2 sees a lower maneuverability
improvement than does System C, as seen in Figure 5-68.
16
12
6
2
16
10
6
0
16
14
6
1
0
2
4
6
8
10
12
14
16
18
-20% -10% OE Rollover Steering +10%
Dis
tan
ce (
ft.)
Percentage of Max. SWD Steering Input Amplitude
Vehicle Inward Tracking DistanceOE System C System C-2
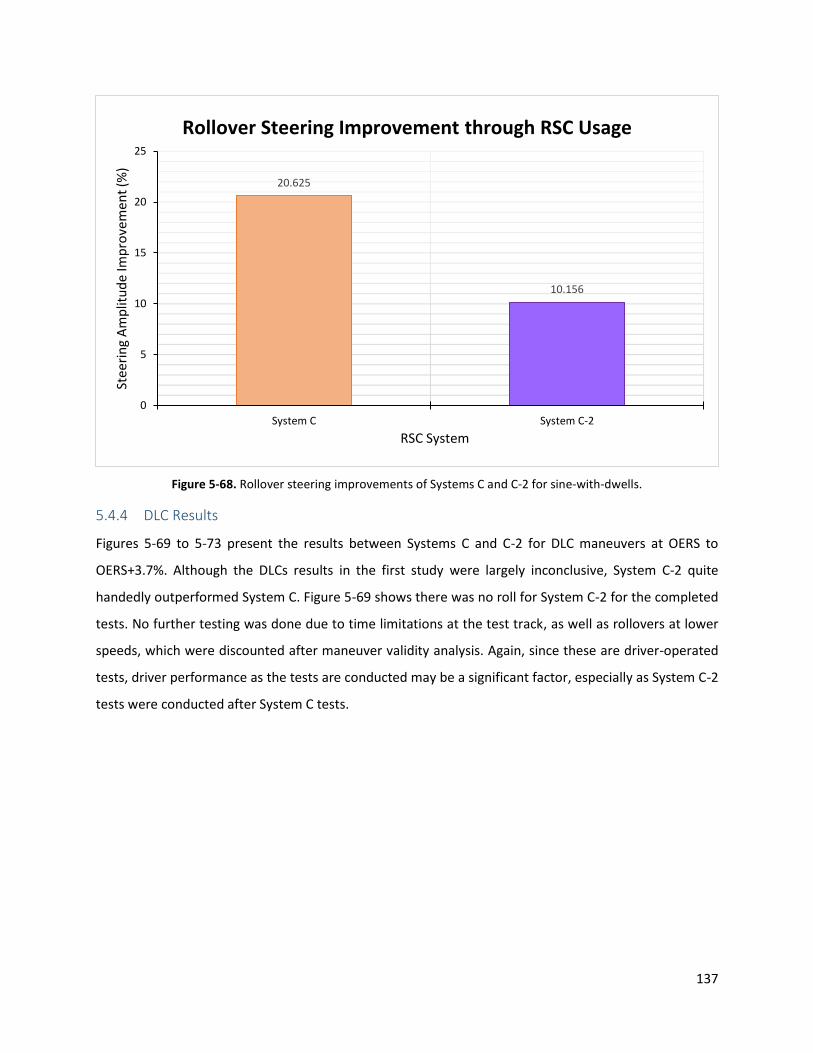
137
Figure 5-68. Rollover steering improvements of Systems C and C-2 for sine-with-dwells.
5.4.4 DLC Results
Figures 5-69 to 5-73 present the results between Systems C and C-2 for DLC maneuvers at OERS to
OERS+3.7%. Although the DLCs results in the first study were largely inconclusive, System C-2 quite
handedly outperformed System C. Figure 5-69 shows there was no roll for System C-2 for the completed
tests. No further testing was done due to time limitations at the test track, as well as rollovers at lower
speeds, which were discounted after maneuver validity analysis. Again, since these are driver-operated
tests, driver performance as the tests are conducted may be a significant factor, especially as System C-2
tests were conducted after System C tests.
20.625
10.156
System C System C-2
0
5
10
15
20
25
RSC System
Stee
rin
g A
mp
litu
de
Imp
rove
men
t (%
)Rollover Steering Improvement through RSC Usage

138
Figure 5-69. Outrigger contacts at both trailers during double lane changes in 2S2M study, from OERS to +3.7% mph.
Figures 5-70, 5-71, and 5-72 show similar activation times for the two systems in the first, second, and
third steerings of the DLC maneuver, respectively, and differences between the two systems are minute,
while System C-2 displayed a general performance outrigger contact improvement over System C. Figure
5-73 displays a seemingly large difference in the two systems in warning time, but the scale shown is quite
small and there were no outrigger hits for System C-2. DLC results proved to be less than optimal again,
as driver performance varied heavily from system to system. This is shown in Figure 5-74, which indicates
the steering wheel input for eight different OERS+1.9% tests. System C tests shown were tested first,
followed by the System C-2 tests, and finally by the baseline tests. The curves not only consist of different
peak to peak times, but also different amplitudes. DLCs are highly inconsistent, and the results from their
testing should not be considered too heavily.
0
359
0 0 0 0 0 0
438
1852
853
1849
403
2529
1734
0
2231
2363
0
857
00
500
1000
1500
2000
2500
3000
OE C C-2 OE C C-2 OE C C-2
OE Rollover Speed +1.9% +3.7%
Forc
e (l
bf)
Maneuver Entry Speed
Front Driver Rear Driver Front Pass. Rear Pass.
Outrigger Contacts at Both Trailers for DLCs
No tests

139
Figure 5-70. RSC activation times during first steering of double lane changes in 2S2M study, from OERS to +3.7% mph.
Figure 5-71. RSC activation times during second steering of double lane changes in 2S2M study, from OERS to +3.7% mph.
0
1.72
0
1.3921.224
1.36
2.328
0
2.126
1.8161.712
1.808
0
0.5
1
1.5
2
2.5
OE Rollover Speed +1.9% +3.7%
Act
ivat
ion
Tim
e (s
)
Maneuver Entry Speed
First Steering DLC Activation Timing Sys C - Front Sys C-2 - Front Sys C - Rear Sys C-2 - Rear
3.1122.984 3.024
2.8162.68 2.752
3.3043.152 3.0723.104 3.112 3.144
0
0.5
1
1.5
2
2.5
3
3.5
OE Rollover Speed +1.9% +3.7%
Act
ivat
ion
Tim
e (s
)
Maneuver Entry Speed
Second Steering DLC Activation Timing Sys C - Front Sys C-2 - Front Sys C - Rear Sys C-2 - Rear

140
Figure 5-72. RSC activation times during third steering of double lane changes in 2S2M study, from OERS to +3.7% mph.
Figure 5-73. Warning times at both trailers during double lane changes in 2S2M study, from OERS to +3.7% mph.
4.752 4.736
4.524.456 4.472
5.328
5.1925.085.12
5.032
4.824
4
4.2
4.4
4.6
4.8
5
5.2
5.4
OE Rollover Speed +1.9% +3.7%
Act
ivat
ion
Tim
e (s
)
Maneuver Entry Speed
Third Steering DLC Activation TimingSys C - Front Sys C-2 - Front Sys C - Rear Sys C-2 - Rear
0.592
0 0 0 0 00 0 0 0 0 0
0.496
0
0.544
0
1.088
0
0.28
0
0.312
0
0.36
0
C C-2 C C-2 C C-2
OE Rollover Speed +1.9% +3.7%
0
0.2
0.4
0.6
0.8
1
1.2
1.4
Maneuver Entry Speed
War
nin
g Ti
me
(s)
Front Driver Front Pass. Rear Driver Rear Pass.
Warning Times at Both Trailers for DLCs

141
Figure 5-74. Steering wheel input for eight different OERS + 1.9% double lane change tests.
5.4.5 Summary (C vs. C-2)
Another secondary study was conducted with the objective of evaluating the differences between a single
channel and a dual channel RSC system. It was found in all maneuvers that the dual channel system C-2
activated earlier and had longer warning times than did System C, yet the performance difference
between the two systems points to System C being superior. Figures 5-75 and 5-76 display the outrigger
contact improvements and the OERS threshold improvements for all maneuvers. The outrigger contact
improvements are provided for a speed or steering one increment past the OERS only. Again, the
outriggers under consideration are those of focus for each maneuver.
The Figure 5-75 results regarding a single and dual channel comparison are quite confusing. Although
System C-2 repeatedly activated earlier and gave the driver a longer warning time, System C-2 actually
yielded lower outrigger contact improvements over baseline at the next SWD increment over OERS, and
the same improvement as System C in the next RSM increment over OERS. A small enhancement is found
in J-turns, and the largest upgrade existed in DLCs. System C-2 showed no preference for types of
maneuvers, as no pattern was found to differentiate better performances in either more static or more
dynamic maneuvers. This study yielded quite inconclusive results regarding the selection of 2S2M systems
over 2S1M and vice versa. Still, a decision can be made for installing System C-2 over System C for the
specific maneuver of DLC, as a performance difference between System C-2 and the other Systems A, A-

142
D, and B is massive. Again, a decision regarding whether a 2S1M or 2S2M system is more cost-effective is
not within the scope of this thesis.
Figure 5-75. Outrigger contact improvements of Systems C and C-2 for all maneuvers at a speed or steering one increment past the OERS.
Figure 5-76 shows the OERS threshold improvements for all four maneuvers. Again, there is graphical
evidence for a performance improvement gained from upgrading to a 2S2M system only in DLCs. It was
at first theorized that System C-2 was more suited for static maneuvers, but it was later found that System
C-2 has consistently lower activation times and longer waiting times. Because of its ability to detect
impending rollovers correctly and to do so quickly, System C-2 presented stability improvements more for
dynamic maneuvers than for static maneuvers. Although System C-2 does not necessarily show any speed
or steering improvements over System C, this difference in activation time and warning time may yield
significant differences in ride stability as the driver has more time to react. Figures 5-75 and 5-76 only
appreciate RSC brake application, and the efficacy of the two systems can be portrayed in a vastly different
manner if driver feedback were to be included in stabilizing the vehicle before roll.
Through the results from all three studies, it can be shown that System C-2 is the only system that yielded
stability improvements to the test vehicle for all four maneuvers. Meanwhile, it can also be seen that the
42.27
100 100
-5.88
48.35
100
32.69
100
6.080
67.31
105.88
J-Turn RSM SWD DLC
-20
0
20
40
60
80
100
120
Maneuver
Forc
e Im
pro
vem
ent
(%)
System C System C-2 Largest Diff.
Outrigger Contact Improvement for All Maneuvers at OERS+

143
differences between similar systems but from different manufacturers (i.e. Systems A, B, and C) are larger
than those seen among different system models from the same manufacturer (i.e. Systems A-D and C-2).
Figure 5-76. OERS threshold improvements of Systems C and C-2 for all four maneuvers.
0
5
10
15
20
25
0
5
10
15
20
J-Turn RSM DLC SWD
Stee
rin
g Im
pro
vem
ent
(% S
WD
)
Spee
d Im
pro
vem
ents
(%)
Maneuver
OERS Improvements for All ManeuversSystem C System C-2 Largest Diff. raxis
At least 5.6%
At least 5.6%

144
Chapter 6 Conclusions and Recommendations
This chapter discusses the findings of this research and provides conclusions to the three studies and
overall evaluation of RSC systems, as well as recommendations for future testing of RSC systems.
6.1 Conclusions
An evaluation of different RSC systems was conducted at Michelin Laurens Proving Grounds (MLPG) in
Laurens, SC, using an instrumented A-Double in four steering maneuvers: J-turn, Ramp Steer Maneuver
(RSM), Sine with Dwell (SWD), and Double Lane Change (DLC). Improvements in vehicle roll stability were
demonstrated through roll severity reductions quantified by outrigger contact forces. A side-by-side
comparison of trailers with and without RSC systems was performed in two quasi-static and two dynamic
maneuvers. Both the J-turn and DLC tests were steered by a subjective, professional driver, while the
RSM and SWD tests were steered by the steering robot created by the Center for Vehicle Systems and
Safety (CVeSS). The J-turn and RSM were quasi-static maneuvers, and the DLC and SWD were more
dynamic maneuvers, and by implementing different dynamic situations through the tested maneuvers, a
more in-depth look at the performances of RSC systems was possible.
The test vehicle was instrumented with five separate RSC systems which were evaluated in a primary and
two secondary studies in this document: a single channel (2S1M) RSC system comparison, a dolly RSC
significance study, and a single channel and dual channel (2S2M) RSC system comparison. Direct and valid
comparisons were made between the tested systems by evaluating the same variables in repeatable
maneuvers in nearly the same test conditions at the test track. Outrigger contact forces, activation times,
and warning times for the systems were recorded and analyzed for each maneuver. Outrigger contact
forces directly indicated the roll severity of the vehicle, and an estimated contact force threshold of 300
lb was used to distinguish between a tip up and rollover. The activation time, defined as the time between
maneuver initiation and RSC activation, was used as the metric for assessing each RSC system’s ability to
intervene with braking the trailer wheels in order to reduce the likelihood of rollover. The time between
RSC activation and outrigger contact provides the warning time available to the driver for possibly
executing a corrective steering maneuver to counter the roll dynamics. The warning time proved to be a
good measure of RSC effectiveness when the difference in rollover speed or steering threshold between
the systems is small or nonexistant.
Track testing of the 2S1M systems, or systems that applied one brake modulator and therefore applied
brakes throughout each trailer axle, yielded results in a wide range, in terms of performance and

145
measurable RSC benefits. When comparing the three systems, the maximum outrigger contact force
reductions varied by 6.08% for J-turn, 120.64% for RSM, 77.94% for SWD, and 5.58% for DLC . Somewhat
lesser variations were noticed for maximum improvements in rollover speed threshold. The difference in
rollover speed threshold among the three RSC systems were 2.6% for J-turn, 12.5% for RSM, and 0% for
DLCs. A maximum of 20.63% increase in SWD steering amplitude before rollover was found in RSC usage
over baseline, with the maximum difference between the two systems of 11.1 % SWD steering amplitude.
Results from the dolly RSC significance testing showed smaller differences between System A (a 2S1M
system from Manufacturer A) and System A-D (System A with the inclusion of the dolly axle in controlled
brake applications through RSC usage) than those found between Systems A, B (a 2S1M system from
Manufacturer B), and C (a 2S1M system from Manufacturer C), despite hardware changes. The outrigger
contact force data showed that dolly inclusion yielded a 16.98% improvement in RSM, and a 27.11%
improvement in DLC. However, System A provided a 2.5% rollover speed threshold increase over baseline
compared with System A-D at a 0% threshold increase, and posted faster activation times than did System
A-D. These small improvements found in dolly-RSC usage failed to manifest rollover speed or
maneuverability improvements.
The third and last study in which a 2S1M system (System C) was compared to an equivalent 2S2M system
(System C-2) with all four maneuvers yielded mixed results. A comparison of the two systems saw System
C and System C-2 each performing better at one quasi-static and one dynamic maneuver. The rollover
speed and steering threshold improvements provided by the two systems are similar, with System C
slightly outperforming System C-2. System C-2, however, repeatedly activated earlier and provided longer
driver warning times than did System C, and provided more roll stability in maneuvers with high frequency
steering inputs. An initial reasoning behind this result is the splitting of brake application from side to side
with two modulators, reducing calculation effort and thus resulting in faster activation times and longer
warning times.
There appears to be a direct correlation between activation time and warning time, but there is no
relationship between either one and the outrigger contact force. The warning time in our tests does not
include any driver steering feedback, since maintaining the same entry speed and driving path for each
maneuver were the main two intentions of the driver. Any driver steering input, as it may occur in practice,
could alter the performance of the systems. Hence, the RSC performances studied in this project
represent stability improvements solely from controlled brake application.

146
Another important conclusion drawn from testing was that different commercially-available RSC systems
perform differently from maneuver to maneuver, as Systems B and C yielded the largest outrigger contact
improvements in at least one maneuver. The differences are estimated to be due to different algorithms,
control schemes, and brake application specifics among the systems. Evaluating the specific control
approach for each system, however, falls outside the scope of this study. Accordingly, measures such as
the amount of braking, lateral accelerations, and brake timing were not evaluated in this study.
A minimum understeering was experienced with the RSC systems that were tested, and a small trade-off
between maneuverability and earlier activation timing or increased brake contribution (such as from dolly
brakes inclusion) was interpreted from the results. When the tractor was equipped with ESC, an increased
propensity to jackknifing was observed in some of the maneuvers, in the presence of RSC on the trailers.
Since the main goal of this project was to study RSC effectiveness on trailers with no ESC on the tractor,
we did not evaluate any jackknifing effect that the absence of RSC may have for trucks that have an ESC-
equipped tractor.
6.2 Recommendations for Future Testing
Further testing of the roll stability of A-Doubles with trailer-based RSC is needed to optimize the
performance of trailer stability. Several aspects of the testing done in this study could have been enhanced
in hindsight. These include, but are not limited to, the steering robot, GPS units, and the number of tests
and retests.
The steering robot provided repeatable steering inputs, but was not capable of regulating vehicle speed
as are most commercially-available steering robots. Several of the tests completed throughout this study
resulted from maneuver entry speeds that were not as precise as desired. The GPS units were used along
with the driver’s witness of the speedometer, to log vehicle speeds, but due to the large resolution of the
two GPS units installed on the truck, no speed data was considered to be accurate enough. Again, due to
lead time and cost, a steering robot was created by CVeSS and used for this study. A steering robot that
is fully in charge of vehicle speed as well as its steering input, and the added functionality of logging vehicle
speed over time of operation, would be ideal.
To obtain a thorough evaluation of RSC systems for all driving situations, a robot-operated and a driver-
operated version of each maneuver should be conducted. Using both a closed-loop and open-loop
steering system would result in a comprehensive data set both showing repeatable maneuvers as well as
driver feedback, as the latter was not used in evaluating the RSC systems in this study. Driver behavior

147
during warning time could then be analyzed, and the true value of the difference in warning times
between RSC systems could then be determined. Allowing real LCV drivers to test-drive the RSC systems
would also give user feedback regarding how intrusive or useful the RSC systems really are. These opinions
could provide valuable information regarding the tuning of RSC systems.
Future testing of the RSC systems for particular maneuvers could be completed as well, with a more in-
depth study made available by different tunings for the system. As mentioned in Chapter 2, RSC systems
and their control schemes can be tuned for different sensitivities to lateral accelerations, marking rollover
events earlier or later with the trade-off of intrusiveness. With driver/user feedback, an RSC system may
be tuned accordingly for the maneuver a driver is more likely to do, such as for a driver who only drives
on curved highways having RSC tuned for RSMs, for example. A future study into the benefit extremes of
RSC tuning could open new doors for commercially available systems.
Finally, a study regarding the roll stabilities of triple trailer vehicle configurations with RSC, and the efficacy
of commercially available RSC systems on triples can be evaluated in a future study using this study as a
reference. It is recommended that a dolly significance study be completed similarly to the one conducted
in this project, as the number of dollies doubles from doubles to triples, especially if the dollies used are
A-Dollies. Since rearward amplification would play an even larger role in the dynamics of the last trailer in
triples, and an additional trailer and trailer brake axle could distribute more vehicle braking effort to its
trailers, RSC system usage with triples could prove to be more suitable than with doubles.

148
References [1] Bureau of Transportation Statistics, Number of U.S. Aircraft, Vehicles, Vessels, and Other
Conveyances, U.S. Department of Transportation, 2016.
[2] Statista, U.C.B., Revenue of Specialized Long-Distance Freight Trucking in US from 2008 to 2020,
Statista, 2016.
[3] Federal Motor Carrier Safety Administration, Large Truck and Bus Crash Facts 2015, 2017.
[4] McKnight, J., Bahouth, G.T. Analysis of Large Truck Rollover Crashes. Association for the
Advancement of Automotive Medicine, 2008. 52(5): p. 421-426.
[5] Green, S.D. Prevent Heavy Truck Rollover. Traffic Safety (Chicago), 2002. 2(4).
[6] National Highway Traffic Safety Administration, Types of Rollovers.
[7] Dilich, M., Goebelecker, J.M. Truck Rollover. Safety Bulletin, Triodyne Inc, 1997. 6(1).
[8] Winkler, C.B., Ervin, R.D. Rollover of Heavy Commercial Vehicles. 1999, Great Lakes Center for
Truck and Transit Research: Ann Arbor, MI. p. 60.
[9] Winkler, C., Ervin R., Hagan, M. On-board Estimation of the Rollover Threshold of Tractor
Semitrailers. The dynamics of Vehicles on Roads and On Tracks-Supplement to Vehicle System
Dynamics, Volume 33. 2000.
[10] Svenson, A.L., et al. Implementation of Stability Control for Tractor-Trailers Using the National
Advanced Driving Simulator. 21st International Techcnical Conference on the Enhanced Safety of
Vehicles, Stuttgart, Germany. 2009.
[11] Federal Motor Carrier Safety Administration. Commercial Driver Handbook. 2017.
[12] Segel, L., Ervin, R. The Influence of Tire Factors on the Stability of Trucks and Tractor Trailers.
Vehicle System Dynamics, 1981. 10(1): p. 39-59.
[13] National Highway Traffic Safety Administration, Title 49 Code of Federal Regulations (CFR) Part
571 Section 126 Electronic Stability Control Systems. Washington, DC: Office of the Federal
Register, National Archives and Records Administration, 2007.
[14] Federal Highway Administration. Traffic Monitoring Guide. 2014.
[15] Fancher, P.S. A Vehicle Dynamics Handbook for Single-unit and Articulated Heavy Trucks. 1987.
[16] Fancher, P. and C. Winkler, Directional performance issues in evaluation and design of
articulated heavy vehicles. Vehicle System Dynamics, 2007. 45(7-8): p. 607-647.
[17] Independent Trailer & Equipment Co Inc. Converter Dollies. 2006,
http://www.itec-inc.com/dolly/documnts.html.

149
[18] Jakubicek, P. Get Your A B C's Straight. 2014,
http://www.bigtruckguide.com/get-your-a-b-cs-straight.
[19] Liu, P. Analysis, Detection and Early Warning Control of Dynamic Rollover of Heavy Freight
Vehicles, 1999, Concordia University.
[20] Fancher, P., Winkler, C. A Methodology for Measuring Rearward Amplification. International
Technical Conference on the Enhanced Safety of Vehicles. 1992. National Highway Traffic Safety
Administration.
[21] Department of Motor Vehicles - Rhode Island, Combination Vehicles.
[22] Gillespie, T.D. Vehicle Dynamics. 1997.
[23] Winkler, C. Improving the Dynamic Performance of Multitrailer Vehicles: A Study of Innovative
Dollies. Volume I-Technical Report. Final Report. 1986.
[24] Lu, J., Messih, D., Salib, A. Roll Rate Based Stability Control-The Roll Stability Control System.
Proceedings of the 20th Enhanced Safety of Vehicles Conference. 2007.
[25] Li, Y., Meiry, J., Roeseler, W. An Active Roll Mode Suspension System for Ground Vehicles.
JOURNAL OF BASIC ENGINEERING, 1968. 90(2): p. 167-174.
[26] Brown, T.A., Rhode, D.S. Roll Over Stability Control for an Automotive Vehicle. U.S. Patent No.
6,263,261. 17 Jul. 2001.
[27] Dang, J.N. Statistical Analysis of the Effectiveness of Electronic Stability Control (ESC) Systems-
Final Report. 2007.
[28] Murray, D., Shackelford, S., Houser, A. Analysis of Benefits and Costs of Roll Stability Control
Systems for the Trucking Industry. 2009.
[29] Toyota, Toyota Brake Systems - Course 552. 2002.
[30] Korn, A. Safety Benefits of Stability Control Systems for Tractor-Semitrailers. Meritor WABCCO
Vehicle Control Systems.
[31] National Highway Traffic Safety Administration, FMVSS No. 136, Electronic Stability Control
Systems On Heavy Vehicles. 2012, Office of Regulatory Analysis and Evaluation National Center
for Statistics and Analysis.
[32] ATA Industry Technical Council, RSC and ESC Systems for Trucks and Trailers, A.T. Association,
Editor. 2016.
[33] Sampson, D.J.M., Cebon, D. Achievable Roll Stability of Heavy Road Vehicles. Proceedings of the
Institution of Mechanical Engineers, Part D: Journal of Automobile Engineering, 2000. p. 217.

150
[34] Maas, J. Jackknife Stability of a Tractor Semi-Trailer Combination. Mechanical Engineering
Masterproject, Eindhoven, 2007. p. 11.
[35] Hou, Y., Roll and Yaw Stability Evaluation of Class 8 Trucks with Single and Dual Trailers in Low-
and High-Speed Driving Conditions, in Mechanical Engineering. 2017, Virginia Tech: Center for
Vehicle Systems and Safety.
[36] National Highway Traffic Safety Administration, Tractor Semi-Trailer Stability Objective
Performance Test Research - Roll Stability. 2011.
[37] Day, A.J. Braking of Road Vehicles. 2014.
[38] Radlinski, R.W., Braking Performance of Heavy US Vehicles. SAE Technical Paper, 1987.
[39] Radlinski, R.W., Williams, S. NHTSA Heavy Duty Vehicle Brake Research Program-Report No. 5:
Pneumatic Timing. 1985.
[40] Murphy, R.W., Lampert, R., Segel, L. Bus, Truck, Tractor/Trailer Braking System Performance.
1970.
[41] National Highway Traffic Safety Administration, National Highway Traffic Safety Adminitration's
Class 8 Tractor/Trailer Safety Outriggers. 2010.

151
Appendix
A Vehicle Parameters Figure A-1. Vehicle parameters for brake distribution calculations.
Variable ST Parameters AD Parameters
𝑃 91665 (N) 91665 (N)
𝑃𝑡 264311 (N)
𝑃𝑡1 70306 (N)
𝑃𝑡2 70306 (N)
𝑃𝐷 12192 (N)
𝑧 0.6 0.6
𝐿1 3 (m) 3 (m)
𝐿2 2.600 (m) 2.600 (m)
𝐿3 3.622 (m)
𝐿4 3.200 (m)
𝐿5 3.622 (m)
𝐿6 3.200 (m)
𝐿𝐷 .305 (m)
𝐸1 5.600 (m) 5.600 (m)
𝐸2 13.082 (m) 6.822 (m)
𝐸3 6.822 (m)
𝑐1 .178 (m) .178 (m)
𝑐2 .648 (m)
𝑐3 1.994 (m)
𝑐4 -.102 (m)
ℎ1 1.350 (m) 1.350 (m)
ℎ2 1.143 (m) 1.143 (m)
ℎ3 2.460 (m) 2.410 (m)
ℎ4 .889 (m)
ℎ5 1.143 (m)
ℎ6 2.410 (m)
ℎ𝐷 .699 (m)

152
B NI CompactRIO The National Instrument (NI) CompactRIO platform, or simply cRIO, is a user-programmable FPGA that
implements a standalone CPU and configurable IO modules. The cRIO-9024 has an 800 MHz CPU, 512 MB
DRAM, and 4 GB storage controller that allows real-time monitoring applications, and is therefore perfect
as a data acquisition system for this project. There are four module slots available in the cRIO-9024 chassis,
but only two are used: two NI-9205 (analog output, or AO) modules.
The cRIO was used to log data from all of the AO sensors via DB-37 pin outs that are available for each
junction box. Two separate DB-37 cables were used, one per NI-9205 module and therefore one for each
trailer. Male-to-female DB-37 cables were used since the breakout boards in each junction box were
female, and the NI-9205 modules were male. Each of the breakout boards in JBA and JBB use different pin
outs, and are shown in Tables B-1 and B-2. As mentioned before, the junction boxes were designed for
easy modifications, so the wires from the connector ports installed in the box all used the same wirings.
In this way, any sensor could be used with any port, as long as the port’s wires were pinned accordingly.
These port wires are referred to in the last column of Tables B-1 and B-2.
Table B-1. Pin out table for JBA in Trailer A.
Pin # (Channel) Sensor Label TDMS # Paired with Wire (Color)
1 (AI0) Load cell #3 (Jerry Dri.) LC-Jry-L 18 Pin #20 Output + (Blue)
2 (AI1) Load cell #4 (Jerry Pass.) LC-Jry-R 19 Pin #21 Output + (Blue)
3 (AI2) Single-axis accel. on Jerry A1-Jry 20 Pin #22
4 (AI3) Pin #23
5 (AI4) Pin #24
6 (AI5) Pin #25
7 (AI6) Pressure sensor #4 P-L 1 - Output (Blue)
8 (AI7) -
9 (DO0) -
10 (COM) - Ground (Black)
11 (AI16) LED flag 12 -
12 (AI17) Pressure sensor #5 P-R 2 - Output (Blue)
13 (AI18) String pot. #5 SP-L 3 - Output (Blue)
14 (AI19) String pot. 40 SP-40 4 -
15 (AI20) TOF Jerryy Dri. 16 -

153
16 (AI21) TOF Jerry Pas. 17 -
17 (AI22) -
18 (AI23) String pot. #6 SP-R 5 - Output (Blue)
19 (AISENSE) - Ground (Black)
20 (AI8) Load cell #3 (Jerry Dri.) Pin #1 Output - (Green)
21 (AI9) Load cell #4 (Jerry Pass.) Pin #2 Output - (Green)
22 (AI10) Single-axis accel. on Jerry A1-Jry Pin #3
23 (AI11) Pin #4
24 (AI12) Pin #5
25 (AI13) Pin #6
26 (AI14) 3-g accel. #1 - Frame - X A3-1 6 - Output (Green)
27 (AI15) 3-g accel. #1 - Frame - Y A3-1 7 - Output (Blue)
28 (PFIO) -
29 (COM) - Ground (Black)
30 (AI24) RSC Relay Dri. 8 - Output (Purple)
31 (AI25) Ground 13 -
32 (AI26) RSC Relay Pas. 14 -
33 (AI27) RSC Pres. Dri. 15 -
34 (AI28) -
35 (AI29) 50-g accel. #2 - Jerry – X A50-2 9 - Output (Green)
36 (AI30) 50-g accel. #2 - Jerry – Y A50-2 10 - Output (Blue)
37 (AI31) RSC Pres. Pas. A50-2 11 - Output (Purple)
Table B-2. Pin out table for JBB in Trailer B.
Pin # (Channel) Sensor Label TDMS # Paired with Wire (Color)
1 (AI0) Laser sensor #1 (Tom Dri.) L-L 21 Pin #20 Output + (Blue)
2 (AI1) Laser sensor #2 (Tom Pass.) L-R 22 Pin #21 Output + (Blue)
3 (AI2) Load cell #1 LC-L 23 Pin #22 Output + (Orange)
4 (AI3) Load cell #2 LC-R 24 Pin #23 Output + (Orange)
5 (AI4) 25 Pin #24
6 (AI5) 26 Pin #25
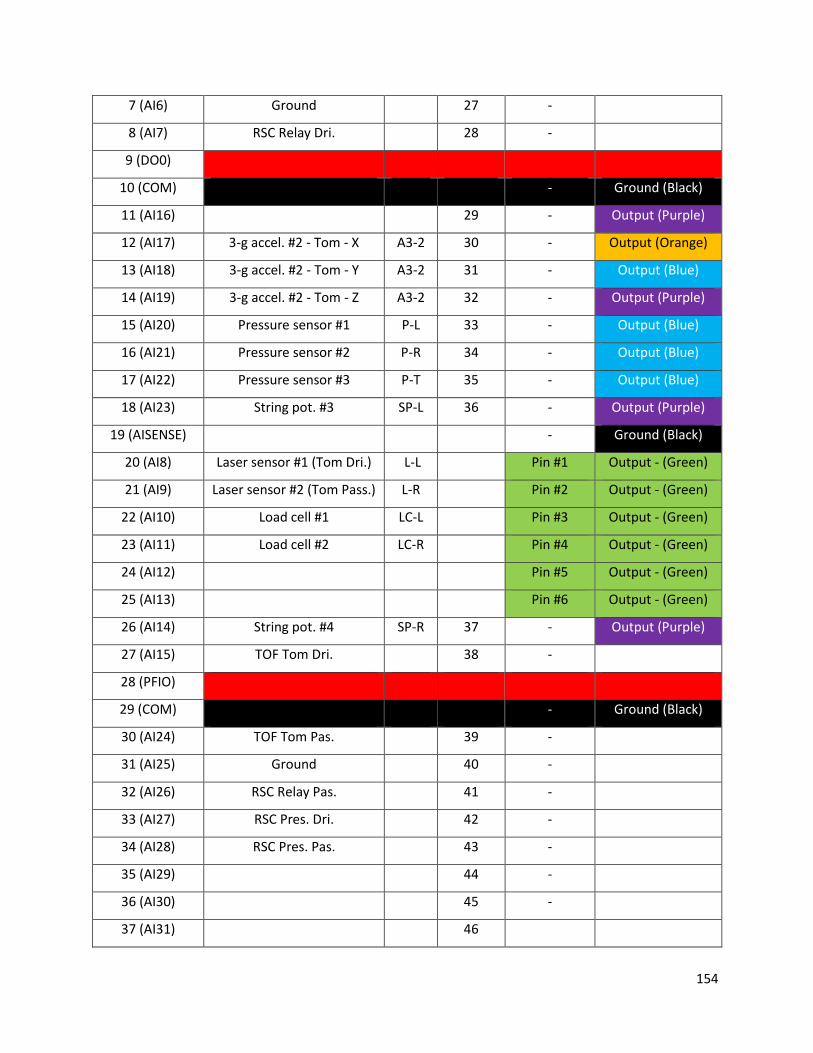
154
7 (AI6) Ground 27 -
8 (AI7) RSC Relay Dri. 28 -
9 (DO0)
10 (COM) - Ground (Black)
11 (AI16) 29 - Output (Purple)
12 (AI17) 3-g accel. #2 - Tom - X A3-2 30 - Output (Orange)
13 (AI18) 3-g accel. #2 - Tom - Y A3-2 31 - Output (Blue)
14 (AI19) 3-g accel. #2 - Tom - Z A3-2 32 - Output (Purple)
15 (AI20) Pressure sensor #1 P-L 33 - Output (Blue)
16 (AI21) Pressure sensor #2 P-R 34 - Output (Blue)
17 (AI22) Pressure sensor #3 P-T 35 - Output (Blue)
18 (AI23) String pot. #3 SP-L 36 - Output (Purple)
19 (AISENSE) - Ground (Black)
20 (AI8) Laser sensor #1 (Tom Dri.) L-L Pin #1 Output - (Green)
21 (AI9) Laser sensor #2 (Tom Pass.) L-R Pin #2 Output - (Green)
22 (AI10) Load cell #1 LC-L Pin #3 Output - (Green)
23 (AI11) Load cell #2 LC-R Pin #4 Output - (Green)
24 (AI12) Pin #5 Output - (Green)
25 (AI13) Pin #6 Output - (Green)
26 (AI14) String pot. #4 SP-R 37 - Output (Purple)
27 (AI15) TOF Tom Dri. 38 -
28 (PFIO) -
29 (COM) - Ground (Black)
30 (AI24) TOF Tom Pas. 39 -
31 (AI25) Ground 40 -
32 (AI26) RSC Relay Pas. 41 -
33 (AI27) RSC Pres. Dri. 42 -
34 (AI28) RSC Pres. Pas. 43 -
35 (AI29) 44 -
36 (AI30) 45 -
37 (AI31) 46

155
The CompactRIO is used with NI LabVIEW software; the data gathered by these NI 9205 modules are sent
to the PC via an Ethernet cord in order to use the modules directly from LabVIEW Real-Time. LabVIEW is
an engineering software for test, measurement, and control applications, and is specifically geared
towards acquiring data with hardware. Its main feature is the ability to create custom GUIs quite easily.
Although the cRIO implements its own 4 GB hard drive that logs and stores collected data, using it with NI
LabVIEW Real-Time allowed the team to monitor each sensor in real-time for an extended period of time.
The LabVIEW Real-Time Module was a separate module purchased in order to extend LabVIEW’s graphical
environment to stand-alone embedded systems such as the cRIO. As an add-on to LabVIEW’s
development capabilities, the module acquired IO from the modules used and communicated with the PC
to develop graphical applications to monitor both analog and digital data. This granted the team
numerous benefits, most notably the ability to determine whether each test trial was successful, and to
troubleshoot and check sensors before, during, and after testing. Live diagnostics turned out to be
absolutely crucial when working with such a large vehicle and extensive system of sensors, especially
when there was limited time for testing every week at the test track. LabVIEW also made the data transfer
from the cRIO hard drive to the PC hard drive for post processing a quick and clean method.