Embed Size (px)
Citation preview

University of Plymouth
PEARL https://pearl.plymouth.ac.uk
Faculty of Science and Engineering School of Engineering, Computing and Mathematics
2017-07-01
Experimental evaluation of CTOD in
constant amplitude fatigue crack growth
from crack tip displacement fields
Vasco-Olmo, JM
http://hdl.handle.net/10026.1/10506
10.3221/IGF-ESIS.41.22
Frattura ed Integrita Strutturale
Gruppo Italiano Frattura
All content in PEARL is protected by copyright law. Author manuscripts are made available in accordance with
publisher policies. Please cite only the published version using the details provided on the item record or
document. In the absence of an open licence (e.g. Creative Commons), permissions for further reuse of content
should be sought from the publisher or author.

J.M. Vasco-Olmo et alii, Frattura ed Integrità Strutturale, 41 (2017) 157-165; DOI: 10.3221/IGF-ESIS.41.22
157
Focused on Crack Tip Fields
Experimental evaluation of CTOD in constant amplitude fatigue crack growth from crack tip displacement fields J.M. Vasco-Olmo, F.A. Díaz University of Jaén, Spain [email protected] [email protected] F.V. Antunes University of Coimbra, Portugal [email protected] M.N. James University of Plymouth, UK [email protected] ABSTRACT. In the current work an experimental study of the crack tip opening displacement (CTOD) is performed to evaluate the ability of this parameter to characterise fatigue crack growth. A methodology is developed to measure and to analyse the CTOD from experimental data. The vertical displacements measured by implementing Digital Image Correlation on growing fatigue cracks are used to measure the CTOD. Fatigue tests at R ratios of 0.1 and 0.6 were conducted on compact-tension specimens manufactured from commercially pure titanium. A sensitivity analysis was performed to explore the effect of the position selected behind the crack tip for the CTOD measurement. The analysis of a full loading cycle allowed identifying the elastic and plastic components of the CTOD. The plastic CTOD was found to be directly related to the plastic deformation at the crack tip. Moreover, a linear relationship between da/dN and the plastic CTOD for both tests was observed. Results show that the CTOD can be used as a viable alternative to ΔK in characterising fatigue crack propagation because the parameter considers fatigue threshold and crack shielding in an intrinsic way. This work is intended to contribute to a better understanding of the different mechanisms driving fatigue crack growth and the address the outstanding controversy associated with plasticity-induced fatigue crack closure. KEYWORDS. Crack tip opening displacement; Fatigue crack growth; Plastic deformation; DIC.
Citation: Vasco-Olmo, J.M., Díaz, F.A., Antunes, F.V., James, M.N., Experimental evaluation of CTOD in constant amplitude fatigue crack growth from crack tip displacement fields, Frattura ed Integrità Strutturale, 41 (2017) 157-165. Received: 28.02.2017 Accepted: 15.04.2017 Published: 01.07.2017 Copyright: © 2017 This is an open access article under the terms of the CC-BY 4.0, which permits unrestricted use, distribution, and reproduction in any medium, provided the original author and source are credited.

J.M. Vasco-Olmo et alii, Frattura ed Integrità Strutturale, 41 (2017) 157-165; DOI: 10.3221/IGF-ESIS.41.22
158
INTRODUCTION
atigue crack growth has been traditionally characterised by the Paris law [1], that relates the crack growth per cycle, da/dN to the stress intensity factor range, ΔK. However, there are several controversial issues and unanswered questions in this field. The procedures for analysing constant amplitude fatigue under small-scale yielding
conditions are well established, although a number of uncertainties remain. Variable amplitude loading, large-scale plasticity, and short cracks introduce additional complications that are not fully understood. In addition, in many materials, it is virtually impossible to characterise the fracture behaviour with lineal elastic fracture mechanics (LEFM), and an alternative fracture mechanics model is required. Elastic-plastic fracture mechanics (EPFM) is applied to materials that exhibit nonlinear behaviour (i.e., plastic deformation). Hence in the authors’ view, the linear elastic ΔK parameter should be replaced by nonlinear crack tip parameter since fatigue crack growth is governed by nonlinear processes at the crack tip. Two elastic-plastic parameters have been proposed to be related with crack tip plastic deformation, the crack tip opening displacement (CTOD) and the J contour integral. Both parameters describe crack tip conditions in elastic-plastic materials, and they can be used as a fracture criterion. CTOD is a local parameter, while the J integral is used as a global criterion based on the quasi-strain energy release rate. Critical values of CTOD or J give nearly size-independent measurements of fracture toughness, even for relatively large amounts of crack tip plasticity. There are limits to the applicability of these parameters but they are much less restrictive than the validity requirements of LEFM. In this work, CTOD is the parameter used to characterise fatigue crack growth. CTOD was first observed by Wells [2] when he was attempting to measure KIC values in a number of structural steel. Wells found that these materials were too tough to be characterised by LEFM. While examining fractured test specimens, Wells noticed that the crack faces had moved apart prior to fracture; plastic deformation had blunted an initially sharp crack, resulting in a finite displacement at the crack tip. The degree of crack blunting increased in proportion to the toughness of the material. This observation led Wells to propose the opening at the crack tip as a measurement of fracture toughness. Nowadays, CTOD is a classical parameter in elastic-plastic fracture mechanics and it has a high importance for fatigue analysis. Crack tip blunting at maximum load and the crack tip re-sharpening at minimum load were used to explain fatigue crack growth [3]. CTOD has been experimentally measured using extensometers located remotely to the crack tip. Thus, in compact tension (CT) specimens an extensometer with blades is located at the mouth of the specimen notch to measure the opening of the specimen [4]. In the case of middle tension (MT) specimens a pin extensometer is placed at the centre of the specimen by fixing it into two small holes [5]. Recently, full field optical techniques have become very popular for the analysis of structural integrity problems. Among them Digital Image Correlation (DIC) technique can be considered because the displacement fields at the vicinity of the crack tip can be measured with high level of accuracy [6]. Thus, in this work DIC is implemented to measure the CTOD from the relative displacement between both crack flanks. Moreover, a finite element analysis has also been employed to measure the CTOD numerically. The displacement at the first node behind the crack tip is generally used as an operational CTOD [7].
Figure 1: (a) Dimensions (mm) of the CT specimen tested. (b) Experimental set-up used to measure DIC data during fatigue testing. In previous work, Antunes et al. [8] developed a numerical study to quantify the CTOD in a MT specimen for two aluminium alloys in order to analyse the applicability of this parameter to characterise fatigue crack growth. A relationship was found between da/dN and the plastic CTOD range for the 6082-T6 aluminium alloy independent of stress ratio, showing that the CTOD can be a viable alternative to ΔK in the analysis of fatigue crack propagation. Thus, in the current
F
(b) (a)
J.M. Vasco-Olmo et alii, Frattura ed Integrità Strutturale, 41 (2017) 157-165; DOI: 10.3221/IGF-ESIS.41.22
159
work an experimental study of the CTOD is performed by implementing the procedure developed by Antunes et al. [8] to evaluate the ability of this parameter to characterise fatigue crack growth. Note that the values of ΔCTODp reported in [8] are relatively small, lower than 1 μm, which is certainly a challenge for the experimental determination of plastic CTOD since some controversy exists about if DIC is able to provide extremely high spatial resolution characterisation of crack tip deformation fields, including crack opening profiles [9]. The vertical displacements measured by DIC on growing fatigue cracks are used to measure the CTOD as the relative displacement existing between the crack flanks. Two fatigue tests at stress ratios of 0.1 and 0.6 were conducted on titanium CT specimens. From the analysis of a full loading cycle, the elastic and plastic CTOD could be identified. A linear relationship between da/dN and the plastic CTOD was found for both tests, showing therefore that the CTOD can be used as a viable alternative in characterising fatigue crack growth. With this work, the authors intend to contribute to a better understanding of the different mechanisms driving fatigue crack propagation and to address the outstanding controversy associated with plasticity-induced fatigue crack closure. EXPERIMENTAL WORK
or the experimental analysis of the CTOD, two commercially pure titanium CT specimens (Fig. 1a) with a thickness of 1 mm were tested at constant amplitude fatigue loading. Fatigue tests were conducted at two different stress ratios (0.1 and 0.6) applying 750 N as maximum load level.
For the correct implementation of DIC, one of the faces of the specimens was prepared by spraying a black speckle over a white background. In addition, the other face of the specimens was polished to assist in tracking the crack tip. Fatigue tests were conducted on an ElectroPuls E3000 electromechanical testing machine at a frequency of 10 Hz (Fig. 1b). A CCD camera fitted with a macro zoom lens to increase the spatial resolution at the region around the crack tip was placed perpendicular to each face of the specimen. During fatigue tests, the loading cycle was periodically paused to allow the acquisition of a sequence of images at uniform increments through a complete loading and unloading cycle. The CCD camera viewing the speckled face of the specimen was set up so that the field of view was 17.3 x 13 mm (resolution of 13.5 μm/pixel) with the crack path located at the centre of the image. Illumination of the surface was provided by a fibre optic ring placed around the zoom lens (shown in Fig. 1b). EXPERIMENTAL METHODOLOGY
n this section, the methodology developed to measure the CTOD from experimental data is described. CTOD is a parameter that measures the opening at the crack tip. Therefore, the vertical displacements obtained from experiments can be used for its measurement. In this work, DIC is used to measure the crack tip displacement fields.
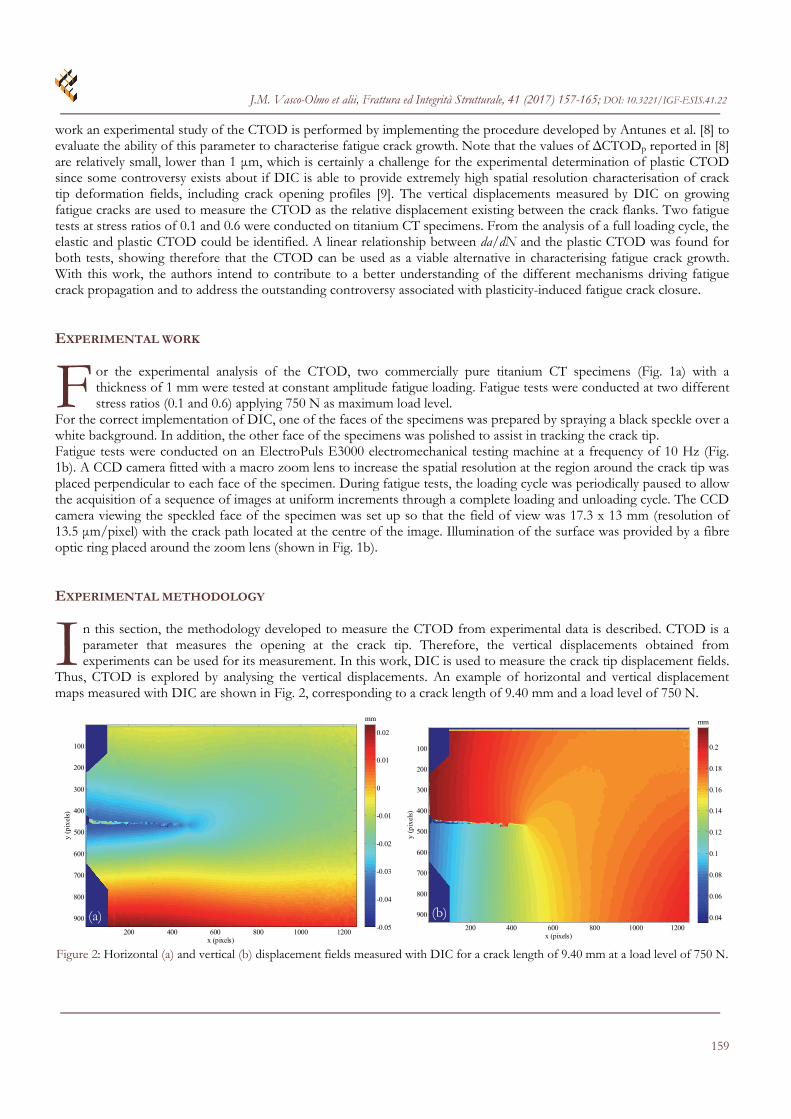
Thus, CTOD is explored by analysing the vertical displacements. An example of horizontal and vertical displacement maps measured with DIC are shown in Fig. 2, corresponding to a crack length of 9.40 mm and a load level of 750 N.
Figure 2: Horizontal (a) and vertical (b) displacement fields measured with DIC for a crack length of 9.40 mm at a load level of 750 N.
x (pixels)
y (p
ixel
s)
mm
200 400 600 800 1000 1200
100
200
300
400
500
600
700
800
900-0.05
-0.04
-0.03
-0.02
-0.01
0
0.01
0.02
x (pixels)
y (p
ixel
s)
mm
200 400 600 800 1000 1200
100
200
300
400
500
600
700
800
900 0.04
0.06
0.08
0.1
0.12
0.14
0.16
0.18
0.2
F
I
(a) (b)

J.M. Vasco-Olmo et alii, Frattura ed Integrità Strutturale, 41 (2017) 157-165; DOI: 10.3221/IGF-ESIS.41.22
160
CTOD is obtained by measuring the relative displacement between the crack flanks selecting a pair of points behind the crack tip. Therefore, a relevant factor is the crack tip location. First, the y-coordinate of the crack tip is determined by plotting perpendicular profiles to the crack direction employing the vertical displacement map since a change in the displacement values is observed when the profiles go through the crack wake. Fig. 3a shows as the different plotted profiles around the crack tip intersect in one point which indicates the location of the crack tip in the y-direction. The corresponding displacement value for this point is used to determine the x-coordinate of the crack tip. Once the y-coordinate of the crack tip is known, a parallel profile to the crack direction corresponding to the y-coordinate previously obtained is plotted. The x-coordinate of the crack tip is obtained from the point of the profile which presents the same displacement value than that previously known from the y-coordinate. Thus, a horizontal profile corresponding to this displacement value is plotted, establishing the x-coordinate as the intersection point between both lines as shown in Fig. 3b. According to this procedure, the crack tip was located at the point with coordinates x = 470 pixels and y = 468 pixels (x = 6.49 mm and y = 6.41 mm), being the coordinates origin the upper left corner of the image.
Figure 3: Methodology for locating the crack tip: (a) y-coordinate and (b) x-coordinate. Once the location of the crack tip has been established, the experimental CTOD is obtained by defining the measurement point behind the crack tip. Thus, CTOD as a function of load for a complete loading cycle is evaluated by analysing both the loading and unloading branches. In this way, the portion of the cycle at which the crack is closed and open can be
(a)
(b)

J.M. Vasco-Olmo et alii, Frattura ed Integrità Strutturale, 41 (2017) 157-165; DOI: 10.3221/IGF-ESIS.41.22
161
evaluated. In addition, from the analysis of the portion at which the crack is open, the elastic and plastic components of the CTOD can be estimated from the slope variation observed in the CTOD versus load curves. EFFECT OF THE POSITION BEHIND THE CRACK TIP
n this section a sensitivity analysis is performed to explore the effect of the position selected behind the crack tip for measuring the CTOD. Two parameters are related with the selection of the pairs of points behind the crack tip, the directions along and perpendicular to the crack. As Fig. 4 shows, the direction along the crack is referenced as L1,
while L2 is used for the perpendicular direction.
Figure 4: Magnification of the region around the crack tip showing a pair or points behind the crack tip employed for the CTOD measurement. This analysis is made by measuring the CTOD at the maximum load as a function of one of the parameters, maintaining constant the other parameter. In Fig. 5a CTOD for different L2 distances has been plotted as a function of L1 distance. It can be observed that CTOD is higher as the measurement points are moving away the crack tip. This increase in the CTOD values along the crack is bigger as the measurement points are located at longer L2 distances. Moreover, it is observed that for a same L1 value, CTOD is gradually increasing until reaching a stable value from a value of L2 = 136.9 μm (10 pixels). This last observation can be more easily analysable if CTOD for different L1 locations along the crack is represented as a function of the perpendicular distance L2 to the crack direction. Thus, in Fig. 5b is clearly observed as, for a same L1 location, CTOD gradually increases until reaching a stable value at the L2 distance indicated above.
Figure 5: Graphs showing the effect of the location of the measurement point. (a) CTOD as a function of the distance along the crack direction L1; (b) CTOD as a function of the distance at the perpendicular direction L2 to the crack.
x (pixels)
y (p
ixel
s)
mm
200 400 600 800 1000 1200
100
200
300
400
500
600
700
800
900 0.04
0.06
0.08
0.1
0.12
0.14
0.16
0.18
0.2
L1L2
L2
L1L2
L2
I
(a) (b)

J.M. Vasco-Olmo et alii, Frattura ed Integrità Strutturale, 41 (2017) 157-165; DOI: 10.3221/IGF-ESIS.41.22
162
According to this analysis, it can be established that the CTOD value depends significantly of the location of the pair or points selected behind the crack tip along the crack direction. However, the effect of the perpendicular distance to the crack direction is not so restrictive since it has been observed that from 10 pixels (136.9 μm) a stable value of CTOD is obtained. This established conclusion is validated by plotting the CTOD versus load curves along a full loading cycle for different L1 and L2 values. Fig. 6a shows different plots of CTOD versus load along a full loading cycle for different L1 values using a value of 10 pixels (136.8 μm) for L2. In a similar way, Fig. 6b shows different plots of CTOD versus load for different L2 values employing a value of 5 pixels (for L1). The CTOD values are higher as the distances L1 and L2 increase. In addition, the wide of the loops defined by the elastic portions of the loading and unloading branches increases with L1 and L2, being more clearly observable in the case of a L2 increase (Fig. 6b). In addition, in Fig. 6b it is observed that the wide of the loops is practically inappreciable for L2 values of 10 and 15 pixels (136.8 and 205.3 μm).
Figure 6: Plots of CTOD versus load along a full loading cycle: (a) for different L1 values employing a value of 10 pixels (136.8 μm) for L2 and (b) for different L2 values employing a value for L1 of 5 pixels (68.4 μm). Thus, L2 distance used to measure the CTOD will be 10 pixels (136.8 μm). However, the selection of the L1 distance is not so clear. All results shown forwards are obtained using a L1 distance of 5 pixels (68.4 μm). EXPERIMENTAL RESULTS
nce the effect of the measurement point location has been studied, CTOD along a full loading cycle is measured. Fig. 7 shows a typical plot of CTOD versus load for the same crack length above analysed (a = 9.40 mm), where the separation existing between every data-point corresponds with a load level of 25 N. From the
analysis of the loading and unloading branches, different portions can be identified. Crack remains closed between points A and B. This portion presents a slight slope since DIC detects very small displacements due to the sensitivity of the technique. In addition, other aspect that must be added is that crack closure is a gradual process at which crack does not change suddenly from fully closed to fully open (as can be observed numerically), and therefore it can be detected experimentally. From point B there is a slope change in the trend followed by the data-points, increasing linearly until reaching point C. From point C there is a change in the linearity until reaching the maximum applied load which is attributed to the plastic deformation. Both elastic and plastic components of CTOD can be estimated by extrapolating the linear regime to the maximum load. During unloading, there is a linear decrease between points D and E with the same slope than that obtained for the elastic regime in the loading branch. Then, again there is a change in the linearity due to reversed plastic deformation, where the crack closes again. The same procedure indicated for the loading branch can be used to estimate the elastic and plastic components of CTOD. In Fig. 7 it is shown how the range for each component of the CTOD is obtained. Thus, during loading the elastic and plastic ranges of the CTOD obtained were 10.23 μm and 4.71 μm, respectively. On the other hand, during unloading the values for the ranges of the elastic and plastic components were 10.42 μm and 4.52 μm, respectively. The values for the plastic component correspond to a percentage regarding to the total CTOD of 31.5 % and 30.3 % for the loading and unloading branches, respectively.
O
(a) (b)

J.M. Vasco-Olmo et alii, Frattura ed Integrità Strutturale, 41 (2017) 157-165; DOI: 10.3221/IGF-ESIS.41.22
163
Figure 7: Plot of CTOD along a full loading cycle indicating its elastic and plastic components at a crack length of 9.40 mm using a L1 value of 5 pixels and a L2 value of 10 pixels. Then, the above methodology to obtain the CTOD range for the elastic and plastic components is applied along the crack length. Fig. 8a shows the elastic and plastic CTOD ranges as a function of the crack length. A scatter is observed for the elastic component values, while the values for the plastic component show a gradual increase with the crack length. This last shows that the plastic component of the CTOD can be linked to the plastic deformation generated along the crack propagation. It is interesting to note that a very similar trend for the plastic component values has been obtained independent to the stress ratio. It can be due to the fact that the same maximum load value was used to conduct both tests. Moreover, in order to remove the scatter obtained for the elastic component, the percentage represented for each component with respect to the total CTOD has been plotted in Fig. 8b. A realignment is clearly observed for the elastic CTOD values, decreasing gradually with the crack length. This is an expected result since it is an opposite behaviour to that shown by the plastic component.
Figure 8: (a) Elastic and plastic CTOD ranges as a function of the crack length for both tests. (b) Percentage of the elastic and plastic CTOD ranges along the crack length for both tests.
According to the above results, only the plastic component of the CTOD is relevant to characterise fatigue crack growth. Fig. 9 shows the da/dN versus ΔCTODp curves obtained for both tests. A different linear relationship has been obtained for each test, being the slope corresponding to the test conducted at low stress ratio higher. This is a logical result since
(a) (b)

J.M. Vasco-Olmo et alii, Frattura ed Integrità Strutturale, 41 (2017) 157-165; DOI: 10.3221/IGF-ESIS.41.22
164
fatigue crack growth rate in the specimen tested at low R-ratio was bigger. Results show that the plastic component of CTOD can be directly related to the plastic deformation at the crack tip during crack propagation. Therefore, CTOD can be used to characterise fatigue crack growth since this parameter considers fatigue threshold and crack shielding in an intrinsic way.
Figure 9: Crack growth per cycle (da/dN) versus plastic CTOD range (ΔCTODp) for both tests.
In the current work it has been observed that plastic CTOD depends on the maximum applied load in the fatigue cycle, independently of the stress ratio. Therefore, as future work could be to conduct a test at high stress ratio with the same fatigue loading range than that defined in the test at low R-ratio in order to check if a linear relationship with similar slope is obtained. In this way, an only expression would be achieved that would allow to characterise fatigue crack propagation for the analysed material independent of the stress ratio as it was concluded by Antunes et al. [8] in their numerical study. CONCLUSIONS
n experimental evaluation of the CTOD has been performed to analyse the ability of this parameter to characterise fatigue crack growth. CTOD has been measured from the vertical displacements obtained on growing fatigue cracks by implementing DIC, demonstrating that this optical technique is able to provide
extremely high spatial resolution characterisation of crack tip fields. Two titanium CT specimens were tested at different stress ratios (0.6 and 0.1). From a sensitivity analysis it has been established that the CTOD value depends significantly from the location along the crack direction of the pair of points selected behind the crack tip. However, the effect of the perpendicular distance to the crack direction is not so restrictive. Elastic and plastic components of the CTOD were identified from the analysis of a full loading cycle. The plastic CTOD was found to be directly related to the plastic deformation at the crack tip. A different linear relationship between crack growth per cycle and the plastic CTOD range was obtained for each test, where a higher slope was obtained for the test at low R-ratio. Results show that the CTOD can be used as a viable alternative to stress intensity factor range in characterising fatigue crack growth because CTOD considers fatigue threshold and crack shielding in an intrinsic way. The authors have intended to contribute to a better understanding of the different mechanisms driving fatigue crack propagation and to address the outstanding controversy associated with plasticity-induced fatigue crack closure. Further work must be made to understand the effect of stress ratio when the applied loading cycle is the same.
A

J.M. Vasco-Olmo et alii, Frattura ed Integrità Strutturale, 41 (2017) 157-165; DOI: 10.3221/IGF-ESIS.41.22
165
ACKNOWLEDGEMENTS
his work has been performed thank to the financial support from ‘Gobierno de España’ through the research project ‘Proyecto de Investigación de Excelencia del Ministerio de Economía y Competitividad MAT2016-76951-C2-1-P’.
REFERENCES [1] Paris, P.C., A critical analysis of crack propagation laws, J. Basic Eng., 85 (1960), 528–534. [2] Wells, A.A., Unstable crack propagation in metals. Cleavage and fast fracture, Proceedings of the Crack Propagation
Symposium, 1, Paper 84, Cranfield, UK (1961). [3] Laird, C., Smith, G.C., Crack propagation in high stress fatigue, Philos. Mag. 8 (1962) 847–857. [4] Vasco-Olmo, J.M., Díaz, F.A., García-Collado, A., Dorado, R., Experimental evaluation of crack shielding during
fatigue crack growth using digital image correlation, Fatigue Fract. Engng Mater. Struct., 38 (2013) 223–237. [5] Antunes, F.V., Branco, R., Costa, J.D., Rodrigues, D.M., Plasticity induced crack closure in middle-tension specimen:
numerical versus experimental, Fatigue Fract. Engng Mater. Struct. 33 (2010) 673–686. [6] Chu, T.C., Ranson, W.F., Sutton, M.A., Peters, W.H., Applications of digital-image correlation technique to
experimental mechanics, Exp. Mech., 25 (1985) 232–244. [7] De Matos, P.F.P., Nowell, D., On the accurate assessment of crack opening and closing stresses in plasticity-induced
fatigue crack closure problems, Eng. Fract. Mech., 74 (2007) 1579–1601. [8] Antunes, F.V., Rodrigues, S.M., Camas, D., A numerical analysis of CTOD in constant amplitude fatigue crack
growth, Theoretical and Applied Fracture Mechanics, 85 (2016) 45–55. [9] Korsunsky, A.M., Song, X., Belnoue, J., Jun, T., Hofmann, F., De Matos, P.F.P., Nowell, D., Dini, D., Aparicio-
Blanco, O., Walsh, M.J., Crack tip deformation fields and fatigue crack growth rates in Ti-6Al-4V, Int. J. Fatigue, 31 (2009) 1771–1779.
T