Embed Size (px)
Citation preview

Experimental Design Modelling and Optimization ofTriazine Herbicides Removal With ReducedGraphene Oxide Using Response Surface MethodMartina Foschi
University of L'Aquila Department of Physical and Chemical Sciences: Universita degli Studi dell'AquilaDipartimento di Scienze Fisiche e ChimichePaola Capasso
University of L'Aquila Department of Physical and Chemical Sciences: Universita degli Studi dell'AquilaDipartimento di Scienze Fisiche e ChimicheMaria Anna Maggi
Hortus Novus srlFabrizio Ruggieri
University of L'Aquila Department of Physical and Chemical Sciences: Universita degli Studi dell'AquilaDipartimento di Scienze Fisiche e ChimicheGiulia Fioravanti ( giulia.�[email protected] )
University of L'Aquila Department of Physical and Chemical Sciences: Universita degli Studi dell'AquilaDipartimento di Scienze Fisiche e Chimiche https://orcid.org/0000-0002-8653-9925
Research Article
Keywords: reduced graphene oxide, thermal mild reduction, response surface methodology, triazinesremoval, Freundlich isotherm.
Posted Date: February 9th, 2021
DOI: https://doi.org/10.21203/rs.3.rs-165892/v1
License: This work is licensed under a Creative Commons Attribution 4.0 International License. Read Full License

1
Title: Experimental design modelling and optimization of triazine herbicides removal with reduced graphene 1
oxide using response surface method 2
3
4
Authors: Martina Foschia, Paola Capassoa, Maria Anna Maggib, Fabrizio Ruggieria and Giulia Fioravantia* 5
a) University of L’Aquila, Department of Physical and Chemical Sciences, Via Vetoio, Coppito, L'Aquila (AQ) 67100, 6
Italy. 7
b) Hortus Novus, Via Aldo Moro 28 D, L'Aquila (AQ), 67100, Italy 8
9
*Corresponding authors 10
E-mail: [email protected] 11
Department of Physical and Chemical Sciences 12
University of L’Aquila 13
Via Vetoio – 67100 L’Aquila (AQ) – Italy 14
Tel. +39-0862-434244 15
16
17
18
19
20
21
22
23
24
25
26
27
28
29
30
31
32
33
34
35
36
37
38
39
40
41

2
Highlights 42
Thermally reduced GO films enhance the removal of triazines from water. 43
Optimisation of the adsorbent by DOE coupled with the response surface methodology. 44
Atrazine maximum adsorption capacity of rGO treated at 110°C for 24h was 46%. 45
Freundlich and Langmuir models were applied to the triazines adsorption on rGO films. 46
Maximum adsorption capacity: 4.4, 19.4 and 18.4 mg/g for Atraton, Atrazine and Prometryn. 47
48
49
50
51
52
53
54
55
56
57
58
59
60
61
62
63
64
65
66
67
68
69
70
71
72
73
74
75
76
77
78
79
80
81
82

3
Abstract 83
84 In this work, triazines were chosen as the organic micropollutants model, to develop a useful method for the removal of 85
triazine products, using a reduced derivative of graphene oxide as adsorbent material. The pristine graphene oxide and its 86
thermally reduced derivatives under mild conditions were tested, optimizing the GO reduction conditions by means of 87
DOE coupled with the response surface methodology. For the reduction it was decided to choose the mildest and simplest 88
conditions possible, using an air heat treatment in a common laboratory oven. The optimal reduction conditions deduced 89
from the response surface were calculated at a reduction temperature of 110 °C maintained for 24 hours and rGO sample 90
was employed in the adsorption of the triazines. All the adsorbent materials have been characterized before use, by 91
Scanning Electron Microscopy (SEM), X-ray diffraction (XRD), Fourier Transform Infrared Spectroscopy (FTIR), X-92
ray photoelectron spectroscopy (XPS) and Brunauer-Emmett- Teller (BET) surface area analysis. Triazine analyses were 93
performed by HPLC. The data obtained from the adsorption isotherms have been fitted with the Langmuir and Freundlich 94
models, and the Freundlich model was the best one, especially for the Atraton and the Prometryn. The maximum 95
adsorption capacity obtained was 4.4 mg/g for Atrazine, 19.4 mg/g for Atraton and 18.4 mg/g for Prometryn, at room 96
temperature. 97
98
99
100
101
102
Keywords 103
reduced graphene oxide; 104
thermal mild reduction; 105
response surface methodology; 106
triazines removal; 107
Freundlich isotherm. 108
109
110

4
1 Introduction 111
The adsorption of organic pollutants is one of the promising methodologies for their removal from the environmental, 112
and the interest towards efficient and low-cost materials for remediation of contaminants from water is strongly emerging 113
(Xiao and Pignatello 2015; Ruggieri et al. 2015; D’Archivio et al. 2018). Chemical oxidation, ion exchange, membrane 114
separation and adsorption have been widely applied for the removal of pollutants from water (Carolin et al. 2017; 115
Jeevanantham et al. 2019). Among these, adsorption remains one of the most effective and important technologies, 116
considering the different nature of the contaminants to be analysed, as well as being a versatile and economical method 117
(Jung et al. 2001; Zhang et al. 2019; Mojiri et al. 2020). 118
One of the main causes of pollution of surface and groundwater is attributed to the increase in the use of herbicides in 119
agricultural activities, causing great concern due to the potential risk to human health (Jablonowski, Schäffer, and Burauel 120
2011; Sousa et al. 2018). 121
Atrazine is an herbicide, of the triazine classes, typically used for the control of broadleaf season-long weeds in a variety 122
of crops such as corn and sugarcane, but it also finds use on turfs such as golf courses and residential lawns as well (Frank 123
and Sirons 1979; Miller et al. 2000). Human exposure to atrazine is linked to several serious health effects. A potent 124
endocrine disrupter, atrazine interferes with hormonal activity of animals and humans at extremely low doses (Sanderson 125
et al. 2002). It exhibits acute, chronic and phytotoxicity. It has been proved that atrazine contains mutagenic and 126
carcinogenic agents also (MacLennan et al. 2002; Roberge, Hakk, and Larsen 2004; Kucka et al. 2012). 127
Although the U.S. Environmental Protection Agency (USEPA) approved its continued use in October 2003, that same 128
month the European Union (EU) announced a ban of atrazine because of ubiquitous and unpreventable water 129
contamination (Bethsass and Colangelo 2006). USEPA set a Maximum Contaminant Level Goal (MCLG, i.e. the level 130
of a contaminant in drinking water below which there is no known or expected risk to health) for atrazine as 3 µg/l, while 131
the recommended level of atrazine in drinking water in European Union countries is 0.1 µg/l. An Atrazine Monitoring 132
Program (AMP) was created in the US to determine whether concentrations of atrazine and its chemical degradates are 133
present at a level that could potentially pose a risk to public health. In September 2020, USEPA released the Interim 134
Registration Review Decisions for atrazine, propazine, and simazine, and finalized mitigation measures to protect human 135
health and mitigate potential ecological risks. 136
Among the class of triazines, Atrazine, Atraton and Prometryn (shown in Figure 1) were chosen as a model for the study 137
of the removal of contaminants from water and the adsorbent material chosen was a reduced graphene oxide (rGO), whose 138
adsorbent capacity has been optimized. 139

5
140
Figure 01 Triazines used in this work: a) Atrazine, b) Atraton and c) Prometryn; Graphenic materials used as sorbent: 141
d) pristine GO sponge obtained by freeze drying the aqueous dispersion and e) rGO film obtained by simple 142
evaporation of the solvent in a petri dish. 143
Graphene-based materials are widely used for adsorbent removal of organic pollutants from water, due to their unique 144
characteristics, including high adsorption capacity. 145
Graphene and its derivatives have attracted great attention all over the world for their potential applications in sensors, 146
catalysis, energy-storage devices due to the excellent mechanical, electronic, and thermal properties (Geim and Novoselov 147
2007; Singh et al. 2011). 148
Many studies show that graphene-based materials have good potential in the environmental field (Thakur and 149
Kandasubramanian 2019). For instance, their large surface area and delocalized π network have been exploited in the 150
adsorption of different types of contaminants from water (Lu and Astruc 2020). In general, an adsorbent material must 151
have a good adsorption capacity which will depend on the surface properties of the adsorbent itself, on the presence of 152
sites available to interact with the pollutants and on the ease of homogeneous dispersity in the aqueous media. 153
Design Of Experiment (DOE) coupled with the response surface methodology (RSM) has been wildly used in multi-154
parametric optimization of analytical method conditions (Tarley et al. 2009; Vera Candioti et al. 2014; Ruggieri et al. 155
2017; Ruggieri et al. 2020) and pollutant removal methods, especially for the optimization of adsorption working 156
conditions (temperature, pH, time) or for the improvement of the synthesized materials (Lingamdinne et al. 2020; Bonetto 157
et al. 2021). Most applications have involved GO-composite materials in order to modify and refine properties for a 158
specific purpose. In detail, Central Composite Design was used to evaluate the adsorption mechanism and the influencing 159
factors in the adsorption process of spilled oil by means of graphene/chitosan nanocomposite (Ghasemi et al. 2020). 160
Tapouk et al. used the same multivariate approach to evaluate the potential, for the endotoxin removal, of GO sheet-L-161
Arginine nanocomposite (Amini et al. 2020). Three-factors Box-Behnken design was employed to optimise the synthesis 162

6
of polymer-based nanocomposite (chitosan-polyethyleneimine-graphene oxide) for simultaneous removal of cationic and 163
anionic heavy metal contaminants (Perez et al. 2017). 164
In this work, DOE coupled with RSM was chosen to optimize the graphene oxide reduction conditions in order to develop 165
a useful method for the removal of triazine pesticides from the aqueous medium. The rGO material was synthesized from 166
graphene oxide produced in the laboratory, after a mild heat treatment of the pristine GO. 167
Atrazine was chosen as the organic micropollutant model for the standardised batch adsorption tests and a three-level full 168
factorial design was employed to plan the representative experiments. Eventually, the optimised sorbent material was 169
tested on other triazine models namely Atraton and Prometryn. The idea behind the work was to couple an optimization 170
step to the study of the triazine adsorption onto rGO; this was achieved by testing, according to the three-level full factorial 171
design, graphene oxide derivatives thermally reduced. The objective was to use a simple and environmental friendly 172
sorbent material that was optimised with a minimum number of experiments and in mild conditions, which are easily 173
controllable and do not require an inert atmosphere. As far as our knowledge there are no studies that involve simple rGO 174
films for atrazine adsorption. 175
Many groups used magnetic graphene oxide-based nanocomposites for the removal of pollutants for sustainable water 176
purification. Zhao et al reported pioneering work on the use of a graphene-based Fe3O4 magnetic nanoparticles as the 177
adsorbent for the magnetic solid-phase extraction of some triazine herbicides in environmental water (Zhao et al. 2011) 178
followed by high performance liquid chromatography. 179
Boruah et al. used Fe3O4/reduced graphene oxide (rGO) nano composite, which is easily and quickly separated from the 180
aqueous medium using an external magnet for its reuse (Boruah et al. 2017). 181
Andrade et al. reported composite magnetic nanoparticles embedded into pristine GO sheets as adsorbents for the removal 182
of atrazine, using organic solvent (ethanol) and an ultrasonic process (Andrade et al. 2019). 183
Zhang et al. prepared a biochar-supported reduced graphene oxide composite for the for the simultaneous removal of 184
atrazine and lead ions (Zhang et al. 2018). The material was synthetised via slow pyrolysis of graphene oxide pre-treated 185
corn straws in a high temperature furnace at 600°C under nitrogen. 186
Pristine materials usually have lower capability for the removal of organic pollutants compared to hybrid or polymeric 187
composite. Recently, Souza Antônio et al. described, in detail, the adsorption process involving atrazine, as a target 188
substrate, and GO as sorbent material (de Souza Antonio et al. 2020). The study evaluated the changes in the adsorption 189
capacity following the variation of pH, concentration, temperature and dissolved salts. However, it seems that no 190
experimental design was applied, limiting the system understanding when the multivariate nature of the adsorption 191
phenomenon is not considered. Furthermore, no mention is made about the recoverability of the material, which is 192
expected to be recovered by filtration, with all related problems. 193

7
Differently from the described studies, in this work the blandest possible conditions have been chosen, the possibility to 194
optimize the adsorption capability of an rGO film (easily recoverable material) was considered. 195
Reduced graphene oxide samples were prepared by mild thermal treatment of GO in laboratory oven, starting from 196
acetone solutions of GO heat treated in air for 18-30 hours at 80-120 °C, to obtain thick films of rGO. 197
Furthermore, the outcomes of the DOE model were exploited to better understand not only the adsorption process but 198
also the effects that the reduction parameters have on the material properties. Even if the percentage of analyte adsorption 199
does not achieve impressive values, the study could be surely a starting point for further works that could involve the 200
optimization of the adsorption conditions. 201
2 Materials and methods 202
GO was prepared from graphite flakes with an average particle size of 100 meshes purchased from Sigma-Aldrich 203
(graphite, product N. 332461). Concentrated sulfuric acid (H2SO4, 96%, product N. 30743), sodium nitrate (NaNO3, 204
99%, product N. 221341), potassium permanganate (KMnO4, >99%, product N. 60458), hydrogen peroxide solution 205
(H2O2, 30%, product N. 95294), hydrochloric acid (HCl, 37%, product N. 30721), Atrazine (product N. 45330, 206
PESTANAL®), Atraton (product N. 31206, PESTANAL®), Prometryn (product N. 45636, PESTANAL®) and 207
acetonitrile (product N. 34888, HPLC-grade Chromasolv®) were purchased from Sigma Aldrich (St Louis, MO). All the 208
aqueous solutions were prepared using MilliQ distilled water (Millipore, Bedford, MA, USA). 209
2.1 GO/rGO preparation and characterization 210
Graphene oxide was synthesized using a modified Hummers method (Treossi et al. 2009; Iacoboni et al. 2019). Graphite 211
(5 g), and sodium nitrate (3.8 g) were placed into a beaker in a salt/ice bath. Subsequently, 375 ml of concentrated sulfuric 212
acid was added. The reaction mixture was kept in continuous agitation by a mechanical stirrer. After the mixture has 213
become homogeneous, 25 g of potassium permanganate were slowly added. The solution was kept under stirring for 5 214
days at room temperature. After 5 days a 5% H2SO4 aqueous solution (700 ml) was poured through a funnel and H2O2 215
(30 wt%) was added drop by drop to remove the potassium permanganate and the suspension was thus stirred for another 216
2 hr. In order to obtain a clean product, the mixture was diluted with 5% H2SO4 (2 l) and left to settle for 1 day. Inorganic 217
impurities were removed through successive centrifuges, after removing the surnatant. The solid part was 218
washed/centrifuged at 4000 rpm for 10 min with a 5% aqueous solution of H2SO4 and H2O2 at 0.3% (12 times), then 4% 219
HCl (3 times), deionized water (8 times), and finally MilliQ water (2 times), removing the supernatant after each passage. 220
The pH of the dispersion was monitored until it reached 6–7. Finally, the GO is transferred to acetone and dried at 50 °C 221
for 24 hours, obtaining 4.8 g of powder. 222
Reduced Graphene Oxide samples (rGO) were prepared by thermal treatment of GO in laboratory oven. Acetone solutions 223
of GO were heat treated in air for 18-30 hours at 80-120 °C (see Discussion for details), to obtain thick films of rGO. 224

8
GO and rGO were fully characterized by Scanning Electron Microscopy (SEM), X-ray diffraction (XRD), Fourier 225
Transform Infrared Spectroscopy (FTIR), X-ray photoelectron spectroscopy (XPS) and Brunauer-Emmett-Teller (BET) 226
surface area analysis. 227
Surface topography was studied by Scanning Electron Microscope (SEM, Leo 1530 Gemini). The images were acquired 228
with an acceleration voltage of the electron beam, E.H.T. = 10 KV, at different magnifications. The GO sample for the 229
SEM was prepared by spin coating a very dilute aqueous solution (0.2 mg/ml, volume of 50 ml) of the material on a silicon 230
substrate. The rGO film was deposited by drop casting a dispersion of the material in water on the Si substrate. 231
X-ray diffraction (XRD) analysis was made by a Panalytical X Pert Pro X-ray diffractometer on dry and pulverized 232
materials. 233
The Fourier transform infrared (FT-IR) spectra of GO/rGO were recorded on a FT-IR spectrometer (Perkin Elmer 234
spectrophotometer Spectrum Two) equipped with reflectance module (ATR). The samples were analysed directly in the 235
form of films. 236
X-ray photoelectron spectroscopy (XPS) spectra were collected in ultra-high vacuum (UHV) conditions with a PHI 1257 237
spectrometer, equipped with a monochromatic Al Kα source (h = 1486.6 eV) with a pass energy of 11.75 eV, 238
corresponding to an experimental resolution of 0.25 eV. The acquired XPS spectra have been fitted with Voigt line shapes 239
and Shirley backgrounds. The GO/rGO samples for the XPS were prepared by drop casting a dilute aqueous solution (1.0 240
mg / ml, volume of 50 ml) of the material on a gold substrate. 241
BET isotherm adsorption measurements were performed by a nitrogen porosimeter (Quantachrome Instrument, 2008). 242
The device is controlled by the NOVA Series Windows®-Based Operating and Data Analysis Software. The 243
measurements were performed on dry and pulverized materials. 244
2.2 Chromatographic analysis 245
The analysis of the triazines was carried out by using an HPLC apparatus consisting of a controller pump Waters 600 246
equipped with on-line degasser Agilent Technologies 1220 series (Agilent Technologies, Waldbronn, Germany), an 247
autosampler Water 717 plus, a Security Guard Ultra Cartridge UHPLC C18 precolumn (4.6 mm id) from Phenomenex 248
(Torrance, CA, USA), a Kinetex XB-C18 (Phenomenex) column (250 mm length, 4.6 mm id, 5 μm particle size) and a 249
996 photodiode array detector (Waters). The working wavelengths for quantitative analysis of each analyte were 220 nm. 250
The elution was performed at room temperature, constant flowrate (1 ml/min) and isocratic conditions using a mixture 251
(35:65, v/v) of water and acetonitrile. The chromatographic apparatus was controlled by Empower software (Waters). 252
The analysed solutions were filtered by HPLC filters Whatman Spartan13/02 RC. 253
2.3 Adsorption experiments 254

9
The batch triazines adsorption experiments were carried out at room temperature under shaker conditions. Ten milligrams 255
of rGO film were placed in contact with 10 ml of ultrapure water, in screw-cap glass vials, containing a single triazine. 256
Sorption isotherm experiments were conducted with seven initial pesticide concentrations (0.5, 1.0, 2.0, 5.0, 10, 20, and 257
50 μg/ml). The point at the concentration of 10 μg/ml was repeated in triplicate. The vials of the nine samples containing 258
different concentrations of pesticide were simultaneously placed on orbital shaker at 300 rpm in the dark for 1h. After 259
reaching equilibrium, 1 ml of solution was collected, filtered with 0.2 μm PTFE filters (PHENEX, Phenomenex) and 260
placed in HPLC vials to determine the equilibrium concentration (Ceq). Preliminary kinetic tests were achieved, and 261
equilibrium was assumed when no further change in pesticide up-take was observed. Based on these experiments 1 h 262
contact time was sufficient to reach equilibrium. 263
The adsorptions data can be understood using several approaches. The models usually applied are the Freundlich and 264
Langmuir isotherms (Freundlich 1906; Langmuir 1916). The Freundlich isotherm [Equation (1)], is generally used to 265
model the removal of hydrophobic organic pollutants from water. It is an empirical equation used to define the uptake of 266
adsorbate occurring on a heterogeneous surface by multilayer adsorption: 267 𝑞𝑒 = 𝐾𝐹 𝐶𝑒1/𝑛 (1) 268
where qe is the equilibrium adsorbate concentration onto the adsorbent, Ce is the adsorbate equilibrium concentration in 269
the solvent, KF (Freundlich constant) indicates the multilayer adsorption capacity of adsorbent and 1/n measures the 270
adsorption intensity or surface heterogeneity of the adsorbent. It becomes more heterogeneous as gets closer to zero, and 271
homogeneous if this value approach to one (D'Archivio et al. 2009; Berhane et al. 2017; Nodeh et al. 2019). The amount 272
of analytes adsorbed onto the adsorbent after equilibration [Equation (2)] was established by mass balance of the process 273
at equilibrium condition: 274 𝑞𝑒 = 𝑉 (𝐶0−𝐶𝑒)𝑚 (2) 275
where C0 is the initial concentration, m is the mass of adsorbent and V is the solution volume. The Langmuir model 276
[Equation (3)] assumes uniform energy sites on the adsorbent surface and is defined by the following relationship: 277 𝑞𝑒 = 𝑞𝑚𝑎𝑥 𝐾𝐿 𝐶𝑒1+𝐾𝐿𝐶𝑒 (3) 278
where qmax is the limiting amount of adsorbate per unit of adsorbent required for a monolayer coverage of adsorbent 279
surface and KL, the Langmuir adsorption constant is a binding constant related to the free energy of sorption. The 280
reciprocal value of KL corresponds to the concentration in the liquid phase at which half of the maximum adsorption 281
capacity of the adsorbent is reached. The isotherm adsorption data can be described in the following linear forms of 282
Freundlich [Equation (4)] and Langmuir [Equation (5)] models, respectively: 283 log 𝑞𝑒 = log 𝐾𝐹 + 1𝑛 log 𝐶𝑒 (4) 284

10
𝐶𝑒𝑞𝑒 = 1𝑞𝑚𝑎𝑥𝐾𝐿 + 𝐶𝑒𝑞𝑚𝑎𝑥 (5) 285
thus, the model parameters in both cases can be easily obtained from least-square linear regression of the experimental 286
data. 287
2.4 Response surface methodology 288
Response surface methodology (RSM) is a chemometric tool commonly used to graphically identify an optimum, that is 289
the point (maximum or minimum in the experimental domain) at which the combination of the experimental variables 290
results in the best response (Lundstedt et al. 1998). For optimization purpose, it is crucial to plan the experiments 291
according to an appropriate experimental design to well describe the curvature of the quadratic model. A three-level full 292
factorial design is frequently coupled with RSM since it ensures acceptable reliability in estimating individual and 293
combined effects of the independent variables on the response (Vander Heyden et al. 2001). Thus, the relationship 294
between the response and the factors can be well approximated, in the limited domain, by a second-order polynomial 295
function [Equation (6)]: 296 Y = 𝑎0 + 𝑎10𝑋1 + 𝑎2𝑋2 + 𝑎12𝑋1𝑋2 + 𝑎11𝑋12 + 𝑎11𝑋22 (6) 297
where Y is the response, Xi the experimental variables and ai the regression coefficients. Determining the model 298
coefficients by ordinary least squares regression, the value of the response Y can be computed in each point of the explored 299
domain and can be plotted in a three-dimensional Response Surface, providing easier exploitation of the interesting 300
information. The RSM and the three-level full factorial design were applied to assess the influence of the Temperature 301
(T) and the time (t) of the thermal treatment, performed for GO reduction, on the rGO film adsorption efficiency. 302
Factors and levels were defined considering previous knowledge and preliminary outcomes. The experiments, reported 303
in Table 01, were performed in random order and consisted of the nine best variable combinations and one replicate in 304
the central point. The optimal experimental condition was selected maximizing the adsorption percentage resulting from 305
standardized batch adsorption experiments, which were carried out keeping constant the amount of rGO, the triazine and 306
its concentration (10 mg of rGO in 10 ml of atrazine aqueous solution at a concentration of 5 mg/ml). 307
Analysis of variance (ANOVA) was performed to statistically identify the influencing factors, to evaluate the significance 308
of the model and the lack-of-fit. The determination coefficient, the related adjusted value (R2 and R2adj) as well as the 309
coefficient of determination in a leave-one-out cross-validation procedure were instead used to assess model adequacy 310
and generalization level. The statistical analysis was performed using the R-based free software “Chemometric Agile 311
Tool” (CAT, Chemometric Agile Tool, Leardi, R. et al 2019; http://gruppochemiometria.it/index.php/software). 312
3 Results 313
3.1 Preparation and characterization of the sorbents 314

11
This work was carried out starting from a graphene oxide produced by us in the laboratory, following a protocol already 315
extensively studied in the literature (Treossi et al. 2009) and already described in our other works. Since the starting 316
material used is not a commercial product, we have reported the characterization of the graphene oxide from which we 317
started (see the Support Information), and the chemical characterization of the material itself. 318
In the Supporting Information we reported the GO characterization by Scanning Electron Microscopy (SEM), Fourier 319
Transform Infrared Spectroscopy (FTIR) and X-ray photoelectron spectroscopy (XPS). 320
For SEM images, the starting aqueous GO solution at a concentration of 0.2 mg/ml was spin coated on a silicon substrate, 321
and showed a typical dispersion of graphene oxide sheets (Figure S01 a-b), constituted of mono and multilayers, whose 322
lateral dimensions ranged from 100 nm up to 100 mm. The GO showed the presence of some characteristic folds and 323
ripples. 324
The GO FT infrared spectrum showed in Supporting Information (Figure S02) evidenced the -OH stretching vibration at 325
about 3420 cm-1. The vibrational bands at 2923 cm-1 and 2854 cm-1 are attributed to -CH2. The absorption band at 1725 326
cm-1 corresponds to stretching vibrations of C=O from carbonyl or conjugated carbonyl groups. The absorption peak at 327
1620 cm-1 is assigned to the C=C (aromatics) stretching. The absorption peaks at about 1423 cm-1, 1225 cm-1 and 1060 328
cm-1 are assigned to -OH from carboxyl, C-O-C from epoxy or ether and C-O from alkoxy, respectively. These results 329
are in agreement with the literature (Iacoboni et al. 2019). 330
In Figure S03 we showed the XPS survey of the graphene oxide (A) and the area corresponding to the C 1s signal (B), 331
from which we can observe the presence of a high percentage of oxygenated groups in the GO. From XPS analysis we 332
calculated the C/O ratio that was 1.99. The relative area percentage for C-C, C-O and C=O were 44.0, 51.5, 4.5 (as 333
reported in Table 02), which confirms the presence of a high number of oxygenated groups in the starting sample. Going 334
into detail, we can see the contributions of the hydroxyl and epoxy groups on the carbonaceous skeleton, which make the 335
peak relative to the C-O very intense. The XPS C 1s core level spectra are displayed in Figure S03-B. The spectrum was 336
fitted by the sum of three components assigned to C atoms belonging to: aromatic rings and hydrogenated carbon (C=C/C-337
C, 284.8 eV), hydroxyl and epoxy groups (C-O/C-O-C, 286.9 eV) and carbonyl groups (C=O, 288.2 eV). The relative 338
abundances of each component of the C 1s spectra are: C=C/C-C 44.7%, C-O/C-O-C 47.7%, C=O 7.6%. The resulting 339
quantitative estimate of the C/O concentration ratio is 1.99, showing a high degree of oxidation of the material (this ratio 340
varies according to the synthetic procedure followed, and the oxidizing system chosen). 341
The presence of a well oxidized starting material can influence the subsequent thermal reduction that has been chosen. In 342
this work we decided to work in mild reduction conditions, using a simple laboratory oven and carrying out the reduction 343
in air. The choice of such simple and easily replicable conditions in any laboratory, without having to use more 344

12
sophisticated and expensive equipment, was made with the aim of being able to easily obtain a reduced material that does 345
not disperse in the aqueous phase and could therefore be easily separated. from the solution and recovered. 346
When working in these mild conditions it is important to have an indication of the degree of oxidation of the starting 347
material, because it has already been seen in the literature that by submitting graphene oxide to reduction in air, up to 348
100-120 °C extreme degradation of the material and a loss of carbon as amorphous or carbon dioxide are not expected, 349
processes that occur at higher temperatures (Perrozzi et al. 2014). 350
From studies previously carried out on samples reduced in mild conditions it was found that at 80-120 ° C the thermal 351
reduction of a graphene oxide layer led to the loss of water of hydration and of the more labile groups present on the 352
graphene skeleton, i.e. the epoxy groups (Catanesi et al. 2018). 353
In this work, the adsorption of atrazine was carried out starting from the pristine GO material and on some of its thermally 354
reduced derivatives at a temperature between 80 and 120 °C, and considering a reduction time varying between 18 and 355
30 hours total. 356
To achieve the maximum adsorption capacity, the best reduction conditions were determined to obtain an optimal sorbent. 357
An experimental multivariate design with two independent variables, time (t) and temperature (T), was used. For each 358
independent variable, three different levels were considered. Each sample was used to evaluate the different adsorption 359
capacity through batch tests. Response surface methodology (RSM) was used for the optimizations of experimental 360
variables. 361
Before going into the details of the methodology chosen, we asked ourselves which form of the solid material was the 362
most suitable in our case. Indeed, the synthesized GO and rGO could be used in two different 3D forms with different 363
chemical-physical properties: the thick film and the sponge. To obtain the film, the graphenic material was placed in a 364
crystallizer with acetone and dried. The sponge, on the other hand, was obtained after a freeze-drying process which 365
allows the elimination of water from an iced water solution by sublimation. The sample was frozen at a temperature of 366
about -20 °C and brought to low pressure through a rotary pump. As the temperature of the sample increased, the ice was 367
sublimed, obtaining a three-dimensional sponge. Both processes were simple, with the least possible deterioration of the 368
structure and components of the substance itself. 369
As already mentioned, the materials have very different chemical-physical and structural characteristics. The three-370
dimensional sponge has a higher adsorption capacity but with a high contact time, it is easily dispersed in an aqueous 371
solution. The thick film shows a lower adsorption capacity than the sponge, but allows easy recovery, as it does not 372
disperse in solution. In Figure 1 the two forms are shown. An experimental evidence of the material reduction can be seen 373
in Figure 1, where the colour change of the material reduced from a pale brown (GO sponge) into dark black is evident 374
(rGO film). 375

13
Preliminary adsorption tests were conducted initially using an aqueous solution of pesticides and graphene oxide. Due to 376
its poor hydrophobicity, the total solubilization of graphene oxide in aqueous solution has occurred, both in the form of 377
thick film and sponge, simultaneously showing the poor adsorption capacity against pesticides. Subsequently, the material 378
was thermally reduced (rGO) increasing its hydrophobicity and adsorption capacity. 379
The two forms of rGO, sponge and film, were therefore compared. For reasons related to a possible recovery of the 380
material, the rGO thick film was chosen. In fact, the rGO sponge still showed a redispersion behaviour in the aqueous 381
phase, effectively preventing the separation of it from the aqueous phase. 382
The reduction of graphene oxide, previously synthesized, took place thermally in the air. The GO samples were dispersed 383
in acetone, placed in a petri dish and heat treated in air for 18-24-30 hours in a laboratory oven, to obtain a well-adhered 384
uniform film of reduced GO (rGO). The reduction temperature was chosen between 80 and 120 °C, and subsequently the 385
samples were used for preliminary measurements of adsorption with atrazine, optimizing the conditions by means of an 386
experimental design. 387
DOE-RSM was employed to evaluate the influence of temperature and time and their combined effects on the adsorption 388
efficiency of a thermally reduced GO film. The selected DOE consists of three levels for both Temperature (80, 100 and 389
120 °C) and time (18, 24 and 30 h); the resulting experimental data were regressed with the reported equation [Equation 390
(7)] providing the following model: 391
%abs =44 (± 2) + 4.7(± 1.3) T* + 4.3(± 1.3) t* -2.5 (± 1.6) Tt -2 (± 2) T2 -11 (± 2) t2** (7) 392
where the standard deviations of the coefficients are given in parenthesis. 393
All the linear terms show relevant effects (significance level of 5%) whereas, except for t2, the other quadratic terms are 394
not significant. The observed and the computed response values (%abs), for each point of the DOE, are displayed in Table 395
01; a good agreement is demonstrated between the calculated % abs values and the experimental data with residuals 396
randomly distributed. The surface model exhibits a satisfactory descriptive and predictive performance as witnessed by 397
the determination coefficient R2 (0.963), the related adjusted value (0.857) and the determination coefficient in leave-398
one-out cross-validation (0.793). Moreover, the reported results of the ANOVA (Table 01) reveal that the surface model 399
is highly significant, according to the p-value<0.05, and that well fits the experimental data, since the lack-of-fit p-value 400
is greater than the significance level of 5%. 401

14
402
Figure 02 Surface plot a) and related contour plot b) of the percentage of adsorbed atrazine as a function of the 403
reduction process parameters (temperature and time). 404
Figure 02 displays the response surface and the related iso-response plot. It can be noted that the maximum response 405
computed by the model does not exceed the 46% of adsorption and that no improvement can be achieved by working in 406
a temperature range between 110 and 120°C when the time is fixed at 24h. Since the maximum is at the extremity of the 407
experimental domain and that no improvement is achieved by moving from 110° C to 120°C it was chosen to work under 408
the mildest possible conditions. Accordingly, the thermal reduction was conducted with the following optimal working 409
conditions: T = 110°C, t = 24h. Furthermore, by integrating the DOE-RSM model outcomes and the information provided 410
by the characterization of the optimal rGO film, a better understanding of the system involved in the adsorption process 411
could be obtained. DOE-RSM allows to identify the influencing factors and to evaluate the effect of the process 412
parameters on the rGO film adsorption ability. In this respect, a direct interpretation of the effect of temperature can be 413
done since the interaction term (Tt) and the quadratic one have resulted statistically not significant. In detail, an 414
improvement of the %abs can be obtained by increasing the temperature from 80° to 120° C with an averaged effect on 415
the response of near ten percentage points. 416
In general, the adsorption of organic pollutants is increased with the reduction of the GO in which the functional groups 417
containing oxygen are more limited and there is an abundant sp2 structure which strengthens the p - p interactions (Pei et 418
al. 2013). 419
On the other hand, a quadratic trend can be confirmed as regards the time dependence of the response, with the maximum 420
pinpointed at t = 24 h. After 24 hours of thermal treatment, the product reached the maximum efficiency of the mild 421
reduction, which mainly concerned the more labile oxygenated groups present on the skeleton of the graphenic material, 422

15
that is the epoxides and hydroxides, as confirmed by the FTIR analysis in which it is seen the decrease of the characteristic 423
peaks. The aromatic skeleton as well as the carboxyl, carbonyl, epoxy and hydroxy groups on rGO were the major sites 424
of adsorption, and there are p - p interactions and hydrogen bond interactions of rGO with atrazine. 425
Parameters Value ±SD R2 Adj-R2 Q2
intercept 44 ± 2
*X1 4.7± 1.3
*X2 4.3± 1.3 0.936 0.857 0.793
X1∙X2 -2.5 ± 1.6
X12 -2 ± 2
**X22 -11± 2
Variation
source
Sum of
Squares
Degrees of
freedom Mean Square F-value p-value
Lack of fit 35 3 11.7 2.4 0,43
Pure error 4.8 1 4.8
Model 589.4 5 117.9 11.8 0,02
Residual 39.8 4 9.9
Table 01 Model adsorption parameters and analysis of variance 426
Table 01 shows the determination coefficients (R2, Adj-R2, Q2), the model parameters with the corresponding significance 427
level expressed by stars (*p<0.05, **p>0.01), the regression coefficients with the related standard deviation (SD) and the 428
Analysis Of Variance (ANOVA). 429
3.2 Characterization of reduced Graphene Oxide (rGO) at 110°C 430
From the response surface obtained, the optimal reduction conditions of the material were deduced which are 110 ° C for 431
a time of 24h. rGO samples were fully characterized by Scanning Electron Microscopy (SEM), X-ray diffraction (XRD), 432
Fourier Transform Infrared Spectroscopy (FTIR), X-ray photoelectron spectroscopy (XPS) and Brunauer-Emmett-Teller 433
(BET) surface area method. 434
All the reduced materials have been characterized but only the characterizations relating to the reduced material at 110 ° 435
C for a time of 24 hours are reported. 436
Surface topography of the rGO film showed homogeneous morphology, as evidenced in the Figure 03 a-c, where has 437
been reported the rGO film reduced at 110 °C. In the enlarged images on the right (b-c) you can see some wrinkles and 438
folds on the surface of rGO films. 439

16
The XRD patterns of GO shown in Figure 03-d (black line) reveal a GO diffraction peak at 2θ = 11.1°, which implies an 440
interplanar space of about 0.81 nm (calculated by Bragg equation), corresponding at the reflection plane (001). In the 441
rGO sample the GO signal is almost completely absent and a broader signal at 2q = 23.9° is due to the presence of a 442
graphitic skeleton (graphite XRD pattern shows a single, very intense and sharp peak at 26.8°) obtained after thermal 443
reduction of the oxygenated functional groups on the graphene oxide sheets. The peak becomes wider and less intense 444
and the interplanar space of rGO is reduced to 0.35 nm. 445
The Fourier Transform Infrared (FTIR) analysis was performed in the range of wavenumbers of 4000-400 cm-1 for the 446
identification of functional groups. Analysing the rGO spectra in comparison with the starting GO we observed the 447
presence of different absorption peaks, according to the spectra reported in the literature (Figure 03-e). 448
In the 110°C reduced GO spectrum, we saw that the absorption peaks at 1423 cm-1 (-OH stretching vibrations from 449
carboxyl) in the curve of GO disappeared, and the relative intensity of C-O-C peak at 1225 cm-1 and C-O at 1060 cm-1 450
were lowered, the mild reduction of the sample. 451
FTIR analysis confirms the occurrence of the reduction process, which was not much efficient at those heating 452
temperature conditions, leaving the most of oxygenated functionality on the graphenic skeleton. 453

17
454
Figure 03 a-c) SEM images of rGO film reduced at 110 °C; d) XRD patterns of GO (black line) and rGO film reduced 455
at 110 °C (red line); e) FTIR spectra of GO and reduced GO at 110 °C; XPS survey of rGO at 110 °C (f) and C1s region 456
(g); BET isotherm (h) for GO (black square) and rGO (red circle) and (i) BJH pores average volume and diameter for 457
GO (black line) and rGO (red line) 458
XPS was employed to study the chemical states of the prepared GO and rGO film. From XPS survey spectra (Figure 03-459
f) we calculated the total content (%) of C1s and O1s peaks, and the C/O ratio calculated was respectively 1.99 for GO 460
and 2.51 for reduced GO at 110 °C respectively (see Table 02). In the 110 °C reduced rGO we found an increasing in the 461
C/O ratio, as expected for reduced samples, due preferably to cleavage of C-O-C bond in the epoxy groups and C(=O)-462
OH from carboxyl. 463
XPS survey

18
C 1s (%) O 1s (%) C/O ratio
GO 64.6 32.4 1.99
rGO @ 110°C 68.7 27.4 2.51
C 1s fitting
Relative area percentage (%)
C-C C-O C=O
GO 54.9 34.3 10.8
rGO @ 110°C 57.4 32.1 10.5
Table 02 XPS survey: atomic percentages of C, O for GO and rGO sample; Analysis of the deconvoluted C1s peaks 464
obtained from XPS and relative area percentages for GO and rGO sample. 465
In Figure 03-g are reported the C 1s comparison spectra of the samples. The C 1s core level spectra were fitted by summing 466
three components assigned respectively to aromatic sp2 carbon (C-C), epoxy and hydroxyl groups (C-O) and carbonyl 467
and carboxyl groups (C=O). From the analysis of deconvoluted peaks, we noticed an increase from 54.9% to 57.4% of 468
the C-C contribution, while the C-O signal decrease from 34.3% to 32.1% in the 110 °C reduced sample. For the rGO the 469
peak contributes at about 284.5 eV relative to C-C signal increased while the peak at about 286.5 eV (C-O bond) becomes 470
broader and reduced in intensity. This confirms the (partly) reduction of graphene oxide to graphene-like sheets by 471
removing the oxygen-containing groups with the recovery of a conjugated structure. The peak relative to the C=O double 472
bond is superimposed on the peak relative to the C-O signal, and its contribution is difficult to deconvolve. 473
In table 02 are shown, in details, the relative percentage of deconvoluted C 1s peaks contribute to the GO and rGO 474
samples. 475
Through the adsorption of nitrogen gas it was possible to evaluate the adsorption capacity, the surface area and verify the 476
presence and size of the pores in the rGO film. The study of the specific volume of adsorbed nitrogen allows to determine 477
the specific surface area of the materials, the specific volume and the diameter of the pores. The specific surface of a solid 478
is the surface area per unit of mass and is expressed in m2/g and is determined with the Brauner, Emmet and Teller 479
equation, or more simply BET method. 480
In Figure 03-h it is shown the GO and rGO adsorption and desorption isotherm, in which the presence of a moderate 481
hysteresis phenomenon is visible, more evident for GO. The isotherm has a convex shape, classified as III type, 482
representative of weak adsorbent-adsorbate interactions. A classification of pores is given by the International Union of 483
Pure and Applied Chemistry (IUPAC) which classifies them according to their size and defines: micropores with a width 484
below 2 nm, mesopores with a width between 2 and 50 nm and macropores with a width greater than 50 nm. 485

19
Mesopores with an average diameter of 3 nm (30 Å) were calculated, and loop of H3 type are found in both materials (GO 486
and rGO), mostly associated with the pore shape of solids consisting of aggregated non-rigid plate-like particles 487
(Bardestani, Patience, and Kaliaguine 2019). 488
The hysteresis loop can be explained by the fact that since it is a thick film obtained by evaporation of the solvent, 489
therefore of a not real porous material, the channels may not be completely open, this implies a different path of the gas 490
between the adsorption and desorption phase. The measured specific surface area of the rGO sample was approximately 491
30 m2/g, while for GO was approximately 8 m2/g. 492
The specific surface area of the reduced samples is lower than the theoretical monolayer graphene oxide reported in 493
literature which ranged from 2-1000 m2/g (Zhang et al. 2020), potentially due to the aggregation of the graphenic sheets 494
which can cause their partial overlap and coalescence, especially the smaller ones, lowering the surface area of the 495
material. 496
However, the presence of a crumpled three-dimensional structure of the sheets still leaves many exposed surface areas. 497
With the BJH numerical integration method (Barrett, Joyner, Halenda) the pores average volume and the average diameter 498
were assessed both in the adsorption phase and in the desorption phase (Figure 03-i). From the data obtained, mesopores 499
with an average diameter of 3 nm (30 Å) and an average volume of 0.023 cm3/g are found both in the adsorption phase 500
and in the desorption phase of rGO. 501
3.3 Adsorption isotherm 502
The adsorption of the triazines on the rGO film is studied using the linear form of Freundlich and Langmuir models 503
(equations 4 and 5). Figure 04-a displays the observed adsorption equilibrium data on rGO, fitted with the Langmuir 504
model, while Fig. 04-b shows the data of three herbicides interpolated with the Freundlich model. 505
506

20
Figure 04 Adsorption isotherm plots described according to the linearized adsorption models of Langmuir (a) and 507
Freundlich (b) and reported for all the involved triazine. 508
The adsorption parameters obtained by applying both models to each of the examined herbicide and the determination 509
coefficients (R2) of the linear fits are summarized in Table 03. 510
Langmuir Model
Pesticide
qmax
(mg/g)
± 𝑺𝑬
KL
(L/mg)
± 𝑺𝑬 R2
Atrazine 4.7 0.2 0.21 0.05 0.993
Atraton 22 3 0.09 0.03 0.919
Prometrin 20 3 0.07 0.03 0.916
Freundlich Model
1/n ± 𝑺𝑬 KF
(mg/g)(L/g)1/n ± 𝑺𝑬 R2
Atrazine 2.4 0.3 0.99 0.06 0.915
Atraton 1.60 0.07 1.89 0.03 0.990
Prometrin 2.3 0.3 2.57 0.06 0.951
Table 03 Adsorption parameters computed following the linearized Langmuir (qmax ;KL) and Freundlich (1/n; KF) 511
models, their respective Standard Errors (SE) and determination coefficients (R2) are reported and computed for each of 512
the investigated triazine. 513
The values show that the Freundlich equation fitted the adsorption data better than the Langmuir one, but the Langmuir 514
model also fits well especially regarding Atrazine, as evidenced by the high R2. In particular, the goodness of fit of the 515
Freundlich model is evidenced by the R2 values varying between 0.915 for adsorption of the atrazine and 0.990 for 516
adsorption of the Atraton. The agreement between the experimental data and those of the model is also confirmed by the 517

21
small uncertainties calculated on the parameters 1/n and KF (Table 03). These findings thus effectively demonstrate the 518
heterogeneous enrichment of the triazines on the rGO edges and a multilayer adsorption on the surface of rGO. In the 519
Freundlich models the values of the parameter n are more than 1, this fact indicates that the adsorption process is 520
favourable. The observed trends are characterised by an increase in the quantity adsorbed as concentration rise. The 521
tendency to reach saturation can be understood as a measure of the maximum adsorbing capacity of the material. 522
Furthermore, the values of qmax reported in Table 03 show that Atraton is adsorbed more than Prometryn and Atrazine. 523
Atraton, with its methoxy group, may have a greater affinity towards the rGO film, hydrogen bonds could be established 524
with the groups present in the material and interactions π – π. Prometryn, despite being the most apolar pesticide, shows 525
a significant affinity towards the material. The presence of sulphur atoms in Prometryn could promote the formation of 526
hydrogen bonds with the rGO film. Comparing the data reported in Table 03 it can be noted that the constant KF assumes 527
the highest value in the case of Prometryn, which is the most apolar among the studied pesticides. The good adsorption 528
capacity can be due to the strong interactions such as hydrogen bonding, electrostatic attraction, and even π−π interactions. 529
The Freundlich model is the one that best interpolates the experimental data in cases of adsorption on heterogeneous 530
surfaces, consisting of points in which the heat of adsorption is reduced exponentially with the degree of coverage. In the 531
Freundlich model, the relative quantities adsorbed at the maximum concentration (50 mg/l) are 4.4 mg/g for Atrazine, 532
19.4 mg/g for Atraton and 18.4 mg/g for Prometryn which are in good agreement with the qmax measured in the Langmuir 533
isotherms (respectively 4.7, 22.0 and 20.6 mg/g). 534
Usually, the adsorption of analogous compounds follows the trend predicted by the Lundelius rule, which establishes a 535
general criterion in which a compound is less adsorbable the higher its solubility in the solvent. This can be explained by 536
considering that the higher the solubility, the stronger the solute-solvent bond and, therefore, the lower the adsorption 537
capacity. In our case, however, we find an inverse order of adsorption of the triazines, since Atraton is more adsorbed 538
than Prometryn while Atrazine is the least adsorbed. The solubility of atrazine is the lowest among the compounds studied, 539
and is equal to 33 ppm at 27 °C. In our case we attribute this behaviour to the fact that the adsorbent material still contains 540
a high number of oxygenated sites on its skeleton that can form hydrogen bonds with the analytes. But analysing the 541
structure of the three triazines, it is evident that the triazine ring is common to the three analytes, and forms hydrogen 542
bonds with the rGO, as well as p - p interactions with the aromatic residual graphenic skeleton. The substituent group on 543
the triazine ring of Atrazine is a chlorine, which cannot form hydrogen bonds with the adsorbent, while in the case of 544
Atraton and Prometryn both oxygen and sulphur atoms have the potential to form H bonds. This could explain the reversed 545
behaviour of the three triazine derivatives. 546

22
Compared to the adsorption values of triazines in the literature (Zhang et al. 2015; Boruah et al. 2017), our values are 547
slightly lower, but this work is a promising starting point that can help find a valid strategy even with pollutants having 548
different chemical characteristics with respect to the triazine family. 549
4 Conclusions 550
Graphene and its derivatives have shown excellent performance for environmental applications due to their excellent 551
adsorption capacity. The key surface properties which influence the adsorption on graphene derivatives are surface area, 552
p - p interactions and hydrogen bonding. The reduced graphene oxide adsorption capacity depends on the surface 553
properties of the adsorbent itself, on the presence of sites available to interact with the pollutants (H bond and p - p 554
interaction). The reduction process used still leave many oxygen-containing functional groups on the rGO, but also a π-555
delocalized electron system that results in a good affinity for aromatic pollutants. This was confirmed by Fourier 556
Transform Infrared Spectroscopy (FTIR) and X-ray photoelectron spectroscopy (XPS), where the presence of the 557
characteristic signals of the epoxy and hydroxyl groups is confirmed, despite the slight reduction it has undergone. Those 558
groups, together with the amine pendants present on the triazine rings, may still allow favourable adsorption of the 559
pollutants through hydrogen bonding interactions. Electrostatic interactions between the amino groups of the pesticide 560
and the oxygen containing functionalities of the rGO contributed maximum for adsorption. 561
A dispersion of the pristine material shows an ultra-high specific surface area but no porosity, but a revolutionary 562
improvement in the adsorption effectiveness of graphenic materials can be achieved by introducing porosity, creating 3D 563
structures by freeze-drying or by forming thick films by evaporation of the solvent. Moreover, the use of thick films, 564
rather than the simple graphene material dispersed in solution, and at the same time the reduction of GO nanosheets allows 565
the recovery of the adsorbent material after carrying out the adsorption tests. 566
The coupling of a response surface to an experimental design in which different parameters and different chemical-567
physical properties of graphenic materials can be introduced is an original and very versatile approach. From the response 568
surface obtained, the optimal reduction conditions of the material were the reduction at a temperature of 110 °C for a time 569
of 24 hours. 570
It is possible to further optimize the adsorbent material according to the same analytes or to apply the same strategy to 571
study the adsorption of different pollutants. The advantage is in terms of time and experimental tests, since with the 572
strategy just described it is possible to carry out a minimum of preliminary tests to optimize the response surface. This 573
also translates into economic savings, as less adsorbent material is consumed. 574
The Freundlich model fitted best the experimental data. The strength of adsorption of triazines followed the order: Atraton 575
> Prometryn > Atrazine. Strong electron donating abilities of O, S and N atoms and p -bonding networks in the phenyl 576
rings aided the adsorption. 577

23
The adsorption yield is not the highest possible, but the graphenic material is a versatile platform, and can also provide 578
for subsequent chemical functionalization, by means of well-known synthetic strategies. 579
This preliminary work can be used to further optimize graphenic materials, choosing which conditions may be the best 580
for the adsorption of different analytes, and preparing the respective GO derivatives that best respond to the adsorption 581
characteristics of the pollutants. By introducing functional groups that modify the surface charge of the material itself we 582
expected an improvement in adsorption capacity of sorbent material. 583
584
Acknowledgments We would like to thank all participants who contributed their time and completed laboratory study. 585
Ethical Approval and Consent to Participate Not applicable 586
Consent to Publish Not applicable 587
Authors Contributions GF and FR conceptualized and designed the study and drafted the initial manuscript. GF and PC 588
contributed to the material preparation and characterization. MF, PC and MM conducted adsorption experiments and data 589
analysis. MF, GF and FR contributed to the interpretation of data and critically revised the manuscript. All authors 590
approved the final manuscript as submitted. 591
Funding This research did not receive any specific grant from funding agencies in the public, commercial, or not-for-592
profit sectors. 593
Competing Interests The authors declare that they have no competing interests 594
Availability of data and materials The dataset used and/or analysed during the current study are available from the 595
corresponding author on reasonable request. 596
597
598
References 599
Amini Tapouk F, Nabizadeh R, Nasseri S, et al (2020) Embedding of L–Arginine into graphene oxide (GO) for endotoxin 600
removal from water: Modeling and optimization approach. Colloids Surfaces A Physicochem Eng Asp 607:125491. 601
https://doi.org/10.1016/j.colsurfa.2020.125491 602
Andrade MB, Santos TRT, Silva MF, et al (2019) Graphene oxide impregnated with iron oxide nanoparticles for the 603
removal of atrazine from the aqueous medium. Sep Sci Technol 54:2653–2670. 604
https://doi.org/10.1080/01496395.2018.1549077 605
Bardestani R, Patience GS, Kaliaguine S (2019) Experimental methods in chemical engineering: specific surface area and 606
pore size distribution measurements—BET, BJH, and DFT. Can J Chem Eng 97:2781–2791. 607
https://doi.org/https://doi.org/10.1002/cjce.23632 608

24
Berhane TM, Levy J, Krekeler MPS, Danielson ND (2017) Kinetic sorption of contaminants of emerging concern by a 609
palygorskite-montmorillonite filter medium. Chemosphere 176:231–242. 610
https://doi.org/https://doi.org/10.1016/j.chemosphere.2017.02.068 611
Bethsass J, Colangelo A (2006) European Union Bans Atrazine, While the United States Negotiates Continued Use. Int 612
J Occup Environ Health 12:260–267. https://doi.org/10.1179/oeh.2006.12.3.260 613
Bonetto LR, Crespo JS, Guégan R, et al (2021) Removal of methylene blue from aqueous solutions using a solid residue 614
of the apple juice industry: Full factorial design, equilibrium, thermodynamics and kinetics aspects. J Mol Struct 615
1224:129296. https://doi.org/https://doi.org/10.1016/j.molstruc.2020.129296 616
Boruah PK, Sharma B, Hussain N, Das MR (2017) Magnetically recoverable Fe3O4/graphene nanocomposite towards 617
efficient removal of triazine pesticides from aqueous solution: Investigation of the adsorption phenomenon and specific 618
ion effect. Chemosphere 168:1058–1067. https://doi.org/10.1016/j.chemosphere.2016.10.103 619
Carolin CF, Kumar PS, Saravanan A, et al (2017) Efficient techniques for the removal of toxic heavy metals from aquatic 620
environment: A review. J Environ Chem Eng 5:2782–2799. https://doi.org/https://doi.org/10.1016/j.jece.2017.05.029 621
Catanesi M, Panella G, Benedetti E, et al (2018) YAP/TAZ mechano-transduction as the underlying mechanism of 622
neuronal differentiation induced by reduced graphene oxide. Nanomedicine (Lond) 13:3091–3106. 623
https://doi.org/10.2217/nnm-2018-0269 624
D’Archivio AA, Maggi MA, Odoardi A, et al (2018) Adsorption of triazine herbicides from aqueous solution by 625
functionalized multiwall carbon nanotubes grown on silicon substrate. Nanotechnology 29:65701. 626
https://doi.org/10.1088/1361-6528/aaa0a0 627
D’Archivio AA, Incani A, Mazzeo P, Ruggieri F (2009) Adsorption of s-triazines onto polybenzimidazole: a quantitative 628
structure-property relationship investigation. Anal Chim Acta 650:175–182. https://doi.org/10.1016/j.aca.2009.07.048 629
de Souza Antonio R, Guerra ACS, de Andrade MB, et al (2020) Application of graphene nanosheet oxide for atrazine 630
adsorption in aqueous solution: synthesis, material characterization, and comprehension of the adsorption mechanism. 631
Env Sci Pollut Res Int. https://doi.org/10.1007/s11356-020-10693-4 632
Frank R, Sirons GJ (1979) Atrazine: Its use in corn production and its loss to stream waters in Southern Ontario, 1975–633
1977. Sci Total Environ 12:223–239. https://doi.org/https://doi.org/10.1016/0048-9697(79)90088-3 634
Freundlich HMF (1906) Over the adsorption in solution. J Phys Chem 57:1100–1107 635
Geim AK, Novoselov KS (2007) The rise of graphene. Nat Mater 6:183–191. https://doi.org/10.1038/nmat1849 636
Ghasemi O, Mehrdadi N, Baghdadi M, et al (2020) Spilled oil absorption from Caspian sea water by graphene/chitosan 637
nano composite. Energy Sources Part a-Recovery Util Environ Eff 42:2856–2872. 638
https://doi.org/10.1080/15567036.2019.1618995 639

25
Jablonowski ND, Schäffer A, Burauel P (2011) Still present after all these years: Persistence plus potential toxicity raise 640
questions about the use of atrazine. Environ Sci Pollut Res 18:328–331. https://doi.org/10.1007/s11356-010-0431-y 641
Jeevanantham S, Saravanan A, Hemavathy R V, et al (2019) Removal of toxic pollutants from water environment by 642
phytoremediation: A survey on application and future prospects. Environ Technol Innov 13:264–276. 643
https://doi.org/https://doi.org/10.1016/j.eti.2018.12.007 644
Jung M, Ahn K, Lee Y, et al (2001) Evaluation on the adsorption capabilities of new chemically modified polymeric 645
adsorbents with protoporphyrin IX. J Chromatogr A 917:87–93. https://doi.org/https://doi.org/10.1016/S0021-646
9673(01)00673-2 647
Kucka M, Pogrmic-Majkic K, Fa S, et al (2012) Atrazine acts as an endocrine disrupter by inhibiting cAMP-specific 648
phosphodiesterase-4. Toxicol Appl Pharmacol 265:19–26. https://doi.org/https://doi.org/10.1016/j.taap.2012.09.019 649
Langmuir I (1916) The constitution and fundamental properties of solids and liquids. Part I. Solids. J Am Chem Soc 650
38:2221–2295. https://doi.org/10.1021/ja02268a002 651
Lingamdinne LP, Vemula KR, Chang YY, et al (2020) Process optimization and modeling of lead removal using iron 652
oxide nanocomposites generated from bio-waste mass. Chemosphere 243:125257. 653
https://doi.org/https://doi.org/10.1016/j.chemosphere.2019.125257 654
Lu F, Astruc D (2020) Nanocatalysts and other nanomaterials for water remediation from organic pollutants. Coord Chem 655
Rev 408:213180. https://doi.org/https://doi.org/10.1016/j.ccr.2020.213180 656
Lundstedt T, Seifert E, Abramo L, et al (1998) Experimental design and optimization. Chemom Intell Lab Syst 42:3–40. 657
https://doi.org/Doi 10.1016/S0169-7439(98)00065-3 658
MacLennan PA, Delzell E, Sathiakumar N, et al (2002) Cancer Incidence Among Triazine Herbicide Manufacturing 659
Workers. J Occup Environ Med 44: 660
Miller SM, Sweet CW, DePinto J V, Hornbuckle KC (2000) Atrazine and Nutrients in Precipitation: Results from the 661
Lake Michigan Mass Balance Study. Environ Sci Technol 34:55–61. https://doi.org/10.1021/es990486n 662
Mojiri A, Zhou JL, Robinson B, et al (2020) Pesticides in aquatic environments and their removal by adsorption methods. 663
Chemosphere 253:126646. https://doi.org/10.1016/j.chemosphere.2020.126646 664
Nodeh HR, Kamboh MA, Wan Ibrahim WA, et al (2019) Equilibrium, kinetic and thermodynamic study of pesticides 665
removal from water using novel glucamine-calix[4]arene functionalized magnetic graphene oxide. Environ Sci Process 666
Impacts 21:714–726. https://doi.org/10.1039/C8EM00530C 667
Pei Z, Li L, Sun L, et al (2013) Adsorption characteristics of 1,2,4-trichlorobenzene, 2,4,6-trichlorophenol, 2-naphthol 668
and naphthalene on graphene and graphene oxide. Carbon N Y 51:156–163. 669
https://doi.org/https://doi.org/10.1016/j.carbon.2012.08.024 670

26
Perez JVD, Nadres ET, Nguyen HN, et al (2017) Response surface methodology as a powerful tool to optimize the 671
synthesis of polymer-based graphene oxide nanocomposites for simultaneous removal of cationic and anionic heavy metal 672
contaminants. Rsc Adv 7:18480–18490. https://doi.org/10.1039/c7ra00750g 673
Perrozzi F, Croce S, Treossi E, et al (2014) Reduction dependent wetting properties of graphene oxide. Carbon N Y 77:. 674
https://doi.org/10.1016/j.carbon.2014.05.052 675
Roberge M, Hakk H, Larsen G (2004) Atrazine is a competitive inhibitor of phosphodiesterase but does not affect the 676
estrogen receptor. Toxicol Lett 154:61–68. https://doi.org/https://doi.org/10.1016/j.toxlet.2004.07.005 677
Ruggieri F, D’Archivio AA, Foschi M, Maggi MA (2017) Experimental Design in Ion Chromatography: Effect of the 678
Organic Modifier and Complexing Agent on the Retention of Alkaline and Alkaline Earth Ions. Chromatographia 80:853–679
860. https://doi.org/10.1007/s10337-017-3284-4 680
Ruggieri F, D’Archivio AA, Di Camillo D, et al (2015) Development of molecularly imprinted polymeric nanofibers by 681
electrospinning and applications to pesticide adsorption. J Sep Sci 38:1402–1410. 682
https://doi.org/https://doi.org/10.1002/jssc.201500033 683
Ruggieri F, D’Archivio AA, Foschi M, Maggi MA (2020) Multivariate optimization of an analytical method for the 684
analysis of Abruzzo white wines by ICP OES. Anal Methods 12:2772–2778. https://doi.org/10.1039/D0AY00478B 685
Sanderson JT, Boerma J, Lansbergen GWA, van den Berg M (2002) Induction and Inhibition of Aromatase (CYP19) 686
Activity by Various Classes of Pesticides in H295R Human Adrenocortical Carcinoma Cells. Toxicol Appl Pharmacol 687
182:44–54. https://doi.org/https://doi.org/10.1006/taap.2002.9420 688
Singh V, Joung D, Zhai L, et al (2011) Graphene based materials: Past, present and future. Prog Mater Sci 56:1178–1271. 689
https://doi.org/https://doi.org/10.1016/j.pmatsci.2011.03.003 690
Sousa JCG, Ribeiro AR, Barbosa MO, et al (2018) A review on environmental monitoring of water organic pollutants 691
identified by EU guidelines. J Hazard Mater 344:146–162. https://doi.org/https://doi.org/10.1016/j.jhazmat.2017.09.058 692
Tarley CRT, Silveira G, dos Santos WNL, et al (2009) Chemometric tools in electroanalytical chemistry: Methods for 693
optimization based on factorial design and response surface methodology. Microchem J 92:58–67. 694
https://doi.org/https://doi.org/10.1016/j.microc.2009.02.002 695
Thakur K, Kandasubramanian B (2019) Graphene and Graphene Oxide-Based Composites for Removal of Organic 696
Pollutants: A Review. J Chem Eng Data 64:833–867. https://doi.org/10.1021/acs.jced.8b01057 697
Treossi E, Melucci M, Liscio A, et al (2009) High-Contrast Visualization of Graphene Oxide on Dye-Sensitized Glass, 698
Quartz, and Silicon by Fluorescence Quenching. J Am Chem Soc 131:15576-+. https://doi.org/10.1021/ja9055382 699
Vander Heyden Y, Nijhuis A, Smeyers-Verbeke J, et al (2001) Guidance for robustness/ruggedness tests in method 700
validation. J Pharm Biomed Anal 24:723–753. https://doi.org/https://doi.org/10.1016/S0731-7085(00)00529-X 701

27
Vera Candioti L, De Zan MM, Cámara MS, Goicoechea HC (2014) Experimental design and multiple response 702
optimization. Using the desirability function in analytical methods development. Talanta 124:123–138. 703
https://doi.org/https://doi.org/10.1016/j.talanta.2014.01.034 704
Xiao F, Pignatello JJ (2015) Interactions of triazine herbicides with biochar: Steric and electronic effects. Water Res 705
80:179–188. https://doi.org/10.1016/j.watres.2015.04.040 706
Zhang C, Zhang RZ, Ma YQ, et al (2015) Preparation of Cellulose/Graphene Composite and Its Applications for Triazine 707
Pesticides Adsorption from Water. Acs Sustain Chem Eng 3:396–405. https://doi.org/10.1021/sc500738k 708
Zhang S, Wang H, Liu J, Bao C (2020) Measuring the specific surface area of monolayer graphene oxide in water. Mater 709
Lett 261:127098. https://doi.org/https://doi.org/10.1016/j.matlet.2019.127098 710
Zhang WJ, Ruan GH, Li XX, et al (2019) Novel porous carbon composites derived from a graphene-modified high-711
internal- phase emulsion for highly efficient separation and enrichment of triazine herbicides. Anal Chim Acta 1071:17–712
24. https://doi.org/https://doi.org/10.1016/j.aca.2019.04.041 713
Zhang Y, Cao B, Zhao LL, et al (2018) Biochar-supported reduced graphene oxide composite for adsorption and 714
coadsorption of atrazine and lead ions. Appl Surf Sci 427:147–155. https://doi.org/10.1016/j.apsusc.2017.07.237 715
Zhao GY, Song SJ, Wang C, et al (2011) Determination of triazine herbicides in environmental water samples by high-716
performance liquid chromatography using graphene-coated magnetic nanoparticles as adsorbent. Anal Chim Acta 717
708:155–159. https://doi.org/10.1016/j.aca.2011.10.006 718
719
720
721
722
Figure caption 723
724
Figure 01 Triazines used in this work: a) Atrazine, b) Atraton and c) Prometryn; Graphenic materials used as sorbent: d) 725
pristine GO sponge obtained by freeze drying the aqueous dispersion and e) rGO film obtained by simple evaporation of 726
the solvent in a petri dish. 727
728
Figure 02 Surface plot a) and related contour plot b) of the percentage of adsorbed atrazine as a function of the reduction 729
process parameters (temperature and time). 730
731
Figure 03 a-c) SEM images of rGO film reduced at 110 °C; d) XRD patterns of GO (black line) and rGO film reduced 732
at 110 °C (red line); e) FTIR spectra of GO and reduced GO at 110 °C; XPS survey of rGO at 110 °C (f) and C1s region 733
(g); BET isotherm (h) for GO (black square) and rGO (red circle) and (i) BJH pores average volume and diameter for GO 734
(black line) and rGO (red line) 735

28
736
Figure 04 Adsorption isotherm plots described according to the linearized adsorption models of Langmuir (a) and 737
Freundlich (b) and reported for all the involved triazine. 738
739

Figures
Figure 1
Triazines used in this work: a) Atrazine, b) Atraton and c) Prometryn; Graphenic materials used assorbent: d) pristine GO sponge obtained by freeze drying the aqueous dispersion and e) rGO �lm obtainedby simple evaporation of the solvent in a petri dish.
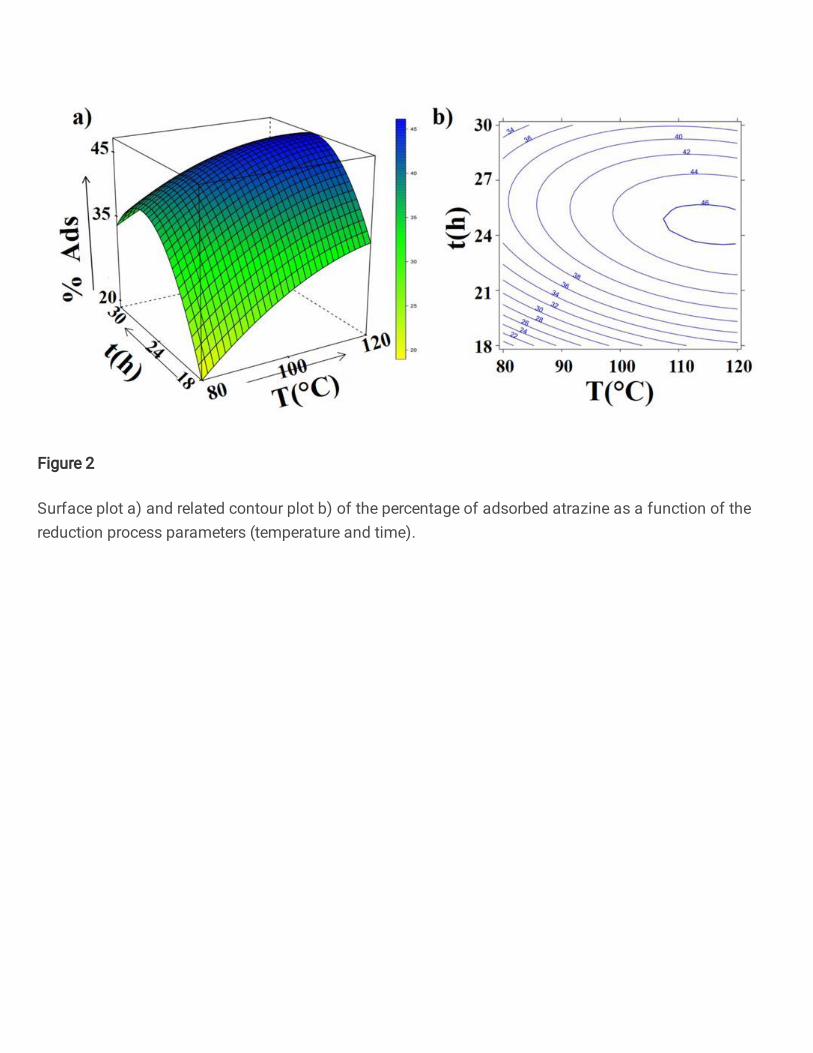
Figure 2
Surface plot a) and related contour plot b) of the percentage of adsorbed atrazine as a function of thereduction process parameters (temperature and time).

Figure 3
a-c) SEM images of rGO �lm reduced at 110 °C; d) XRD patterns of GO (black line) and rGO �lm reducedat 110 °C (red line); e) FTIR spectra of GO and reduced GO at 110 °C; XPS survey of rGO at 110 °C (f) andC1s region (g); BET isotherm (h) for GO (black square) and rGO (red circle) and (i) BJH pores averagevolume and diameter for GO (black line) and rGO (red line)

Figure 4
Adsorption isotherm plots described according to the linearized adsorption models of Langmuir (a) andFreundlich (b) and reported for all the involved triazine.
Supplementary Files
This is a list of supplementary �les associated with this preprint. Click to download.
AbstractImage.jpg
SupportingInformationFile.docx