Embed Size (px)
Citation preview

This is an electronic reprint of the original article.This reprint may differ from the original in pagination and typographic detail.
Powered by TCPDF (www.tcpdf.org)
This material is protected by copyright and other intellectual property rights, and duplication or sale of all or part of any of the repository collections is not permitted, except that material may be duplicated by you for your research use or educational purposes in electronic or print form. You must obtain permission for any other use. Electronic or print copies may not be offered, whether for sale or otherwise to anyone who is not an authorised user.
Körgesaar, Mihkel; Romanoff, Jani; Remes, Heikki; Palokangas, Pekka
Experimental and numerical penetration response of laser-welded stiffened panels
Published in:International Journal of Impact Engineering
DOI:10.1016/j.ijimpeng.2017.12.014
Published: 01/04/2018
Document VersionPublisher's PDF, also known as Version of record
Please cite the original version:Kõrgesaar, M., Romanoff, J., Remes, H., & Palokangas, P. (2018). Experimental and numerical penetrationresponse of laser-welded stiffened panels. International Journal of Impact Engineering, 114, 78-92. DOI:10.1016/j.ijimpeng.2017.12.014

Contents lists available at ScienceDirect
International Journal of Impact Engineering
journal homepage: www.elsevier.com/locate/ijimpeng
Experimental and numerical penetration response of laser-welded stiffenedpanels
Mihkel Kõrgesaara,⁎, Jani Romanoffa, Heikki Remesa, Pekka Palokangasb
a Aalto University, School of Engineering, Department of Mechanical Engineering, PO BOX 14300, FI-00076 Aalto, FinlandbAlten Finland, Kivikonkierto 18, FI-05460, Hyvinkää, Finland
A R T I C L E I N F O
Keywords:Panel indentationStiffened panelDuctile fractureTensile testingFracture simulations
A B S T R A C T
Ductile fracture in large structures is often resolved with non-linear finite element (FE) simulations employingstructural shell elements which are larger than localization zone. This makes solution element size dependentand calibration of material parameters complex. Therefore, the paper explores the ability of numerical simu-lations to capture the penetration resistance of stiffened panels after determining steel material fracture ductilityat different stress states. The numerical simulations are compared with experiments performed with rigidly fixed1.2 m square panels penetrated with half-sphere indenter until fracture took place. Response of the panels wasmeasured in terms of indentation force versus indenter displacement. In parallel, tensile tests were performedwith four different flat specimens extracted from the face sheet of panels to characterize the material fractureductility at different stress states. Panel simulations were performed with two fracture criteria: one calibratedbased on the test data from dog-bone specimen and other calibrated based on the data from all tensile tests. Toevaluate the fracture criteria in terms of their capacity to handle mesh size variations, mesh size was varied fromfine to coarse. Results suggest that fracture criterion calibrated based on the range of stress states can handlemesh size variations more effectively as displacement to fracture showed considerably weaker mesh size de-pendence.
1. Introduction
1.1. Background
Growing awareness of environmental risks related to storage andtransportation of chemicals and fossil fuels provides strong incentive todevelop impact and collision resistance structures. Thin-walled struc-tures such as ships transporting hazardous substances are especiallyvulnerable to puncture due to the collision and grounding that con-stitute as the most frequent accident type [1]. Resulting chemical or oilspill poses a devastating effect on the marine ecosystem [2], but alsoinvolves high acute costs through clean-up operations especially inremote and sensitive areas [3] in addition to indirect effect to economicactivities in the region [4].
While the pre-emptive risk management approaches and analyzesare the most effective means to combat the occurrence of these acci-dents [5–7], the performance of the ship structure during the accidentdetermines the degree of seriousness and consequence. Therefore, un-derstanding the whole damage process under localized loads and abilityto simulate fracture in large thin-walled structures is a crucial step from
mere assessment of structural failure, towards structures where mate-rial fracture is carefully engineered to occur in a desired, well con-trolled manner. Moreover, this understanding lends itself for successfulholistic safety assessment procedure including post-accidental floodingsimulation where size of the opening plays an important role [8,9].
Therefore, penetration resistance of stiffened steel plates has beenextensively studied experimentally and numerically. Recent review byCalle and Alves [10] covering numerical material fracture modellingapproaches in ship crash analysis highlights the high computationalcost of the analysis and consequent restriction to large structural shellelements. While computationally efficient, the size of the large struc-tural shell elements imposes restrictions on how the fracture initiationand propagation can be modelled in large structures [11]. When shellelements are used together with element erosion technique to representfracture, the main challenge is to select the appropriate numericalfracture strain as it depends on the element size and stress state. Forinstance, benchmark analysis by Storheim et al. [12] where simulationsand experiments of three different stiffened shell structures werecompared showed that fracture criteria are in general not sufficientlyaccurate with respect to the stress-state and mesh dependence.
https://doi.org/10.1016/j.ijimpeng.2017.12.014Received 17 July 2017; Received in revised form 7 November 2017; Accepted 14 December 2017
⁎ Corresponding author.E-mail address: [email protected] (M. Kõrgesaar).
International Journal of Impact Engineering 114 (2018) 78–92
Available online 15 December 20170734-743X/ © 2017 The Authors. Published by Elsevier Ltd. This is an open access article under the CC BY-NC-ND license (http://creativecommons.org/licenses/BY-NC-ND/4.0/).
T
One factor that contributes to the large scatter in results is the lackof experimental data where both, material and structural behaviour, arereadily available. Clearly, the full-scale ship collision and groundingexperiments are invaluable in providing the insight to the whole col-lision process [13,14], but the high cost and difficulty of separatinginternal and external mechanics makes detailed damage and deforma-tion mode assessment unreliable. Instead, structural tests with scaledstructures are preferred where penetration resistance of structures isassessed in controlled laboratory environment, e.g. see the review byCalle and Alves [10] and more recent experimental-numerical in-vestigations by Morin et al. [15] and Gruben et al. [16]. Although thesetests map the most important failure modes observed in full-scale ex-periments, including the fracture under different stress states, accom-panying tensile tests were performed only under uniaxial tension.Thereby, fracture strain used in simulations ignored the effect of stressstate [17,18] or stress state effect was calibrated only based on uniaxialtensile test, e.g. [19,20]. Moreover, fracture strain sensitivity to elementsize (mesh size dependence) is also established based on the singlestress state, although it is well established that mesh size dependencerelates to the amount of strain localization prior to fracture and thus,depends on the stress state. Consequently, in these attempts to resolvefracture strain scaling based on a single stress state lead to inconsistentresults with respect to discretization. While calibration based on singletest is efficient and attractive especially in design practice, the objectiveof this work is to show the enhanced consistency, and thus reliability, ofthe FE solution when fracture strain and its element size sensitivity iscalibrated based on different tensile tests.
Therefore, we experimentally determined the penetration resistanceof laser welded stiffened steel panels deformed quasi-statically withrigid indenter and performed tensile tests that cover range of stressstates. Stiffened panels are common structural elements in ship andoffshore structures. Tensile tests were repeated at least twice to checkthe validity of the experimental set-up, and thus confirm the repeat-ability of the tests. Data acquisition in panel experiments comprisedindentation force and displacement of the indenter. Although material
ductility in heat affected zone can considerably change compared withbase material, the present investigation is limited to fracture in baseplate.
1.2. Limitations
The main motivation for the paper is to test the fidelity of existingFE simulation approaches for bridging the fracture ductility informa-tion from small coupon scale tests to large structural components. Thisrelates to the concern for low velocity ship collision impacts. However,the investigation excludes the strain rate effect to the extent whereeffect can be observed on material behaviour and dynamic effects onthe deformation mode. Such a quasi-static analysis method is often usedand justified in engineering practice when the principal features ofstructural response under low velocity impact are well captured by thequasi-static method [21]. In the latter, it is demonstrated in that error ofquasi-static analyses in beam impact problem reduces with increasingmass ratio between striking and struck object. Adopting the sameprinciple to a 90-degree ship collision between two similar size ships,might suggest why most of the ship collision analysis neglects the dy-namic effects, see e.g. [22]. For all the practical purposes, it is rea-sonable to approximate the mass of the striking ship much higher, sincethe mass of the struck ship can be approximated by the mass of theconfined region between rigid bulkheads that is damaged during thecollision event. Strain rate effects, on the other hand, are excludedbecause of the lack of robust method which formulates the combinedeffects of element length, stress triaxiality and strain rate on the ductilefracture strain under the plane stress shell element framework. Fur-thermore, it is generally agreed that in ship collision analysis inclusionof strain-rate effects is detrimental to simulation accuracy withoutcareful calibration [23], and analysis excluding strain-rate effects areconservative as the estimated indentation into the struck vessel de-creases with increasing strain-rate hardening that in turn leads tosmaller opening size.
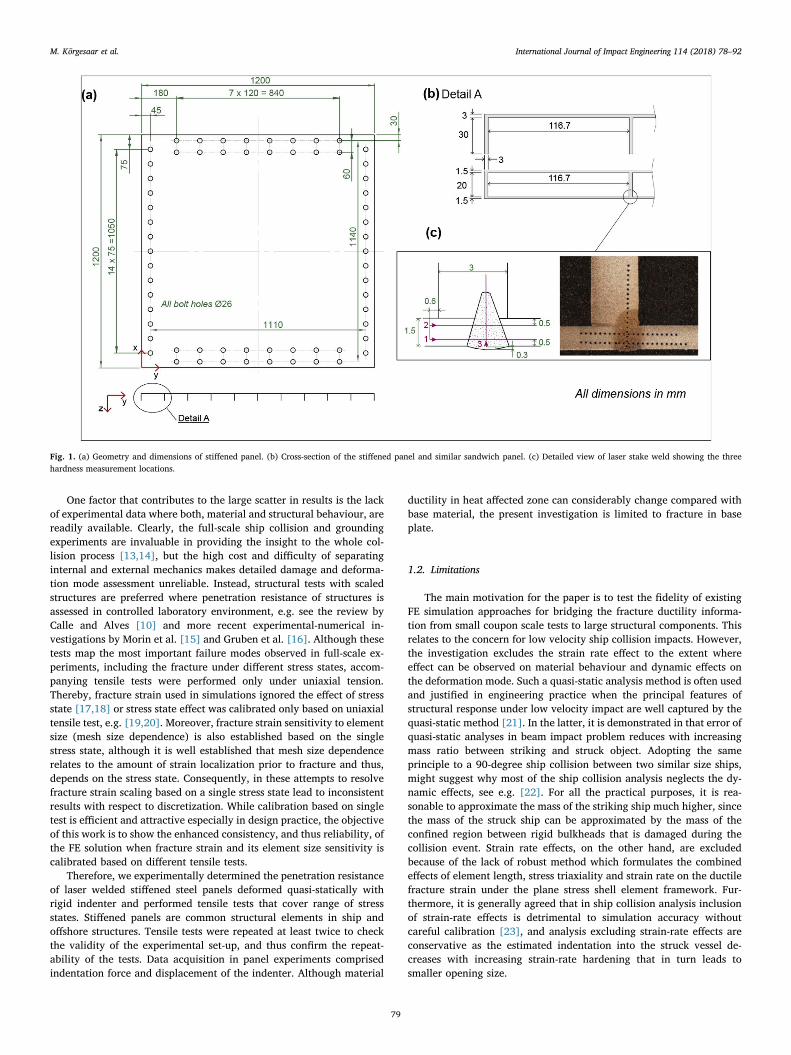
Fig. 1. (a) Geometry and dimensions of stiffened panel. (b) Cross-section of the stiffened panel and similar sandwich panel. (c) Detailed view of laser stake weld showing the threehardness measurement locations.
M. Kõrgesaar et al. International Journal of Impact Engineering 114 (2018) 78–92
79

2. Experiments
2.1. Laser welded panel design
Laser welded stiffened (SP) steel panels were manufactured byKoneteknologiakeskus in Turku, Finland from steel sheets produced bySSAB. Geometry and theoretical dimensions of panels are shown inFig. 1. Stiffener spacing is about 120mm. Face plates and stiffeners arewelded together with laser stake welds. Welding laser was 10 kW IPGfiber laser with Precitec YW52 laser welding optics, where collimationlength was 200mm, focusing length 300mm and process fiber width200 microns. Welding power was 3–4 kW and speed 2m/min speed.Before welding long seams, plates were spot welded together. Laserwelding is becoming increasingly popular in shipbuilding industry as itallows low levels of welding distortion at high productivity rates [24].However, highly localized heat input and cooling rates can lead tostrength and toughness mismatch between base and weld material,which can affect the joint ductility especially during large deformationsand constrained geometries [25]. Therefore, to examine the jointproperties, hardness measurements were performed on stake weldcross-sections cut from the sandwich panels produced along with thestiffened panels reported in this paper, see Fig. 2(b). Although the faceplate in sandwich panels was 1.5 mm thick, we presume that results arestill applicable for stiffened panels. Hardness profile measured from asandwich panel laser stake weld is shown in Fig. 2. The hardness ofweld metal is twice the one measured in base material. Although ac-cording to DNV-GL Guidelines in [26] welds are not exceptionallybrittle and their behaviour can therefore be assumed ductile, the duc-tility of the material in HAZ can considerably differ from the basematerial as shown in [15,27]. Nevertheless, by presuming that hardnesslinearly correlates with yield and tensile strength of the steel as shownin [28], fracture initiation was anticipated to take place in the basematerial that was also confirmed by the experiments. Furthermore,since the exact determination of material properties in HAZ would re-quire additional effort, e.g. [29], it is not attempted herein, and theuncertainty related with welds and their modelling is left out of thescope of present investigation.
2.2. Experimental set-up and program
The quasi-static indentation experiments were conducted at theStrength of Material laboratory in Aalto University. Test set-up used inexperiments is shown in Fig. 3. Hydraulic force cylinder with capacityof 1MN was mounted with M24 bolts on the middle of the loading
frame. Loading frame was installed on two loading plates on the floor,each having load-carrying capacity of 1MN. Applied indentation forcewas measured with 1MN force transducer connected to bottom end ofthe force cylinder. Bulb indenter was mounted on force transducerusing adapter in between. Adapter was used to shift indenter closer tothe panels because of the limited cylinder stroke. Indenter had a po-lished surface finish. Indenter could rotate during indentation to protectforce sensor from bending moments. Four springs were installed be-tween indenter and force sensor to prevent movement of indenter inunloaded position. These springs were enough to suppress the indenterrotations before fracture initiation and even during early stage offracture propagation.
Multiple panel experiments motivated a clamping and support de-sign configuration that allowed fast assembly as well as removal ofspecimens after tests. The assembled configuration is illustrated inFig. 4(a), where the square panel specimen is fully edge clamped be-tween two picture frame type support plates made from standardstructural steel S355. The back-support plate was bolted to an I-beamframe resting on a concrete support base. A 25mm diameter, 62-holepattern with internal (female) threads in a back-support plate allowededge clamping the test panels with top support (clamping) plate. Edgeclamping was achieved by 62 M24 bolts (grade 10.9) with external(male) treads without using a traditional nut. A tightening torque of800Nm was used delivering a total clamping force of∼9 MN. Clampingwidth in all edges was 120mm resulting in a 960×960mm squarecentre opening or the exposed area of panels. To avoid collapse of thepanels from edges under clamping loads steel inserts were used assupports. Height and width of the inserts was designed to ensure snugfit into the enclosed space. I-beam support frame was built from Eur-opean wide flange beams (DIN 1025/EN 10034 HE600B) fastened to-gether with grade 8.8 M24 steel bolts using four corner brackets. Ad-ditional spacer plates were used between brackets and support frame toadjust the beams into correct positions with respect to each other. FEsimulations were performed beforehand to ensure the sufficient stiff-ness and strength of the frame.
In total 5 tests were performed with stiffened panels, while onepanel (SP3) was used for tensile specimen cutting. The full test matrix isshown in Table 1. In the first test (SP1) the indentation location wasbetween 3rd and 4th stiffener (y=300mm) from the panel edge.However, in that configuration asymmetric boundary conditions de-veloping during the loading caused excessive indenter rotations due towhich we s stopped the test prior to fracture. Therefore, in rest of thetests focus was on the centre indentation and confirming the repeat-ability of tests. Contact initiation point in tests was verified by pushingthe indenter against a piece of Blu–Tack adhesive placed on the panels.Location of the imprint was measured and is reported in Table 1 withrespect to the coordinate system in the panel corner (see Fig. 1(a)).
2.3. Measurements
Indenter displacement was measured with HBM WA500 displace-ment transducer mounted between piston and cylinder. Accuracy of500mm sensor was validated with 100mm sensor (HBM WA100) atsmall displacements. Vertical deflection of the loading frame wasmeasured with 10mm HBM WA10 displacement transducer. Movementof force cylinder was displacement controlled during indentation withmaximum displacement of 300mm. To minimize the strain rate effects,indenter velocity was set to 10mm/min. Penetration was manuallystopped in all experiments at the point where indenter started to rotatedue to the asymmetric post-failure resistance.
Furthermore, to track the panel deformations during tests two high-speed cameras were installed under the panel, see Fig. 4(b). Camerasused in experiments featured camera body Basler acA2000-340 km andlenses Edmund Optics Techspec #59-870 with 16mm focal length and#63–243 with 8mm focal length. Cameras were positioned to capturedeformations of the middle of the plate directly under the indenter. The
500 1 2 3 4 5 6 7
100
150
200
250
300
Measurement location (mm)
Vick
ers
hard
ness
(HV
10) BM HAZ WM
Line 1Line 2Line 3
Fig. 2. Hardness profile measured over laser stake weld of sandwich panel. BM refers tobase material, HAZ denotes heat affected zone and WM weld material. For definition oflines 1 to 3 see Fig. 1(c). Y-axis units HV10 refer to diamond pyramid hardness valueunder test conditions of 10 kg/mm2, which can be correlated with yield and tensilestrength, see Ref. [28].
M. Kõrgesaar et al. International Journal of Impact Engineering 114 (2018) 78–92
80

16mm lenses were focused so that the sharpest images were formed onassumed indentation depth determined with preliminary FE simula-tions. To compensate for inevitable decrease in light due to smallaperture and consequent under-exposure, LED lights were assembledinside the support structure. However, first experiments showed thatfracture propagated outside of the camera view, thus 8mm lenses wereused instead. Hence, sharp images were obtained throughout the out-of-plane penetration process by maximizing the depth of field with thesmallest possible aperture of the lens (f16).
2.4. Tensile tests
Panels are made from standard structural steel S235JR commonlyused in shipbuilding. To gain more detailed insight to the materialbehaviour and characterize its plane stress fracture properties at dif-ferent stress states a set of tensile tests were performed. While a stan-dard tensile, i.e. dog-bone (DB), specimen shown in Fig. 5(a) is commonto characterize material stress-strain behaviour, rest of the specimenswere designed to obtain approximately constant stress statesthroughout the loading history up to the instant of fracture initiation,see [30]. All the specimens were extracted from the face sheets of thepanels using band saw machine. The length direction of the specimenscorresponds to the direction of stiffeners in panels. The final dimensionswere achieved by wire electric discharge machine (EDM).
A central hole (CH) specimen shown in Fig. 5(b) was used tocharacterize the material ductility under uniaxial tension. Comparedwith dog-bone specimen (DB) where stress triaxiality ( =η σ σ/ ,h meanstress divided by equivalent von Mises stress) shifts from uniaxial ten-sion (1/3) at the point of necking to plane strain tension (1/ 3 ) atfracture [31], stress triaxiality in the central hole specimen remainsnearly constant as confirmed with the preliminary FE simulations.These simulations also showed that hole dimensions affect the stresstriaxiality in the fracture location. The best convergence of triaxialitytowards uniaxial tension at the point of fracture was obtained with4mm diameter hole following the recommendations of Roth and Mohr[30].
To characterize material at plane strain (1/ 3 ), notched tensile (NT)specimen shown in Fig. 5(c) was used. Preliminary FE simulationsshowed that notch geometry has significant effect on the stress triaxi-ality at the point of fracture initiation. The final geometry of the notch
was obtained by iteratively changing the geometry until the stresstriaxiality was close to plane strain tension throughout the loadinghistory.
Shear (S) specimen design shown in Fig. 5(d) was motivated by Rothand Mohr [30] and Till and Hackl [32]. Roth and Mohr [30] showedthat resulting fracture strain in the specimen is sensitive to the geo-metry of the shear gauge section as well as the material properties.Therefore, we used the geometry from [30] optimized for DP590 steelas a “seed”. However, the preliminary simulations with this seed geo-metry led to the neck development outside of the desired gauge section– in the central region of the specimen between the edge cutouts. Byincreasing the distance xc from 3.18mm (seed geometry) to 4.38mm asshown in Fig. 5(d) we could prevent the neck development outside ofthe gauge.
Quasi-static tensile tests were performed at room temperature with3mm thick specimens using a 100 kN MTS servo-hydraulic universaltesting machine with an MTS Teststar Controller for displacementcontrol. Specimen thickness was measured in two locations along thegauge, and the average value is given in Table 2. The cross-head ve-locity of the actuator ranged from 0.2 mm/min to 2mm/min, de-pending on the specimen, see Table 2. During testing, the force (usingload cell) and displacement (MTS) were recorded. Additionally, dis-placement fields on one side of the specimen surface were measuredwith a high-resolution (2 Mpxl) digital camera Lavision Imager Pro X2M equipped with 105mm Nikon lens at a frequency of 2 Hz. Theimages were post-processed using a LAVISION digital image correlation(DIC) software to acquire local strain data. The system was set up sothat force signal from MTS is included in the DIC measurement data,which enabled correlating the force and displacements signals later inthe analysis. DIC measurements require speckle pattern on the mea-sured surface to identify individual points and track their movements.Two alternative approaches were used to create the speckle pattern onthe specimen surfaces. First, for easier control of the pattern resolutionand thus, adjustment for different field of views, the pattern was printedon a flexible tattoo paper (www.craftycomputerpaper.co.uk) and gluedon the specimens’ surfaces. Despite its flexibility, later analysis of DICcamera images and displacement fields showed that paper started topeel off and fail before steel material rupture. Therefore, as an alter-native speckle generation approach laser printer powder was in-troduced on the specimen surfaces using a fine steel net (mesh density
Fig. 3. Overview of the panel test set-up.
M. Kõrgesaar et al. International Journal of Impact Engineering 114 (2018) 78–92
81

of 0.125mm), which was permanently embedded on the surface uponheating the specimens in the furnace ∼30 min under 150°. Drawback ofthis method is that there is limited control over the quality of thepattern, which sometimes included larger inclusions with multiplespeckles overlapping, or conversely, whitespaces, where speckle densitywas scarce. Moreover, analysis of camera images showed that this ap-proach was also unreliable at large strains as speckles came loose fromthe specimen surface. An example of this is presented in Fig. 6 (a) and(b) where one relatively large speckle jumps from one position to an-other in consecutive frames. The final frame of the fractured specimenin Fig. 6(c) shows that the pattern has been completely lost.
2.5. Experimental results
2.5.1. Tensile testsForce-displacement (F-δ) curves of the tensile tests corresponding to
each specimen (servo-hydraulic test machine) are shown in Fig. 7.Additionally, for dog-bone (DB) and notched tension (NT) specimens F-δ curves are determined with DIC analyses corresponding to specificvirtual gauge length shown on the figure. DIC analyses of central-hole(CH) and shear (S) specimens were unsuccessful for reasons discussed inthe previous section and thus, are not shown. In general, specimensdisplay good repeatability with respect to force-elongation and dis-placement to fracture. The response shows a yield plateau clearly ob-servable from DB specimen response. In CH specimens, this yield pla-teau leads to a distinctive peak-slump feature at the initial stage ofdeformation. For each specimen, a selected camera image identifiedwith marker ① in a F-δ curve is shown overlaid with finite elementsimulation results and/or contours from DIC analyses. In CH specimens,fracture initiation is preceded by the width reduction (diffuse necking)on both sides of the hole. Fracture initiated from the hole boundarywhere cross-section was the smallest and gradually propagated, as in-dicated also by the slope of the F-δ curves in the final stage, outsidetowards specimen edges. The camera image was selected based on theload drop at displacement ①, which was considered a good indicator for
640
mm
deformedinitial
(b)
x
Back support plate(4 cm HSS)
Clamping plate(3 cm HSS)
stiffenedpanel
Indenter (R=120 mm)
Short steel insert(both sides x8)
Long steel insert(x2)
Connecting bracket (x4)
I-beam supports (x4)
Aperture 0.96 x 0.96 mM24 bolts
Spacer plate (x4)
(a)
bolt holes Ø25 mm
480 mm
480 mm
z
xy
Fig. 4. (a) Stiffened panel fixed to the clampingstructure. (b) Side view of the camera positioning(in case of 8mm lenses).
Table 1Test matrix.
Specimen ID Offset from panel corner
x (mm) y (mm)
SP1 618 300SP2 603 595SP4 598 593SP5 597 592SP6 597 593
M. Kõrgesaar et al. International Journal of Impact Engineering 114 (2018) 78–92
82

fracture initiation. The corresponding step in simulation was selectedbased on the perfect agreement between deformed shapes of tested andsimulated geometries in Fig. 7(a). At the succeeding FE step thisagreement was considerably worse. The displacement difference atpoint ① between simulation and experiment can be explained by thedifferences observed in elastic loading stage. In NT specimens, the lo-calized neck development was clearly observable from video analysis asthe bright grey band extending across the width, see Fig. 7(b). Thechosen image describes the situation few steps before fracture wasdetected on surface. The corresponding FE image at displacement ①waschosen again based on the geometry agreement between test and FEimage. The reference length of strain calculations is different betweenFE simulation and DIC analysis that explains the discrepancy in loga-rithmic strain in Fig. 7(b). We did not attempt to resolve this and reliedon comparison between MTS and simulation results in determining thefracture strain. In dog-bone (DB) specimen, the selected camera imageat ① was the last frame before DIC analysis became unreliable – the lossof data is already seen on the DIC contour image in Fig. 7(c). Since thefracture on surface was detected later as indicated in the F-δ curve, theselected fracture point in simulation does not correspond with the point①. Instead, the fracture in simulations was assumed to occur at the lastsimulation step. In shear (S) specimen, the point ① is selected based on
the final converged solution of the FE simulation to enable the com-parison of deformed configurations. As a general observation applicableto all tests, it should be noted that it is difficult to determine the exactpoint of initiation and thus, fracture displacements determined in a waydescribed have some error associated with them, e.g. see the discussionin [33]. Nevertheless, the error analysis was deemed unnecessary forthe current application where the final objective is to capture the re-sponse in large panels.
2.5.2. Stiffened panelsMeasured force-displacement (F-δ) relations in Fig. 8 indicate to
excellent test repeatability as curves practically overlap. Precipitousdrop in load suggests that panel response before fracture initiation isdominated by the membrane stretching. Fracture initiation occurs ap-proximately at 180mm indenter displacement and load of 550 kN atwhich point panel loses about 60% of its resistance. The second test(SP2) was only partly successful, presumably because of the improperassembly of the support structure. Consequently, force signal exhibits ajump at the indenter displacement of about 55mm, but final fracturedisplacement is still very similar to other measurements. After sub-sequent re-assembly of the set-up this problem was resolved.
Damaged panels are shown in Fig. 9. Despite of the very similar load
R6.66
R3.56R5.42
R4.8
60
60
xc=4.38
1.35
1.35
3.72
0.11
0.93 0.93
0.93
0.23
R0.
55
R1.81
(a) DB (b) CH (c) NT (d) S
230
R5
170
120
7
404040 20
16
4
Fig. 5. Specimens used in the study to characterize the material behaviour under different stress states. (a) Standard tensile or dog-bone specimen (DB), (b) central-hole (CH), (c) notchedtensile (NT), and (d) shear (S) specimen.
Table 2Test matrix for tensile specimens.
Specimen id. Thickness [mm] Width gauge [mm] DIC pattern Loading speed [mm/min] Step [pixel] Resolution [mm/pixel] Subset size [pixels]
DB-1-3 2.98 15.08 Print 2 5 0.072 39DB-2-3 2.99 15.04 Spray 2 5 0.072 39CH-1-3 3.01 20.05 Spray 1 5 0.014 39CH-2-3 3.00 20.02 Spray 1 5 0.014 39CH-3-3 2.99 20.01 Spray 1 5 0.014 39NT-1-3 3.00 – Print 0.2 5 0.015 39NT-2-3 3.00 – Print 0.2 5 0.015 39NT-3-3 3.00 – Spray 0.2 5 0.015 39S1-3 3.01 – Spray 0.2 5 0.014 29S3-3 3.01 – Spray 0.2 5 0.014 29
M. Kõrgesaar et al. International Journal of Impact Engineering 114 (2018) 78–92
83

and displacement response, neck development and consequently thefinal fracture path varied between tests. The final crack path is similarfor SP4 and SP6, although in SP4 panel fracture initiated in two loca-tions. First crack initiated in the plate field between two stiffeners andpropagated longitudinally. Upon further loading it was accompanied bythe second independent crack that extended transversally across thestiffener as shown in Fig. 9(a). Initially this second crack remained inthe plate field, but eventually stiffener was fractured as well. In contrastto SP4 and SP6, fracture in SP5 panel initiated on the opposite side ofthe stiffener where initial contact between indenter and plate occurred,see Fig. 9(b). The point of initiation was also closer to the middlestiffener compared with other panels. Thereon, crack underwent almoststraight propagation along stiffener direction without any branching.The contrasting response in crack path of the SP5 panel is rationalizedas follows. In SP5 panels the pattern that was intended for DIC mea-surements was, unintentionally, glued on the top side (contact side) ofthe panel in two rectangular patches. The employed adhesive con-siderably increased the friction between plate and indenter and thus, itis reasonable to presume that this is responsible for the different frac-ture path. Similar contrasting effect of friction on fracture path is oftenobserved in punch experiments with and without lubricants.
Fig. 10 shows the damaged section of the SP4 panel that was cutout. The high stiffness of the laser weld is obvious as weld has remainedintact. Stiffener has necked considerably before fracture as demon-strated by the severe thinning, which based on the comparison withintact tensile specimen could be in the range of 50%.
3. Numerical simulations
3.1. Material model
Equivalent stress - equivalent plastic strain curve −σ ε( ) up to largestrains is necessary input for numerical simulations of panel experi-ments. The −σ ε curve was determined based on the combined nu-merical-experimental inverse approach, e.g. [33]. The elastic propertiesof the materials were described by a Young's modulus of E=200 GPa,Poisson ratio of =ν 0.3, and density of 7850 kg/m3. von Mises yieldcriterion was used in the simulations assuming associated plastic flowand isotropic hardening. Strain hardening was described by a Swiftmodel extended by the Cowper–Symonds viscoplastic strengtheningfactor:
=⎧
⎨⎪
⎩⎪
⎡⎣
+ ⎤⎦
≤
+ ⎡⎣
+ ⎤⎦
>
( )( )
σσ ε ε
K ε ε ε ε
1
( ) 1
εC
pL
n εC
pL
0˙ 1/
0˙ 1/
(1)
where ε̇ is the equivalent plastic strain-rate, ∫=ε εdt˙ is the equivalentplastic strain, σ0 is the yield stress, and K and n are the parametersgoverning the work hardening. To account for the existence of theLüders plateau, the hardening is delayed until the plastic strain reachesthe plateau strain εL, while the parameter = −ε σ K ε( / ) n
L0 01/ enforces
continuity of the stress strain curve at =ε εL. The parameters C and pdefine the strain-rate sensitivity of the material. The initial estimate forthe hardening curve up to diffuse necking was obtained from the truestress-plastic strain ( −σ εp) curve calculated based on the dog-bone(DB) test response. Engineering stress and strain was calculated ass= F/A0, where F is the measured force and A0 is the initial cross-sectional area in the gauge section. Engineering strain was calculated ase=(l-l0)/l0, where l and l0 are the current and initial gauge length,respectively. Corresponding true stress and strain are thus obtainedas = +σ es(1 ) and = +ε eln(1 ), respectively. The logarithmic plasticstrain was calculated from = −ε ε σ E/p . Material flow curve beyonddiffuse necking strain was obtained with the aid of numerical simula-tions of central-hole (CH) specimen because the specimen exhibitedlargest strains prior to fracture initiation.
Numerical finite element simulations of the CH tests were per-formed with FE software Abaqus 6.13-3/Standard (implicit solver)using reduced integration solid elements (C3D8R). In developing the FEmodel, symmetry of the specimen geometry and loading was exploited– 1/8 symmetry (mid-width, -span, and -thickness). In-plane elementsize in the gauge region at the expected fracture location was 0.1× 0.1as shown in Fig. 12(a) with 10 elements through half-thickness. Aprescribed velocity was applied on the edge of the model. The velocitywas ramped up from 0 to 0.5mm/min over the first 20 s of the simu-lation using a smooth amplitude function. Thereby, the symmetricgauge region experienced the pre-necking strain rate of −3.33·10 3 s−1 asin experiment (gauge length where deformations localize is assumed tobe here 5mm). Initial simulations were performed with the flow curvewithout viscoplastic strengthening. This led to earlier softening com-pared with test as shown in Fig. 7(a) and motivated the extension of thematerial relation with strain-rate dependent term. The parameters de-fining strain-rate sensitivity were iteratively changed from their initialvalues of C=40 s−1 and p=5 characteristic to structural steels [34]while comparing response of CH simulations to measurements. Finalchosen parameters are C=25 s−1 and p=2.5. The parameters K and ngoverning the work hardening in Eq. (1) were determined by couplingthe Abaqus solver with the optimization toolbox of Matlab (see also[35]), wherein Neldear–Mead algorithm (function fminsearch) wasused to minimize the sum of squared difference between the simulatedand measured force-displacement curves. Because of the mismatchbetween elastic stiffness only plastic portion of the curves were com-pared during optimization. The final parameters are shown in Table 3below and the corresponding stress-strain curve is shown in Fig. 11.
The flow curve was validated by performing simulations with threeother tested specimens. The modelling principles involving discretiza-tion, boundary conditions, and loading scheme whereby pre-neckingstrain-rates are approximately equal to the test conditions were kept thesame. Only exception is shear specimen, which was modelled using 1/4symmetry instead of 1/8 symmetry. All FE models are shown in Fig. 12.The corresponding F-δ curves are compared with measurements inFig. 7. The best accuracy is exhibited by the CH and DB specimens. Incase of NT and S specimen, the peak force is slightly overestimated, but
Fig. 6. Image frames captured during S3-1 experiment illustrating the issues with speckle pattern created using laser printer powder. First two images are from consecutive frames andhighlight the sudden movement of one, relatively large speckle from one position to another. Last frame shows how pattern has been completely lost after final fracture.
M. Kõrgesaar et al. International Journal of Impact Engineering 114 (2018) 78–92
84

Fig. 7. Force-displacement curves from the (a) central-hole CH, (b) notched tension NT, (c) dog-bone DB, and (d) shear S tests and corresponding FE simulations. The yellow triangularmarker corresponds to simulation step based on which equivalent plastic fracture strain was determined. Notice that in right column pictures of (b) and (c) colour contours correspond tologarithmic strain as opposed to equivalent plastic strain shown in the figures (a) and (d). (For interpretation of the references to colour in this figure legend, the reader is referred to theweb version of this article.)
M. Kõrgesaar et al. International Journal of Impact Engineering 114 (2018) 78–92
85

remained within 10% accuracy. This inaccuracy could be potentiallyreduced by adopting yield criterion that recognises the reduced capa-city in plane strain tension [36], but was not attempted here.
3.2. Stress triaxiality dependent fracture strain calibration
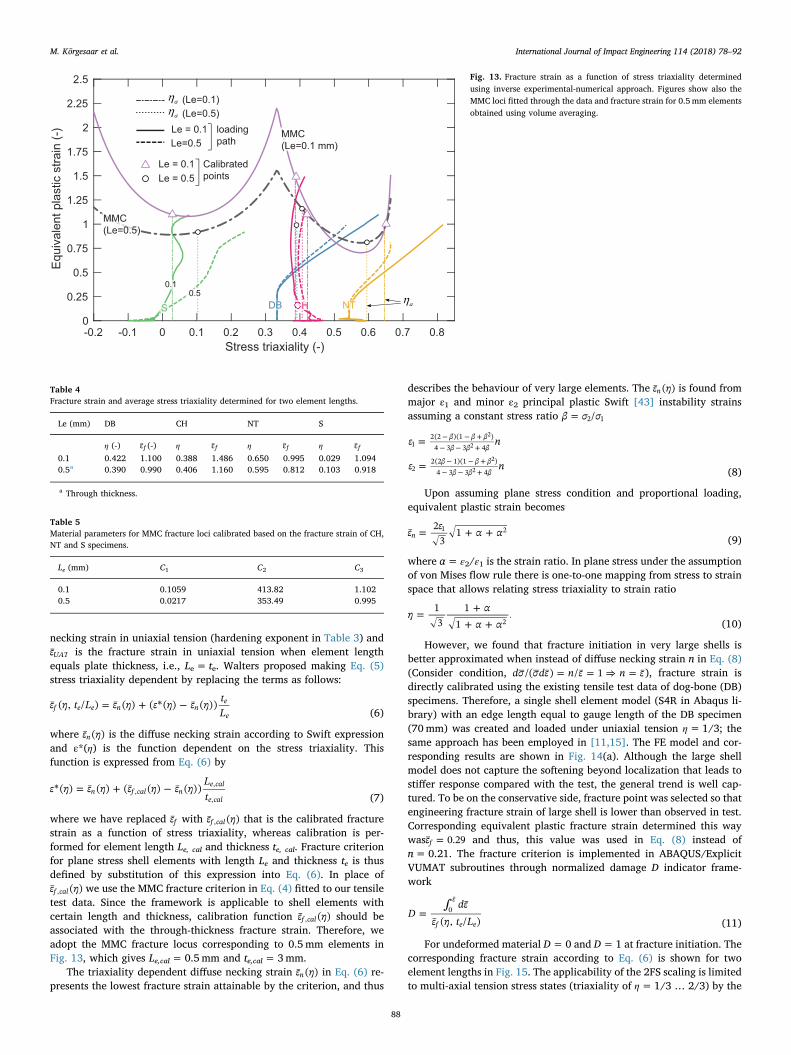
To simulate ductile fracture in panels fracture strain dependent onstress triaxiality was calibrated based on the four tensile tests. Theequivalent plastic strain at fracture, i.e. fracture strain, was determinedbased on the F-δ curves shown in Fig. 7 and is marked therein with thetriangular marker. Fracture strain in the most critical element in eachsimulation is plotted as a function of average stress triaxiality ( −ε ηf a)in Fig. 13 (triangular marker). Average stress triaxiality is calculatedwith the following integral expression over the load history as it variesthroughout the simulation:
∫=ηε
ηdε1a
f
ε
0
f
(2)
Average stress triaxiality and corresponding fracture strain aregathered in Table 4. Fig. 13 shows that fracture strain is clearly de-pendent on the specimen type. The notched tension (NT), dog-bone(DB), and shear (S) specimens exhibit almost the same fracture ductilitywhile it is considerably higher in central hole (CH) specimen. Despitethe similar average stress triaxiality at failure between DB and CHspecimens, the large difference in ductility can be rationalized due tothe significantly different loading history experienced by the most cri-tical elements as displayed in Fig. 13. To gauge the sensitivity of thefracture strain due to element size, equivalent plastic strain and stresstriaxiality history until fracture are given also for 0.5 mm elementlength (ε η,0.5 0.5). These quantities are obtained by through-thicknessaveraging of the solid model results over ∼0.5×0.5 mm2 area:
= ∑
= ∑=
=
ε ε V
η η V
·
·V i
ni i
V in
i i
0.51
1
0.51
1
el
el(3)
where subscript i is used to distinguish the quantities corresponding toindividual elements in models shown in Fig. 12, V denotes volume andnel is the number of elements over which the averaging is performed.The plastic strain history determined this way is also shown in Fig. 13together with fracture point marked with circular marker. Values aregiven in Table 4. The chosen volume averaging approach was preferredover shell element simulations as it allowed determining the fracturestrain for all cases. When shell element simulations with NT specimenswere attempted using 0.5× 0.5 mm2 mesh, a physically unrealisticsolution was obtained whereby deformations localized in the single rowof elements at the peak load. It is worth mentioning that the volumeaveraging approach in CH specimen resulted in fracture strain whichwas the same (difference less than 1%) as obtained with 0.5mm shellelements.
3.3. Fracture criteria and scaling
One of the motivations of this work is to investigate the accuracy ofnumerical simulations of large components after material fractureductility characterization with more than one test. The benefit ofmultiple tensile tests is insight to stress state dependent material frac-ture ductility, but how this local material information is bridged to
0 50 100 150 200 250Displacement (mm)
0
100
200
300
400
500
600
Forc
e (k
N)
SP2SP4SP5SP6
Fig. 8. Measured force-displacement curves of the stiffened panels.
Fig. 9. Fracture has initiated in face plate in all experiments. After initiation, all specimens showed unique crack development. In SP2, crack has grown gradually and broken a stiffener.SP4 fracture has same characteristics but fracture is more circular. Main crack is parallel with the stiffeners whereas second branch goes perpendicularly through a stiffener. SP5 featuressingle smooth crack. Ductile damage mechanism in form of necking can be observed in all specimens.
M. Kõrgesaar et al. International Journal of Impact Engineering 114 (2018) 78–92
86

simulations of large structural components is addressed here. In otherwords, the familiar setting arises where the fracture strain calibrated bytensile tests must be appropriately scaled to consider the mesh de-pendency of the FE solution. Thereby, accuracy of numerical simula-tions with large elements depends on the fracture criterion as well as onthe fracture strain scaling framework.
3.3.1. Two-factor scaling or 2FS criterionIn this fracture modelling approach fracture strain scaling depends
on both the element size (element size take as element length tothickness ratio, Le/te) and stress triaxiality, thus in the following it isdenoted as two-factor scaling or 2FS criterion for brevity. We adoptModified Mohr–Coulomb (MMC) plane stress fracture criterion that iswell-established for prediction of fracture in small structural compo-nents [37–39]. The criterion is given as in Li et al. [39]:
= ⎧⎨⎩
⎡⎣
+ + ⎤⎦
⎫⎬⎭
= ⎡⎣− ⎤⎦
= ⎡⎣− ⎤⎦
= + − + −
+
−
−
−
−
{ }{ }
( )( )( )
ε f f C η
f η η
f η η
f C C f
cos arcsin
sin arcsin
(1 ) (1/ 1)
MMCKC
C f3
13 1 1 3
113
272
2 13
213
272
2 13
3 33
2 3 3 1
n
212 2
1
(4)
where K and n are work hardening parameters given in Table 3 and C1,C2, and C3 are material constants that must be determined to fit thefacture loci through fracture data in Fig. 13. These parameters werefound by optimization, see Table 5. Optimization was set up so thatdata points corresponding to DB specimens were neglected to capturethe increased fracture ductility exhibited by the CH specimens.Nevertheless, the obtained MMC fracture locus for 0.1mm length scalestill approximates the fracture strain of DB specimens quite well asshown in Fig. 13. For 0.5mm element length the fitted approximation isless accurate for DB specimen.
The MMC fracture criterion is adjusted for different element lengthsaccording to framework introduced by Walters [40]. The frameworkconsiders the fact that mesh size dependence of the fracture strainvaries depending on the stress state. In particular, representative vo-lume element simulations in [41] suggested that mesh size dependenceunder plane strain and equi-biaxial tension are weaker than underuniaxial tension, but more generally, sensitivity of the fracture straindepends on the difference between necking strain and fracture strain.The larger the difference, more sensitive is the FE solution to mesh size.The underlying idea of the framework is to replace the terms in com-monly used fracture scaling law for uniaxial tension [42]
= + −ε n ε n tL
( )f UATe
e (5)
with their stress state dependent counterparts. In Eq. (5) n is the diffuse
Fig. 10. Magnification view of the SP4 panel deformed section. (a) Specimen is completely cut into two pieces, but positioned in the photo so that upper part supports on the lower part.(b) Stiffener did not trip and displays a clear neck near the fracture location. (c) 3 mm tensile specimen placed next to the fractured stiffener highlights the significant thickness reductionprior to failure.
Table 3Material parameters for the hardening model.
σ0 (MPa) K (MPa) n (-) ɛL(-) C (s−1) p (-)
275 630 0.21 0.012 25 0.25
0 0.2 0.4 0.6 0.8 10
100
200
300
400
500
600
700
Exp. DB1-3 (until diffuse neck)Calibrated curveE
quiv
alen
t stre
ss (M
Pa)
Equivalent plastic strain (-)1.2
Fig. 11. Equivalent stress-plastic strain curves for standard tensile (dog-bone) samplestested in uniaxial tension to fracture.
Fig. 12. Symmetric finite element solid models used to validate the hardening curve. (a)Central hole CH, (b) dog-bone DB, (c) notched tension NT, and (d) shear S specimen.
M. Kõrgesaar et al. International Journal of Impact Engineering 114 (2018) 78–92
87
necking strain in uniaxial tension (hardening exponent in Table 3) andεUAT is the fracture strain in uniaxial tension when element lengthequals plate thickness, i.e., Le= te. Walters proposed making Eq. (5)stress triaxiality dependent by replacing the terms as follows:
= + −ε η t L ε η ε η ε η tL
( , / ) ( ) ( * ( ) ( ))f e e n ne
e (6)
where ε η( )n is the diffuse necking strain according to Swift expressionand ε*(η) is the function dependent on the stress triaxiality. Thisfunction is expressed from Eq. (6) by
= + −ε η ε η ε η ε ηLt
* ( ) ( ) ( ( ) ( ))n f cal ne cal
e cal,
,
, (7)
where we have replaced εf with ε η( )f cal, that is the calibrated fracturestrain as a function of stress triaxiality, whereas calibration is per-formed for element length Le, cal and thickness te, cal. Fracture criterionfor plane stress shell elements with length Le and thickness te is thusdefined by substitution of this expression into Eq. (6). In place ofε η( )f cal, we use the MMC fracture criterion in Eq. (4) fitted to our tensiletest data. Since the framework is applicable to shell elements withcertain length and thickness, calibration function ε η( )f cal, should beassociated with the through-thickness fracture strain. Therefore, weadopt the MMC fracture locus corresponding to 0.5mm elements inFig. 13, which gives Le,cal=0.5mm and te,cal=3mm.
The triaxiality dependent diffuse necking strain ε η( )n in Eq. (6) re-presents the lowest fracture strain attainable by the criterion, and thus
describes the behaviour of very large elements. The ε η( )n is found frommajor ε1 and minor ε2 principal plastic Swift [43] instability strainsassuming a constant stress ratio =β σ σ/2 1
=
=
− − +− − +
− − +− − +
ε n
ε n
β β ββ β β
β β ββ β β
12(2 )(1 )
4 3 3 4
22(2 1)(1 )
4 3 3 4
2
2
2
2 (8)
Upon assuming plane stress condition and proportional loading,equivalent plastic strain becomes
= + +ε ε α α23
1n1 2
(9)
where α= ε2/ε1 is the strain ratio. In plane stress under the assumptionof von Mises flow rule there is one-to-one mapping from stress to strainspace that allows relating stress triaxiality to strain ratio
= ++ +
η αα α
13
11
.2 (10)
However, we found that fracture initiation in very large shells isbetter approximated when instead of diffuse necking strain n in Eq. (8)(Consider condition, = = ⇒ =dσ σdε n ε n ε/( ) / 1 ), fracture strain isdirectly calibrated using the existing tensile test data of dog-bone (DB)specimens. Therefore, a single shell element model (S4R in Abaqus li-brary) with an edge length equal to gauge length of the DB specimen(70mm) was created and loaded under uniaxial tension η=1/3; thesame approach has been employed in [11,15]. The FE model and cor-responding results are shown in Fig. 14(a). Although the large shellmodel does not capture the softening beyond localization that leads tostiffer response compared with the test, the general trend is well cap-tured. To be on the conservative side, fracture point was selected so thatengineering fracture strain of large shell is lower than observed in test.Corresponding equivalent plastic fracture strain determined this waywas =ε 0.29f and thus, this value was used in Eq. (8) instead ofn=0.21. The fracture criterion is implemented in ABAQUS/ExplicitVUMAT subroutines through normalized damage D indicator frame-work
∫=D
dεε η t L( , / )
ε
f e e
0
(11)
For undeformed material D=0 and D=1 at fracture initiation. Thecorresponding fracture strain according to Eq. (6) is shown for twoelement lengths in Fig. 15. The applicability of the 2FS scaling is limitedto multi-axial tension stress states (triaxiality of η=1/3 … 2/3) by the
-0.2 -0.1 0 0.1 0.2 0.3 0.4 0.5 0.6 0.7 0.8Stress triaxiality (-)
0
0.25
0.5
0.75
1
1.25
1.5
1.75
2
2.25
2.5
Equ
ival
ent p
last
ic s
train
(-)
S DB CH NT
MMC(Le=0.5)
MMC(Le=0.1 mm)
(Le=0.1)aη
aη
(Le=0.5)
Calibrated points
aηLe = 0.1
Le = 0.1Le = 0.5
Le=0.5
0.10.5
loadingpath
Fig. 13. Fracture strain as a function of stress triaxiality determinedusing inverse experimental-numerical approach. Figures show also theMMC loci fitted through the data and fracture strain for 0.5mm elementsobtained using volume averaging.
Table 4Fracture strain and average stress triaxiality determined for two element lengths.
Le (mm) DB CH NT S
η (-) ɛf (-) η ɛf η ɛf η ɛf
0.1 0.422 1.100 0.388 1.486 0.650 0.995 0.029 1.0940.5a 0.390 0.990 0.406 1.160 0.595 0.812 0.103 0.918
a Through thickness.
Table 5Material parameters for MMC fracture loci calibrated based on the fracture strain of CH,NT and S specimens.
Le (mm) C1 C2 C3
0.1 0.1059 413.82 1.1020.5 0.0217 353.49 0.995
M. Kõrgesaar et al. International Journal of Impact Engineering 114 (2018) 78–92
88

Swift diffuse necking strain. Therefore, fracture strain for the range of−1/3< η<1/3 was assumed to be stress state independent and thesame as under uniaxial tension, η=1/3. The practical relevance of thisassumption to results was found to be negligible since analysis of si-mulation results showed that all elements failed under multi-axialtension regime (η=1/3 … 2/3).
3.3.2. Cockcroft–Latham criterionComparative simulations are performed with Cockcroft–Latham
(CL) criterion [44]. The sensitivity of the CL criterion to element sizecan be calibrated only based on the fracture strain determined withtensile test, which renders it much cheaper compared with the ap-proach presented above. Therefore, it has been lately employed indifferent experimental-numerical studies, see e.g. [15,20,27]. However,compared with scaling framework introduced in previous section frac-ture strain adjustment for different element size is also based on singlestress state. The aim is to test how this limitation affects the accuracy ofthe FE solution.
According to CL criterion failure occurs when integral of the max-imum principal stress along the plastic strain path reaches a criticalvalue. Wierzbicki and Werner [45] showed that the CL criterion can beexpressed as a function of stress triaxiality and this formulation isadopted herein. The criterion is again implemented in the ABAQUSVUMAT subroutine through damage D indicator framework wherebyelement is removed from simulation once the integral of the CL damagealong the plastic strain path reaches a critical value of 1. The damage inthe element is given as
∫=+ −
+ −D
εη η
η ηdε1 2
1 12 27
3 12 27c
2
2 (12)
where εcis a calibration parameter determined with dog-bone tensiletest simulations. For that purpose, dog-bone specimen was modelledwith S4R (Abaqus library) shell elements with the following edge lengthin the loading direction: Le=3, 3.75, 7.5 and 15mm. Loading andboundary conditions were defined similarly to solid models shown inFig. 12, except symmetry in thickness direction. Additionally, largeshell element result from previous section was utilized in calibration.The engineering stress-strain curves from the simulations are comparedwith experiment in Fig. 14(a). The calibration parameter determinedthis way is plotted as a function of element size (Le/te) in Fig. 14(b). Thefit through calibration points was fed into VUMAT subroutine alongwith Eq. (12). The CL fracture strain is also shown for two elementlengths in Fig. 15. Notice that the fracture strain at uniaxial tension(η=1/3) provided by the 2FS framework is close to the one de-termined with dog-bone tests (triangular marker) and used in CL cri-terion calibration. Thus, two criteria yield similar fracture strain atuniaxial tension.
3.4. Finite element modelling of panels
Stiffened panel material was modelled by with von Mises J2 flowtheory. The elastic properties, flow curve and fracture criteria cali-brated with tensile tests were used in the simulations. To test the strain-rate sensitivity of the panels additional simulations were performedwith rate-independent flow curve – in Eq. (1) the term in squarebrackets [•] was removed. These simulations without strain rate de-pendence were performed only with 2FS criterion.
FE simulations were performed with Abaqus/Explicit version 6.13-3using reduced integration shell elements (S4R) with default hourglasscontrol and 5 through thickness integration points. Fig. 16 illustratesthe assembly of the numerical model. Panel was the only deformingobject in the analysis, while indenter, top and bottom support as well asthe steel inserts were modelled with rigid material since no deforma-tions were observed in the experiments. The reference surfaces of theface plates were off-set for best representation of the actual topology asshown in Fig. 16. In the initial configuration, the indenter was placed sothat indenter hit location corresponds with SP4 panel test conditions asshown in Table 1 (x=598mm, y=593mm).
In developing the model, the adequacy of different boundary con-figurations, mainly the effect of modelling supports, was tested topredict the global deformations observed in the panels. As the panelsexhibited some pull-out from the clamping frame during experiments, it
Fig. 14. (a) Shell element simulation results compared with DB3-2 experiment. The pointwhere fracture was assumed to take place is shown with marker and plotted as a functionof Le/te ratio in figure (b). (b) Cockcroft–Latham calibration parameter determined withdog-bone specimens shown in figure (a) and corresponding fit.
Fig. 15. Fracture strain according to two criteria: 2FS and CL. Fracture strain is shown for2.5 mm and 7.5mm element size. Triangular marker denotes the Cockcroft–Latham ca-libration parameter.
M. Kõrgesaar et al. International Journal of Impact Engineering 114 (2018) 78–92
89

was included in the FE model. Clamping was implemented by dis-tributing the total clamping force of 9 MN (see Section 2.2) betweenareas representing the clearance holes of the bolts in the top support.Although this clamping arrangement permitted less pull-out than ob-served in experiments, it was deemed sufficient as the initial stiffness ofthe panels was accurately represented.
Contact between different objects was modelled with general con-tact algorithm by defining rigid objects as masters. Contact definitionincluded model for tangential and normal behaviour. Tangential be-haviour between surfaces was modelled with penalty type friction for-mulation with friction coefficient of 0.23. This friction coefficient wasselected based on the measurements performed in [17] who performedsimilar quasi-static indentation experiments with the same nominalstrength steel used herein. Contact behaviour normal to surfaces wasmodelled with “hard” pressure-overclosure relationship. Hard contactimplies that surfaces transmit contact pressure only when nodes of slavesurface (panel) are in contact with master surface (indenter). The in-dentation experiment was simulated by assigning a same constantvertical velocity as in experiments (10mm/min) to indenter, whileconstraining all other degrees of freedom. To speed up the simulationsmass of the entire model was scaled by a factor of 107. Contact regionbetween indenter and panel was discretized with three different ele-ment sizes to test the fracture scaling framework: Le=2.5mmLe=7.5mm (square shaped) and = = + = ∼L A 15 19.5 17e mm(rectangular elements). In rest of the model element size ranged from10 to 15mm.
4. Numerical results
In Fig. 17 simulated force-displacement results obtained with bothcriteria are compared with experimental curve. The comparison of peakforce in the zoom inset of Fig. 17(a) suggests that for all the practicalpurposes the FE solution is strain-rate insensitive. The global stiffness ofthe panels is slightly overestimated during indentation, especially athigher displacement. This could be explained by the slight pull-out ofthe panels during experiment (less than 10mm), which was not ob-served in simulations, or by the inaccuracies in calibrated flow curve.Notably, some inaccuracies were observed in modelling notched ten-sion and shear test.
We proceed to analyze the point of fracture initiation obtained withdifferent fracture criteria. With 2FS criterion the onset of fracture inpanels represented by the load drop in Fig. 17(a) is captured with goodaccuracy despite the large mesh size variations. The largest discrepancywith SP4 experiment is observed in simulations with finest mesh wherethe peak load is overestimated by 50 kN (9%). Simulations with coarsermeshes (7.5 and 17mm) capture the experimental load drop almostperfectly. In contrast, the analysis results with CL criterion in Fig. 17(b)show larger scatter in terms of fracture initiation, which implies to lesseffective fracture strain scaling. While the accuracy is excellent with2.5 mm model, coarse mesh models underestimate the peak load.
To gain further insight into the damage process snapshots of thedamaged panels are shown in Fig. 18. Fracture path is independent ofthe fracture criterion in 2.5mm model and very similar to SP4 ex-periments shown in Fig. 9(a): initially two independent cracks propa-gated and finally coalesced into one. 2FS criterion results in Fig. 18(a)
Fig. 16. General view of the stiffened panel FE model.
2.5 mm
17
0 50 100 150 200 250Displacement (mm)
0
100
200
300
400
500
600
Forc
e (k
N)
Test SP4
Rate-independent
7.5
179183
191
0 50 100 150 200 250Displacement (mm)
0
100
200
300
400
500
600
Forc
e (k
N)
2.57.5
179
156
138 mm
17
(a) (b)
Test SP4
Fig. 17. Experimental force-displacement curve compared with simulation results. (a) 2FS criterion. Zoom of the peak forces shows that strain-rate strengthening (dashed curves) hadminute effect on the response. (b) Cockcroft-Latham criterion.
M. Kõrgesaar et al. International Journal of Impact Engineering 114 (2018) 78–92
90

and (b) show that in contrast to 2.5mm model, the fracture in coarsemesh models initiated from the stiffener and then further into the platefield. This seems to affect also the final fracture path since in the7.5 mm model circumferential crack propagates on the other side of thestiffener with respect to initial contact point between indenter apex andplate. In 17mm model the final deformation pattern is also differentfrom the one obtained with 2.5 mm model. The coarse mesh modelsanalyzed with CL criterion in Fig. 18(c) on the other hand showed thatfracture always inititated from the plate field.
The analyses of stress state in fractured elements provided ex-planation for discrepancy in peak load estimation between CL and 2FScriterion. The load drop in Fig. 17 was confirmed to associate with thefracture initiation in the plate field. While fracture in stiffener occurredunder uniaxial tension η=1/3, majority of plate field elements failedbetween stress triaxiality of 0.6 to 0.65. Despite the similarities infracture loci plotted in Fig. 15, at these stress states 2FS criterion is lessmesh size sensitive and provides slightly higher fracture strain. There-fore, the accuracy of the 2FS criterion stems from the combination ofinput MMC criterion and employed scaling framework. Compared withCL criterion, MMC recognizes the higher fracture ductility under equi-biaxial tension while the scaling framework is able to discern reducedfracture strain sensitivity at higher stress triaxialities (0.6 to 0.65)compared with uniaxial tension.
5. Concluding remarks
The accuracy of non-linear finite element simulations to capturefracture initiation in stiffened panels is assessed under the
circumstances where material fracture ductility is known over a widerange of stress states. Therefore, quasi-static indentation experimentswere performed with laser-welded stiffened panels produced fromstandard marine structural steel. Although the relatively simple panelsdo not sample all the relevant deformation pathways, this apparentdrawback limits the number of modelling approximations, idealiza-tions, and assumptions. Panel material plasticity and fracture behaviourwere characterized with four different tensile tests: dog-bone, centralhole, notched tension, and shear specimen. The material true stress –strain curve was calibrated via inverse numerical-experimental ap-proach using central hole specimen and validated with rest of thespecimens.
In the numerical panel simulations, the element size was varied inthe range of 2.5 to ∼17mm. Two fracture criteria were used. First, acriterion denoted as 2FS was employed which requires lower and upperbound stress triaxiality dependent fracture strain. As an upper boundMMC fracture criterion was fitted to the fracture data obtained throughinverse approach. The fracture in panels was simulated employing ascaling framework whereby fracture strain is adjusted based on theelement length and stress triaxiality. Second, Cockcroft–Latham (CL)criterion was employed. Two criteria are distinguished by way how thefracture strain scaling with respect to element size is handled.According to 2FS criterion fracture strain sensitivity to element size isdependent on stress state, while CL criterion scales fracture strainuniformly across all stress states. This expediates the calibration processcompared with 2FS criterion. Nevertheless, the extra calibration effortpays off when observing the panel simulation results. The onset offracture was captured with excellent accuracy independent of
Fig. 18. Fracture propagation in stiffened panel simulations as viewed from bottom of the panels. (a) and (b) correspond to 2FS criterion and (c) shows the results of CL criterion. Colorcontours represent damage as calculated with Eq. (11) and Eq. (12).
M. Kõrgesaar et al. International Journal of Impact Engineering 114 (2018) 78–92
91

discretization length when employing 2FS criterion. In contrast, thefracture displacement and force obtained with CL criterion displayedstrong mesh size dependence.
This outcome shows the important role of fracture strain scalingframework especially in the context of conceptual design where “blind”numerical testing with coarse meshes is employed to gauge the sensi-tivity of different designs. The drawback of the approach is its ex-pensive scaling with multiple tensile specimens, although this cost isbelieved to reduce over time by development of material libraries andconcurrent recognition of trends that relate fracture ductility with stressstate. Furthermore, the framework is currently limited to multi-axialtension and thus, would need to be extended for other stress states. Theanalyses here were limited to base plate failure without considering theeffect of welds and related change in material properties. These issuesare left to be tackled in future investigations.
Acknowledgements
The financial support of The Scientific Advisory Board For Defence(MATINE) project with code 2500M-0058 is acknowledged with grati-tude. The total funding granted to Aalto University was EUR 106795.We would also like to thank CSC – IT Centre for Science Ltd. for pro-viding Abaqus package license and Reijo Lindgren from SIMULIAFinland for many valuable discussions regarding modelling issues.Appreciation goes also to Pauli Lehto (hardness measurements), OttoPuolakka (photos), Veijo Laukkanen, Kari Kantola, Olli Kamunen, KimWidell (experiments), and Prof. Sven Bossuyt (DIC) analysis.
References
[1] Soares CG, Teixeira AP. Risk assessment in maritime transportation. Reliab Eng SystSafe 2001;74:299–309.
[2] Lecklin T, Ryömä R, Kuikka S. A Bayesian network for analyzing biological acuteand long-term impacts of an oil spill in the Gulf of Finland. Mar Pollut Bull 2011;62.http://dx.doi.org/10.1016/j.marpolbul.2011.08.045. 2822–35.
[3] Montewka J, Weckström M, Kujala P. A probabilistic model estimating oil spillclean-up costs - a case study for the Gulf of Finland. Mar Pollut Bull 2013;76:61–71.
[4] García Negro MC, Villasante S, Carballo Penela A, Rodríguez Rodríguez G.Estimating the economic impact of the prestige oil spill on the death coast (NWSpain) fisheries. Mar Policy 2009;33:8–23. http://dx.doi.org/10.1016/j.marpol.2008.03.011.
[5] Goerlandt F, Montewka J. A probabilistic model for accidental cargo oil outflowfrom product tankers in a ship-ship collision. Mar Pollut Bull 2014;79:130–44.http://dx.doi.org/10.1016/j.marpolbul.2013.12.026.
[6] Valdez Banda OA, Goerlandt F, Montewka J, Kujala P, Banda OAV, Goerlandt F,et al. A risk analysis of winter navigation in Finnish sea areas. Accid Anal Prev2015;79:100–16. http://dx.doi.org/10.1016/j.aap.2015.03.024.
[7] Pedersen PT. Review and application of ship collision and grounding analysisprocedures. Mar Struct 2010;23:241–62.
[8] Hogström P, Ringsberg JW. An extensive study of a ship's survivability after colli-sion - a parameter study of material characteristics, non-linear FEA and damagestability analyses. Mar Struct 2012;27:1–28.
[9] Manderbacka T. Fast simulation method for transient flooding of a ship Doctoralthesis Aalto University publication series; 2015
[10] Calle MAG, Alves M. A review-analysis on material failure modeling in ship colli-sion. Ocean Eng 2015;106:20–38. http://dx.doi.org/10.1016/j.oceaneng.2015.06.032.
[11] Woelke PB, Abboud NN. Modeling fracture in large scale shell structures. J MechPhys Solids 2012;60:2044–63. http://dx.doi.org/10.1016/j.jmps.2012.07.001.
[12] Storheim M, Amdahl J, Martens I. On the accuracy of fracture estimation in colli-sion analysis of ship and offshore structures. Mar Struct 2015;44:254–87.
[13] Carlebur AFC. Full-Scale Collision Tests. Saf Sci 1995;19:171–8.[14] Wevers L, Vredeveld AW. Full scale ship collision experiments 1998 Delft: TNO;
1999. TNO-report 98-CMC-R0359.[15] Morin D, Kaarstad BL, Skajaa B, Hopperstad OS, Langseth M. Testing and modelling
of stiffened aluminium panels subjected to quasi-static and low-velocity impactloading. Int J Impact Eng 2016;0:1–15. http://dx.doi.org/10.1016/j.ijimpeng.2017.03.002.
[16] Gruben G, Morin D, Langseth M, Hopperstad OS. Strain localization and ductilefracture in advanced high-strength steel sheets. Eur J Mech A/Solids2017;61:315–29. http://dx.doi.org/10.1016/j.euromechsol.2016.09.014.
[17] Karlsson UB, Ringsberg JW, Johnson E, Hoseini M, Ulfvarson A. Experimental andnumerical investigation of bulb impact with a ship side-shell structure. Mar Technol2009;46:16–26.
[18] Liu B, Guedes Soares C. Experimental and numerical analysis of the crushing be-haviour of stiffened web girders. Int J Impact Eng 2016;88:22–38. http://dx.doi.org/10.1016/j.ijimpeng.2015.09.004.
[19] Alsos HS, Amdahl J, Hopperstad OS. On the resistance to penetration of stiffenedplates, part II: numerical analysis. Int J Impact Eng 2009;36:875–87. http://dx.doi.org/10.1016/j.ijimpeng.2008.11.004.
[20] Gruben G, Sølvernes S, Berstad T, Morin D, Hopperstad OS, Langseth M. Low-ve-locity impact behaviour and failure of stiffened steel plates. Mar Struct2017;54:73–91.
[21] Jones N. Structural impact. Second edition Cambridge University Press; 2012.http://dx.doi.org/10.1017/CBO9781107415324.004. vol. 1.
[22] Liu B, Villavicencio R, Soares CG. Simplified analytical method to evaluate tankerside panels during minor collision incidents. Int J Impact Eng 2015;78:20–33.
[23] Storheim M, Amdahl J. On the sensitivity to work hardening and strain-rate effectsin nonlinear FEM analysis of ship collisions. Ships Offshore Struct 2017.
[24] Remes H, Varsta P. Statistics of weld geometry for laser-hybrid welded joints and itsapplication within notch stress approach. Weld World 2010;54:R189–207.
[25] Bezensek B, Hancock JW. The toughness of laser welded joints in the ductile{\textendash}brittle transition. Eng Fract Mech 2007;74:2395–419.
[26] DNV GL AS. Rules for classification ships Edition October 2015 Part 2 Materials andwelding Chapter 3 Non-metallic materials 2015:41.
[27] Wadley HNG, Borvik T, Olovsson L, Wetzel JJ, Dharmasena KP, Hopperstad OS,et al. Deformation and fracture of impulsively loaded sandwich panels. J Mech PhysSolids 2013;61:674–99. http://dx.doi.org/10.1016/j.jmps.2012.07.007.
[28] Pavlina EJ, Van Tyne CJ. Correlation of Yield strength and Tensile strength withhardness for steels. J Mater Eng Perform 2008;17:888–93. http://dx.doi.org/10.1007/s11665-008-9225-5.
[29] Gorji MB, Mohr D. Micro-tension and micro-shear experiments to characterizestress-state dependent ductile fracture. Acta Mater 2017;131:65–76. http://dx.doi.org/10.1016/j.actamat.2017.03.034.
[30] Roth CC, Mohr D. Ductile fracture experiments with locally proportional loadinghistories. Int J Plast 2015:1–27.
[31] Benzerga AaA, Leblond J. Ductile fracture by void growth to coalescence. Adv ApplMech 2010;44:169–305.
[32] Till E, Hackl B. Calibration of plasticity and failure models for AHSS sheets.Proceedings of the international deep drawing research conference IDDRG 2013.2013.
[33] Dunand M, Mohr D. Hybrid experimental-numerical analysis of basic ductile frac-ture experiments for sheet metals. Int J Solids Struct 2010;47:1130–43. http://dx.doi.org/10.1016/j.ijsolstr.2009.12.011.
[34] Choung J, Nam W, Lee J-Y. Dynamic hardening behaviors of various marinestructural steels considering dependencies on strain rate and temperature. MarStruct 2013;32:49–67.
[35] Gu G, Mohr D. Anisotropic Hosford-Coulomb fracture initiation model: theory andapplication. Eng Fract Mech 2015;147:480–97. http://dx.doi.org/10.1016/j.engfracmech.2015.08.004.
[36] Gruben G, Langseth M, Fagerholt E, Hopperstad OS. Low-velocity impact on high-strength steel sheets: an experimental and numerical study. Int J Impact Eng2016;88:53–171. http://dx.doi.org/10.1016/j.ijimpeng.2015.10.001. 1.
[37] Bai Y, Wierzbicki T. Application of extended Mohr – Coulomb criterion to ductilefracture. Int J Fracture 2010:1–20. http://dx.doi.org/10.1007/s10704-009-9422-8.
[38] Boyce BL, Kramer SLB, Fang HE, Cordova TE, Neilsen MK, Dion K, et al. The sandiafracture challenge: blind round robin predictions of ductile tearing. Int J Fract2014;186:5–68.
[39] Li Y, Luo M, Gerlach JJ, Wierzbicki T. Prediction of shear-induced fracture in sheetmetal forming. J Mater Process Technol 2010;210:1858–69. http://dx.doi.org/10.1016/j.jmatprotec.2010.06.021.
[40] Walters CL. Framework for adjusting for both stress triaxiality and mesh size effectfor failure of metals in shell structures. Int J Crashworthiness 2014;19:1–12. http://dx.doi.org/10.1080/13588265.2013.825366.
[41] Kõrgesaar M, Remes H, Romanoff J. Size dependent response of large shell elementsunder in-plane tensile loading. Int J Solids Struct 2014;51:3752–61. http://dx.doi.org/10.1016/j.ijsolstr.2014.07.012.
[42] Törnqvist R. Design of crashworthy ship structures Ph.D. thesis Technical Universityof Denmark; 2003. http://dx.doi.org/10.1007/s00726-011-1022-z.
[43] Swift HW. Plastic instability under plane stress. J Mech Phys Solids 1952;1:1–18.[44] Cockcroft MG, Latham DJ. Ductility and the workability of metals. J Inst Met
1968;96:33–9.[45] Wierzbicki T., Werner H. Cockcroft and Latham revisited - impact and crash-
worthiness laboratory report nr. 16, Technical report, MIT. 1998.
M. Kõrgesaar et al. International Journal of Impact Engineering 114 (2018) 78–92
92