Embed Size (px)
Citation preview

1
Experiment studies on vibro-acoustic behavior of a stiffened submerged Conical -
Cylindrical Shell subjected to Force and acoustic Excitation
Xian-zhong Wang1,2
, Quan-zhou Jiang2*Ye-ping Xiong3, Xin Gu2
Abstract
An experimental model was made to investigate the influence of force and acoustic excitation on the vibration and underwater sound radiation of the
stiffened conical-cylindrical shell. Meanwhile a coupled precise transfer matrix method (PTMM) and wave superposition method (WSM) was also
proposed to analyze vibro-acoustic responses of combined shells. To test accuracy of present method, vibration and acoustic results of combined
shells are firstly examined. As expected, results of present method are in excellent agreement with the ones in literature and model test. The
experimental results show that free vibrations of the experimental test are consistent with the literature data and the present method’s results. Forced
vibration and acoustic test results are also well agreed with the numerical results from the coupled PTMM/WSM. The comparisons show that the
coupled PTMM/WSM is reliable and credible to solve the vibro-acoustic response of combined shells. The analysis shows that the acoustic excitation
is the key factor for radiated noise in low frequency range. However, the radiated noise resulted from force excitation is dominant in mid-high
frequency band.
Key words
A conical-cylindrical shell; vibration; sound radiation; Acoustic excitation; Experiment;
Introduction*
Widely used in aeronautical and naval industry, the ring-stiffened conical-cylindrical shell is one of the most normal
structural of mechanical engineering, the radiated noise of which is a classic acoustic-structure interaction problem.1-2
There is a lot of literature research on vibration and sound radiation of various shells (spherical shell3, cylindrical shell
4
and conical shell5) and some attentions on the structure dynamic analysis of conical-cylindrical shells have been made
public.6-17
Regarding the numerical analysis of sound radiation of submerged elastic structure, several numerical methods such as
finite element method (FEM), boundary element method (BEM) and coupled FEM/BEM are available to predict and
analyze the acoustic problem. The traditional way of FEM18
is to transform an infinite domain problem into a finite field
problem by defining artificial boundary conditions; While because of its requirement for the Green function, BEM19
is
well-suited for the infinite domain problem; The vibration and sound radiation of submerged elastic structures can be
predicted directly by coupled FEM and BEM.20
Liu and Chen21
used a coupled FEM/BEM to analyze the vibration
response of submerged cylindrical shells in conjunction with the wave number theory. The effect of mass distribution and
1 Key Laboratory of High Performance Ship Technology (Wuhan University of Technology), Wuhan 430063, PR China 2 School of Transportation, Wuhan University of Technology, Wuhan 430063, PR China 3 Fluid Structure Interactions, Faculty of Engineering and Physical Sciences, University of Southampton, Southampton, SO17 1BJ England, UK
Corresponding author: Xian-zhong Wang, Wuhan University of technology, Luoshi Road 122, Wuhan, Hubei, P.R. China E-mail address: [email protected]

2
isolation in a submerged hull was investigated by developing a fully coupled finite element/boundary element (FE/BE)
model.22
The fluid-structure interaction problem can be solved by constructing the low order shape functions and
generating the discrete element meshes. Due to these fundamental assumptions, the development of FEM and BEM is
now limited in many prospects. As the frequency increases, the number of required elements and memory space will surge
increase sharply, and computational efficiency reduces seriously in contrast.
The vibro-acoustic response of a few simple structures such as spherical shells3, cylindrical shells
4 can be calculated
directly by the analytic method. Due to the cone vertex of conical shell5, tension-bending coupling term in the constitutive
equation increases the mathematical complexity and calculation difficulty. There are many researchers paying attention to
the vibration and sound radiation of the cylindrical shell, but paying attention to acoustic characteristics of combined
shells is less. Caresta and Kessissoglou23
analyzed a submarine’s acoustic responses under harmonic force excitation. In
order to improve the computational efficiency and frequencies, Wang et al. 24
developed a precise transfer matrix method
(PTMM) and solved a set of first order differential equations to obtain vibro-acoustic responses of submerged stiffened
combined shell and conical shells. Qu et al. 25
predicted the vibration and acoustic behaviors of circumferential and
longitudinal rings stiffened submerged spherical-cylindrical-spherical shells. An improved variational method combined
with a way of multi-segment partitioning was present to formulate the coupled stiffened shell model, whereas a Kirchhoff-
Helmholtz integral formulation is used to simulate the exterior fluid.
The present work aims to analysis the noise and vibration results of experiment model, which was constructed to
simulate a submerged stiffened conical-cylindrical shell under the acoustic and force excitation. To the authors’
knowledge, there are few references concerning vibro-acoustic behavior of combined shells in force and acoustic
excitation case. The authors tested the experiment model to obtain the combined shell’s free vibration, forced vibration
and acoustic response in air and water. The structural and acoustic responses were also determined by a coupled
PTMM/WSM, which is suitable for assessing distributive systems’ vibro-acoustic responses. Two models of combined
shells from Refs. [11-12,23] were employed to compare with results from the coupled PTMM/WSM method verify its
effectiveness, which is also proofed by comparison between the present method and experiments results. Meanwhile the
vibration and sound radiation characteristics of the stiffened combined shell is investigated under different types of
excitation.
Experimental research
As shown in Figure 1a, the experimental model is a single ring-stiffened conical-cylindrical shell. And welding wasn’t
considered to accord with the theoretical model. The material properties of the conical-cylindrical shell are as follows:
Length 1L =0.2113m, 2L =0.5m, oL =0.5m, Radius R =0.25m. The combined shell thickness is t =4mm. The stiffener’s
sectional dimension is 40mm 4mm, and its spacing is lV =0.1m. The density is =7850 3kg m , the elastic modulus is
E =206GPa and its Poisson's ratio is =0.3. 15 mm thick caps are set at the ends of the experimental model. Equipped
with a fixed exciter (BK 4809) and a non-directional dodecahedron sound source (BK 4292L) as primary exciting forces,
the stiffened conical-cylindrical shell is approximately axisymmetric.

3
The vibration measurement system is composed of anechoic tank, hammer, vibration exciter, signal generator, power
amplifier, data acquisition device, acceleration sensor, force sensor, and hydrophone. The anechoic tank is 8 m in length,
4 m in width and 3 m in depth. The wedge-shaped sound absorption cone is installed on the inner surfaces of the water
pool. The anechoic tank and test model are shown in Figure.1c and Figure. 2a.
A patch (10 mm in diameter) screwed to a shaker is glued on the inner surface of the combined shell. The exciter is
fixed on the both end caps to excite the point with cylindrical coordinates (x, r, θ) = (0.25m, 0.25m, 0) in which x= 0 is at
the bottom of the cylindrical shell segment. The force excitation type is sinusoidal, the amplitude of which is 1 N. There
are two components between the shaker and the patch: one is an impedance head (PCB-208C02) for the measurement of
acceleration and force, another is a threaded rod which allows a punctiform radial excitation acting on the shell. There is a
flexible rope to connect the hoisting machine and the model. A hydrostatically balanced loading is employed to be located
on the shell’s top cover. Taking advantage of the axial symmetries of the combined shell, a series of measuring points
along the circumferential and axial direction can be arranged to obtain the vibration acceleration. 10 acceleration sensors
(PCB-352C03) are set to measure the radial vibration acceleration of the outer surface for several cases. The positions of
these sensors as shown in Figure2b are located at Position1 (0.09m, 0.25m, 0), Position2 (0.17m, 0.25m, 0), Position3
(0.25m, 0.25m, 0), Position4 (0.33m, 0.25m, 0), Position5 (0.41m, 0.25m, 0), Position6 (0.625m, 0.1778m, 0), Position7
(0.25m, 0.25m, π/2), Position8 (0.25m, 0.25m, π), Position9 (0.625m, 0.1778m, π/2) and Position10 (0.625m, 0.1778m, π).
Vibration solution for combined shells
Based on Flȕgge shell theory, the equations of revolutionary shell can be written in the matrix differential equations
d
d
ZU Z F p
(1)
where T
s s s su v w M V N S %% % %%% % %Z is a state column vector. The quantities u%, v%,… marked with superscript
score are dimensionless variables, respectively. These dimensionless state variables satisfy
1
2 20
, , , , , , , , , , sin2
o s s s
s s s o o
n
h KN KV KMu w N V M h u h w n
R RR R
% % %%% % (2a)
1
20
, , cos2
s
s o
n
KSv S h v n
R
%% (2b)
where u, v and w are the respective displacement components in the axial, circumferential and radial directions. 0,1
denotes symmetric and anti-symmetric mode. R, oh is the radius and thickness of the cylindrical shell segment. K
=
3 212 1oEh is bending rigidity. The coefficient matrix U relates to ( s R is the dimensionless variable), and
the nonzero elements are given in Ref. [9]. F and p are respectively the external driving forces and fluid load.
The conical-cylindrical shell can be separated into several parts, and the node coordinates arek , k=1, 2, 3, …, N-1
respectively. So, k and
1k are the adjacent coordinates, and satisfies
1k k . Hence, Eq (1) can be solved by the
following equation

4
1 0 10
( ) ( ) ( ) ( )k k ke d
U
Z Z r
(3)
where 0 ( )l e U can be obtained by precise integration method.
9
The effect of stiffeners on the shell is reflected on the variation of the state vector. Internal forces (moment , shear and
axial force) are changed between left section L
k and right section R
k of the stiffener at a position k , at where the shell
and the stiffener are connected together. The state vectors kZ satisfy
R L
k k kr Z T Z
(4)
where L
kZ and R
kZ respectively denote state vectors of the left section and the right section. krT is the point transfer
matrix for kth stiffener.
The relation between the displacement , , ,c c c cu v w of conical shell component and the displacement , , ,u v w of the
cylindrical shell component should keep continuous, as shown in Figure. 3. Then the displacement connection conditions
at the junction can be deduced as
cos sin ,
sin cos ,
c c c
c c c
u u w v v
w u w
(5)
Likewise, the relation between internal forces of conical shell component , , ,s s s s
c c c cN S V M and the cylindrical shell
component , , ,s s s sN S V M should maintain the balance, as shown in Figure. 3. The force compatibility condition at the
junction can be derived as
cos sin ,
sin cos ,
s s s s s
c c c
s s s s s
c c c
N N V S S
V N V M M
(6)
Based on the internal forces and displacements connection conditions, the state vectors at the junction satisfy
( = ) = ( = )L con cyl R
cyl cons L s LZ TP Z (7)
where = L
cyls LZ and = R
cons LZ respectively denote state vectors of the left section and the right section at the junction.
con cylTP denotes the 8×8 point transfer matrix.
Numerical solution of Acoustic response
Geometrically similar to the real boundary S, a virtual boundary S inner the model is constructed to avoid singular
integral, as shown in Figure 4. According to the potential theory, the fluid load p can be derived as
,S
p P O K P O dS
(8)
where O and P are the coordinates of the virtual source point and field point, respectively. O is the function of the
virtual source strength density. And ,K P O is the function of virtual source strength. The distance
,d P O between
point P and point O satisfies 2
2 2 2 cosP O P O P Or r r r z z . P O denotes the relative angle. To avoid the non-
unique problem at characteristic frequency, the distance d is defined by complex 1 i d .26
Based on a complex

5
Fourier series , the unknown distributed function O can be expanded as
2
, ~O
Oim L
inLmn
n m
O c e e n
(9)
The source strength function ,K P O can also use a complex Fourier series. Replace Eq. (8) by Eq. (9), divide M equal
divisions from 0 ~ L and N equal divisions from 0 ~ 2
Pin
mn mn
n m
p P c K P e
% (10)
where 21
1 2
221 1
1 2
0 0
2( ) , ,
O
M N inkimkNM
mn L
k k
LK P K P k k r e e
MN
% % is generalized fluid load for a prescribed wave number (m, n). L is
the length of combined shell’s meridian line. Because M and N divisions is the power series of 2, mnK P% can be
calculated quickly and accurately by discrete Fourier transform method.
The normal derivative of the sound pressure can also use a complex Fourier series to expand as
, Pin
mn mn
n mP
p Pc K P O e
n
%%
(11)
where 21
1
1 2
221 1
1 2
0 0
2( , ) ( , , )
kkM N inimNM
mn k
k k
LK P O K P k k r e e
MN
%% % .
Points i i= 1, 2, …, N, which are located on the meridian line of the combined shell, satisfy the boundary condition of
Neumann. For a prescribed wave number n. Then the Neumann boundary condition can be derived in matrix as
2
0n i n n i K c w , ~n (12)
where , 1,
T
n m n m n mnc c c Lc and 0 is the surrounding fluid media’s density. ,n m n iK K , i=1, 2, …, N and
1 -1
T
n n n N n Nw w w Lw .
The ith rib state vector iZ should satisfy R L
i i ir Z T Z . irT denotes the point transfer matrix for ith rib. After
considering the effect of ribs, then we can get
1 1 1( ) ( ) , 1,..., 1i i i i i N Z Z Z P (13)
where 1 1expj j j
T U , 1
1 1exp ( )j
jj j d
P U r .
The governing equations of the combined shell can be integrated by gathering Eq. (13). Based on boundary conditions,
find the line numbers of determinate state vectors in 1Z , NZ , and delete relevant rows in the coefficient matrix, the
governing equations can be got as

6
212 8
323 8
434 8
8
8
0 0 0 0
0 0 0 0
0 0 0 0
0 0 0 ... 0
0 0 0 0 NNN
((
MM((
PZT I
PZT I
PZT I
I
PZT I
(14)
The state vectors f
n Z can be obtained under the generalized sound pressure mnK or external load F directly. The
determinant of the coefficient matrix in Eq (14) can be expanded to obtain the dispersion equation.
According to the linear superposition method, the radial displacement on the surface S can be described as
f p
n n mn mn
m
w P w P c w P
% % %
(15)
where f
nw P% , p
mnw P%are respectively the state vectors under the external load P%F and generalized sound pressure mnK
.
After replacing Eq. (12) by Eq. (15) and selecting q (q>2m+1) collocation points on the meridian of the surface S,
several linear algebraic equations can be described as
, ~n n n n U c Q
(16)
where 2
2 1 0j j
p
q m mn s mn sK P w P % %U , 2
1 0 j
f
q n sw P %Q . Unknown coefficient vector nc can be calculated directly by
Moore-Penrose generalized inverse method. Finally, the vibration and acoustic responses of the submerged combined
shell can be solved the coupled PTMM/WSM simply and effectively over a wide frequency range.
Results and discussion
Free vibration results and discussions
To verify the accuracy of the coupled PTMM/WSM method, A conical-cylindrical shell in Ref. [23] with free-free
boundary conditions was employed, of which the parameters are as follows: sin 0.08453startL R , L=0.2m, 1L R ,
=30°, R=1m, h =0.002m, =7800kg/m3, μ=0.3, 210E GPa . The comparison of the frequency parameter values
2
1R E is given to illustrate the feasibility and effectiveness of the presented method. As shown in Table 1,
the results calculated by the coupled PTMM/WSM are compared with corresponding results in Ref. [23]. The maximum
error margin between the literature data and the present method is within +/- 2%.
Another conical-cylindrical shell model in Ref. [11] was also borrowed to assess the precision and accuracy of this
method. The parameters of the combined shell are as followed: o18 , L=30m, R=1m, h =0.04m. The parameters of the
ring stiffener are: width b=0.06m and depth d=0.08m. And there are 7 rings in each cylindrical shell segment. The
material of shells and ring stiffeners are steel with =7800kg/m3, μ=0.3, 210E GPa . The results obtained by modified
variational approach in literature11,12
and experimental results are shown in Table 2. The maximum error margin between
the results in Ref. [12] and the present method is +/- 2% except the value at (n=2, m=1).

7
Stuck to the measuring points, acceleration sensors relate to the data acquisition system. And a force hammer is used to
thump structure model. The free vibration of the experiment model hoisted by a flexible rope is carried out by an impact
hammer (PCB 086C03) and several accelerometers (PCB 353B15) to obtain the natural frequencies and structural modes
by the vibration response analysis processing module (HBM Quantumx1615B). To verify the accuracy of vibration
responses, the natural frequencies values calculated by the present method are compared with the experimental results.
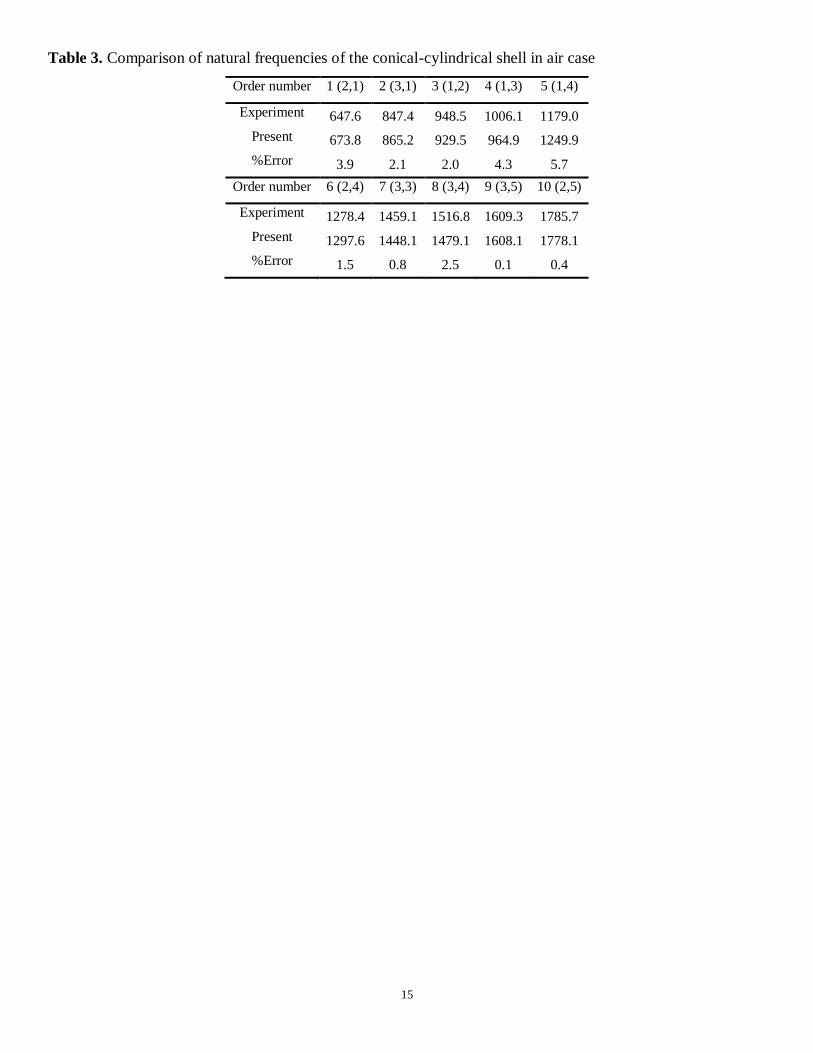
The first 10 orders of the natural frequencies values are given in Table 3, which include the numerical results and
experimental results.
Forced vibration results and discussion
The forced vibration tests under the exciter and the non-directional dodecahedron sound source excitation is respectively
carried out in air and water condition. During this process, a sinusoidal single frequency signal is generated as the input
signal. To amplify the signal, the power amplifier is driven with the linear sweep frequency (100Hz-2500Hz). The data
measured by acceleration sensors is transformed into vibration acceleration level by formula 020lgaL a a , where a is
the test value and 0a = is the reference acceleration value 1e-6 m/s-2.
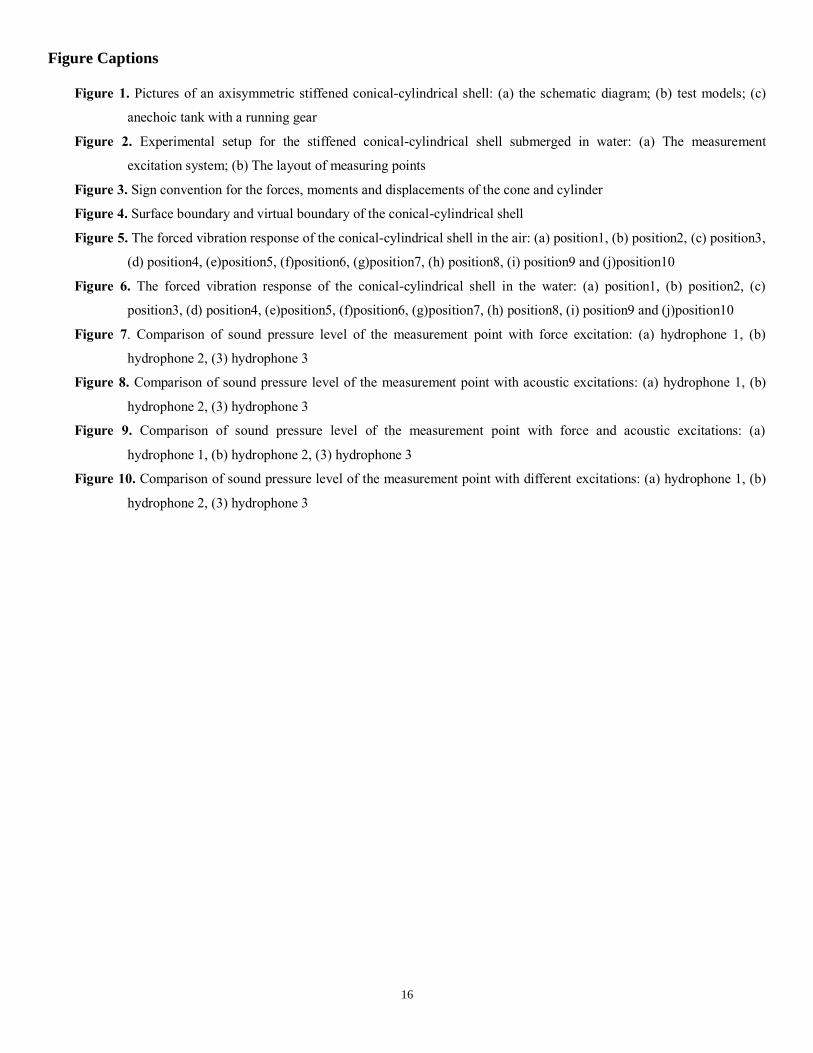
In the air condition, the ten measured points’ acceleration data was disposed to obtain the acceleration level in the
frequency band. The coupled PTMM/WSM is also employed to calculate the vibration response of the experimental
model. The boundary conditions of the both ends are supposed to be clamped. The vibration response under the force
excitation is shown in Figure 5. Apparently the variation tendency of the both frequency response curves are consistent. In
the 100~500Hz band, the vibration response curves predicted by the coupled PTMM/WSM coincided very well with
experimental curves, except some loss of resonance peaks. It’s because that the peak frequency 141Hz and 224 Hz is
corresponding to the nature frequencies of the end cap. Although the both vibration response curves have a little
difference at the resonance peak in the range of 500~2000Hz, the results from the present method are still consistent with
experimental values in the air case. In the frequency up to 2500Hz, the resonance peak numbers of test model are more
than that of the coupled PTMM/WSM, and acute fluctuation also appears in phase advance and peak position. In authors’
view, the difference between two curves is partly because of the local vibration of the end caps and seal flanges. Also, the
conditions of actual boundary cannot be perfectly like the clamped boundary. But in general, the results show that the
present method is reliable, from which the results are also credible.
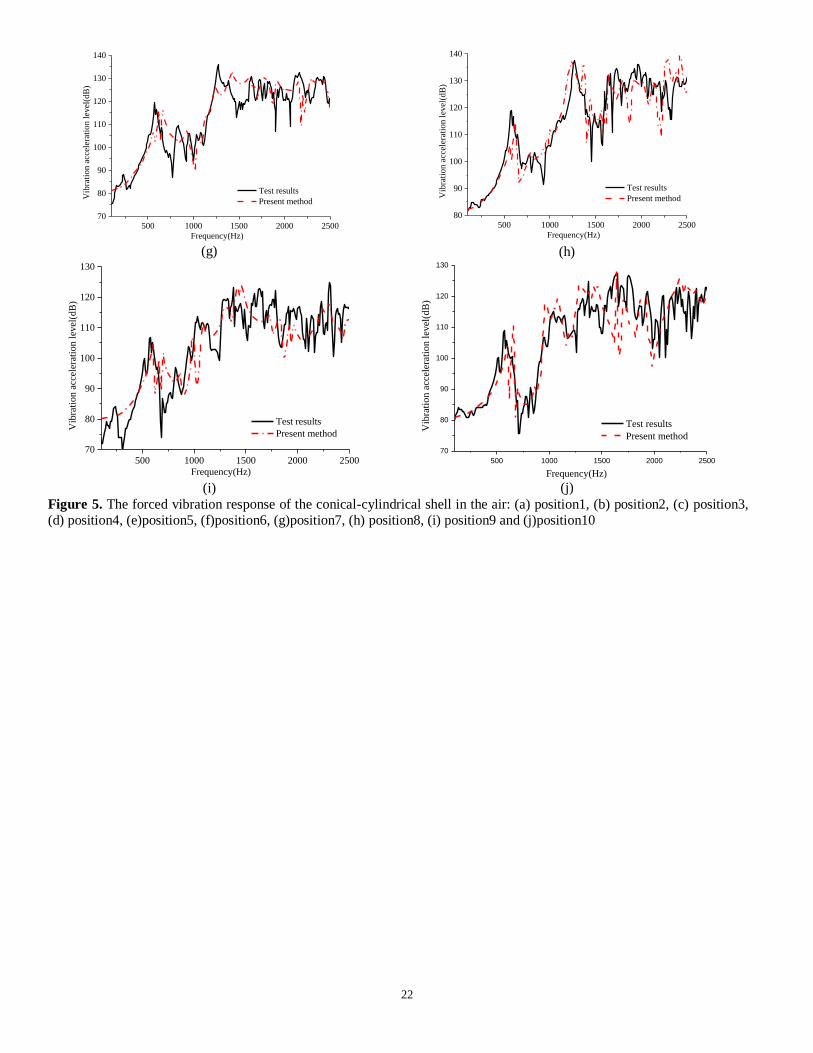
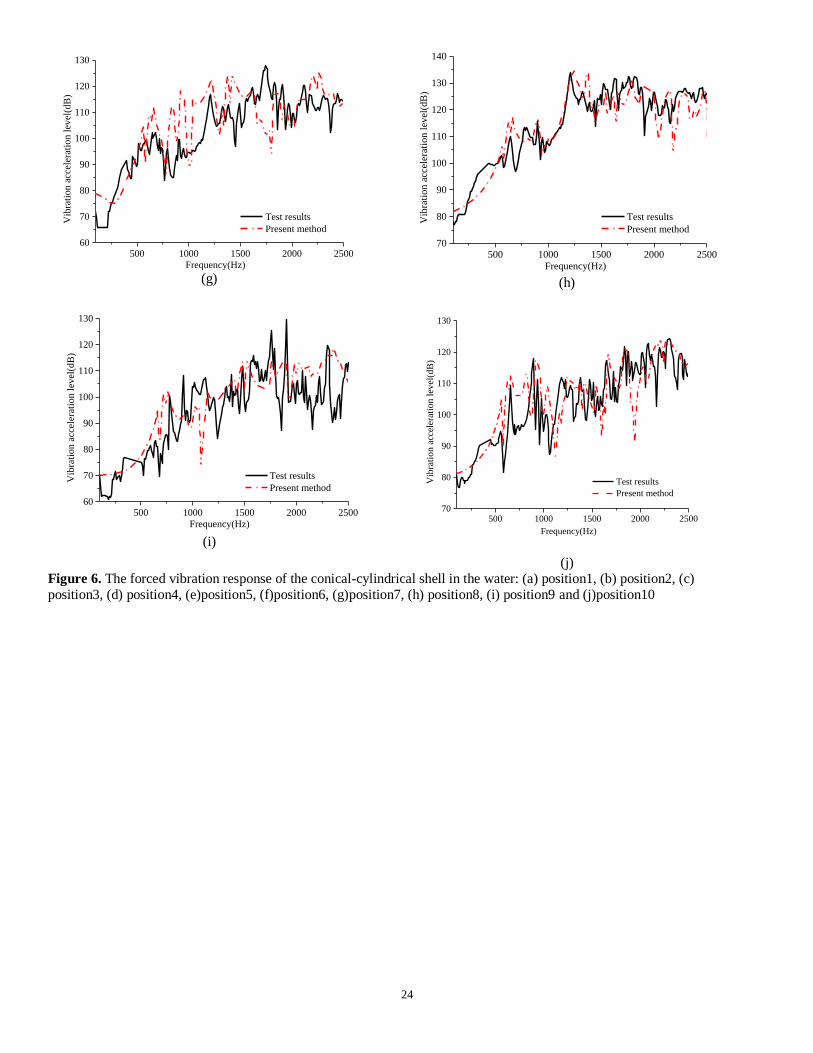
As shown in Figure 6, the forced vibration responses of the submerged conical-cylindrical shell were also carried out in
frequency of 100-2500Hz. In both air case and water case, the first ten natural frequencies (see Table 3) are in good
agreement with the peak frequencies of forced responses curves (see Figure 5 and Figure 6). Although there is some
obvious difference between two curves in the 100~600Hz band, the vibration variation trend predicted by the coupled
PTMM/WSM is basically consistent with experimental values. The existence of water leads to a strong structure-acoustic
coupling interaction. The experimental results have some resonance peaks resulting from global vibration modes of entire
test model and local vibration modes of end cap and the sealing flange. However, the numerical model does not contain
these vibration modes. In the 600~1500Hz band, the results from the coupled PTMM/WSM are consistent with

8
experimental results. The experiment results and the numerical results still are a little different at the peak frequencies. In
the 1500~2500Hz range, the peak numbers of experiment model are more than that of numerical model. There is an
obvious difference between the both frequency response curves, partly because of the local vibration of end cap and
model. As a group, the results from the present method are consistent with the vibration trend of the experimental results.
Radiated noise results and discussion
As shown in Figure 2, before submerging into the anechoic tank, the conical-cylindrical shell model and the two end caps
are sealed with water sealant. The signal generator generated the input signal, and drove the shaker and the non-
directional dodecahedron sound source to work. The surrounding fluid is water with the density of 1000kg/m3 and the
sound velocity of 1500m/s.27
Then the noise from the vibrating surfaces of the conical-cylindrical shell was radiated into
the water. As seen in Figure 2b, there are 3 hydrophones (BK-8104) arranged 1.0 m far from the surface outside the shell
to measure the sound pressure in the anechoic tank. In the case of force and acoustic excitation with the linear sweep
frequency (100 Hz-2500Hz), the data is transformed into a sound pressure level 020lgpL p p , in which p is the
experimental test data and 0p is the reference pressures 1 Pa .
Comparison between the experimental results and numerical results of measuring points (hydrophone 1, hydrophone 2
and hydrophone 3) under the force excitation is shown in Figure 7. Although the both vibration response curves have a
little different at the resonance peak in the range of 500~2500Hz, the sound pressure results from coupled PTMM/WSM
are consistent with experiment results. When air is full in the internal medium of the test model, the coupling of acoustic
cavity mode and structural mode has little effect on the vibro-acoustic response of the conical-cylindrical shell. The sound
radiation computed by the coupled PTMM/WSM is related to the structural vibration mode with force excitation. It
suggests that the coupling of acoustic cavity mode and structural vibration mode can be neglected. The results from the
coupled PTMM/WSM miss some resonance peaks compared with the experiment results in the frequency of 1000-1500
Hz. As the investigation is performed, the analysis result of research model is totally corresponding with the previous
conclusion.
Comparison of the experimental results and numerical results on measured points under the acoustic excitation is
shown in Figure 8. The comparison in the force and acoustic excitation case is also shown in Figure 9. Although the
overall trend of numerical results from the coupled PTMM/WSM is consistent with that of experimental results, there is
some difference of peak frequencies in low frequency band. That’s because the experimental model has a reverberant field
and structure-acoustic coupling. The structure-acoustic coupling between interior acoustic cavity modes and structural
vibration modes has some effect on the sound radiation of the combined shell in low frequency band.
As shown in Figure 10, sound pressure values of all measured points are compared under different cases of excitations.
There is obvious difference in peak numbers and frequencies between acoustic excitation case and force excitation case.
The main difference in both cases is that some peak values only exist in the low frequency range of force excitation case
while some peak values only exist in the middle frequency range of acoustic excitation case. This suggests that the sound
pressure’s peak value in the force excitation case is relate to the structural natural frequencies. The peak values of sound
9
pressure in acoustic excitation case are related to the natural frequencies of the shell and internal cavity. On the whole, it
is shown that the acoustic excitation is the key factor for radiated noise in low frequency band. However, the radiated
noise resulted from force excitation is dominant in mid-high frequency band. The variation tendency of sound pressure
level under force excitation is in agreement with the results under force and acoustic excitation. In 300-1300Hz frequency
range, in spite of little difference in peak values, sound pressure levels are of the same order under force and acoustic
excitation.
Conclusion
In this paper, the experimental test of a ring-stiffened conical-cylindrical shell on the vibration and sound radiation is
investigated under different types of excitations. The test of vibration and acoustic responses under different excitations
are carried out and the experimental data are analyzed. The coupled PTMM/WSM is used to solve the vibration acoustic
response of conical-cylindrical shell in air case and water case and then compared with the experimental results. It can be
concluded as follows:
Compared the numerical results including the vibration and acoustic responses with the literature data and experimental
results, it shows that coupled PTMM/WSM is feasible to solve the vibration and acoustic problem of the submerged
combined shell under cases of excitations.
The forced vibration of the submerged conical-cylindrical shell in the water case has little difference compared to the
air case in the low frequency range. The vibration values of the conical section of the combined shell in water case are
significantly less than that of air case. Fluid load is the primary factor that can affect the circumferential mode and local
mode of conical section.
The peak values of sound pressure in force excitation case are relate to the natural frequency of the shell. The peak
values of sound pressure in the acoustic excitation case are relate to the natural frequency of the shell and interior cavity.
The acoustic excitation is the key factor for radiated noise in low frequency band. However, the radiated noise resulted
from force excitation is dominant in mid-high frequency band.
Declaration of conflicting interests
The author(s) declared no potential conflicts of interest with respect to the research, authorship, and/or publication of this article.
Funding
The author(s) disclosed receipt of the following financial support for the research, authorship, and/or publication of this article:
This research was supported by the National Natural Science Foundation of China (No. 51779201), China Scholarship Council
(201806955052) and Nature Science Foundation of Hubei Province (2018CFB607).
References
1. Lewis EV. Principles of Naval Architecture. Jersey City: Society of Naval Architects and Marine Engineers; 1988.
2. Meyer V, Maxit L, Guyader JL, Leissing L. Prediction of the vibroacoustic behavior of a submerged shell with non-
axisymmetric internal substructures by a condensed transfer function method. J Sound Vib 2016; 360: 260-276.
10
3. Chen JM and Huang YY. Vibration and acoustic radiation from submerged stiffened spherical shell with deck-type
internal plate. Acta Mech Solida Sin 2003; 16: 210-219.
4. Caresta M, Kessissoglou NJ. Structural and acoustic responses of a fluid-loaded cylindrical hull with structural
discontinuities. Appl Acoust 2009; 70: 954-63.
5. Wang X, Wu W, Yao X. Structural and acoustic response of a finite stiffened conical shell. Acta Mech Solida Sin 2015;
28: 200-209.
6. Ma X, Jin G, Xiong Y. Free and forced vibration analysis of coupled conical-cylindrical shells with arbitrary boundary
conditions. Int J Mech Sci 2014; 88: 122-137.
7. Su Z and Jin G. Vibration analysis of coupled conical-cylindrical-spherical shells using a Fourier spectral element method.
J Acoust Soc Am 2016; 140: 3925-3940.
8. Irie T, Yamada G, Muramoto Y. Free vibration of joined conical-cylindrical shells. J Sound Vib 1984; 95: 31-39.
9. Wang X and Guo W. Dynamic modeling and vibration characteristics analysis of submerged stiffened combined shells.
Ocean Eng 2016; 127: 226-235.
10. Xie K, Chen M, Li Z. Free and forced vibration analysis of ring-stiffened conical-cylindrical-spherical shells through a
semi-analytic method. J Sound Vib 2017; 139: 031001.
11. Chen M, Xie K, Jia W. Free and forced vibration of ring-stiffened conical-cylindrical shells with arbitrary boundary
conditions. Ocean Eng 2015; 108: 241-256.
12. Qu Y, Wu S, Chen Y. Vibration analysis of ring-stiffened conical-cylindrical-spherical shells based on a modified
variational approach. Int J Mech Sci 2013; 69: 72-84.
13. Damatty AA El, Saafan MS, Sweedan AMI. Dynamic characteristics of combined conical-cylindrical shells. Thin Wall
Struct 2005; 43: 1380-1397.
14. J. H. Kang, Three-dimensional vibration analysis of joined thick conical-Cylindrical shells of revolution with variable
thickness, J Sound Vib 2012; 331: 4187-4198.
15. Kerboua Y and Lakis AA. Numerical model to analyze the aerodynamic behavior of a combined conical-cylindrical shell.
Aerosp Sci Technol 2016; 58: 601-617.
16. Sarkheil S and Saadat Foumani M. Free vibrational characteristics of rotating joined cylindrical-conical shells. Thin Wall
Struct 2016; 107: 657-670.
17. Yang YB and Kang JH. Vibrations of a composite shell of hemi ellisoidal-cylindrical shell having variable thickness with
and without a top opening. Thin Wall Struct 2017; 119: 677-686.
18. Everstine GC. Finite element formulations of structural acoustics problems. Comput Struct 1997; 65: 307-321.
19. Seybert AF, Cheng CYR, Wu TW. The solution of coupled interior/exterior acoustic problems using the boundary
element method. J Acoust Soc Am 1990; 88: 1612-1618.
20. Everstine GC and Henderson FM. Coupled finite element/boundary element approach for fluid-structure interaction. J
Acoust Soc Am 1990; 87: 1938-1947.
21. Liu CH and Chen PT. Numerical analysis of immersed finite cylindrical shells using a coupled BEM/FEM and spatial
spectrum approach. Appl Acoust 2009; 70: 256-266.
22. Peters H, Kinns R, Kessissoglou NJ. Effects of internal mass distribution and its isolation on the acoustic characteristics of

11
a submerged hull. J Sound Vib 2014 333: 1684-1697.
23. Caresta M and Kessissoglou NJ. Acoustic signature of a submarine hull under harmonic excitation. Appl Acoust 2010; 71:
17-31.
24. Wang X, Jiang C, Xu R. Structural and acoustic response of a finite stiffened submarine hull. China Ocean Eng 2016; 30:
898-915.
25. Qu Y, Hua H, Meng G. Vibro-acoustic analysis of coupled spherical-cylindrical-spherical shells stiffened by ring and
stringer reinforcements. J Sound Vib 2015; 355: 345-359.
26. Koopmann GH, Song L, Fahnline JB. A method for computing acoustic fields based on the principle of wave
superposition. J Acoust Soc Am 1989; 86: 2433-2438.
27. Jin GY, Ma XL, Wang WY, Liu ZG. An energy-based formulation for vibro-acoustic analysis of submerged submarine
hull structures. Ocean Eng 2018, 164: 402-413.

12
Table Captions list
Table 1. Comparison of frequency parameters of the model in Ref. [23]
Table 2. Comparison of frequency parameters of model in Refs. [11-12]
Table 3. Comparison of natural frequencies of the conical-cylindrical shell in air case

13
Table 1. Comparison of frequency parameters of the model in Ref. [23]
(n,m) Caresta [23] Present error%
(1,1) 0.720025 0.7191 0.32
(2,1) 0.010026 0.0102 1.15
(2,2) 0.031057 0.0308 0.93
(3,1) 0.025699 0.0256 0.9
(3,2) 0.081591 0.0815 1.98
(4,1) 0.046447 0.0464 0.75
(4,2) 0.144166 0.1441 1.84
(4,3) 0.358169 0.3581 1.35
(4,4) 0.464651 0.4646 0.2
(5,1) 0.072717 0.0727 0.48
(5,2) 0.199828 0.1998 0.81
(5,3) 0.352868 0.3528 0.07
(5,4) 0.388592 0.3885 1.3

14
Table 2. Comparison of frequency parameters of model in Refs. [11-12]
Free-Free Camped-Camped
n m Chen [11] Qu [12] Present error% Chen [11] Qu [12] Present error%
0
1 0.1593 0.1596 0.1595 0.06 0.0576 0.0577 0.0575 0.35
2 0.2309 0.2303 0.2301 0.09 0.1518 0.1521 0.1520 0.07
3 0.3162 0.3169 0.3161 0.25 0.1818 0.1822 0.1821 0.05
4 0.4287 0.4293 0.4291 0.05 0.333 0.3337 0.3331 0.18
5 0.4674 0.4684 0.4676 0.17 0.3448 0.345 0.3446 0.12
6 0.5777 0.579 0.5768 0.38 0.4863 0.4873 0.4863 0.21
1
1 0.0818 0.0819 0.0820 0.12 0.0345 0.0345 0.0344 0.29
2 0.1774 0.1776 0.1775 0.06 0.1023 0.1026 0.1024 0.19
3 0.2766 0.2776 0.2765 0.40 0.1863 0.1867 0.1863 0.21
4 0.3708 0.3719 0.3706 0.35 0.2791 0.2795 0.2792 0.11
5 0.4596 0.4605 0.4602 0.07 0.3741 0.3744 0.3741 0.08
6 0.5369 0.5373 0.5368 0.09 0.4617 0.462 0.4618 0.04
2
1 0.0235 0.0276 0.0237 14.13 0.0249 0.029 0.0256 11.72
2 0.0394 0.0405 0.0398 1.73 0.0633 0.0653 0.0642 1.68
3 0.0477 0.0484 0.0479 1.03 0.1136 0.1147 0.1136 0.96
4 0.0771 0.0792 0.0781 1.39 0.1547 0.1553 0.1548 0.32
5 0.1369 0.1383 0.1388 0.36 0.1915 0.1918 0.1917 0.05
6 0.2022 0.2033 0.2022 0.54 0.243 0.2432 0.2431 0.04
15
Table 3. Comparison of natural frequencies of the conical-cylindrical shell in air case
Order number 1 (2,1) 2 (3,1) 3 (1,2) 4 (1,3) 5 (1,4)
Experiment 647.6 847.4 948.5 1006.1 1179.0
Present 673.8 865.2 929.5 964.9 1249.9
%Error 3.9 2.1 2.0 4.3 5.7
Order number 6 (2,4) 7 (3,3) 8 (3,4) 9 (3,5) 10 (2,5)
Experiment 1278.4 1459.1 1516.8 1609.3 1785.7
Present 1297.6 1448.1 1479.1 1608.1 1778.1
%Error 1.5 0.8 2.5 0.1 0.4
16
Figure Captions
Figure 1. Pictures of an axisymmetric stiffened conical-cylindrical shell: (a) the schematic diagram; (b) test models; (c)
anechoic tank with a running gear
Figure 2. Experimental setup for the stiffened conical-cylindrical shell submerged in water: (a) The measurement
excitation system; (b) The layout of measuring points
Figure 3. Sign convention for the forces, moments and displacements of the cone and cylinder
Figure 4. Surface boundary and virtual boundary of the conical-cylindrical shell
Figure 5. The forced vibration response of the conical-cylindrical shell in the air: (a) position1, (b) position2, (c) position3,
(d) position4, (e)position5, (f)position6, (g)position7, (h) position8, (i) position9 and (j)position10
Figure 6. The forced vibration response of the conical-cylindrical shell in the water: (a) position1, (b) position2, (c)
position3, (d) position4, (e)position5, (f)position6, (g)position7, (h) position8, (i) position9 and (j)position10
Figure 7. Comparison of sound pressure level of the measurement point with force excitation: (a) hydrophone 1, (b)
hydrophone 2, (3) hydrophone 3
Figure 8. Comparison of sound pressure level of the measurement point with acoustic excitations: (a) hydrophone 1, (b)
hydrophone 2, (3) hydrophone 3
Figure 9. Comparison of sound pressure level of the measurement point with force and acoustic excitations: (a)
hydrophone 1, (b) hydrophone 2, (3) hydrophone 3
Figure 10. Comparison of sound pressure level of the measurement point with different excitations: (a) hydrophone 1, (b)
hydrophone 2, (3) hydrophone 3

17
(a)
(b)
(c)
Figure 1. Pictures of an axisymmetric stiffened conical-cylindrical shell: (a) the schematic diagram; (b) test model; (c) anechoic
tank with a running gear
R
oh
ch
cu
ouow
ov
cv
F
Fluid
0L
, ,p s r
2L
1L
cw

18
(a)
(b)
Figure 2. Experimental setup for the stiffened conical-cylindrical shell submerged in water: (a) The measurement excitation
system; (b) The layout of measuring points
Sensor 8
Sensor 7
A
Sensor 5
Sensor 8 Sensor 7
Sensor 6
Sensor 3
A
A-A
Sensor 4
Sensor 5
Sensor 2
Sensor 11m
1.5
m
0.5
m0
.5m
Hydrophone 1
Hydrophone 2
Hydrophone 3
Water
Free surface
Sensor 10 Sensor 9
Sensor 10
Sensor 9
B
Sensor 6
B
B-B

19
Figure 3. Sign convention for the forces, moments and displacements of the cone and cylinder
cv cwcu
vw
u
yz
x
c
y
z
x
sVsN
s
cNs
cS
s
cV
s
cM
sS
sM
sM
s
cM
s
cN
s
cS s
cV
sS sNsV

20
Figure 4. Surface boundary and virtual boundary of the conical-cylindrical shell
z
r
1S
2S
P O
Baffle
S
3SBaffle

21
(a)
(b)
(c)
(d)
(e)
(f)
500 1000 1500 2000 250060
80
100
120
140
Test results
Present methodVib
rati
on a
ccel
erat
ion l
evel
(dB
)
Frequency(Hz)500 1000 1500 2000 2500
60
70
80
90
100
110
120
130
Test results
Present methodVib
rati
on a
ccel
erat
ion l
evel
(dB
)
Frequency(Hz)
500 1000 1500 2000 250080
90
100
110
120
130
140
150
Test results
Present methodVib
rati
on
acc
eler
atio
n l
evel
(dB
)
Frequency(Hz)
500 1000 1500 2000 250050
60
70
80
90
100
110
120
130
140
Test results
Present methodVib
rati
on a
ccel
erat
ion l
evel
(dB
)
Frequency(Hz)
500 1000 1500 2000 250060
80
100
120
140
Test results
Present methodVib
rati
on a
ccel
erat
ion l
evel
(dB
)
Frequency(Hz)500 1000 1500 2000 2500
50
60
70
80
90
100
110
120
130
Test results
Present method
Frequency(Hz)
Vib
rati
on a
ccel
erat
ion l
evel
(dB
)
22
(g)
(h)
(i)
(j)
Figure 5. The forced vibration response of the conical-cylindrical shell in the air: (a) position1, (b) position2, (c) position3,
(d) position4, (e)position5, (f)position6, (g)position7, (h) position8, (i) position9 and (j)position10
500 1000 1500 2000 250070
80
90
100
110
120
130
140
Test results
Present method
Vib
rati
on
acc
eler
atio
n l
evel
(dB
)
Frequency(Hz)
500 1000 1500 2000 250080
90
100
110
120
130
140
Test results
Present methodVib
rati
on
acc
eler
atio
n l
evel
(dB
)
Frequency(Hz)
500 1000 1500 2000 250070
80
90
100
110
120
130
Test results
Present method
Vib
rati
on a
ccel
erat
ion l
evel
(dB
)
Frequency(Hz)
500 1000 1500 2000 2500
70
80
90
100
110
120
130
Test results
Present methodV
ibra
tio
n a
ccel
erat
ion
lev
el(d
B)
Frequency(Hz)

23
(a)
(b)
(c)
(d)
(e)
(f)
500 1000 1500 2000 250060
80
100
120
140
Test results
Present method
Vib
rati
on a
ccel
erat
ion l
evel
(dB
)
Frequency(Hz)500 1000 1500 2000 2500
60
70
80
90
100
110
120
130
Vib
rati
on
acc
eler
atio
n l
evel
(dB
)
Test results
Present method
Frequency(Hz)
500 1000 1500 2000 250080
90
100
110
120
130
140
150
Vib
rati
on
acc
eler
atio
n l
evel
(dB
)
Frequency(Hz)
Test results
Present method
500 1000 1500 2000 250060
80
100
120
140
Vib
rati
on a
ccel
erat
ion l
evel
(dB
)
Test results
Present method
Frequency(Hz)
500 1000 1500 2000 250060
80
100
120
140
Vib
rati
on a
ccel
erat
ion l
evel
(dB
)
Test results
Present method
Frequency(Hz)
500 1000 1500 2000 250060
70
80
90
100
110
120
130
Vib
rati
on a
ccel
erat
ion l
evel
(dB
)
Test results
Present method
Frequency(Hz)
24
(g)
(h)
(i)
(j)
Figure 6. The forced vibration response of the conical-cylindrical shell in the water: (a) position1, (b) position2, (c)
position3, (d) position4, (e)position5, (f)position6, (g)position7, (h) position8, (i) position9 and (j)position10
500 1000 1500 2000 250060
70
80
90
100
110
120
130V
ibra
tio
n a
ccel
erat
ion
lev
el(d
B)
Test results
Present method
Frequency(Hz)500 1000 1500 2000 2500
70
80
90
100
110
120
130
140
Test results
Present method
Vib
rati
on
acc
eler
atio
n l
evel
(dB
)
Frequency(Hz)
500 1000 1500 2000 250060
70
80
90
100
110
120
130
Test results
Present method
Vib
rati
on
acc
eler
atio
n l
evel
(dB
)
Frequency(Hz)500 1000 1500 2000 2500
70
80
90
100
110
120
130
Test results
Present method
Vib
rati
on
acc
eler
atio
n l
evel
(dB
)
Frequency(Hz)

25
(a)
(b)
(c)
Figure 7. Comparison of sound pressure level of the measurement point with force excitation: (a) hydrophone 1, (b)
hydrophone 2, (3) hydrophone 3
500 1000 1500 2000 250070
80
90
100
110
120
130
140
Frequency(Hz)
Test results
Present methodS
ou
nd
pre
ssu
re l
evel
(dB
)
500 1000 1500 2000 250080
90
100
110
120
130
Test results
Present method
So
un
d p
ress
ure
lev
el(d
B)
Frequency(Hz)
500 1000 1500 2000 250070
80
90
100
110
120
130
Sound p
ress
ure
lev
el(d
B)
Frequency(Hz)
Test results
Present method

26
(a)
(b)
(c)
Figure 8. Comparison of sound pressure level of the measurement point with acoustic excitations: (a) hydrophone 1, (b)
hydrophone 2, (3) hydrophone 3
500 1000 1500 2000 250080
90
100
110
120
130
Test results
Present method
Sound p
ress
ure
lev
el(d
B)
Frequency(Hz)
500 1000 1500 2000 250090
100
110
120
130
Sound p
ress
ure
lev
el(d
B)
Test results
Present method
Frequency(Hz)
500 1000 1500 2000 250080
90
100
110
120
130
Sound p
ress
ure
lev
el(d
B)
Test results
Present method
Frequency(Hz)

27
(a)
(b)
(c)
Figure 9. Comparison of sound pressure level of the measurement point with force and acoustic excitations: (a) hydrophone 1,
(b) hydrophone 2, (3) hydrophone 3
500 1000 1500 2000 250080
90
100
110
120
130
140
Sound p
ress
ure
lev
el(d
B)
Test results
Present method
Frequency(Hz)
500 1000 1500 2000 250090
100
110
120
130
140
Test results
Present method
So
un
d p
ress
ure
lev
el(d
B)
Frequency(Hz)
500 1000 1500 2000 250080
90
100
110
120
130
140
Sound p
ress
ure
lev
el(d
B)
Test results
Present method
Frequency(Hz)

28
(a)
(b)
(c)
Figure 10. Comparison of sound pressure level of the measurement point with different excitations: (a) hydrophone 1, (b)
hydrophone 2, (3) hydrophone 3
500 1000 1500 2000 250070
80
90
100
110
120
130
140
Force excitation
Acoustic excitation
Force and Acoustic excitation
Frequency(Hz)
So
un
d p
ress
ure
lev
el(d
B)
500 1000 1500 2000 250080
90
100
110
120
130
Force excitation
Acoustic excitation
Force and Acoustic excitation
Sound p
ress
ure
lev
el(d
B)
Frequency(Hz)
500 1000 1500 2000 250070
80
90
100
110
120
130
Force excitation
Acoustic excitation
Force and Acoustic excitation
Sound p
ress
ure
lev
el(d
B)
Frequency(Hz)