Embed Size (px)
Citation preview

Experiment-Assisted Computational Drug
Discovery
Alexander Tropsha
Laboratory for Molecular Modeling
UNC Eshelman School of Pharmacy
UNC-Chapel Hill

'The problems of how enzymes are induced,
or how proteins are synthesized, or how
antibodies are formed, are closer to solution
than is generally believed... If you stop doing
experiments for a little while and think how
proteins can possibly be synthesized, there
are only 5 different ways, not 50! And it will
take only a few experiments to distinguish
these'
L. Szilard
Experiment-Assisted Computational
Drug Discovery? Shouldn’t it be the
other way around?

OUTLINE
• Methodology
– Predictive QSAR Modeling Workflow
– Examples of the Workflow applications : virtual
screening and hit/lead identification
• Emerging Areas – Integration of QSAR modeling with other knowledge mining
approaches
– QSAR modeling using hybrid chemical/biological descriptors
• Conclusions
– models are tools for testable hypothesis generation
focus on accurate, experimentally confirmed predictions

~106 – 109
molecules
VIRTUAL
SCREENING
CHEMICAL
STRUCTURES
CHEMICAL DESCRIPTORS
PROPERTY/
ACTIVITY
PREDICTIVE
QSAR MODELS
INACTIVES
(inactives)
QSAR
MAGIC
HITS
(confirmed
actives)
CHEMICAL
DATABASE
The chief utility of QSAR models: identification
of novel hits in external libraries

Original
Dataset
Multiple
Training
Sets
Multiple
Test
Sets
Y-randomization
Combi-QSAR
Modeling
Activity
Prediction
Only accept
models that
passed both
internal and
external
accuracy
filters
External validation
Using Applicability
Domain
Split into
Training, Test
and External
Validation
sets
Experimental
Validation
Database
Screening Using
Applicability
Domain
Validated Predictive
Models with High
Internal & External
Accuracy
Tropsha, A. Best Practices for QSAR Model Development…Mol. Inf., 2010, 29,
476 – 488
*Fully implemented on CHEMBENCH.MML.UNC.EDU
Predictive QSAR Modeling
Workflow*
Structure
Curation/
Harmonization

How not to develop QSAR*
(examples of errors) 1. Failure to take account of data
heterogeneity
2. Use of inappropriate endpoint data
3. Use of collinear descriptors
4. Use of incomprehensible descriptors
5. Error in descriptor values
6. Poor transferability of QSAR/QSPR
7. Inadequate/undefined applicability
domain
8. Unacknowledged omission of data
points
9. Use of inadequate data
10. Replication of compounds in dataset
11. Too narrow a range of endpoint values
12. Over-fitting of data
13. Use of excessive numbers of
descriptors in a QSAR/QSPR
14. Lack of/inadequate statistics
15. Incorrect calculation
16. Lack of descriptor auto-scaling
17. Misuse/misinterpretation of statistics
18. No consideration of distribution of
residuals
19. Inadequate training/test set selection
20. Failure to validate a QSAR/QSPR
correctly
21. Lack of mechanistic interpretation
*Dearden et al., SAR QSAR Environ Res. 2009;20(3-4):241-66

Cheminformaticians are at the mercy of data providers;
Both chemical and biological data in databases are often
inaccurately reported
Prediction performance of (Q)SAR models depends strongly
on the quality of input data (both structures and activities).
Both chemical and biologicaal data must be curated to
enable their effective use.
Data dependency and data quality
are critical issues in QSAR modeling
Florian Prinz, Thomas Schlange and Khusru Asadullah. Nature Rev. Drug
Disc. Sep 2011
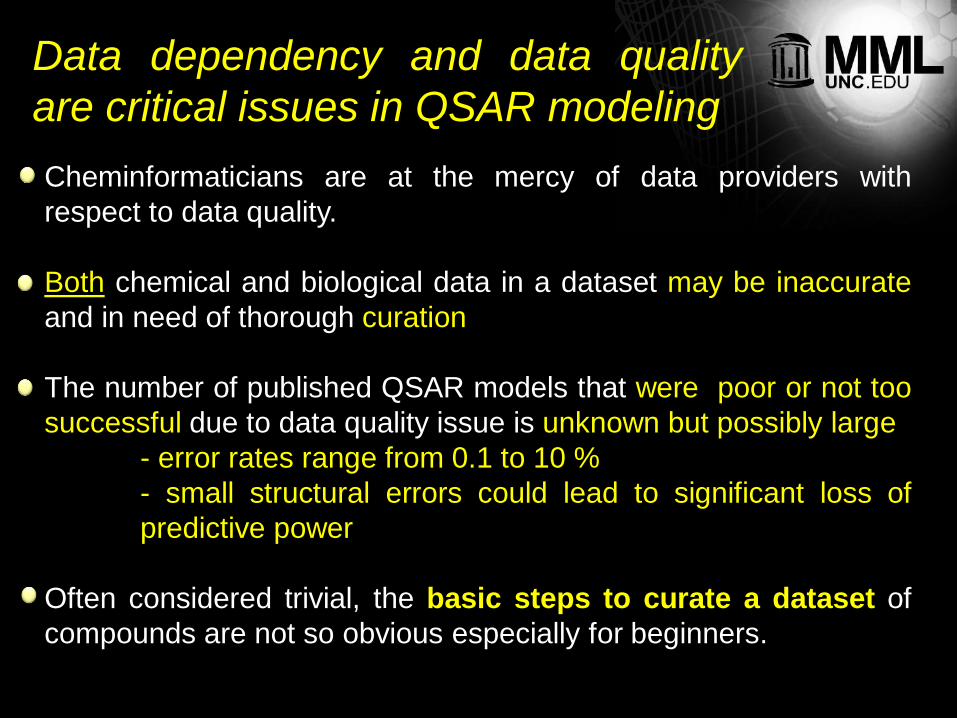
Data dependency and data quality
are critical issues in QSAR modeling
Cheminformaticians are at the mercy of data providers with
respect to data quality.
Both chemical and biological data in a dataset may be inaccurate
and in need of thorough curation
The number of published QSAR models that were poor or not too
successful due to data quality issue is unknown but possibly large
- error rates range from 0.1 to 10 %
- small structural errors could lead to significant loss of
predictive power
Often considered trivial, the basic steps to curate a dataset of
compounds are not so obvious especially for beginners.

242 chemical records / one binary activity
Looks clean …

Looks clean … but … Calculation of Dragon molecular descriptors
All compounds are in fact incorrect
(presence of inorganics, salts,
organometallics, duplicates; certain
hydrogens are lacking; wrong
standardization; etc.) http://chembench.mml.unc.edu

D
E
S
C
R
I
P
T
O
R
S
N
O
N
O
N
O
N
O
N
O
N
O
N
O
N
O
N
O
0.613
0.380
-0.222
7.08
1.146
0.491
0.301
0.141
0.956
0.256
0.799
1.195
1.005
QSAR modeling with non-curated datasets
C
CH3
CH3
CH3
N
O
H3C CH
2
CH3
O
O–
Na+
Presence of SALTS
Presence of MIXTURES OH
Presence of ERRONEOUS AND/OR
WRONG STRUCTURES
Presence of DUPLICATES
Presence of MISPRINTS
AND WRONG NAMES
Etc.
ERRORS in the calculation
of DESCRIPTORS

INITIAL LIST OF SMILES/STRUCTURES
(2D representation)
difficult cases
Fourches,
Muratov,
Tropsha. Trust
but verify.
JCIM, 2010,
50:1189-204.

QSAR modeling of nitro-aromatic
toxicants
-Case Study 1: 28 compounds tested in rats,
log(LD50), mmol/kg.
-Case Study 2: 95 compounds tested against
Tetrahymena pyriformis, log(IGC50), mmol/ml.
-Case Study 2: after the normalization of nitro groups R2ext~0 increased to R2
ext~0.5
Artemenko, Muratov et al. J. SAR QSAR 2011, 22 (5-6), 1-27.
- Five different representations of nitro groups. -Case Study 1: after the normalization of nitro groups
R2ext~0.45 increased to R2
ext~0.9.
Even small differences in structure representation can
lead to significant errors in prediction accuracy of
models
Data curation affects the accuracy
(up or down!) of QSAR models

Was wrong In ChEMBL,
now corrected
Correct
J. Med. Chem. 2006, 49: 2758-2771.
Possible Source of Errors:
inaccurate extraction from literature

Case study 1: 5-HT7 Receptor
binders
A member of the GPCR
superfamily of cell surface
receptors.
Involved in various
cognitive and behavioral
functions.
A potential drug target for
psychotic disorders such as
schizophrenia and major
depression.
15
* Basic and clinical pharmacology, 8th edition.2001:265–291

Study Design
16
Curated
5-HT7 Data*
Continuous kNN
Model (62 cpds)
DWD Classification
Model (100 cpds)
* Data were collected from PDSP database provided by Prof. Roth’s lab.
k Nearest Neighbors Distance Weighted
Discrimination
0
2
4
6
8
10
12
14
16
18
5.4-6.0 6.0-6.5 6.5-7.5 7.5-8.0 8.0-8.5 8.5-9.5
# o
f c
om
po
un
ds
Binding Affinity (pKi)
Binding Affinity distribution
World Drug Index
(~52,000 cpds)
VS Hits
62
38
0
10
20
30
40
50
60
70
Binders Non-binders
# o
f c
om
po
un
ds

Virtual Screening Workflow to
identify and confirm 5HT7 binders
• ~52000 Database: World Drug Index (WDI).
• Classification filter DWD Classification
Continuous kNN Models
Experimental Validation
5
• Predicted pKi - 7.98~8.52
• 7 consensus hits tested
• 5 consensus hits confirmed experimentally .
• Predicted pKi≥7.8
• 43 hits prioritized
17

Experimental Validation*: 5 out of 7 Tested
Hits Are confirmed 5-HT7 Binders
Name Predict
Ki(nM) Ki
(nM) Function Therapeutic Category Mechanism of action
Droperidol 3.24 3.5 Antagonist Butyrophenone antiemetic
and antipsychotic agent
Ligand of postsynaptic GABA and
dopaminergic receptors; selectively
blocks α-adrenergic receptors.
Perospirone 7.08 8.6 Antagonist Atypical
antipsychotic agent
Antagonist of 5-HT2A and dopamine
D2 receptors
Altanserin 3.39 143.0 N/A Used in Human
neuroimaging study Strong 5-HT2A ligand
Pravadoline 9.55 3184.0 N/A Cannabinoid
analgesic agent Inhibit cyclooxygenase (COX)
Clomipramine 13.80 46.0 N/A Tricyclic antidepressant; antiobsessional agent
Presynaptic receptors are affected:
α1 and β1 are sensitized, α2 are desensitized
Clazolam 6.46 >10000 N/A N/A N/A
Sulazepam 14.13 >10000 N/A Sedative and anxiolytic
agent N/A
18
*data from B. Roth’s lab.

Fenfluramine
Norfenfluramine
Carbergoline Pergolide
Lisuride
5-HT2B
Src-P PKC ERK1/2
RB-P
Proliferation
PLC-β DAG
TGF-β
βArr
EC space
IC space GTP
Gβy
Gαq
Left atrium Left atrium
Left ventricle Left ventricle
Mitral valve Mitral valve
Cordae tendineae
Cordae tendineae
Case study 2: 5-HT2B-receptor binders
Roth, B.L. N ENGL J MED, 356;1 (2007)
?
Possible Explanation of cardiotoxicity: Activation of 5-HT2B receptors leads to the dissociation of the G protein
Activation of phospho lipase C-β (PLC-β)
Activation of Src
Activation of ERK1/ERK2
Phosphorylation of retinoblastoma protein
mitogenesis
Overgrowth valvulopathy and subsequent valvular dysfunction.
19

5-HT2B
predictor
Experimental Testing
122 VS Hits
Select for Testing
59 K cps.
5-HT2B models and VS results
10 VS Hits
9 Validated
Actives
Model statistics
608 Inactives (0)
800 cps.
146 Actives (1)
Dataset Virtual screening
Source: Roth lab, UNC
Dataset curation
Huang, X., et al. Molecular Pharmacology (2009)
Hajjo R. et al, J Med Chem. 2010 11;53(21):7573-86

Compound Experimental
Ki (nM)
Methylergometrine 0.8
6-Fluoromelatonin 2495
Adrenoglumerulotropin 491
CGP-13698 >10000
PIM-35 1617
Fendiline 3217
Fluspirilene 151.4
PNU-96415E 69.6
Prestwick-559 33.1
Raloxifene 69
Success rate for active vs. inactive models = 90 %
Results of VS and radioligand binding assays
Tc WDI
Compounds 122 VS
Hits 10 Tested
Hits ≥ 0.9 286 2 2 ≥ 0.8 1341 4 3 ≥ 0.7 7048 13 8 ≥ 0.6 21431 38 9 ≥ 0.5 36719 81 9 ≥ 0.4 44208 115 10 ≥ 0.3 45860 122 10 ≥ 0.2 46220 122 10 ≥ 0.1 46301 122 10 ≥ 0.0 46406 122 10
Can we identify these same hits with simple similarity searches??
Tanimoto coefficients (Tc) & 166 MACCS structural keys were used for similarity calculations Tested by collaborators at PDSP.

QSAR
Models
Receptor 2
Case study 3: QSAR-based virtual receptoromics
(QSAR-omics)
Virtual Receptorome
(of receptor subtypes or families)
Predicting Pharmacological Profiles
ca. 106 – 109
molecules
QSAR
Models
Receptor 1
QSAR
Models
Receptor 3

Degree of
sparsity = 93.25%
# of tested ligands
per receptor: >100
34 Receptors
Fir
st 1
50
(o
ut o
f ~
90
00
Ch
em
ica
ls)
pKi Not tested
<5
5-6
6-7
7-8
8-9
9-10
>10
GPCRome Data Matrix: filling the gaps

Issues Source Before curation After curation
Organometallics ChEMBL Deleted
Organosilicon PDSP Deleted
Salts PDSP
Tautomers ChEMBL PDSP
Examples of structure curation

Prazosin
Targets 5-HT2A α-1A D2
Standard
Deviation 2.80 0.63 0.4
Assay records
(pKi)
5.15
5.45
10.15
9.16
10.22
8.74
8.14
9.29
9.23
9.23
7.24
7.51
7.84
7.97
7.02
Biological Data Curation

Different cutoff values were used to balance
the ratio of actives and inactives.
0
500
1000
1500
2000
2500# of compounds
inactive
active
cutoffpKi = 7
=6
=5
=8
Ta
rg
ets
34 Datasets: Distribution of
Actives and Inactives

0.50
0.55
0.60
0.65
0.70
0.75
0.80
0.85
0.90
0.95
1.00
CCR
Ta
rge
ts
33 out of 34 models have 5-fold external CV cumulative
balanced accuracy > 0.7
External Prediction Accuracy

0
100
200
300
400
500
600
700
800
0 1 2 3 4 5 6 7 8 9 10 11 12 13 14 15 16 17 18 19 20 21 22 23 24 25 26 27 28 29 30 31 32 33 34
# o
f b
ind
ers
# of interacting targets
• Most compounds are predicted to bind several GPCRs.
Binding Promiscuity

• 148 compounds were identified to
bind one or two GPCRs.
55 selective
93 dual selective
• These compounds are selected for
further experimental investigation in B.
Roth lab.
predicted non-binder
experimental non-binder
predicted binder
experimental binder
34 Receptors
14
8 o
ut o
f 7
,26
7 c
he
mic
als
Selective Ligands

Case study 4: Chemocentric Integrative
Informatics? Application to 5HT6 lihgands
30

Genes
Metabolites
Dis
eases
PubChem
DBpedia
ChEMBL
PDB
DrugBank
PubMed
STITCH
PDSP
STITCH
PDD
CTD
Diseasome
CMAP
KEGG
STITCH
CTD
GeneID
OMIM
Entrez
Gene
Pfam
UniProt
CAS
CTD
KEGG
ERGO
BioCyc
MetaCyc
CMAP
miR2Dis
-ease
miRBase
TarBase
PuTmiR
HMDB
METLIN
METLIN
HMDB
UCbase
miRfunc
PubMed
CTD
HMPDb
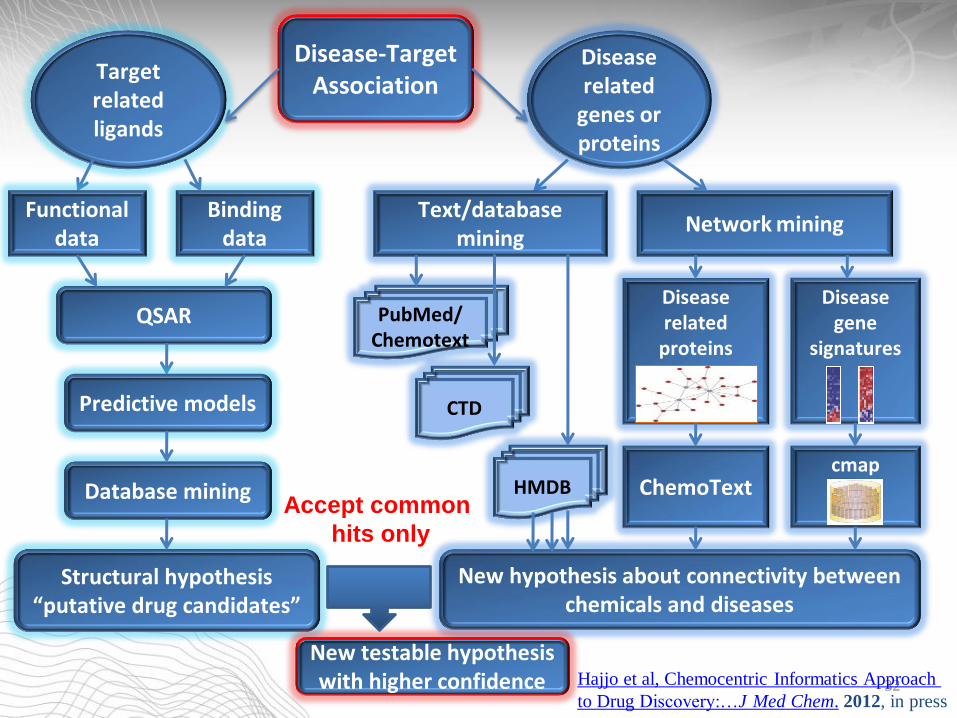
Disease gene
signatures
Disease related
genes or proteins
Text/database mining
Network mining
PubMed/ Chemotext
CTD
HMDB
Disease related
proteins
cmap ChemoText
New hypothesis about connectivity between chemicals and diseases
Binding data
Target related ligands
Functional data
QSAR
Predictive models
Database mining
Structural hypothesis “putative drug candidates”
Accept common
hits only
New testable hypothesis with higher confidence
Disease-Target Association
32 Hajjo et al, Chemocentric Informatics Approach
to Drug Discovery:…J Med Chem. 2012, in press

5-HT6
predictor
300 VS Hits “Actives”
59 K cps.
5-HT6 receptor QSAR models & QSAR-based VS
Model statistics
94 Inactives Ki ≥ 10 µM
196 cps.
102 Actives Ki < 10 µM
Dataset Virtual screening
Source: PDSP Ki-DB
0.0
0.1
0.2
0.3
0.4
0.5
0.6
0.7
0.8
0.9
1.0
Model
CC
Rev
s
kNN-Dragon Model
kNN-Dragon Random
CBA-SG Model
CBA-SG Random
33

Step3 : list of correlated compounds
Step2: query the cmap
Database
The connectivity map
Step1: upload signature
Output
High correlation
Low correlation
Null
Biological state 1
Control
Signature
Input
34 Lamb, J. et al. Science, 313, 1929-1935 (2006)
Lamb, J. Nature 7, 54-60 (2007)

Querying the cmap
cmap
1.00
0.00
0.00
-1.00
cmap SCORE
Upload signature Query the cmap List of compounds
(S1) (S2)
S1: Hata, R. et al., Biochem. Biophys. Res. Commun 284, 310 (2001). S2: Ricciarelli, R. et al., IUBMB Life 56, 349 (2004).
Alzheimer’s disease gene signatures
35

97 COMMON HITS with S1
106 COMMON HITS with S2
Chemocentric
Informatics
QSAR
FILTER
Further
selection
34 Higher
Confidence Hits
CONSENSUS
HYPOTHESES 300 5-HT6
Active HITS
WDI
DATABASE
73 COMMON HITS with S1 & S2
cmap
FILTER
cmap
DATABASE
881 instances with S1
861 instances with S2
59 K
compounds
6.1 K
Individual
instances
36
Antipsychotics Antidepressants Calcium Channel Blockers Selective Estrogen Receptor
Modulators (SERMs)

SERMs predicted as 5-HT6 receptor ligands
37

Raloxifene identified as a 5-HT6 receptor ligand and potential preventative for Alzheimer’s disease
Raloxifene binds to 5-HT6
receptor with a Ki= 750 nM.
Raloxifene given at a dose of
120 mg/day led to reduced risk
of cognitive impairment in post-
menopausal women.
Yaffe, K. et al., Am J Psychiatry, 162,
683–690 (2005).
A newly funded study by NIH is
ongoing to evaluate its effects
in AD patients.
Competition binding at 5-HT6 receptors for
raloxifene (yellow triangle) and chlorpromazine
(square) versus [3H] LSD. Tested by our
collaborators at PDSP.
38
http://www.nia.nih.gov/alzheimers/publications/adprevented/
Raloxifene
Chlorpromazine

Human Effects
Cheminformatics
Exploration and exploitation of diverse
data streams
Bioinformatics Multiple
biological assays
Inherent chemical properties
Integrate cheminformatics and short term assay
data to improve predictive power and interpretability

In Vitro
Assays
Chemical
Descriptors
In vitro data alone cannot explain in vitro
effects
Thomas R., et al. A Comprehensive Statistical Analysis of Predicting In Vivo Hazard Using High-Throughput In Vitro
Screening. Toxicol Sci. 2012 May 31. [Epub ahead of print]

Emerging approaches combining
cheminformatics and short-term assays: The Use of Biological Screening Data as Additional
Biological Descriptors Improves the Prediction
Accuracy of Conventional QSAR Models of
Chemical Toxicity
- Zhu, H., Rusyn I, Richard A, Tropsha A. Use of cell viability assay data improves the prediction accuracy of
conventional quantitative structure-activity relationship models of animal carcinogenicity. EHP, 2008, (116): 506-
513
- Sedykh A, Zhu H, Tang H, Zhang L, Richard A, Rusyn I, Tropsha A. Use of in vitro HTS-derived concentration-
response data as biological descriptors improves the accuracy of QSAR models of in vivo toxicity. EHP, 2011,
119(3):364-70.
- Low et al., Predicting drug-induced hepatotoxicity using QSAR and toxicogenomics approaches. Chem Res
Toxicol. 2011 Aug 15;24(8):1251-62
- Rusyn et al, Predictive modeling of chemical hazard by integrating numerical descriptors of chemical structures
and short-term toxicity assay data. Tox. Sci., 2012, 127(1):1-9

Biological model
Combined matrix of features
QSAR
Biological model
Consensus model
Hybrid model
Hierarchical QSAR
Chemical features
Biological data
in vitro/in vivo relation
A
B
C
Chemical features
Biological data
Chemical features
Biological data
Multi-space kNN (hybrid read-across)
Chemical features
Biological data
D QSAR O
pti
miz
atio
n
J
o
i
n
t
Rusyn et al,. Tox. Sci., 2012 127(1):1-9
Approaches to Hybrid QSAR Modeling

Case study 5. In vitro dose-response data
improve the predictive power of QSAR
models of in vivo toxicity (rat LD50 )
•1408 substances •382 chemical structure descriptors (Dragon v5.5) • 13 in vitro NCGC cell viability assays * :
qHTS (quantitative HTS) data
14 test concentrations: 0.6nm .. 92.2μm May yield up to 13x14 = 182 in vitro qHTS descriptors, but the issue of data noise becomes important.
*Inglese J., Douglas S. A. et al. PNAS, 2006, v103(31), p11473

Modeling Workflow

QSAR Table – qHTS descriptors
ID Name Structure 3T3
9.2mkM
3T3
21mkM …
SHSY
92mkM
1 Acrolein 0 0 … -92
2 2-Amino-4-nitrophenol
0 -22 … 0
... ... … … … … …
369 Tebuco-nazole
-21 -24 … -18
Descriptor #: 1 2 … 182

SMOOTHING CONCENTRATION-RESPONSE CURVES.
Sedykh A, Zhu H, Tang H, Zhang L, Richard A, Rusyn I, Tropsha A. EHP, 2011, 119(3):364-70

Smoothing the concentration-
response data improves the
prediction accuracy of hybrid models.
%
Chemical
descriptors
only
Hybrid
descriptors
(Original)
Hybrid
descriptors
(THR=15%)
Sensitivity 68±8 63±9 76±5
Specificity 85±4 86±4 87±2
CCR 76 ±5 * 74 ±5 82 ±3
Sensitivity 74±9 66±8 77±10
Specificity 82±7 87±4 86±3
CCR 78 ±4 * 77 ±5 82 ±5
Shown are averaged results of five-fold external validation. *Chemical descriptors only models were significantly different (p < 0.05) from all other models of the corresponding group by the permutation test (10,000 times).
kNN models
Random Forest (RF) models

Hybrid QSAR models have higher
predictive power than commercial
software TOPKAT
% TOPKAT
Chemical
descriptors only
Hybrid
descriptors
(Original)
Hybrid descriptors
(THR=15%)
kNN RF kNN RF kNN RF
Sensitivity 0.45 0.73 0.73 0.55 0.82 0.91 0.91
Specificity 0.93 0.78 0.80 0.85 0.78 0.85 0.83
CCR 0.69 * 0.75 0.77 0.70 0.80 0.88 0.87
Results are shown for 52 compounds in our external validation sets, which were also absent in the TOPKAT training set. *TOPKAT model was significantly different (p < 0.05) from all other models by the permutation test (10,000 times).

Conclusions and Outlook
• Methodology
– data curation is critical (NB: QSAR models could be used to spot and correct erroneous data!)
– Rigorous external model validation is mandatory and should precede any mechanistic interpretation
– Consensus (collaborative!) prediction using all acceptable models affords the highest accuracy and chemical space coverage
– Novel chemical descriptors for (so far) uncommon substances (mixtures, materials, nanomaterials)
– outcome: decision support tools for prioritizing compounds for experimental screening and/or regulatory decision making

Conclusions and Outlook
• Emerging trends in QSAR modeling
– Rapid accumulation of large biomolecular datasets (especially, in public domain)
– Non-traditional sources of datasets (text mining of biomedical literature, patents, EMRs, …)
– Extension of QSAR modeling beyond organic molecules (mixtures, materials, nanomaterials, …)
– Integration of inherent chemical properties with short term biological profiles (biodescriptors ) in the context of structure – in vitro – in vivo extrapolation
– Interpretation of significant chemical and biological descriptors emerging from externally validated models to inform the selection or design of effective and safe chemicals

QSAR Modeling: Where have you been,
where are you going?
Where have you been?
Where are you going to?
I want to know what is new
I want to go with you
What have you seen?
What do you know that is new?
Where are you going to?
Because I want to go with you
Chris Rea, “The Blue Café” song

Experiment-Assisted Computational Drug Discovery?
Recent examples of experimentally validated QSAR-
based predictions • Anticonvulsants: Shen, M. et al, J. Med. Chem. 2004, 47,
2356-2364.
• HIV-1 reverse transcriptase inhibitors: Medina-Franco, J., et al, J. Comput. Aided. Mol. Des., 2005, 19, 229–242
• D1 receptor antagonists: Oloff et al, J. Med. Chem., 2005, 48, 7322-32
• Anticancer agents: Zhang et al, J. Comp. Aid. Molec. Des., 2007, 21, 97-112.
• AmpC inhibitors: Hsieh, J.-H.. et al, J. Comp. Aid. Molec. Des., 2008, 22(9):593-609
• HDAC inhibitors: Wang, S. et al, (JCIM, 2009, 49, 461-76)
• GGT-I inhibitors: Wang, Peterson, et al (JMC, 2009, 52(14):4210-20; provisional patent)
• 5Ht2B binders: Hajjo et al, JMC, 2010, 11;53(21):7573-86
• 5HT6 binders: Hajjo et al, JMC, 2012 (in press)
• 5HT7 binders; 5HT1A ligands, etc...(in preparation)

http://chembench.mml.unc.edu

Principal Investigator Alexander Tropsha
Research Professors Alexander Golbraikh, Denis
Fourches, Eugene Muratov
Graduate Research
Assistants Andrew Fant,
Stephen Bush,
Yen Low
Postdoctoral Fellows Aleck Sedykh,
Ashutosh Tripathy
Regina Politi
Adjunct Members
Weifan Zheng, Shubin Liu
The Laboratory for Molecular Modeling
MAJOR FUNDING
NIH - R01-GM66940
- R01-GM068665
EPA (STAR awards) - RD832720
- RD833825
- RD834999
Former members:
Guiyu Zhao
Rima Hajjo