Embed Size (px)
Citation preview

The effectiveness of a computer assisted method to enhance learning – A randomized experiment
Kristof De Witte, Wim Groot & Henriette Maassen van den Brink
TIER WORKING PAPER SERIES TIER WP 14/29

The effectiveness of a computer assisted method to enhance
learning – A randomized experiment1
Kristof De Witte‡δ2, Wim Groot ¥ and Henriëtte Maassen van den Brink δ¥
(δ): Maastricht University
Top Institute for Evidence Based Education Research, Po Box 6015, 6200 ML Maastricht (the Netherlands); [email protected];
(‡): Katholieke Universiteit Leuven (KULeuven) Faculty of Business and Economics – Leuven Economics of Education Research, Naamsestraat 69, 3000 Leuven (Belgium);
[email protected] (¥): University of Amsterdam
Top Institute for Evidence Based Education Research, Roeterstraat 11, 1018 WB Amsterdam (the Netherlands)
Abstract:
This article evaluates by a randomized experiment the effectiveness of a computer assisted method to enhance learning abilities. The method is called the BrightStar Program. The
randomized experiment took place in a secondary school in the northern part of the Netherlands. The results show mixed outcomes. BrightStar results in a favorable effect on the rapid naming of pictures. Students who are treated with BrightStar significantly reduce the time
to name pictures. This effect is already observed from 7 BrightStar sessions onwards, and is reinforced with more treatments. On the other hand, students treated with BrightStar perform
significantly worse than control group students on the rapid naming of letters. We do not observe a significant effect on outcomes like rapid naming of numbers, colors, or on non-word
decoding on the intervention group versus the control group taken as a whole. Not all in the intervention group have completed the minimum set of interventions, in fact only 64% have.
The mainstream children that have completed 7 interventions or more have shown significant progress in a number of abilities including the Dutch CITO test which measures reading
technique, speed and and relates to text comprehension.
Keywords: Dyslexia; Computer Assisted Learning; BrightStar; Experiment; Reading difficulties
1 We would like to thank Hans Wackwitz, Lianda Boer and David Cats for valuable suggestions and remarks on an earlier draft of the paper. We are grateful to the school management and teacher of the secondary school in Sneek to participate in the experiment. 2 Corresponding author. Tel.: 003216326566 E-mail address: [email protected]; [email protected]
1

1. Introduction There is recently an increased awareness of the role of neuroscience in the remediation of students with
dyslexia (e.g., Eden and Moats, 2002). It is acknowledged that dyslexia is a “specific learning disability that is neurobiologial in origin” (p. 1080) and largely results form a deficit in the phonological
component of language. The literature provides various ways to reduce the symptoms of dyslexia. A review of 14 programs is provided by Poole (2008), while Eden and Moats (2002) refer to commercial
programs as Orton-Gillingham Approach, Alphabetic Phonics, Slingerland Approach, Spaulding Approach, Project Read, Wilson Language, LANGUAGE!, the Sonday System and Lindamood-Bell.
Programs which have been shown in randomized experiments as effective include the Barton Intervention Program (Mihandoost et al., 2010).
This paper focusses on the effectiveness of a novel technology: BrightStar. John Stein, a professor of
Neuroscience at Oxford University, together with Sue Fowler (Dyslexia Research Trust) have led research on the magnocellular theory of dyslexia to attain effective treatments for visual reading problems. The inventors of the ‘BrightStar program’ initially developed the technology to help children with visual
learning disabilities and dyslexia in particular. BrightStar is thus a technology which aims to stimulate the neurological circuits in the human brain by an innovative visual stimulus. Its main purpose is to enhance
learning abilities. In essence, BrightStar technology is said to do four things: “(1) It stimulates the visual pathways of the brain engaged in the reading process, using patterns of small, moving lights. (2) It
strengthens the neurological pathways between the left and right hemisphere of the brain, by flashing lights at the rhythm of the heartbeat. (3) It decreases saccadic eye movement, the rapid moving of the
eyes. This enhances the ability to focus. (4) It creates a visual attention shift, which increases the level of concentration and enhances eye-hand coordination.” (www.BrightStar-learning.com/technology;
accessed January 2014). The mechanism through which BrightStar is expected to work is the ‘neuroplasticity’. This refers to the response of the brain to the recurrent gaining of new information
which then reorganizes neural pathways. The computer-assisted technology particularly focuses on the neural connections to improve reading and learning skills. Thanks to its set-up, i.e. clients have to follow
with the computer mouse a moving car on the screen, it also improves hand-eye coordination. The car game is alternated by an eye tracking exercise.
Earlier literature on the effects of computer-assisted instruction in support of beginning reading instruction is summarized by Blok et al. (2002). They observe in a summary of 42 papers a significant
effect of computer-assisted instruction, although the programs “have only a small effect on students’ beginning reading abilities” (p. 121). The latter observation is related to the poor quality of many studies
(e.g. lacking of a control group).
2

This is not the first paper to examine the effectiveness of BrightStar. Bondorowicz et al. (2004) consider
the progress of 177 students and 93 adults with spelling, reading and word recognition deficits. Although they observe significant progress in reading, spelling and word recognition of the students,
their design lacks a proper control group to compare the results with. It is therefore unclear how the improvements relate to the counterfactual outcome (i.e., how much progress in reading, spelling and
word recognition without a treatment). A similar treatment to BrightStar is described in Liddle et al. (2004). In four sessions, the participants are
exposed to a 15 minutes recording of resting heart-rate, followed by a 15 minutes exposure to a visual stimuli which is very similar to BrightStar.3 There is a control group which receives a placebo effect.
Although this paper finds weak evidence on the effectiveness of the technology, it has only few participants (38 in total) who are self-selected by advertisements in local newspapers.
More recently, the Center for Quantitative Methods in Eindhoven assessed the growth in reading outcomes of 209 clients treated with BrightStar (Consultants in Quantitative Methods, 2010). While they
observe ‘convincing improvements on all aspects of tests’ for a group of dyslexic clients of BrightStar, their conclusion is not based on a comparison with a control group. Instead, they measured only the difference in the pre and post intervention.
In sum, earlier literature is non-experimental and mainly considers the achievement gains in the treatment groups. This paper evaluates by a randomized control trial the effects of BrightStar at the age
of 13-16.
The paper unfolds as follows. In section 2 we describe the experimental set-up, while section 3 presents the data, descriptive statistics, as well as results from the subsets where sufficient sessions were done.
Section 4 discusses the results, while a final section concludes the paper.
2. The Experiment
The experiment took place in a secondary education school in Sneek, a small municipality in the northern part of the Netherlands. The students participating in the experiment are between 16 (birth
year 1997) and 13 (birth year 2000) years old. In the Netherlands there is a strict system of ability tracking based on national exit exams in primary education. The students participating in the experiment are tracked into lower vocational education (vmbo-gt; 31% of the observations), general
education (havo; 58% of the observations) and pre-university education (vwo; 10% of the observations). About 312 students participated in the experiment. This corresponds to almost the universe of the
students in the first three years of secondary education at the school. Only 8 students were exempted
3 Note that it is not clear from the paper whether the visual stimulus refers to Brighstar, although BrightStar, Inc is referred to in the acknowledgements.
3

from the experiment as parents were unwilling to have them participate. Given that this group of non-participating students represents only a small percentage of the total student body (only 2.5%), we do
not fear any selection effects of non-participation.
Before the start of the experiment, the parents of the students were invited to fill out a questionnaire in which they provided detailed information on, among others, the motivation of the student for
schooling, the employment status of the parents, the distance to the school and the dyslexia status of the student. The qualitative information gathered in the questionnaire was further enriched with
quantitative information provided by the school. The latter included information on the grade on the standardized test at the end of primary education (so called final CITO test), the grades on math and
Dutch language in secondary education, and the number days of authorized and unauthorized school leave. About 65% of parents participated in this questionnaire.
We created a random control and experimental group. The students in the experimental group received
a pre test in September followed by 8 BrightStar sessions at the beginning of the school year (i.e. from October till November) and 4 additional sessions in the second term (January till April). After the first 8 sessions, they received a first post test. We label this post test further on as ‘post early’. A second
posttest (post late) was taken in April 2014, after 12 sessions of BrightStar. The first session was held in school after the pre test. The following sessions were held at home and it is not known if the protocol
established by BrightStar was strictly followed. In fact many children had to be reminded to complete a minimum number of 7 interventions. To avoid any ethical issues and to avoid that we had to disappoint
control group students, it was promised to the control group students to follow the BrightStar sessions after the late posttest had been taken.
The students were randomized by the researchers in a stratified way (see Figure 1). About one fourth of
the 312 students were registered as students suffering from dyslexia. Both in the group of students with and without dyslexia, we assigned the students to a treatment and control group using a matching
analysis. Thanks to the latter econometric technique, the comparison between the groups is maximally guaranteed. We included the following variables in the matching analysis: dyslexia (as outcome
variable), the grade on the national exam at the end of primary education (final CITO-test), being right handed, age, gender, both parents are living at the same address, distance to the school, motivation for school (measured by a 5 point likert scale), father is unemployed, language at home, number of days
authorized school leave, number of days unauthorized school leave, score on language test for Dutch.
Table 1 presents the descriptive statistics of the matching variables. For the students with dyslexia the matching was very successful. For none of the characteristics we observe significant differences
between the treatment and the control group. Note that this result can partly be driven by the weak
4

power (i.e. there are only 78 students with dyslexia). Also for the students without dyslexia, the matching was successful, although to a lesser extent. We still observe weak significant differences
between the treatment and the control group on the motivation of the child and the test scores on math. In the empirical analysis below, we need to account for this.
< Table 1 about here >
All students took a wide variety of pre and posttests. The tests are well-known (inter)national tests and
are frequently used by psychologists to test the reading competencies of students as well as the ease in which students find automatisms (see, e.g., Liddle et al., 2004). The tests are described in Appendix 1.
From Figure 1, we observe that students improve their performance over time. The pretest is lower than the posttest taken in December 2013, which in turn is lower than the posttest taken in April 2014. A
similar pattern is observed for all test outcomes. While this figure indicates that the students improved over time, it does not indicate the effectiveness of the BrightStar tool. Therefore, we need to compare
the treatment and control group over time. As revealed in Table 2, some treated students did more BrightStar sessions than other students. In fact
55 students (35,5%) did not reach the minimum of 7 sessions. From the exposed students, 12 students only participated in one session while 87 students completed the required 8 sessions. Almost half of the
exposed students (44.59%) did not follow all the sessions. Given that BrightStar is expected to work only with a sufficient number of treatment sessions, in we only compare the students with more than 7
(weak treatment) and 11 (intense treatment) BrightStar sessions. As this comes at the cost of a reduced sample size, we will present these outcomes as robustness tests.
We first present in Table 3 the descriptive statistics of the pre and posts test for all students. The table
makes clear that there are few differences in outcomes before and after the intervention. This holds for both dyslexia and non-dyslexia students. As this descriptive result might hide differences in pre-test
scores as well as ceiling effects (i.e., low performing students might benefit more from the intervention than high performing students), we look at the percentage difference between the pre-test and late
post-test for students with a weak (more than 7 BrightStar sessions) and intense (more than 11 BrightStar sessions) treatment. The results are presented in Table 4. In a majority of the tests we do not observe significant differences between the intervention and control
groups, albeit that the intervention group as a whole does improve more but not in a statistically significant manner. We therefore focus on where there are significant differences.
First consider the dyslexia students who received a weak treatment. For the students with dyslexia we
observe a higher word reading fluency at DMT 2 in the intervention group. The students in the control
5

group improved their word reading fluency by 6% while students in the treatment group with a weak treatment improved the reading fluency by 12%. A similar improvement can be noticed for SBWL
objects where students in the control group decreased the time to name objects by 6% and students in the treatment group by 14%. For other outcome variables, we do not observe significant differences
between the two groups. Second, consider the dyslexia students who received an intense treatment. In the comparison of those
two groups, we further observe a significant improvement for naming objects. Students with an intense treatment of BrightStar improved their time by 16% while students in the control group by 6%. For other
outcome variables, we do not observe significant differences between the two groups. Third, consider the mainstream students who received a weak BrightStar treatment. We do not observe
significant differences between the pre- and posttests, except for a material improvement in the rapid naming of SBWL_pictures. For this outcome variable, treated students work much faster than non-
treated students. Finally, consider the mainstream students with an intense treatment. In this comparison group, we
observe in two outcome variables a significant difference between the two groups. Similar to before, BrightStar has an effect on rapid naming of pictures as treated students respond faster than control group students. We also see that BrightStar students improve more on CITO reading technique and
speed in comparison to control group students.
< Table 3 and 4, and Figure 2 about here >
3. Methodology and results.
The descriptive results of section 2 might hide heterogeneity in the data. Moreover, simply looking at the difference between the pre-test and post-test (the so-called change method) can result in
incomplete inference due to two reasons. First, the most serious issue of the change score method is regression to the mean. The difference between the pretest and posttest can be positive or negative. If
the pretest is not completely the same between the two groups, regression to the mean arises. We can show that this is the case in our sample. A second issue arises from the measurement error in test
scores. By subtracting both variables (pre and posttest), we multiply the measurement error such that the estimates become less reliable. Therefore, we prefer to use a standard regression specification. This is done on the whole data set, meaning intervention vs. control group and irrespective of how many
BrightStar sessions have been taken.
We estimate the following regression: Yi = β0 + β1 treatmenti + β1 pretesti + β Xi + εi (1)
6

Where Y denotes the posttest on a respective test of student i, β0 is a constant, treatment indicates whether the student i was randomly assigned to the treatment (treatment = 1) or control group
(treatment = 0), pretest stands for the score on the pretest, X is a vector of observed characteristics of the students and εi is an i.i.d. error term with mean 0 and a constant variance. Thanks to the random
assignment of the students to a control and treatment group, we can interpret the estimated correlation of treatment with Y as a causal effect. The coefficient of the treatment variable is the variable of
interest. In what follows below we only present this estimate.
Various alternative specifications of equation (1) are estimated. A first model specification considers the treatment as a dichotomous dummy variable (treated = 1) and includes variables to capture the
heterogeneity among students. The outcome variable is the posttest of November 2013 (posttest early). The control variables include the pre-test of the respective outcome variable, the average test score,
test score on math, test score on Dutch language, authorized school leave, unauthorized school leave and gender. A second model specification is similar to Model 1, but uses the late posttest (April 2014) as
an outcome variable. In a third model specification we modified Model 2 such that it includes the posttest early as an additional control variable. While model specifications 1-3 consider the variable of interest as a dummy variable (treated or not), a fifth specification captures the exposure to the
treatment. Not all treated students are equally exposed to BrightStar, 100 of 155 students have completed the minimum of 7 sessions or more.
The variation in treatment intensity (table 2) is used in Model 4 to replace the dichotomous treatment
indicator. In a fifth and final model specification we apply an instrumental variable (IV) approach. The exposure to the treatment is instrumented by the assignment to the treatment group. Thanks to the IV-
approach we can capture the endogeneity which arises from the selection bias. In other words, the IV-approach acknowledges that students who took less BrightStar sessions were less motivated than
students who took more BrightStar sessions.
The results of the various regression specifications are presented in Table 5. In general, most model
specifications deliver similar outcomes. In most of the specifications the estimated effect of the treatment is not significantly different from 0. Only for the SBWL pictures and SBWL letters, we observe
significant differences between the treatment and the control group. While students who were exposed to BrightStar can significantly quicker respond to pictures, they significantly read the letters slower than
students in the control group. It should be noted that pictures recognition is an important measure of whole brain activity.
< Table 5 and 6 about here >
Limiting the sample to dyslexia and mainstream students.
7

Robustness test with only dyslexia students indicates that none of the outcomes for the relevant variable is significant for both weak and intense treatment by BrightStar. If we compare the results of
Table 4 (the differences method) with the robustness tests in Table 6, we observe that the variable of interest (BS treatment) is no longer significant for the outcome variable SBWL objects. For the
subsample of dyslexia students with more than 7 BrightStar treatments, we observe a coefficient of -1.33 and a p-value of 0.13. Word reading fluency (DMT2) is highly insignificant if we control for observed
heterogeneity (coefficient of 3.54 and p-value of 0.24). A similar observation holds if we compare Table 4 to Table 6 for intensely treated students. The significance for SBWL object disappears.
For the mainstream students the results indicate that the weakly treated students read less words
correct in 60 seconds (coefficient of EMTb equals -3.18 with t-value of 1.82 and p-value of 0.070). On the other hand the weakly treated students can name faster the pictures (SBWL pictures is -1.15 with t-
value of 1.71 and p-value of 0.084). All other outcomes are insignificant. In case of the mainstream students with intense treatment of BrightStar, we observe for the response time for naming pictures an
improvement in the treatment group (coefficient of SBWL pictures amounts to -2.65 with t-value of 3.14 and p-value of 0.002). On the other hand we observe for the intensely treated mainstream students the opposite effect for reading words which indicates that the BrightStar students perform less than the
control group students (DMT1 has a coefficient of -3.66 with t-value of 1.78 and p-value of 0.078).
Overall, these results are mixed. The experiment shows that BrightStar has a negative effect on reading words for mainstream students, whereas it has a positive effect on naming pictures. In addition, we
observe a positive percentage change between post-test and pre-test late on the CITO test for participants with more than 11 BrigthStar sessions, although the significance disappears if we control for
the observed heterogeneity by the regressions.
4. Conclusion
This paper presents the outcomes of a randomized experiment to estimate the effects of BrightStar, an
innovative technology to enhance learning abilities. The results show mixed outcomes if one controls for observed heterogeneity, but favorable outcomes on various measurements when it comes to measuring percentage changes between pre and late post tests in the subsets of students with at least 7 or 11
BrightStar sessions. BrightStar results in a favorable effect on the rapid naming of pictures. Students who are treated with
BrightStar significantly reduce the time to name pictures. This effect is already observed from 7 BrightStar sessions onwards, and is reinforced with more treatments. The effect on naming pictures is
mainly driven by mainstream students, although we observe a similar sign for dyslexia students. On the
8

other hand, students treated with BrightStar perform significantly worse than control group students on the rapid naming of letters, as well as on their word reading fluency. We do not observe a significant
effect on other outcomes like rapid naming of numbers, colors, or on non-word decoding. Mainstream students with 7 or 11 sessions completed have improved their CITO scores as a result of the BrightStar
intervention when looking at the percentage change gain score method, although this effect disappears when we control for the observed heterogeneity.
The results should be interpreted with sufficient caution. First, the total group of students (dyslexia and mainstream students) is sufficiently large according to standard power analysis. However, the analyses
on subsamples of dyslexia and mainstream (non-dyslexia) students, and weak and intense treatment, do not have sufficient power. For some outcomes, e.g. the rapid naming of colors, we systematically
observe a decrease in time thanks to the BrightStar treatment. The corresponding coefficient might be insignificantly different from zero due to small subsamples. On the other hand, the treatment shows
mixed (both favorable and unfavorable) effects on most other outcome variables. As a second caution, we only estimated the effect of BrightStar on cognitive outcomes.
Third, the strict BrightStar protocol was not enforced as children did their sessions at home where there was no control over the environment in which the sessions were done. The children also needed to be reminded frequently and completed many sessions with delays, violating program protocol. Further
research should examine if in a controlled environment the outcomes can be repeated or possibly improved as the gains observed are important to enhance learning abilities also non-cognitive outcomes
as motivation, attention during class and well-being change thanks to the treatment.
References
Blok, H., Oostdam, R., Otter, M. E., & Overmaat, M. (2002). Computer-assisted instruction in support of
beginning reading instruction: A review. Review of educational research, 72(1), 101-130.
Bondorowicz, S., Kullok, J. R., & Kullok, J. R. (2004, March). A combination of computerised photic stimuli technology and special needs teachings: A new and efficient method to ameliorate deficits associated
with dyslexia. InProceedings Sixth BDA International Conference (pp. 27-30). Consultants in Quantitative Methods (2010). Treatment of dyslexia with the BrightStar method:
statistical analysis of the effects of the treatment.
Eden, G. F., & Moats, L. (2002). The role of neuroscience in the remediation of students with dyslexia. Nature Neuroscience, 5, 1080-1084.
9

Liddle, E., Jackson, G., & Jackson, S. (2005). An evaluation of a visual biofeedback intervention in dyslexic adults. Dyslexia, 11(1), 61-77.
Poole, J. (2008). Deciding Dyslexia: 14 Programmes for Helping Dyslexia & The Active Ingredient They
Share. Troubador Publishing Ltd. Zeinab, M., Elias, H., Nor, S., & Mahmud, R. (2010). The effectiveness of the intervention program on the attitude and self-concept of students with dyslexia.Journal of American Science, 6(12), 1181-1191.
10

Table 1: Descriptive statistics of the matching variables Dyslexia students without treatment Dyslexia students with treatment Difference
n Mean S.D. Min Max n Mean S.D. Min Max t-test
Grade stand. test end primary education 36 537.08 5.39 528 547 35 535.26 5.57 521 547 1.4 Right handed 37 0.81 0.4 0 1 35 0.77 0.43 0 1 0.4 Birth year 39 1998.74 1.35 1995 2001 38 1998.42 1.67 1991 2000 0.93 Gender (male = ref) 39 0.46 0.51 0 1 38 0.37 0.49 0 1 0.82 Parents live at same address 37 0.84 0.37 0 1 35 0.8 0.41 0 1 0.41 Distance to school 37 10.69 9.55 0.1 33 35 9.19 9.15 1 40 0.68 Motivation child 37 3.94 0.58 2.75 5.25 35 3.98 0.68 2.5 5.63 -0.24 Father unemployed (yes = 0) 37 0.84 0.37 0 1 35 0.86 0.36 0 1 -0.22 Language at home (0=other; 1 =Fries;
2=Dutch) 37 1.03 0.44 0 2 35 0.89 0.58 0 2 1.16 Authorized school leave (days) 39 78.69 63.99 5 256 38 69.5 53.96 0 208 0.68 Unauthorized school leave (days) 39 4.18 7.19 0 40 38 5.29 9.46 0 47 -0.58 Score math 36 48.5 22.57 11 90 35 47.89 25.73 4 100 0.1 Score Dutch language 36 51.81 24.06 14 94 35 46.66 21.13 5 88 0.95
Mainstream students without treatment Mainstream students with treatment Difference
Grade stand. test end primary education 108 535.22 9.61 453 548 113 538.19 6.05 507 549 -2.76 *** Right handed 68 0.88 0.32 0 1 72 0.86 0.35 0 1 0.37
Birth year 116 1999.72 0.49 1998 2001 119 1999.71 0.65 1996 2001 0.01 Gender (male = ref) 116 0.58 0.5 0 1 119 0.61 0.49 0 1 -0.55 Parents live at same address 68 0.87 0.34 0 1 72 0.78 0.42 0 1 1.38 Distance to school 68 9.45 8.94 1 40 72 11.59 10.48 1 35 -1.3 Motivation child 68 4.11 0.55 3.25 6 72 3.88 0.58 2.5 5.75 2.39 **
Father unemployed (yes = 0) 68 0.96 0.21 0 1 72 0.96 0.2 0 1 -0.07 Language at home (0=other; 1 =Fries;
2=Dutch) 68 1.16 0.59 0 2 72 1.13 0.58 0 2 0.37 Authorized school leave (days) 116 88.22 184.67 4 1734 119 62.77 60.65 0 493 1.42 Unauthorized school leave (days) 116 6.06 12.1 0 83 119 6.08 10.41 0 89 -0.01 Score math 107 48.1 22.21 11 97 111 59.79 24.98 2 100 -3.64 ***
Score Dutch language 106 49 21.96 7 94 111 54.86 21.49 7 97 -1.98 ** where ***, **, and * denote significance at 1, 5 and 10% level, respectively.
11
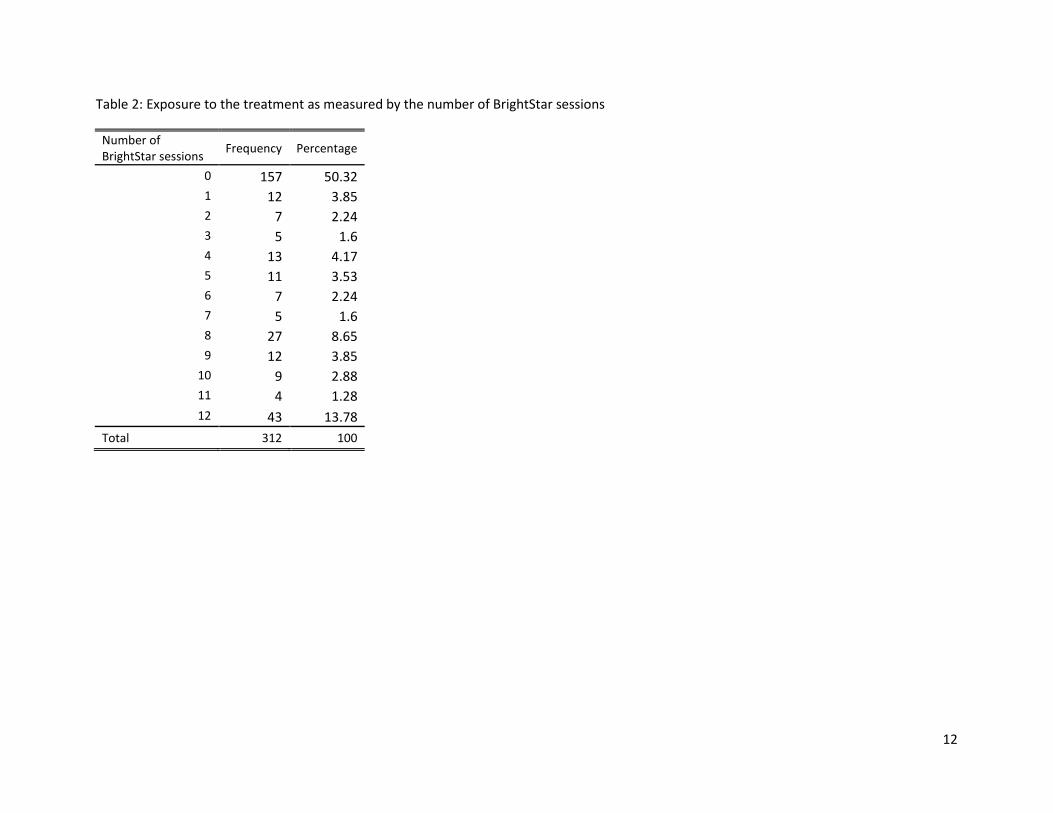
Table 2: Exposure to the treatment as measured by the number of BrightStar sessions
Number of BrightStar sessions Frequency Percentage
0 157 50.32 1 12 3.85 2 7 2.24 3 5 1.6 4 13 4.17 5 11 3.53 6 7 2.24 7 5 1.6 8 27 8.65 9 12 3.85
10 9 2.88 11 4 1.28 12 43 13.78
Total 312 100
12

Table 3: Descriptive statistics of the pre and post test Dyslexia students without treatment Dyslexia students with treatment Difference
Mean S.D. Min Max Mean S.D. Min Max Difference t-test Word Reading Fluency (DMT) 1 - pre 100.65 20.54 57 134 95.71 17 57 132 4.94 1.141 Word Reading Fluency (DMT) 1 - post early 94.3 21.26 52 129 88.97 19 50 125 5.33 1.1 Word Reading Fluency (DMT) 1 - post late 79.81 19.94 35 118 74.97 17 37 108 4.84 0.661 Word Reading Fluency (DMT) 2 - pre 62.14 19.5 23 97 64.82 18 27 99 -2.68 1.136 Word Reading Fluency (DMT) 2 - post early 37.78 7.81 25 59 38.45 7.6 26 55 -0.67 0.895 Word Reading Fluency (DMT) 2 - post late 24.68 7.33 17 55 23.34 5.7 17 41 1.34 0.305 Word Reading Fluency (DMT) 3 - pre 39.97 6.2 29 55 41.24 6.4 29 57 -1.27 1.124 Word Reading Fluency (DMT) 3 - post early 24.27 6.42 15 42 22.76 5.4 16 43 1.51 0.94 Word Reading Fluency (DMT) 3 - post late 26.08 7.65 17 53 27.87 7.4 18 51 -1.79 0.889 Non-word decoding (Klepel) - pre 39 15.89 24 103 40.45 13 23 80 -1.45 -0.62 Non-word decoding (Klepel) - post early 72.11 16.68 28 99 68.87 15 38 98 3.24 -0.83 Non-word decoding (Klepel) - post late 45.51 12.27 21 80 45.74 12 21 74 -0.23 0.642 SBWL colours - pre 102.08 18.02 71 142 97.68 16 54 130 4.4 -0.37 SBWL colours - post early 97.72 22.02 51 147 93.37 20 48 134 4.35 0.59 SBWL colours - post late 82.58 17.12 54 119 78.89 17 42 113 3.69 0.607 SBWL numbers - pre 57.44 17.6 28 97 60.75 16 27 103 -3.31 0.882 SBWL numbers - post early 37.25 7.8 26 57 36.32 5.7 28 51 0.93 0.715 SBWL numbers - post late 22.67 4.45 15 37 21.92 4.5 17 40 0.75 0.622 SBWL pictures - pre 39.03 6.82 25 54 39.13 5.5 29 49 -0.1 -0.87 SBWL pictures - post early 22.03 5.08 14 34 21.42 4.6 16 36 0.61 -0.07 SBWL pictures - post late 24.83 5.69 15 39 26.03 6.7 17 45 -1.2 0.59 SBWL letters - pre 35.44 10.46 21 62 38.37 16 21 119 -2.93 1.098 SBWL letters - post early 74.33 14.94 43 104 73.03 15 48 109 1.3 0.54 SBWL letters - post late 49.81 13.04 23 77 51.61 14 27 88 -1.8 -0.02 SBWL objects - pre 110 20.19 74 144 106.91 18 73 140 3.09 -1.03 SBWL objects - post early 99.97 22.05 55 147 98.44 19 59 133 1.53 -0.82 SBWL objects - post late 86.24 18.22 56 119 82.32 18 50 120 3.92 -0.47
13

Word reading fluency (EMTb-50) - pre 70.67 19.99 29 111 67.76 17 43 109 2.91 -0.43 Word reading fluency (EMTb-50) - post early 35.06 7.96 23 56 34.09 4.9 27 44 0.97 -0.93 Word reading fluency (EMTb-50) - post late 21.99 4.1 15 31 21.35 4.3 16 33 0.64 -0.21 Word reading fluency (EMTb) - pre 38.59 12.47 27 101 37.21 5.6 27 49 1.38 0.89 Word reading fluency (EMTb) - post early 20.86 3.66 14 30 20.88 4.7 16 35 -0.02 0.381 Word reading fluency (EMTb) - post late 23.56 5.08 14 38 24.18 5.7 18 39 -0.62 0.316 Cito reading technique and speed - pre 31.91 8.54 13 52 32.41 11 1 60 -0.5 -0.08 Cito reading technique and speed - post early 79.32 15.98 50 109 78.09 16 50 108 1.23 -0.57 Cito reading technique and speed - post late 57.53 15.81 28 96 57.24 16 35 98 0.29 0.076
Mainstream students without treatment
Mainstream students with treatment Difference
Mean S.D. Min Max Mean S.D. Min Max Difference t-test Word Reading Fluency (DMT) 1 - pre 110.07 15.75 52 147 112.15 16 55 149 -2.08 -0.99 Word Reading Fluency (DMT) 1 - post early 106.13 18.58 47 199 106.48 16 53 148 -0.35 -1.11 Word Reading Fluency (DMT) 1 - post late 92.55 14.28 32 162 92.64 13 40 120 -0.09 -0.62 Word Reading Fluency (DMT) 2 - pre 80.86 16.89 38 114 79.39 17 32 111 1.47 -0.15 Word Reading Fluency (DMT) 2 - post early 35.15 6.04 20 53 36.7 6.8 20 55 -1.55 -0.63 Word Reading Fluency (DMT) 2 - post late 21.35 3.25 13 36 21.62 3.8 15 34 -0.27 -0.51 Word Reading Fluency (DMT) 3 - pre 38.39 7.02 27 59 38.92 6.5 27 58 -0.53 -0.05 Word Reading Fluency (DMT) 3 - post early 20.5 2.96 14 35 20.7 3.2 15 33 -0.2 -0.41 Word Reading Fluency (DMT) 3 - post late 22.62 4.58 15 49 22.65 4.4 17 45 -0.03 -0.44 Non-word decoding (Klepel) - pre 31.2 9.53 15 104 32.19 11 20 100 -0.99 0.663 Non-word decoding (Klepel) - post early 83.44 13.89 21 116 83.35 15 43 155 0.09 0.085 Non-word decoding (Klepel) - post late 56.19 11.08 22 86 53.51 12 26 81 2.68 -0.33 SBWL colours - pre 112.85 15.66 68 150 115.23 16 66 149 -2.38 -1.82 SBWL colours - post early 109.62 16.74 46 150 111.01 16 58 149 -1.39 -1.67 SBWL colours - post late 96.15 13 31 120 96.87 13 47 120 -0.72 -0.52 SBWL numbers - pre 76.88 17.5 38 147 76.68 16 39 113 0.2 -0.57 SBWL numbers - post early 33.72 5.49 18 48 35.77 12 25 125 -2.05 0.106 SBWL numbers - post late 20.31 3.54 12 30 20.26 3.7 13 35 0.05 -0.1 SBWL pictures - pre 37.2 6.91 25 60 36.57 5.8 24 54 0.63 -0.6 SBWL pictures - post early 19.14 3.06 11 32 19.54 3.9 14 42 -0.4 0.743 SBWL pictures - post late 21.29 3.71 13 41 21.62 4 14 38 -0.33 1.443
14

SBWL letters - pre 29.08 7.17 18 75 28.89 6.1 20 63 0.19 -0.49 SBWL letters - post early 88.08 13.34 40 115 87.05 14 34 117 1.03 -0.86 SBWL letters - post late 62.61 12.81 22 97 61.27 13 27 98 1.34 -1.18 SBWL objects - pre 120.28 16.63 62 150 121.69 17 66 150 -1.41 -0.05 SBWL objects - post early 112.44 16.95 43 150 113.63 18 46 150 -1.19 -0.65 SBWL objects - post late 96.57 13.33 35 120 97.38 14 43 120 -0.81 -0.59 Word reading fluency (EMTb-50) - pre 85.1 17.6 36 116 85.88 17 29 116 -0.78 -0.73 Word reading fluency (EMTb-50) - post early 32.74 5.59 21 51 33.15 6 22 52 -0.41 0.222 Word reading fluency (EMTb-50) - post late 19.95 3.39 13 33 20 3.9 14 39 -0.05 0.145 Word reading fluency (EMTb) - pre 36.88 6.45 25 56 35.6 6.7 1.01 53 1.28 0.048 Word reading fluency (EMTb) - post early 18.8 2.91 13 30 19.35 3.8 13 36 -0.55 0.566 Word reading fluency (EMTb) - post late 21.17 4.21 14 38 21.51 4.5 14 42 -0.34 0.854 Cito reading technique and speed - pre 29.75 8.19 18 84 29.58 9.3 1.1 98 0.17 1.776 *
Cito reading technique and speed - post early 89.66 13.96 31 115 87.94 16 22 116 1.72 0.779 * Cito reading technique and speed - post late 65.75 13.53 24 98 64.19 14 26 99 1.56 0.843
where ***, **, and * denote significance at 1, 5 and 10% level, respectively.
15
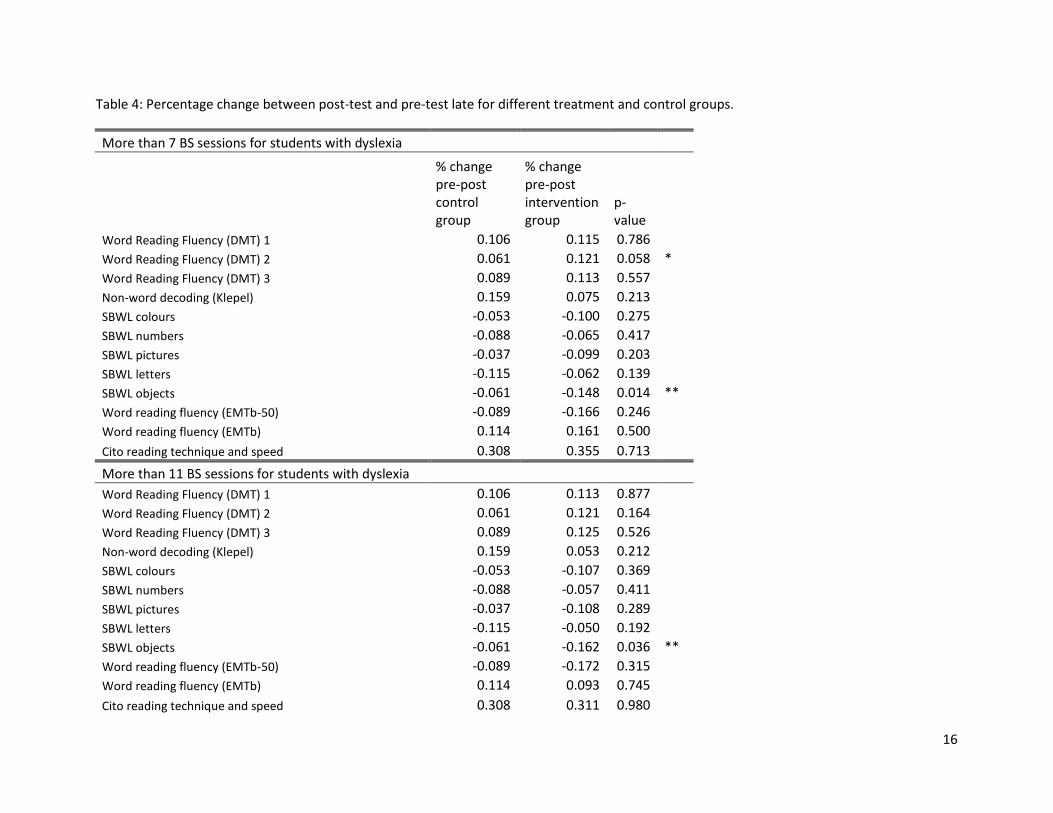
Table 4: Percentage change between post-test and pre-test late for different treatment and control groups.
More than 7 BS sessions for students with dyslexia
% change pre-post control group
% change pre-post intervention group
p-value
Word Reading Fluency (DMT) 1 0.106 0.115 0.786 Word Reading Fluency (DMT) 2 0.061 0.121 0.058 *
Word Reading Fluency (DMT) 3 0.089 0.113 0.557 Non-word decoding (Klepel) 0.159 0.075 0.213 SBWL colours -0.053 -0.100 0.275 SBWL numbers -0.088 -0.065 0.417 SBWL pictures -0.037 -0.099 0.203 SBWL letters -0.115 -0.062 0.139 SBWL objects -0.061 -0.148 0.014 **
Word reading fluency (EMTb-50) -0.089 -0.166 0.246 Word reading fluency (EMTb) 0.114 0.161 0.500 Cito reading technique and speed 0.308 0.355 0.713 More than 11 BS sessions for students with dyslexia
Word Reading Fluency (DMT) 1 0.106 0.113 0.877 Word Reading Fluency (DMT) 2 0.061 0.121 0.164 Word Reading Fluency (DMT) 3 0.089 0.125 0.526 Non-word decoding (Klepel) 0.159 0.053 0.212 SBWL colours -0.053 -0.107 0.369 SBWL numbers -0.088 -0.057 0.411 SBWL pictures -0.037 -0.108 0.289 SBWL letters -0.115 -0.050 0.192 SBWL objects -0.061 -0.162 0.036 **
Word reading fluency (EMTb-50) -0.089 -0.172 0.315 Word reading fluency (EMTb) 0.114 0.093 0.745 Cito reading technique and speed 0.308 0.311 0.980
16

More than 7 BS sessions for mainstream students Word Reading Fluency (DMT) 1 0.102 0.083 0.191
Word Reading Fluency (DMT) 2 0.076 0.068 0.580 Word Reading Fluency (DMT) 3 0.051 0.057 0.681 Non-word decoding (Klepel) 0.072 0.104 0.162 SBWL colours -0.064 -0.077 0.411 SBWL numbers -0.068 -0.080 0.391 SBWL pictures -0.036 -0.066 0.098 *
SBWL letters -0.078 -0.071 0.667 SBWL objects -0.060 -0.058 0.896 Word reading fluency (EMTb-50) -0.019 -0.071 0.143 Word reading fluency (EMTb) 0.111 0.059 0.299 Cito reading technique and speed 0.183 0.243 0.064 More than 11 BS sessions for mainstream students
Word Reading Fluency (DMT) 1 0.102 0.083 0.187 Word Reading Fluency (DMT) 2 0.076 0.068 0.878 Word Reading Fluency (DMT) 3 0.051 0.057 0.569 Non-word decoding (Klepel) 0.072 0.104 0.248 SBWL colours -0.064 -0.077 0.763 SBWL numbers -0.068 -0.080 0.223 SBWL pictures -0.036 -0.066 0.000 ***
SBWL letters -0.078 -0.071 0.469 SBWL objects -0.060 -0.058 0.737 Word reading fluency (EMTb-50) -0.019 -0.071 0.355 Word reading fluency (EMTb) 0.111 0.059 0.695 Cito reading technique and speed 0.183 0.243 0.004 ***
where ***, **, and * denote significance at 1, 5 and 10% level, respectively. A negative sign indicates that the post-test was lower than the pre-test; which is a favorable direction for SBWL tests as it takes less time and therefore improvement, and an unfavorable direction for the other tests as less words can be read.
17

Table 5: Regression estimates of Equation (1) for all students (dyslexia and non-dyslexia)
Word Reading Fluency 1
Word Reading Fluency 2
Word Reading Fluency 3
Non-word decoding (Klepel)
SBWL colours
SBWL numbers
SBWL pictures
SBWL letters
SBWL objects
Word reading fluency (EMTb-50)
Word reading fluency (EMTb)
Cito reading technique and speed
Model 1: Post test early is outcome variable - Treatment as dummy variable (treated = 1) - Includes all control variables
Estimate -0.20 -0.07 -0.44 0.26 0.51 0.04 -0.83 0.44 0.34 0.18 -1.55 0.88
t-test -0.22 -0.07 -0.55 0.22 0.54 0.15 -1.68 1.28 1.13 0.25 -1.53 0.98
Model 2: Post test late is outcome variable - Treatment as dummy variable (treated = 1) - Includes all control variables
Estimate -0.62 0.96 0.46 0.59 -0.86 0.07 -1.60 0.58 0.18 -0.43 -1.58 -0.36
t-test -0.54 0.84 0.50 0.43 -1.70 0.26 -2.14 1.86 0.45 -0.40 -1.11 -0.29
Model 3: Post test late is outcome variable - Treatment as dummy variable (treated = 1) - Includes all control variables + post test early
Estimate -0.37 1.24 0.19 0.85 -0.86 0.08 -0.89 0.37 -0.07 -0.19 -0.45 -0.37
t-test -0.34 1.34 0.25 0.67 -1.77 0.33 -1.36 1.33 -0.19 -0.18 -0.34 -0.35
Model 4: Post test late is outcome variable - Measures the exposure to the treatment - Includes all control variables
Estimate -0.13 0.09 0.06 0.05 -0.06 -0.01 -0.16 0.06 -0.02 0.01 -0.20 0.01
t-test -1.09 0.76 0.63 0.34 -1.20 -0.39 -2.06 1.88 -0.49 0.10 -1.28 0.08
Model 5: Post test late is outcome variable - IVregression with exposure to the treatment instrumented by assignment to the treatment - All control variables
Estimate -0.08 0.13 0.06 0.08 -0.11 0.01 -0.21 0.08 0.02 -0.06 -0.21 -0.05
t-test -0.55 0.86 0.47 0.43 -1.72 0.26 -2.17 1.90 0.48 -0.43 -1.13 -0.29
Note: significant variables in red and bold. The control variables include the pre-test of the respective outcome variable, the average test score, test score on math, test score on Dutch language, authorized school leave, unauthorized school leave, gender and dyslexia status Including other control variables result in robust outcomes. Robustness checks for scores in DLE, for dyslexia students only and for students without dyslexia only deliver similar outcomes
18

Table 6. Robustness tests for subpopulations with weak and intense treatment of Brightstar – All students, dyslexia and mainstream students
Word Reading Fluency 1
Word Reading Fluency 2
Word Reading Fluency 3
Non-word decoding (Klepel)
SBWL colours
SBWL numbers
SBWL pictures
SBWL letters
SBWL objects
Word reading fluency (EMTb-50)
Word reading fluency (EMTb)
Cito reading technique and speed
All students - Weak treatment (number of Brightstar sessions is >= 7) Model 3: Post test late is outcome variable - Treatment as dummy variable (treated = 1) - Includes all control variables + post test early
Estimate -0.953 1.234 0.971 0.778 -0.891 -0.089 -1.530 0.620 -1.156 -0.916 -1.666 -0.304
t-test 0.750 0.980 0.930 0.550 1.580 0.270 2.000 1.780 0.410 0.910 1.120 0.230
p-value 0.455 0.330 0.351 0.585 0.115 0.790 0.047 0.076 0.680 0.365 0.262 0.822
All students - Intense treatment (Number of Brightstar sessions >= 11) Model 3: Post test late is outcome variable - Treatment as dummy variable (treated = 1) - Includes all control variables + post test early
Estimate -2.811 1.024 -0.148 -0.320 -0.572 0.056 -2.854 1.089 0.167 0.634 -2.655 0.523
t-test -1.580 0.570 0.100 0.170 0.720 0.120 2.670 2.270 0.320 0.490 1.500 0.300
p-value 0.110 0.569 0.920 0.866 0.472 0.905 0.008 0.025 0.751 0.626 0.135 0.768
Dyslexia - Weak treatment (number of Brightstar sessions is >= 7) Model 3: Post test late is outcome variable - Treatment as dummy variable (treated = 1) - Includes all control variables + post test early
Estimate 1.041 3.540 1.330 -3.925 -2.232 -0.450 -2.607 1.150 1.332 -1.222 1.131 -0.376
t-test 0.390 1.170 0.510 1.040 1.440 0.580 0.960 1.220 1.550 0.420 0.330 -0.090
p-value 0.702 0.249 0.610 0.302 0.158 0.565 0.342 0.228 0.129 0.676 0.740 0.929
Dyslexia - Intense treatment (Number of Brightstar sessions >= 11) Model 3: Post test late is outcome variable - Treatment as dummy variable (treated = 1) - Includes all control variables + post test early
Estimate -0.542 1.855 1.268 -3.955 -2.774 -0.189 -3.149 1.381 -1.281 -0.549 -2.738 -0.683
t-test 0.150 0.440 0.350 0.950 1.320 0.180 0.870 0.120 1.040 0.170 0.760 0.150
p-value 0.882 0.665 0.731 0.349 0.190 0.855 0.392 0.272 0.307 0.863 0.450 0.884
Mainstream - Weak treatment (number of Brightstar sessions is >= 7) Model 3: Post test late is outcome variable - Treatment as dummy variable (treated = 1) - Includes all control variables + post test early
Estimate -2.092 -0.516 0.680 2.429 -0.469 -0.262 -1.160 0.353 0.270 -0.416 -3.185 -0.374
t-test 1.400 0.360 0.590 1.550 0.800 0.770 1.710 1.030 0.640 0.380 1.820 0.270
p-value 0.163 0.717 0.557 0.124 0.426 0.442 0.088 0.307 0.524 0.705 0.070 0.789
19

Mainstream - Intense treatment (Number of Brightstar sessions >= 11) Model 3: Post test late is outcome variable - Treatment as dummy variable (treated = 1) - Includes all control variables + post test early
Estimate -3.666 0.299 -0.471 1.332 -0.072 -0.589 -2.649 0.605 0.689 1.106 -2.913 0.874
t-test 1.780 0.150 0.300 0.610 0.090 1.270 3.140 1.410 1.240 0.770 1.421 0.470
p-value 0.078 0.881 0.768 0.542 0.927 0.208 0.002 0.162 0.219 0.445 0.159 0.640
Note: significant variables in red and bold. The control variables include the pre-test of the respective outcome variable, the average test score, test score on math, test score on Dutch language, authorized school leave, unauthorized school leave and gender Including other control variables result in robust outcomes.
20

21

Figure 1: Pre and posttests for DMT1 for control and treatment group
0.0
1.0
2.0
3
50 100 150x
Pretest - Control Pretest - TreatmentPost early - control Post early - TreatmentPost late - Control Post late - Treatment
22

Figure 2: Design of the experiment
Post-test long term effect
Post-test short term effect
No BrightStar (control group) (n =
39)
No BrightStar (control group) (n =
116 )
Receives BrightStar (experimental group)
(n =119 )
October 2013
November 2013
April 2014
Timeline
Control group students receive BrightStar afterwards
Pre-test
Receives BrightStar (experimental group)
(n = 38 )
All students (n = 312)
No dyslexia (n = 235)
Dyslexia (n = 77)
Randomisation Randomisation
23

Appendix 1: Description of the pre and post tests Word Reading Fluency (DMT; One-Minute-Test) Source: Verhoeven, 1995 – CITO Description: The DMT is a standardized Dutch test to measure fluency of reading syllable and multisyllabic words. The task is to read as many words as possible, correctly, from each card within 1 min. The score is the number of read words minus the number of incorrectly read words. The scores of the specific tests are translated into raw scores, CITO scores, didactical age equivalent scores and learning effectiveness measures. Non-word decoding Test (aka Klepel test). Source: Van den Bos, Lutje Spelberg, Scheepstra, & De Vries, 1994 Description: This test provides a standardized measure of non-word decoding. For 2 minutes the client has to read as many words as possible from a list of non-words. With each item the complexity of words increases. The outcomes of the test are standardized scores in the range from 1 to 19. A score of 10 is the average, while a score of 1-6 denotes a failure. Rapid Naming and Reading Words (SBWL) Source: K.P. van den Bos, University Groningen Description: Rapid naming tests the ability to connect visual and verbal information by giving the appropriate names to common objects, colors, letters and digits. The vast majority of children and adults with reading disabilities have pronounced difficulties when asked to name that most familiar visual symbols and stimuli in the language. The client is shown different cards and is asked to name them all out loud. The examiner records the number of seconds the client needs to accomplish the task. Errors are ignored for scoring purposes. The raw scores of the specific parts are translated into standardised scores. Word Reading Fluency (EMTb) Source: Brus & Voeten, 1973 Description: EMTb is a standardized Dutch test measuring general word reading fluency with 116 words of increasing difficulty. The participant is asked to read aloud as many words as possible in 1 min. Accuracy and speed are of importance. The test score is the number of words read correctly in 60 seconds and the amount of seconds on the 50th item (EMTb50) Cito Reading Technique and Tempo Source: Cito group, Arnhem 2004 Description: The Cito reading test measures the quiet reading skills and reading speed as a condition for comprehensive reading and word recognition. It is a time test on 14 different levels. The scores of the tests are translated into Cito scores, didactical age equivalent scores and learning effectiveness measures.
24

TIER WORKING PAPER SERIES
TIER WP 14/29 © TIER 2014
ISBN 978-94-003-0099-6


![Effectiveness of Computer-Assisted Stad [1] gambari ... · Effectiveness of Computer-Assisted Stad Cooperative Learning Strategy on Physics Problem Solving, Achievement and Retention](https://img.dokumen.tips/doc/110x75/5fb1c0bf98cb1e49f67af399/effectiveness-of-computer-assisted-stad-1-gambari-effectiveness-of-computer-assisted.jpg)