Embed Size (px)
Citation preview

EXPERIENCE WITH ONLINE WATER QUALITY MONITORING IN A DISTRIBUTION SYSTEM
June 6, 2012
Molly Wade
City of Ann Arbor
Janice Skadsen
CDM Smith
Michigan Water Utility
Security Summit

Project Goals
• Develop an on-line water quality program for the distribution system to:
– Provide for security enhancements to the system to maximize public health protection from contamination events.
– Monitor natural water quality changes in the distribution system.
Final Workshop

Review of Phase 1
• Reviewed relevant data, literature, experiences at other utilities
• Conducted site visits
• Evaluated monitoring locations using USEPA TEVA SPOT and EPANET programs
• Selected monitoring parameters
• Pilot tested multiple manufacturers of selected parameters
• Performed preliminary response planning
Final Workshop
Phase 2 Tasks
• Perform long term (6 month) test of two monitoring stations
• Evaluate CANARY EDS (Event Detection System)
• Complete a response plan for contamination incidents
• Develop recommendations for future deployment
Final Workshop

Monitoring Panel
Parameter Phase 1 Recommendations
Phase 2 Deployment
UVAS (UV254) Hach Hach
pH Not evaluated Hach
ORP Not tested Hach
DO In Situ or YSI Hach
Conductivity In Situ Hach
Total Chlorine Siemens (US Filter) ProMinent
Final Workshop
• pH was not originally evaluated as the water is well buffered
• ORP was not originally identified as parameter of interest
• Hach was selected to provide single manufacturer for the monitoring panel

Installed Monitoring Panel
Final Workshop

Sensors
Final Workshop

Local Display and Control Panel
Final Workshop

Monitoring Locations
• WTP
• Liberty Pump Station (LPS)
Final Workshop

Calibration Approach
1. Primary calibration:
– Performed using one or two standards
– Difficult and requires significant time when temperatures are low or high
2. Bench comparison:
– Collect sample, analyze immediately, adjust sensors
– Can require extra trip to Liberty
– Needed to acquire portable analyzers
3. Level of effort for bench comp:
1. 2 Hr/wk + travel time per panel
Final Workshop

Calibration Criteria
Final Workshop
Parameter Acceptable Difference between
grab sample and on-line data
Frequency of site visit and grab
sample collection
pH 0.1 Monthly
ORP 40 mV Every 2 weeks
Conductivity 40 uS Every 2 weeks
DO 0.5 mg/L Every 2 weeks
Chlorine 0.3 mg/L Every 2 weeks
Temperature 0.1 oC Monthly
Flow 500 to 900 mls/min acceptable
range
Monthly

Data Results - Conductivity
Final Workshop

Observations – Conductivity
• Conductivity higher and more variable in the fall
• Variability does not relate to rainfall
• Conductivity at WTP and remote sites correlated
Final Workshop

Data Results- LDO
Final Workshop

Data Results- LDO
Final Workshop

Observations - LDO
• DO lower in summer than winter – expected based on temperature impact on concentration
• DO is consistently supersaturated
• Liberty reflects combination of WTP and water age
Final Workshop

Data Results - pH
Final Workshop

Data Results - pH
Final Workshop

Observations - pH
• Consistent pH expected since controlled by WTP
• Do see decreases with water age in Liberty Reservoir
• Outliers often but not always related to primary calibration events.
Final Workshop

Data Results - ORP
Final Workshop

Data Results - ORP
Final Workshop

Observations - ORP
• Instrument stability a concern
• Experience at other utilities suggests that ORP is prone to drift and interference
• Water age impact at Liberty observed
• Liberty generally lower conductivity than WTP
Final Workshop

Data Results – Total Chlorine
Final Workshop

Data Results – Total Chlorine
Final Workshop

Observations – Total Chlorine
• WTP produces very consistent TRC
• Liberty total chlorine shifts with pumping & water age
• Liberty total chlorine 0.5 to 1.0 mg/L lower than WTP
• Issues with Liberty chlorine meter until fall of 2011
Final Workshop

Data Results - UVAS
Final Workshop

Data Results - UVAS
Final Workshop

Observations - UVAS
• High variability in data
• Good correlation between WTP and remote site instrument values
• Increased UVAS rates at remote site – cause unknown
• Instrument and lab results show poor correlation - instrument can only be factory calibrated
Final Workshop
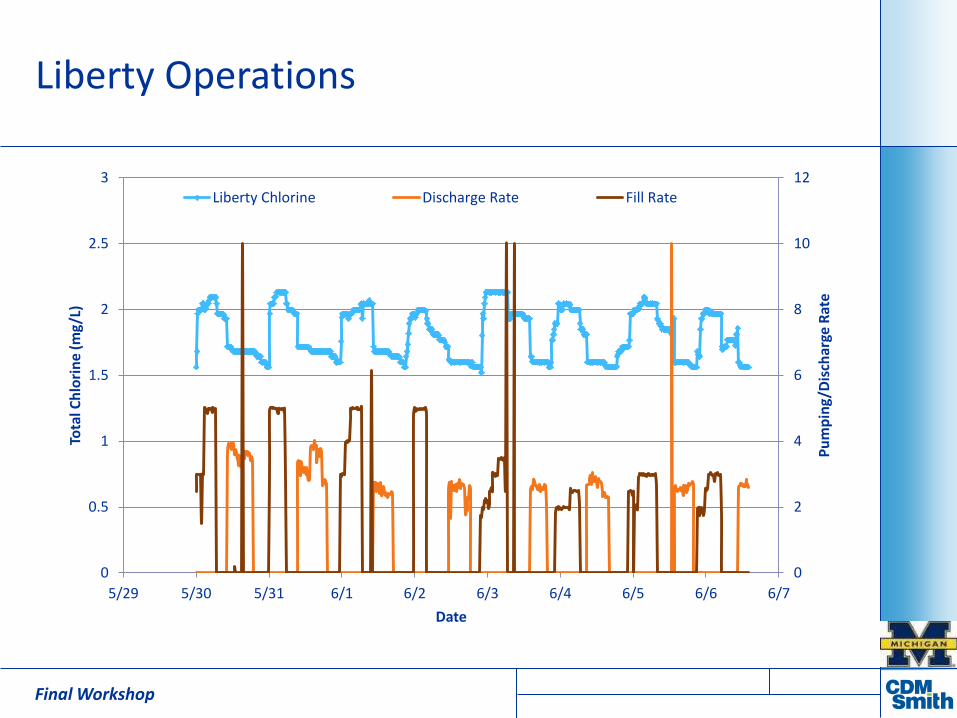
Liberty Operations
Final Workshop
0
2
4
6
8
10
12
0
0.5
1
1.5
2
2.5
3
5/29 5/30 5/31 6/1 6/2 6/3 6/4 6/5 6/6 6/7
Pu
mp
ing/
Dis
char
ge R
ate
Tota
l Ch
lori
ne
(mg/
L)
Date
Liberty Chlorine Discharge Rate Fill Rate

Liberty Operations
Final Workshop
0
2
4
6
8
10
12
10
10.5
11
11.5
12
12.5
13
13.5
14
5/29 5/31 6/2 6/4 6/6
Pu
mp
ing
/Dis
char
ge R
ate
Dis
solv
ed O
xyge
n (
mg
/L)
Date
DO Liberty
0
2
4
6
8
10
12
400
420
440
460
480
500
520
540
560
580
600
5/29 5/31 6/2 6/4 6/6 6/8
Pu
mp
ing/
Dis
char
ge R
ate
Co
nd
uct
ivit
y (u
S)
Date
Liberty Cond.
0
2
4
6
8
10
12
300
310
320
330
340
350
360
370
380
5/29 5/31 6/2 6/4 6/6 6/8
Pu
mp
ing/
Dis
char
ge R
ate
OR
P (
mV
)
Date
Liberty ORP
0
2
4
6
8
10
12
2
2.5
3
3.5
4
4.5
5
5.5
6
5/29 5/31 6/2 6/4 6/6 6/8
Pu
mp
ing
/ D
isch
arge
Rat
e
UV
25
4 (
m-1
)
Date
Liberty UVAS

Observations – Liberty Operations
• Water Age in Liberty Reservoir demonstrates degradation of water quality
• Observed for multiple parameters
– Total chlorine
– Dissolved Oxygen
– pH
– ORP
– UVAS
– Conductivity?
Final Workshop

Maintenance
Final Workshop
Sensor Quarterly Biyearly Annual
pH Clean sensor Replace salt bridge and
buffer solution
ORP Clean sensor Replace salt bridge and
buffer solution
LDO Inspect; clean as needed Replace sensor cap
Conductivity Inspect; clean as needed
UVAS Inspect; clean as needed Replace wiper blade
Replace O-ring
Temperature Inspect; clean as needed
Chlorine Inspect; clean as needed Replace electrolyte &
sensor as needed
New probe (every two
years)

Annual Time & Materials for Monitoring Panel
Final Workshop
Activity Annual Equipment Cost Annual Labor Hours Annual Labor Cost at
$100/hour
Site visit/Calibration $165 94 $9,600
Routine maintenance $1,657 14 $1,400
Replacement Cost $3,440 0 $0
Contingency (10%) $526 11 $1,100
Total Planning Level Budget $5,800 119 $12,100

CANARY EVENT DETECTION SYSTEM

Event Detection System Analyzes Monitoring Data in Real Time
Final Workshop
Conductivity
Dissolved Oxygen (DO)
Total Chlorine
Oxidation Reduction Potential (ORP)
pH
UV 254 (TOC)

Final Workshop
Conductivity
Dissolved Oxygen (DO)
Total Chlorine
Oxidation Reduction Potential (ORP)
pH
UV 254 (TOC)
Event Detection System Analyzes Monitoring Data in Real Time

An Event Occurs When Water Quality Significantly Deviates from Observed Trends
Final Workshop
• Recognize deviation from
– The most recent data
(data spikes)
– Long-term trends

Process to Detect Events in Real-Time
1) Predict what water quality should look like
Recent Data
Predicted Value based on expected trend
Final Workshop

Process to Detect Events in Real-Time
1) Predict what water quality should look like
2) Measure actual water quality
3) Determine the distance between predicted and actual water quality (= residual)
4) Compare residual to a threshold
> Threshold = Outlier
Final Workshop

Binomial Event Discriminator used to Distinguish Contamination Events from Random Outliers
Final Workshop
CANARY Algorithms
• LPCF – Linear Prediction Filter
• MVNN – Multivariate Next Neighbor
• SPP – Set Point Proximity
Final Workshop

Example:
CANARY output
Contributions to
alarms
Probability of
event

False Alarms
• Natural variation in water quality signals and sensor error makes false alarms common
• Take up time
• Decrease operators’ perception of risk
• Want to maintain sensitivity to detect real events (should not allow false negatives)
Final Workshop

Maintaining Sensitivity – monitoring data only contains false positives and true negatives
Final Workshop
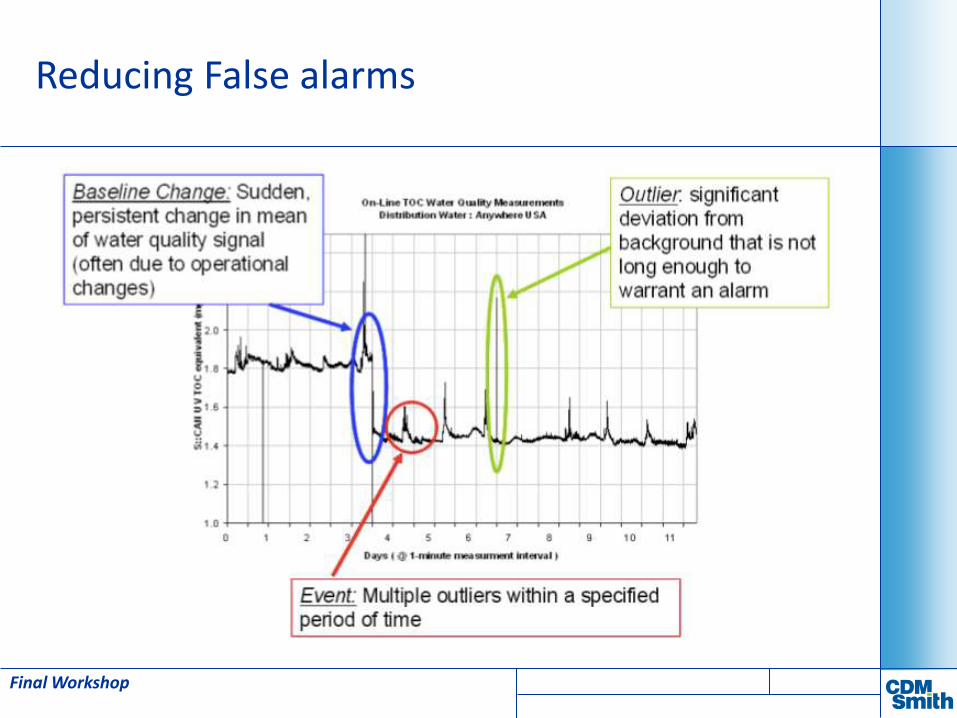
Reducing False alarms
Final Workshop

Algorithm Type
• MVNN selected – produces least false alarms
• All parameters held constant:
0 5 10 15 20 25
Conductivity
Dissolved Oxygen
Redox Potential
pH
Chlorine Residual
UVAS
Total # alarm events
LPCF
MVNN
(SPP algorithms produced an error)
Final Workshop

Using a simplified adaption of event simulation, multiplied water quality signals by a simulation intensity factor
simulated event
detected
Final Workshop

False positive rate less than one percent – sensitivity maintained
Event 1 Event 3
Including data anomalies as TP
Not including data anomalies as TP
Including data anomalies as TP
Not including data anomalies as TP
False Positives 2 7 2 9
True Positives 11 6 10 3
False Negatives 2 2 3 2
True Negatives 914 903 914 915
False Positive Rate = FP/(FP+TM) 0.0022 0.0077 0.0022 0.0097
True Positive Rate = TP/(TP‐FN) 0.8462 0.7500 0.7692 0.6000
Simulated Events Create True Positives and False Negatives
Final Workshop
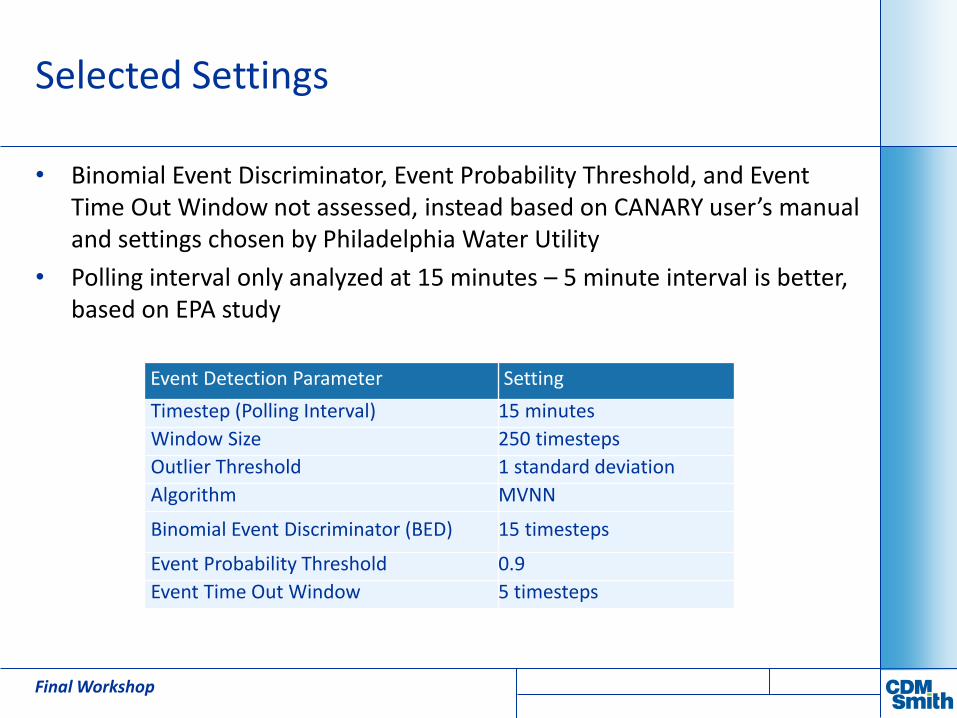
Selected Settings
• Binomial Event Discriminator, Event Probability Threshold, and Event Time Out Window not assessed, instead based on CANARY user’s manual and settings chosen by Philadelphia Water Utility
• Polling interval only analyzed at 15 minutes – 5 minute interval is better, based on EPA study
Event Detection Parameter Setting
Timestep (Polling Interval) 15 minutes
Window Size 250 timesteps
Outlier Threshold 1 standard deviation
Algorithm MVNN
Binomial Event Discriminator (BED) 15 timesteps
Event Probability Threshold 0.9
Event Time Out Window 5 timesteps
Final Workshop

CANARY Issues Experienced
Final Workshop
• Variability in water quality data and inevitable malfunctions in monitoring equipment cause false alarms
– False alarms require operator time and reduce operator confidence in the system
– Failure to detect an event must be avoided
• CANARY output can be difficult to analyze
• Problems were frequently encountered, especially during configuration
• Trouble shooting resources are few and slow

Recommendations
• Continue to utilize existing monitoring station at WTP
• Consider deploying Liberty monitoring station as mobile unit
– Develop correlations between WTP and each parameter over 1-year period (other reservoirs, elevated tanks)
– Examine areas with water qualtiy changes due to nitrification or corrosion
– Full deployment with multiple remote stations not recommended until calibration effort of instruments is reduced (more stable instruments) and EDS is well developed
• Continue to monitor improvements in CANARY and alternate EDSs
Final Workshop

Water Quality Monitoring is Only Part of a Contaminant Warning System
Final Workshop
Response Plan

Project Team
• Andrea Trese, University of Michigan
• Larry Sanford, City of Ann Arbor
• Rob Coon, City of Ann Arbor
• Glenn Maggard, City of Ann Arbor
• Brian Steglitz, City of Ann Arbor
• Ameet Pinto, University of Michigan
• Lutgarde Raskin, University of Michigan
• Mark TenBroek, CDM Smith
• Justin Woods, CDM Smith
Final Workshop

Questions?
Final Workshop