Embed Size (px)
Citation preview
EXPERIENCE WITH ALTERNATIVE LEACHING PROTOCOLS FOR MERCURY-BEARING WASTE
Florence Sanchez, Ph.D.David S. Kosson, Ph.D.
Catherine H. MattusMichael I. Morris
Breaking the Mercury Cycle: Long Term Management of Surplus & Recycled Mercury and Mercury-Bearing Waste
Boston, May 1st, 2002
Nuclear Science and Technology Div.
Department of Civil and Environmental Engineering
Vanderbilt UniversityNashville, TN
Context
Mixed wastes RCRA: treatment by BDAT prior to disposal
Wastes containing elemental Hg > 260 ppm BDAT: Thermal desorption and reclaimation of Hg for
recycling
Hg recovered from mixed wastes cannot be recycled
Need for alternative treatment processes acceptable as BDAT for Hg-contaminated mixed wastes Side-by-side comparison of four vendor provided treatment
processes (EPA/DOE)
Objectives
Evaluate a new leaching framework for assessing the efficacy of treatment processes for Hg-contaminated mixed wastes
Provide long-term Hg release estimates over a range
of management scenarios
Provide insight into selection of acceptable
management scenarios for each treatment process

Alternative Approach to Leaching Evaluation
Define release modesand fundamentalleaching parameters
Design test methods tomeasure fundamentalparameters
Test waste
Calculate release based onmanagement scenario(s)and field conditions• default scenarios• site-specific conditions
Evaluate acceptance basedon projected impact• default criteria• site-specific impact estimate

Materials
Two Hg-contaminated soils (~4500 mg/kg) containing radionuclides (Am-241 & Eu-152)
Four candidate treatments Vacuum thermal desorption (Vendor 1) Two forms of solidification/stabilization (Vendors 2 and 3) Sulfur polymer cement encapsulation/amalgamation (Vendor 4)
Untreated Am soil Th. desorpt: Vendor 14.6 mg Hg/kg
S/S: Vendor 2
1840 mg Hg/kg
SPC: Vendor 4
997 mg Hg/kg

Approach
Measurement of fundamental leaching parameters Hg solubility as a function of pH Hg release rate
Use of assumed management scenarios to estimate the release of Hg over 100-year time frame Disposal under a percolation-controlled scenario (20cm
infiltration/year) Disposal under a diffusion-controlled scenario (100%
precipitation frequency) Disposal in the context of municipal waste landfill, hazardous
waste landfill and industrial co-disposal landfill
Compare results to release estimates based on TCLP
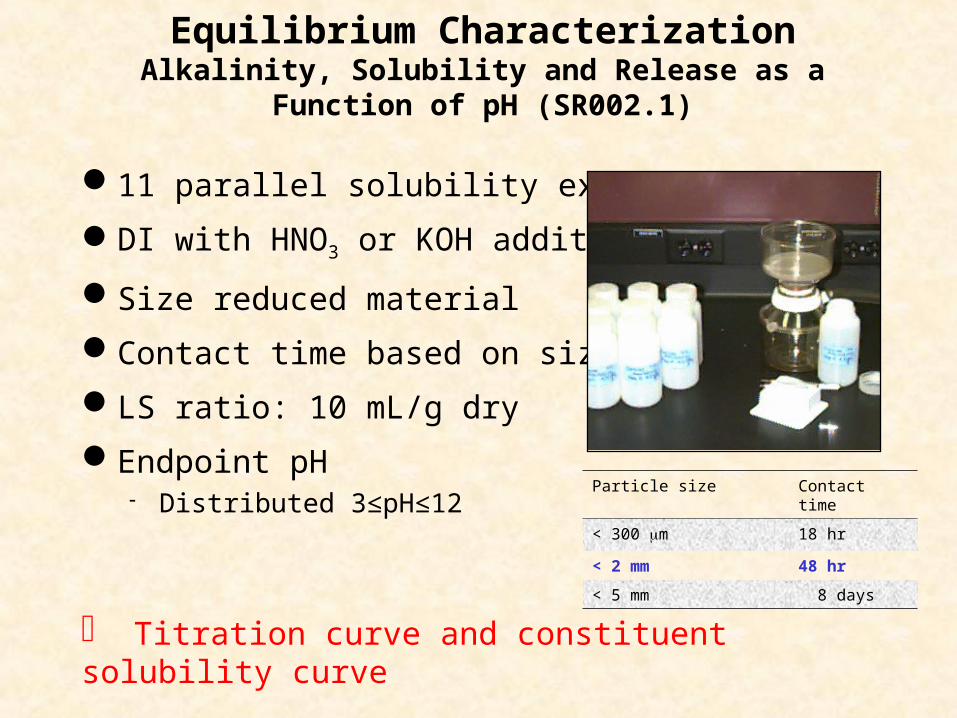
Equilibrium CharacterizationAlkalinity, Solubility and Release as a Function of pH
(SR002.1)
11 parallel solubility extractions
DI with HNO3 or KOH addition
Size reduced material
Contact time based on size
LS ratio: 10 mL/g dry
Endpoint pH Distributed 3≤pH≤12
Titration curve and constituent solubility curve
Particle size Contact time
< 300 m 18 hr
< 2 mm 48 hr
< 5 mm 8 days
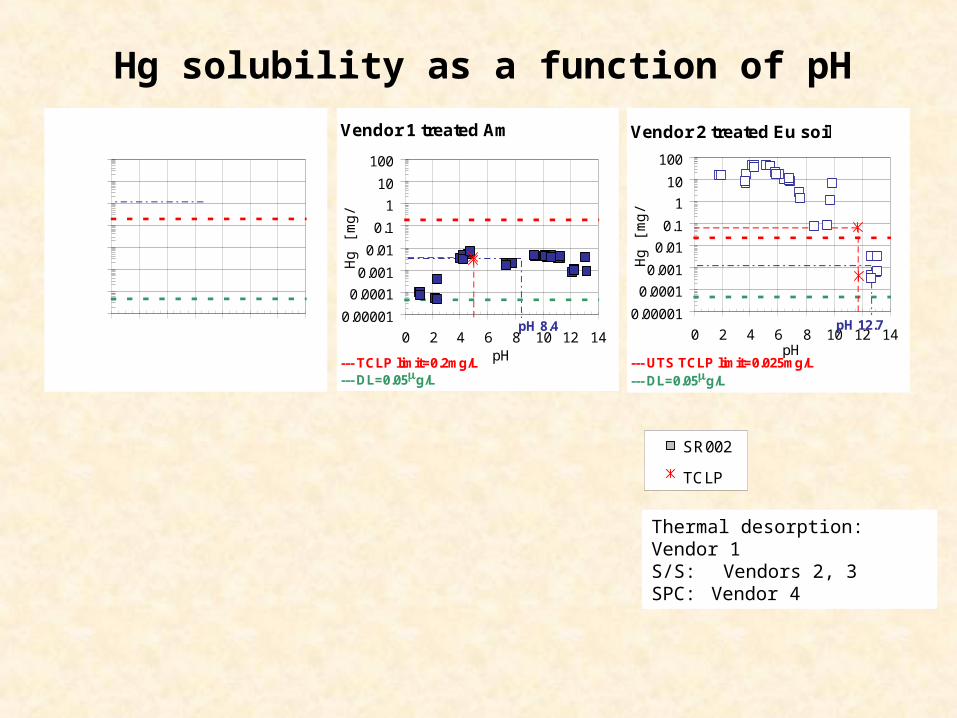
Hg solubility as a function of pH
Thermal desorption: Vendor 1S/S: Vendors 2, 3SPC: Vendor 4
SR002
TCLP
0.00001
0.0001
0.001
0.01
0.1
1
10
100
0 2 4 6 8 10 12 14pH
Hg
[mg
/L]
--- DL=0.05g/L--- TCLP limit=0.2mg/L
pH 8.4
Vendor 1 treated Am soil
0.00001
0.0001
0.001
0.01
0.1
1
10
100
0 2 4 6 8 10 12 14pH
Hg
[mg
/L]
pH 12.7
--- DL=0.05g/L--- UTS TCLP limit=0.025mg/L
Vendor 2 treated Eu soil
0.00001
0.0001
0.001
0.01
0.1
1
10
100
0 2 4 6 8 10 12 14pH
Hg
[mg
/L]
-- TCLP limit=0.2mg/L
pH 6.8
--- DL=0.05g/L
Untreated Am soil
0.00001
0.0001
0.001
0.01
0.1
1
10
100
0 2 4 6 8 10 12 14pH
Hg
[mg
/L]
pH 10.2
--- DL=0.05g/L--- UTS TCLP limit=0.025mg/L
Vendor 3 treated Am soil
0.00001
0.0001
0.001
0.01
0.1
1
10
100
0 2 4 6 8 10 12 14pH
Hg
[mg
/L]
pH 9.7
--- DL=0.05g/L-- UTS TCLP limit=0.025mg/L
Vendor 4 treated Am soil

Mass Transfer Rate Characterization (MT00x.0)
Two protocols Monolithic (MT001.1) Compacted granular (MT002.1)
Deionized water leachant
Liquid-surface area ratio 10 cm3/cm2
Refresh periods Cumulative times of
2, 5, 8 hr, 1, 2, 4, 8 days (may be extended)
7 leachates
GranularMonolithic GranularMonolithic
Cumulative release as a function of time
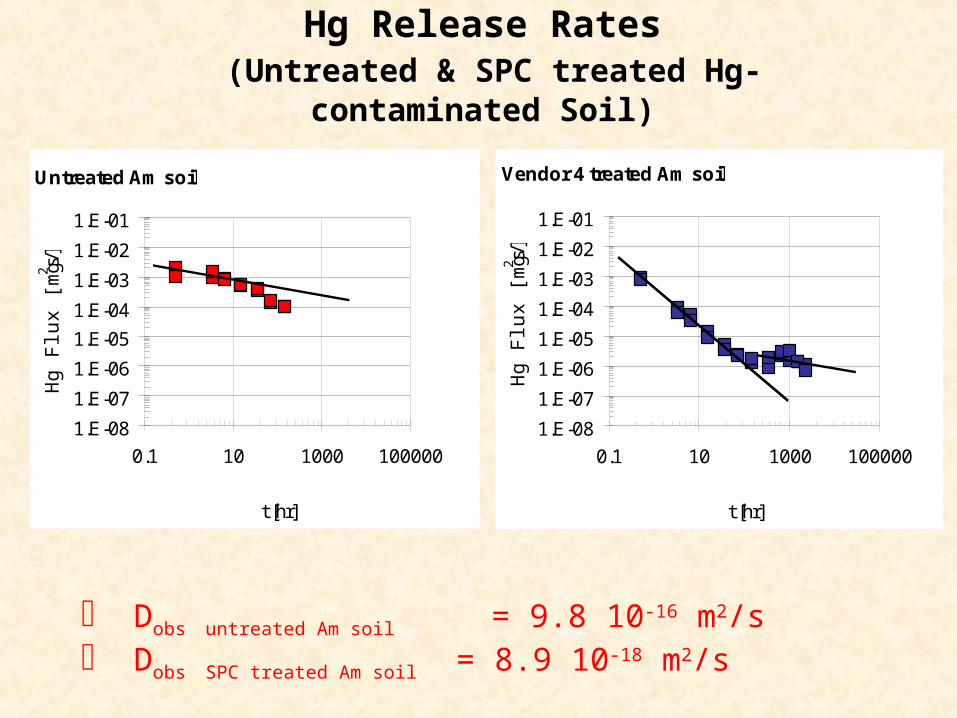
Hg Release Rates (Untreated & SPC treated Hg-contaminated Soil)
Dobs untreated Am soil = 9.8 10-16 m2/s Dobs SPC treated Am soil = 8.9 10-18 m2/s
1.E-08
1.E-07
1.E-06
1.E-05
1.E-04
1.E-03
1.E-02
1.E-01
0.1 10 1000 100000
t [hr]H
g F
lux
[mg
/m2 s]
Vendor 4 treated Am soil
1.E-08
1.E-07
1.E-06
1.E-05
1.E-04
1.E-03
1.E-02
1.E-01
0.1 10 1000 100000
t [hr]
Hg
Flu
x [m
g/m
2 s]
Untreated Am soil
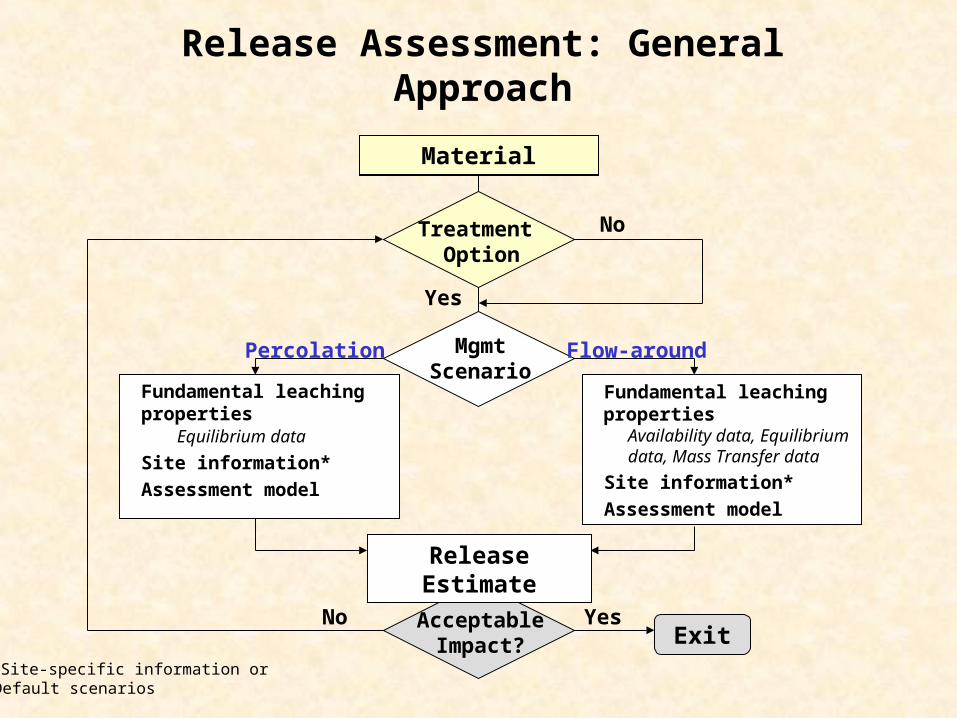
Release Assessment: General Approach
Treatment Option
MgmtScenario
Fundamental leaching properties
Equilibrium data
Site information*
Assessment model
Fundamental leaching properties
Availability data, Equilibrium data, Mass Transfer data
Site information*
Assessment model
Material
No
Yes
AcceptableImpact?
Release Estimate
ExitYesNo
Flow-aroundPercolation
* Site-specific information or Default scenarios
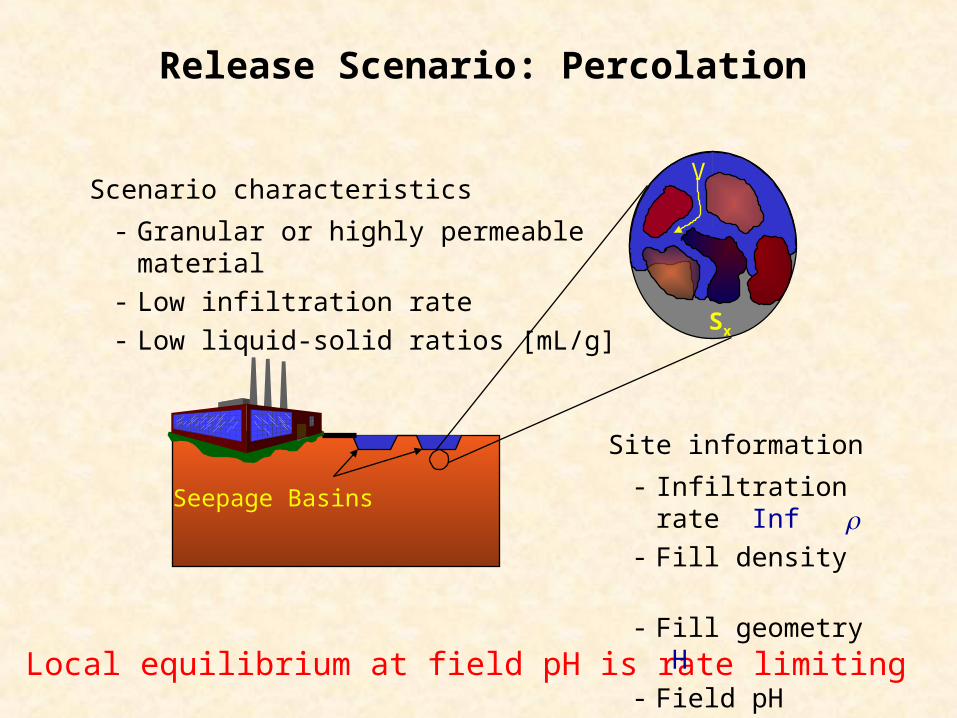
Release Scenario: Percolation
Seepage Basins
V
Sx
Local equilibrium at field pH is rate limiting
Scenario characteristics
- Granular or highly permeable material- Low infiltration rate - Low liquid-solid ratios [mL/g]
Site information
- Infiltration rate Inf- Fill density - Fill geometry H- Field pH

Release Scenario: Flow-around
Csat
Cs0
Roadbase material
Mass transport within solid matrix is rate limiting
Scenario characteristics
- Low permeability material- High infiltration rate - High liquid-surface area ratios
Site information
- Fill density- Fill geometry ,- Fill porosity
VaS

Release Estimates for Different Management Scenarios
0.009%0.208 mg/kg
100%2410 mg/kg
0.002%0.06 mg/kg
0.0003%0.007 mg/kg
7.7%185 mg/kg
0.004%0.09 mg/kg
0.0001
0.001
0.01
0.1
1
10
100
1000
10000
Total content TCLP Nat pH 10.2(LS_exp=10)Percolation-Controlled
Nat pH (LS_exp=0.5)Percolation-Controlled
pH 4.4 (LS_exp=10)Percolation-Controlled
pH 9.1 (LS_exp=10)Percolation-Controlled
Masstransfer-Controlled
Me
rcu
ry r
ele
as
e [
mg
/kg
]
% of total content released
a b c
0.005%0.12 mg/kg
a'
Vendor 3 treated Am soil

0.2%1.9 mg/kg
0.4%4.1 mg/kg
0.5%5.1 mg/kg
0.09%0.85 mg/kg
100%997 mg/kg
0.01
0.1
1
10
100
1000
10000
Total content TCLP Nat pH 9.7(LS_exp=10)Percolation-Controlled
Nat pH 10.1(LS_exp=0.5)Percolation-Controlled
pH 4.8(LS_exp=10)Percolation-Controlled
pH 9.7(LS_exp=10)Percolation-Controlled
Masstransfer-Controlled
Me
rcu
ry r
ele
as
e [
mg
/kg
]
% of total content released
a b
0.5%5.1 mg/kg
0.1%1.2 mg/kg
a' c
Vendor 4 treated Am soil
Release Estimates for Different Management Scenarios

Comparison of Treatment Processes
S/S: Vendors 2, 3SPC: Vendor 4
Min-Max0.3-1.7% Min-Max
0.4-0.5%
Min-Max0.2-3.2%
0
5
10
15
20
25
30
Untreat.Am soil
Untreat.Eu soil
Vendor3
Vendor4
Vendor2
%
Min-Max0.0003-7.7%
Min-Max0.001-29.6%
Percolation scenario
0.4%0.4%
0.004%0
0.2
0.4
0.6
0.8
1
1.2
1.4
Untreat.Am soil
Untreat.Eu soil
Vendor3
Vendor4
Vendor2
%
1.2%
0.2%
Diffusion scenario
0.04%
0.002%0
0.05
0.1
0.15
0.2
0.25
0.3
Untreat.Am soil
Untreat.Eu soil
Vendor3
Vendor4
Vendor2
%
0.2%
0.04%
0.09%
TCLP

Field pH and LS distribution for Industrial Co-disposal Landfills (USA)
Distribution for Field pHScenario: Industrial Codisposal Landfill -
n = 455
Mean = 6.9
X <= 5.75%
X <= 7.695%
0
0.2
0.4
0.6
0.8
1
4.5 5 5.5 6 6.5 7 7.5 8
pH
Pro
bab
ility
Distribution for LS_Site [L/kg] (100 years)Scenario: Industrial Codisposal Landfill -
n = 41
Mean = 21.6
X <= 93.595%
X <= .065%
0
0.2
0.4
0.6
0.8
1
0 25 50 75 100 125 150 175 200
LS ratio [L/kg]
Pro
bab
ility
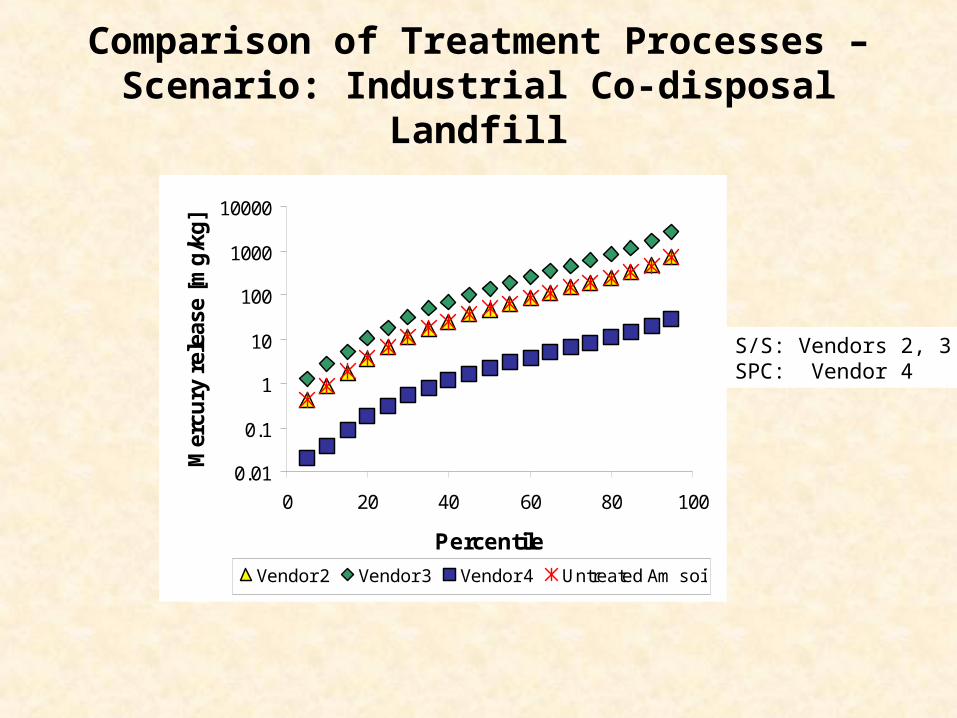
Comparison of Treatment Processes – Scenario: Industrial Co-disposal Landfill
S/S: Vendors 2, 3SPC: Vendor 4
0.01
0.1
1
10
100
1000
10000
0 20 40 60 80 100
Percentile
Mer
cury
rel
ease
[m
g/k
g]
Vendor 2 Vendor 3 Vendor 4 Untreated Am soil

Conclusions
The proposed leaching framework allowed A good assessment of the efficacy of treatment processes
for Hg contaminated mixed wastes Comparison of estimated Hg release for a variety of
management scenarios Consideration of site-specific conditions Insight into selection of acceptable management scenarios
for each treatment process
The use of testing results in conjunction with assumed management scenarios and simple models leads to more realistic long-term release estimates than single batch test results
Acknowledgements
USEPA Office of Solid Waste Northeast Hazardous Substances Research Center
USDOE TRU and Mixed Waste Focus Area (TMFA)
Consortium for Risk Evaluation with Stakeholder Participation (CRESP)


![Abstract arXiv:2003.11666v1 [cs.LG] 25 Mar 2020 · Pipelined Backpropagation at Scale: Training Large Models without Batches Atli Kosson yVitaliy Chiley Abhinav Venigalla Joel Hestness](https://img.dokumen.tips/doc/110x75/5fc5d695b96c47070f6bcbde/abstract-arxiv200311666v1-cslg-25-mar-2020-pipelined-backpropagation-at-scale.jpg)