Embed Size (px)
Citation preview

Exercise and Exercise and outcomesoutcomes
Hirsch, DiehrHirsch, Diehr
11-18-2005 (9 AM)11-18-2005 (9 AM)

Compact ResultsCompact Results Adjusting for Age in Regression OnlyAdjusting for Age in Regression Only Does not match Table 5, which is age-Does not match Table 5, which is age-
specificspecific Big exercise effects unadjustedBig exercise effects unadjusted Much smaller differences after adjustmentMuch smaller differences after adjustment But some quintiles have significantly fewer But some quintiles have significantly fewer
“years” than quintile 5 “years” than quintile 5 The confidence interval doesn’t overlap with the The confidence interval doesn’t overlap with the
CI for quintile 5CI for quintile 5 Propensity score approach suggests that the Propensity score approach suggests that the
covariates we used do achieve balance.covariates we used do achieve balance.

Regression ModelRegression Model Not in causal pathway? Not in causal pathway?
gend01 age00 lage agesex lagesex white grade01 gend01 age00 lage agesex lagesex white grade01 smoke alcoh aspirin smoke alcoh aspirin diabada maxcom maxint maxsten copdbl shtbrt chdblmod diabada maxcom maxint maxsten copdbl shtbrt chdblmod
emphysem chfbase cbd cancer prknsn06 renal arth01 emphysem chfbase cbd cancer prknsn06 renal arth01 crp fib44 alb44 depscr05 cis42 benzod06 crp fib44 alb44 depscr05 cis42 benzod06 minimental digcor minimental digcor evggfp timewlk iadl adl evggfp timewlk iadl adl
Possibly in causal pathway? biorea21 biores21 bmi Possibly in causal pathway? biorea21 biores21 bmi choladj hdl44 ldladj lipid06 choladj hdl44 ldladj lipid06 hyper aai suppul16 hyper aai suppul16
Re-try propensity score model without some of Re-try propensity score model without some of these suspect variables?these suspect variables?

YOL and ExerciseYOL and Exercise
839838810804753N =
YOL, unadjusted
calstuff17.sps 11-17-2005
kcal quintile all
5.004.003.002.001.00
95%
CI Y
ears
of L
ife, 1
1 yr
s f/u
10.20
10.00
9.80
9.60
9.40
9.20
9.00
8.80
8.60839838810804753N =
YOL, adjusted
calstuff17.sps 11-17-2005
kcal quintile all
5.004.003.002.001.0095
% C
I YO
L 11
yrs
Adj
uste
d
10.20
9.80
9.40
9.00
8.60
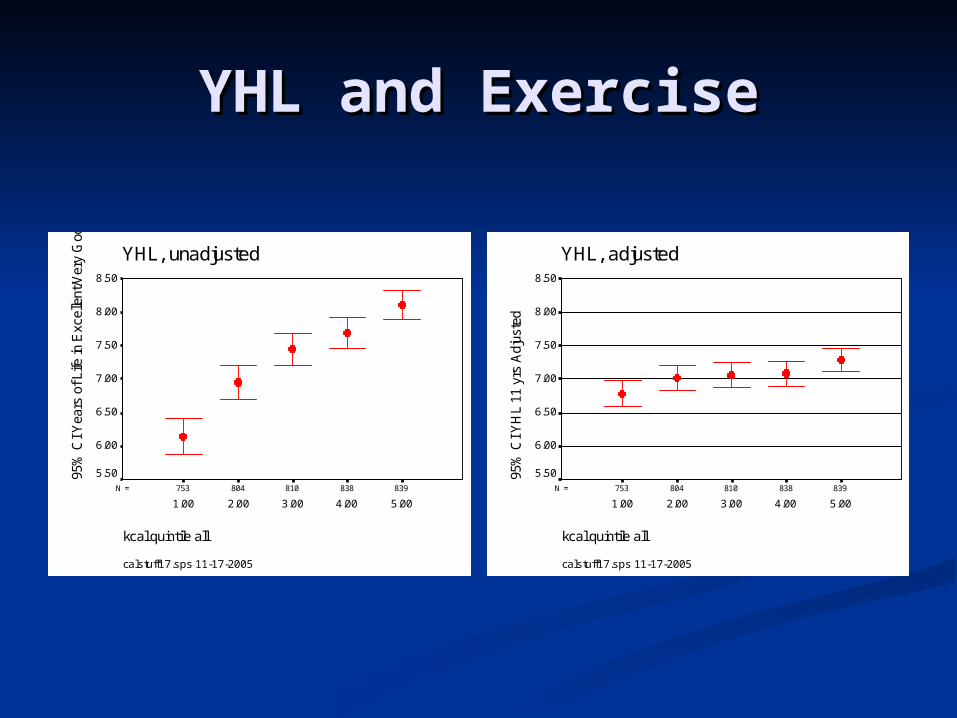
YHL and ExerciseYHL and Exercise
839838810804753N =
YHL, unadjusted
calstuff17.sps 11-17-2005
kcal quintile all
5.004.003.002.001.00
95%
CI Y
ears
of L
ife in
Exc
elle
nt/V
ery
Goo
d/ G
ood
Hea
lth, 1
1 yr
s f/u
8.50
8.00
7.50
7.00
6.50
6.00
5.50839838810804753N =
YHL, adjusted
calstuff17.sps 11-17-2005
kcal quintile all
5.004.003.002.001.0095
% C
I YH
L 11
yrs
Adj
uste
d
8.50
8.00
7.50
7.00
6.50
6.00
5.50

Years w/o ADL Years w/o ADL DifficultiesDifficulties
839838810804753N =
YHL_ADL, unadjusted
calstuff17.sps 11-17-2005
kcal quintile all
5.004.003.002.001.00
95%
CI y
rs o
f life
with
<1
adl,
7 yr
s f/u
6.40
6.20
6.00
5.80
5.60
5.40
5.20
5.00
4.80839838810804753N =
YHL_ADL, adjusted
calstuff17.sps 11-17-2005
kcal quintile all
5.004.003.002.001.0095
% C
I YH
L-A
DL
7 yr
s A
djus
ted
6.40
6.00
5.60
5.20
4.80

Years w/o IADL Years w/o IADL DifficultiesDifficulties
839838810804753N =
YHL_IADL, unadjusted
calstuff17.sps 11-17-2005
kcal quintile all
5.004.003.002.001.00
95%
CI y
rs o
f life
with
NO
IAD
L, 7
yrs
f/u
6.00
5.50
5.00
4.50
4.00
3.50839838810804753N =
YHL_IADL, adjusted
calstuff17.sps 11-17-2005
kcal quintile all
5.004.003.002.001.0095
% C
I YH
L-IA
DL
7 yr
s A
djus
ted
6.00
5.50
5.00
4.50
4.00
3.50
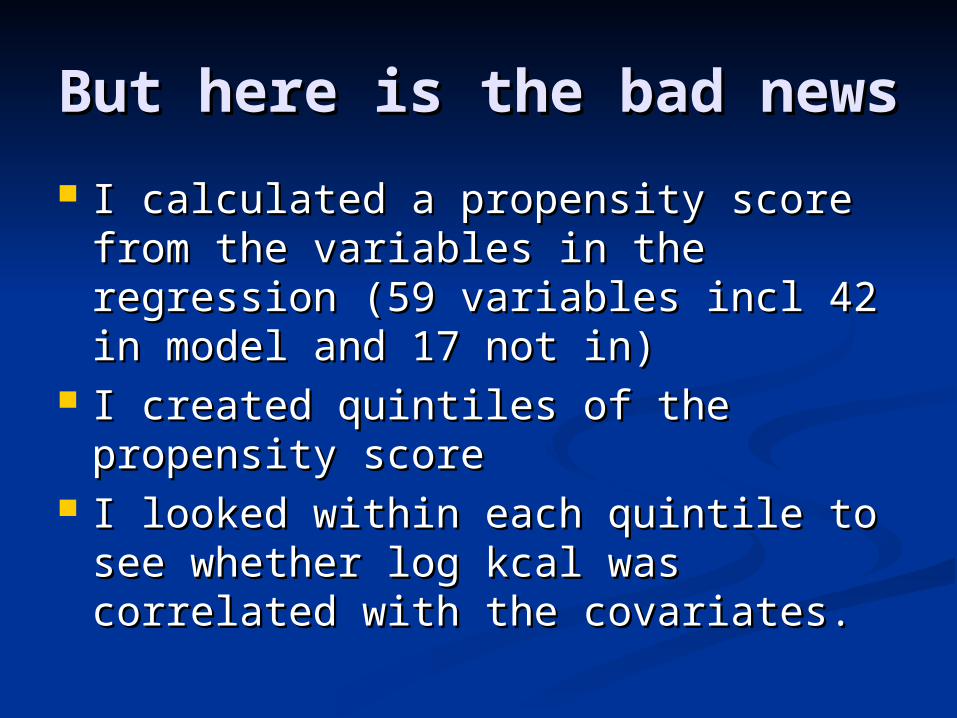
But here is the bad newsBut here is the bad news
I calculated a propensity score from I calculated a propensity score from the variables in the regression (59 the variables in the regression (59 variables incl 42 in model and 17 not variables incl 42 in model and 17 not in)in)
I created quintiles of the propensity I created quintiles of the propensity scorescore
I looked within each quintile to see I looked within each quintile to see whether log kcal was correlated with whether log kcal was correlated with the covariates.the covariates.

Vars in propensity scoreVars in propensity score Regression variablesRegression variables: gend01 age00 lage agesex : gend01 age00 lage agesex
lagesex white grade01 iadl adl timewlk biorea21 lagesex white grade01 iadl adl timewlk biorea21 biores21 bmi choladj hdl44 ldladj lipid06 hyper biores21 bmi choladj hdl44 ldladj lipid06 hyper smoke diabada alcoh aspirin maxcom maxint maxsten smoke diabada alcoh aspirin maxcom maxint maxsten aai copdbl shtbrt chdblmod chfbase cbd diag01 aai copdbl shtbrt chdblmod chfbase cbd diag01 prknsn06 renal arth01 crp fib44 alb44 depscr05 prknsn06 renal arth01 crp fib44 alb44 depscr05 score30 digcor ih000 suppul16 cis42 benzod06 score30 digcor ih000 suppul16 cis42 benzod06 emphysememphysem
Other VariablesOther Variables (obtained from screening all (obtained from screening all variables: not used in regression model, to keep variables: not used in regression model, to keep sample size up): hip13 insul12 wbld23 brtsht07 sample size up): hip13 insul12 wbld23 brtsht07 domgrip benzod06 cancer arth01 aai cis42 chstpn domgrip benzod06 cancer arth01 aai cis42 chstpn cpvd anar1a06 avzmdia iadl hip13 insul12 married cpvd anar1a06 avzmdia iadl hip13 insul12 married fvc18 live03 netscr03 extart07 time17 suppul16 fvc18 live03 netscr03 extart07 time17 suppul16 trblsl08 ues waist13 wgt5008 white wbld23 wakeup08trblsl08 ues waist13 wgt5008 white wbld23 wakeup08

Exercise by propensity Exercise by propensity categoriescategories
pctall kcal quintile all * propquin Crosstabulation
Count
259 123 106 77 59 624
163 190 141 111 108 713
138 150 154 156 152 750
93 149 174 183 180 779
76 110 152 223 235 796
729 722 727 750 734 3662
1.00
2.00
3.00
4.00
5.00
pctall kcalquintileall
Total
1.00 2.00 3.00 4.00 5.00
propquin
Total

Balance: lkcal corr with:Balance: lkcal corr with: In Propensity quintile 1, more exercise correlated In Propensity quintile 1, more exercise correlated
with lower fibrinogen, lower wbc, lower waist with lower fibrinogen, lower wbc, lower waist circumference, lower weight (4/59 vars: a problem? circumference, lower weight (4/59 vars: a problem? Type of bias?) Type of bias?)
2: less hypertension2: less hypertension 3: higher digital symbol score, higher grip strength, 3: higher digital symbol score, higher grip strength,
married, living with spouse (vs alone, etc.) married, living with spouse (vs alone, etc.) 4: more alcohol, more aspirin, more chd, lower 4: more alcohol, more aspirin, more chd, lower
suppine pulse rate, lower wbc, higher grip strengthsuppine pulse rate, lower wbc, higher grip strength 5: higher ankle/arm ratio, lower chest pain, less 5: higher ankle/arm ratio, lower chest pain, less
trouble sleepingtrouble sleeping 20/59*5 = 3% of all corrs sdfz20/59*5 = 3% of all corrs sdfz Balance is amazingly goodBalance is amazingly good
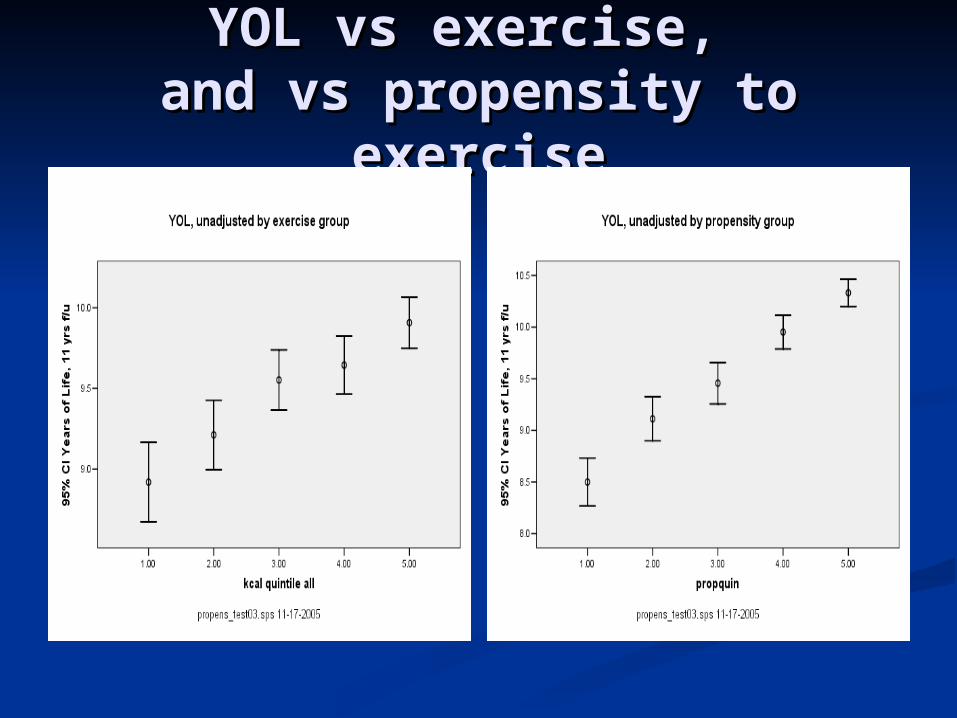
YOL vs exercise, YOL vs exercise, and vs propensity to and vs propensity to
exerciseexercise


Balance if hypertension, weight, Balance if hypertension, weight, cholesterol not in modelcholesterol not in model
In Propensity quintile 1, more exercise is associated In Propensity quintile 1, more exercise is associated with fewer IADL difficulties, lower cholesterol, lower with fewer IADL difficulties, lower cholesterol, lower BMI, lower LDL, lower fibrinogen, higher evggfp, BMI, lower LDL, lower fibrinogen, higher evggfp, smaller hips, smaller waistsmaller hips, smaller waist
2: lower bmi, less alcohol, smaller hips, smaller waist2: lower bmi, less alcohol, smaller hips, smaller waist 3: lower bmi, higher albumin, smaller hip, more grip 3: lower bmi, higher albumin, smaller hip, more grip
strength, more married, higher fvc, lives with spouse, strength, more married, higher fvc, lives with spouse, smaller waistsmaller waist
4: lower bmi, higher hdl, higher alcohol, less stenosis, 4: lower bmi, higher hdl, higher alcohol, less stenosis, higher fibrinogen, smaller hips, lower wbc, less higher fibrinogen, smaller hips, lower wbc, less peripherovascular disease, smaller waist peripherovascular disease, smaller waist
5: No blacks, no people with 1 iadl at baseline, lower 5: No blacks, no people with 1 iadl at baseline, lower digital symbol score, less trouble falling asleepdigital symbol score, less trouble falling asleep
Balance is much worse without those variables. If bmi Balance is much worse without those variables. If bmi and hip size and hdl matter, the groups are not and hip size and hdl matter, the groups are not comparable. comparable.

Age-specific Age-specific resultsresults
Use single age groupUse single age groupUse age-specific quintilesUse age-specific quintiles
But Age is adjusted for in regressionBut Age is adjusted for in regression(I’m not sure that we want to adjust for (I’m not sure that we want to adjust for
age twice)age twice)

87167281303 85169276300 87156274294 86143264283 79156251303N =
YOL, unadjusted
calstuff17.sps 11-17-2005
Age Category
80+75-7970-7465-69
95%
CI Y
ears
of Life
, 11 y
rs f/u 11.00
10.00
9.00
8.00
7.00
6.00
kcal percentile, age
1.00
2.00
3.00
4.00
5.00

87167281303 85169276300 87156274294 86143264283 79156251303N =
YhL, unadjusted
calstuff17.sps 11-17-2005
Age Category
80+75-7970-7465-69
95%
CI Y
HL 1
1 y
rs A
dju
ste
d-y
es for
age
9.00
8.50
8.00
7.50
7.00
6.50
6.00
5.50
kcal percentile, age
1.00
2.00
3.00
4.00
5.00

87167281303 85169276300 87156274294 86143264283 79156251303N =
YHL-ADL, unadjusted
calstuff17.sps 11-17-2005
Age Category
80+75-7970-7465-69
95%
CI yrs
of lif
e w
ith<
1 a
dl,
7 y
rs f/u
7.00
6.50
6.00
5.50
5.00
4.50
4.00
3.50
3.00
kcal percentile, age
1.00
2.00
3.00
4.00
5.00

87167281303 85169276300 87156274294 86143264283 79156251303N =
YHL_IADL, unadjusted
calstuff17.sps 11-17-2005
Age Category
80+75-7970-7465-69
95%
CI yrs
of lif
e w
ith N
O IA
DL, 7 y
rs f/u
7.00
6.00
5.00
4.00
3.00
2.00
1.00
kcal percentile, age
1.00
2.00
3.00
4.00
5.00

87167281303 85169276300 87156274294 86143264283 79156251303N =
YOL, adjusted
calstuff17.sps 11-17-2005
Age Category
80+75-7970-7465-69
95%
CI Y
OL 1
1 y
rs A
dju
ste
d-y
es for
age
11.00
10.50
10.00
9.50
9.00
8.50
8.00
kcal percentile, age
1.00
2.00
3.00
4.00
5.00

87167281303 85169276300 87156274294 86143264283 79156251303N =
YhL, adjusted
calstuff17.sps 11-17-2005
Age Category
80+75-7970-7465-69
95%
CI Y
HL 1
1 y
rs A
dju
ste
d-y
es for
age
9.00
8.50
8.00
7.50
7.00
6.50
6.00
5.50
kcal percentile, age
1.00
2.00
3.00
4.00
5.00
87167281303 85169276300 87156274294 86143264283 79156251303N =
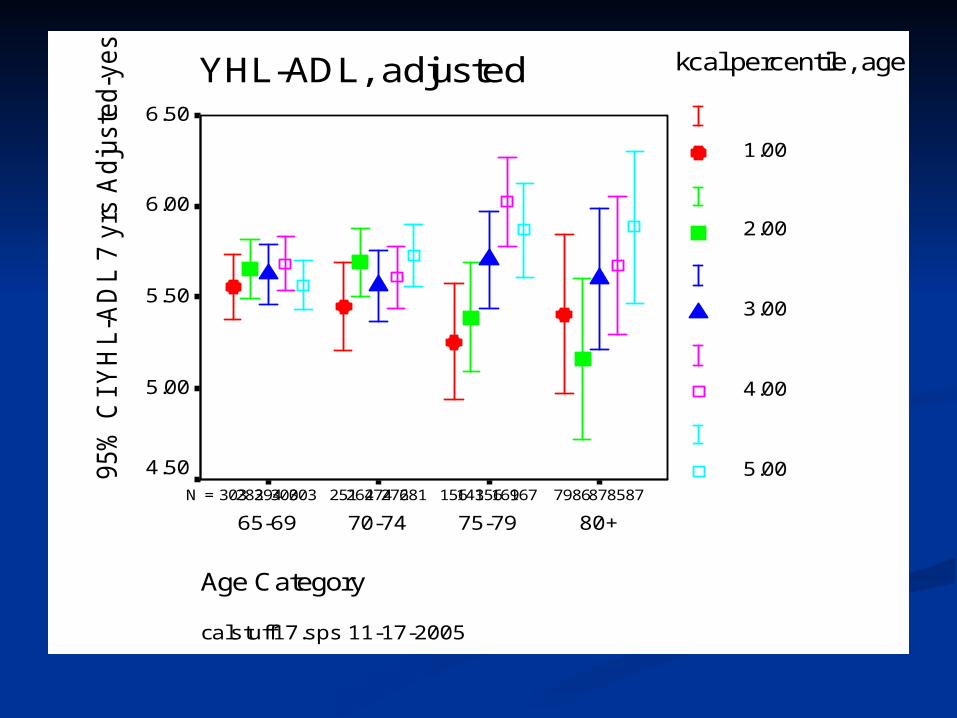
YHL-ADL, adjusted
calstuff17.sps 11-17-2005
Age Category
80+75-7970-7465-69
95%
CI Y
HL-A
DL 7
yrs
Adju
ste
d-y
es for
age
6.50
6.00
5.50
5.00
4.50
kcal percentile, age
1.00
2.00
3.00
4.00
5.00

87167281303 85169276300 87156274294 86143264283 79156251303N =
YHL_IADL, adjusted
calstuff17.sps 11-17-2005
Age Category
80+75-7970-7465-69
95%
CI Y
HL-I
AD
L 7
yrs
Adju
ste
d-y
es for
age
6.00
5.50
5.00
4.50
4.00
3.50
kcal percentile, age
1.00
2.00
3.00
4.00
5.00