Embed Size (px)
Citation preview

1
Analyst & Investor Presentation FY 201725 April 2018

2
Executive summary FY 2017Jochen Halfmann

Vapiano takeaways FY 2017
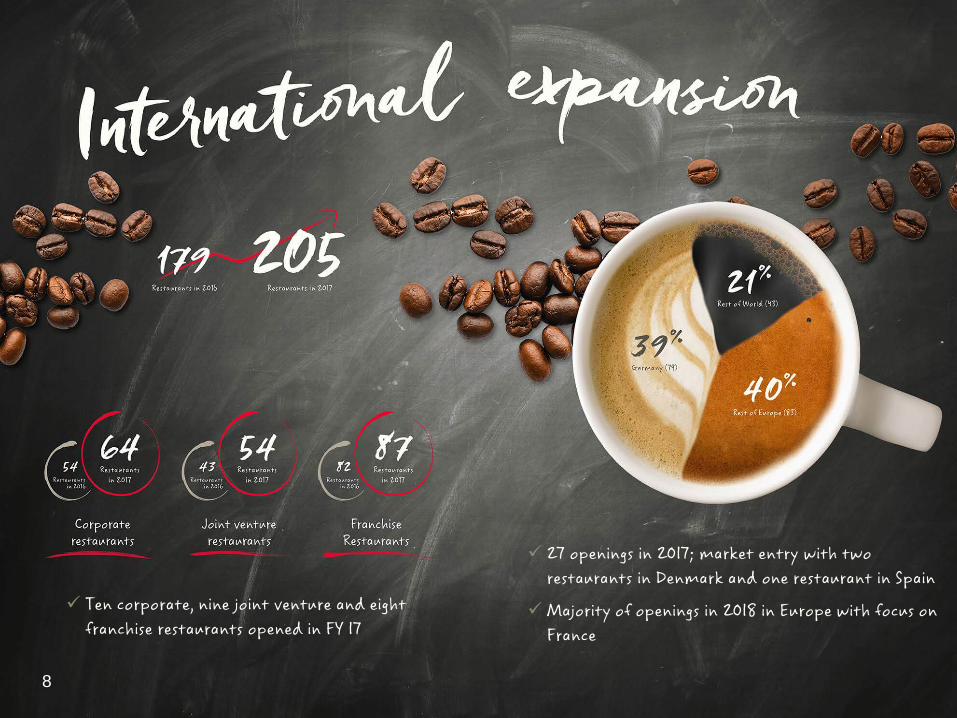
27(2) restaurants opened in 2017, in total 205 restaurants at year end 17; successful market entry in Spain and Denmark
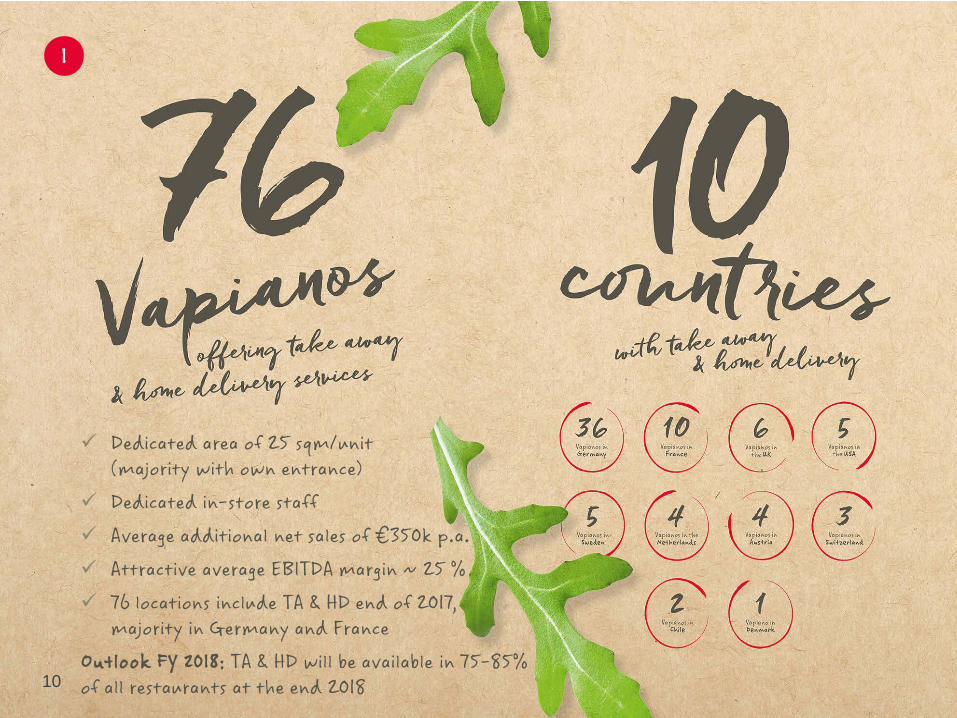
Takeaway roll-out ahead of plan – already in 76 (37%) restaurants of overall network implemented
3 (1) Excluding preopening costs(2) Three openings delayed to H1 2018 due to external reasons
Growth CAPEX increased strongly from €51.5m to €78.5m
Strong lfl sales growth in all segments leads to Group lfl sales growth of 4.8% at upper end of guidance of 4-5%
Adjusted EBITDA(1) reaches €38.8m (+35.8%)
Strong Group sales increase to € 325m (+ 31%)
All segments and strategic initiatives contributed to EBITDA growth
Financial and operating highlights

Vapiano delivered what it promised for FY 2017
4
Restaurant openings 27 (1)
Group net sales €324.7m
Group lfl sales growth 4.8%
Adjusted EBITDA (excl. pre-opening costs) €38.8m
(1) 3 openings delayed to H1 2018 due to external reasons
27 – 28 (1)
€315m - €335m
4% - 5%
€38m - €40m
Performance 2017 Guidance 2017
Guidance fulfilled completely

5
Business highlights FY 2017Jochen Halfmann

203
249
2015 2016 2017
24
29
39
2015 2016 2017
Impressive track record of sales and adj. EBITDA growth
Constant growth in net sales€m
Strong increase in (adj. EBITDA)
11.6% 11.5%€m
6
11.9%
Strong momentum in FY 2017
Net sales increased by 31% to € 325m in FY 2017
Growth driven by numerous openings, strong lfl growth and the aquisitions (France/Sweden)
325
Overproportionate increase of 36% to € 38.8m in FY 2017
Major driver lfl development, productivityincreases (OPEX) and rollout of takeaway und home delivery business
Adj. EBITDA margin

7
8
27 openings in 2017; market entry with two restaurants in Denmark and one restaurant in Spain
Majority of openings in 2018 in Europe with focus on France
Ten corporate, nine joint venture and eight franchise restaurants opened in FY 17
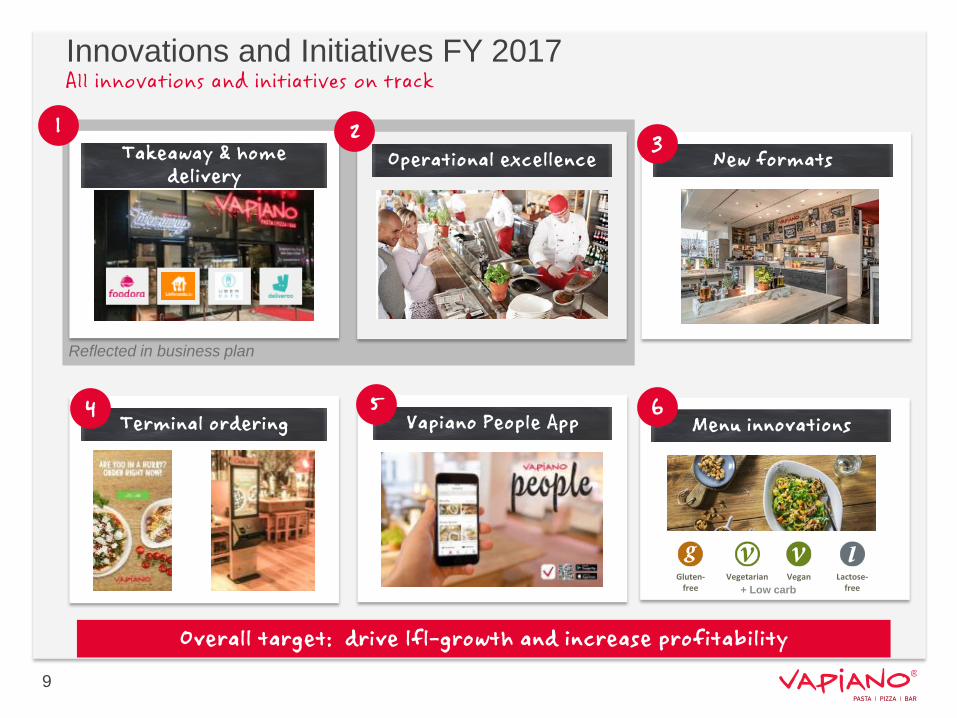
Innovations and Initiatives FY 2017
Overall target: drive lfl-growth and increase profitability
Terminal ordering Vapiano People App
Takeaway & home delivery
9
Operational excellence
Menu innovations
Gluten-free
Vegetarian Vegan Lactose-free
New formats
Reflected in business plan
+ Low carb
All innovations and initiatives on track
6
1
5
2 3
4
10
Dedicated area of 25 sqm/unit (majority with own entrance)
Dedicated in-store staff Average additional net sales of €350k p.a. Attractive average EBITDA margin ~ 25 % 76 locations include TA & HD end of 2017,
majority in Germany and FranceOutlook FY 2018: TA & HD will be available in 75-85% of all restaurants at the end 2018
1
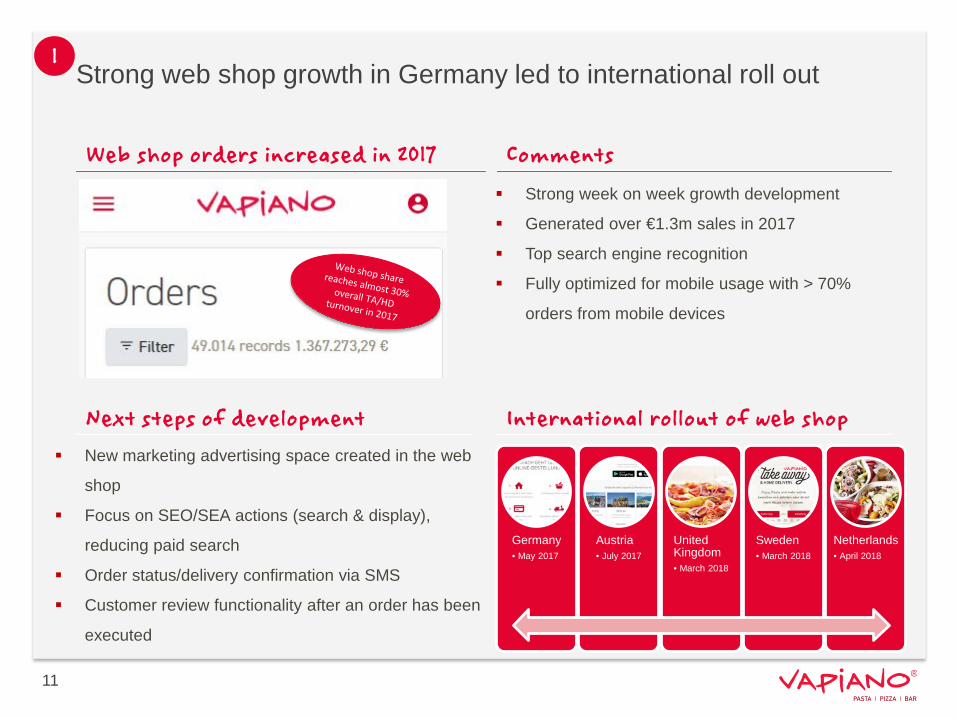
Strong web shop growth in Germany led to international roll out
Strong week on week growth development
Generated over €1.3m sales in 2017
Top search engine recognition
Fully optimized for mobile usage with > 70%
orders from mobile devices
Germany• May 2017
Austria• July 2017
United Kingdom• March 2018
Sweden• March 2018
Netherlands• April 2018
New marketing advertising space created in the web
shop
Focus on SEO/SEA actions (search & display),
reducing paid search
Order status/delivery confirmation via SMS
Customer review functionality after an order has been
executed
11
Web shop orders increased in 2017 Comments
International rollout of web shopNext steps of development
1

12
Opex led to productivity gains of up to 15% (UK) in FY
Implementation of train-the-trainer concept to scale up international roll out
Introduction of training/opening handbook and implementation of a regional training program
Digital personel planning system (Atoss) tested in Germany
Outlook FY 2018: All corporate and joint venture countries will be fully “OpEx’ed” by end of 2018
2

13
First Freestander pilot in Fürth well on track
Outlook for 2018: Opening of Vapiano Freestander in Toulouse/France
Outlook for 2019: Opening of Vapiano Freestander in Centro Oberhausen
3

14
Enhances market potential/roll-out flexibility in saturated regions Low capex
Pilot Ingolstadt constant growing EBITDA margin / Pilot Vienna developing well on track
Outlook FY 2018: Opening of Mini Vapiano in Chicago in May 2018;further pilots with HSMHost in progress
3

New Format Differentiation Travel Vapiano in Pilot Phase3
Travel Vapiano
15
Joint opening of Vapiano restaurants in major airports and train stations as a franchise model
Product offering tailored to the needs of travellers, with eat in and takeaway options
Pilots foreseen in UK, Scandinavia, Germany and the Netherlands on base of the Mini Vapiano
Asset light model supporting operating income and free cash flows
Enhancement of brand awareness
Outlook for 2018: First pilot supposed to open in 2nd half of 2018
New franchise agreement with HSMHost in progress; LOI signed April 2018
Comments
+

16
Mitigates queuing and waiting times at cooking stations and enables groups to eat together via synchronized cooking
Terminals including payment function will start in 2018
End of FY 2017, order terminals available in 10 restaurants in 4 countries
4
Outlook FY 2018: Expand pilot to US with next opening; piloting further terminals in an increasing number of restaurants

17
Outlook FY 2018: Rollout in more European markets; full menu ordering in test phase as of now in Berlin with positive first results
5
18
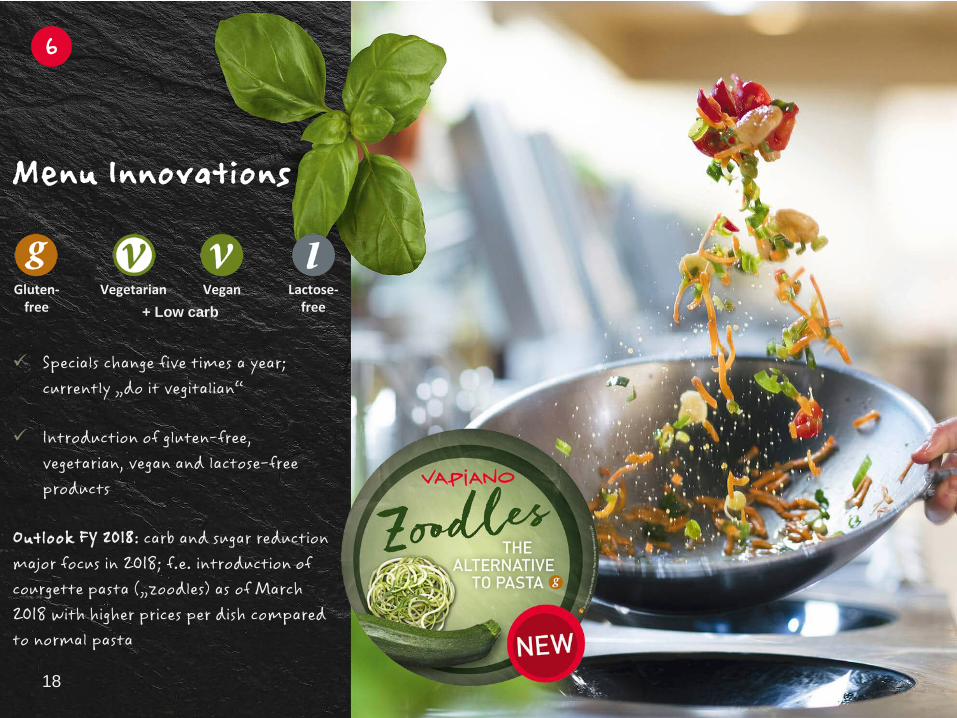
Menu Innovations
Gluten-free
Vegetarian Vegan Lactose-free+ Low carb
Specials change five times a year; currently „do it vegitalian“
Introduction of gluten-free, vegetarian, vegan and lactose-freeproducts
Outlook FY 2018: carb and sugar reductionmajor focus in 2018; f.e. introduction ofcourgette pasta („zoodles) as of March 2018 with higher prices per dish comparedto normal pasta
6

19
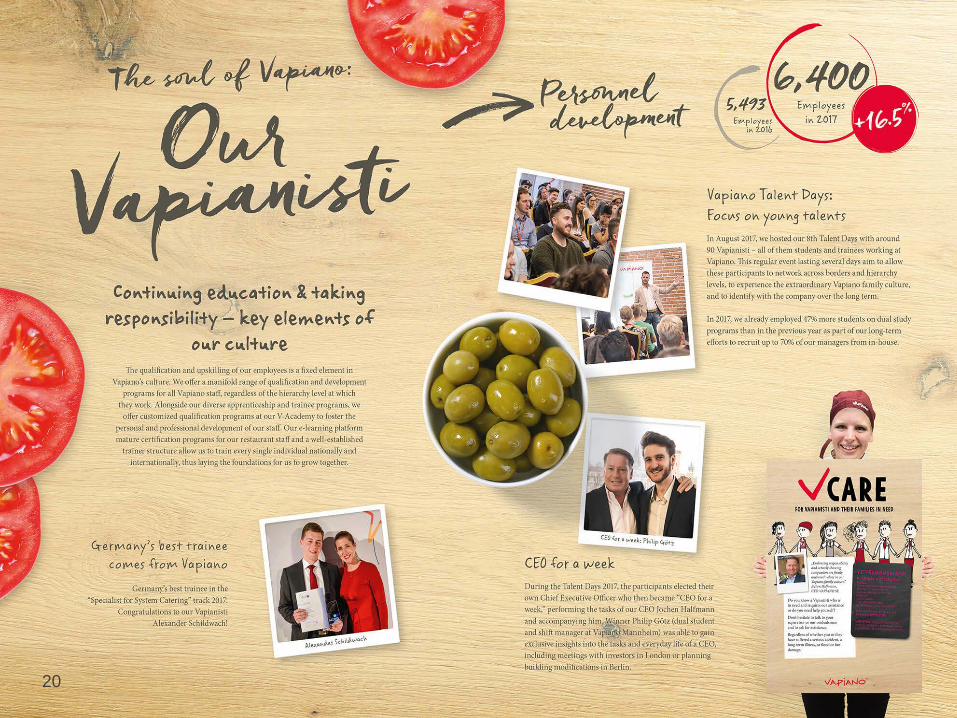
Number of employees rose to 6.400 on average in FY 2017 (+16.5%)
Continuing education and takingresponsibility – key elements of ourculture
20

21

22
Financial highlights FY 2017Lutz Scharpe
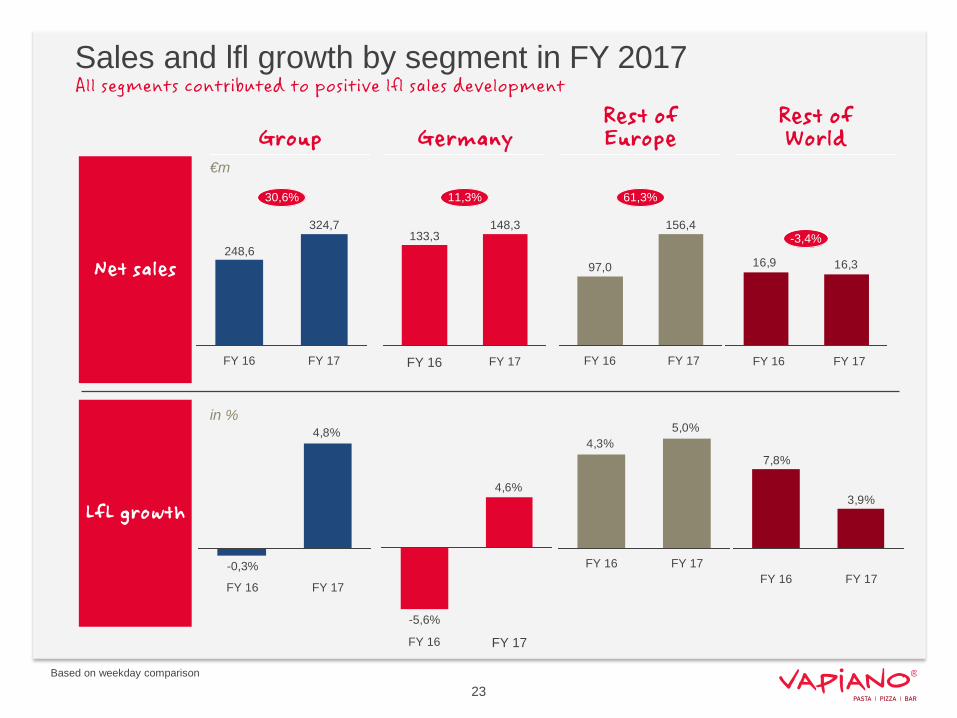
Sales and lfl growth by segment in FY 2017
Net sales
LfL growth
Rest of EuropeGermanyGroup
Rest of World
Based on weekday comparison
23
FY 16
248,6
30,6%
324,7
FY 17
148,3
FY 17FY 16
11,3%
133,3
4,6%
FY 17FY 16
-5,6%
97,0
61,3%
FY 16 FY 17
156,4
16,316,9
FY 17
-3,4%
FY 16
4,8%
FY 16
-0,3%
FY 17
5,0%4,3%
FY 17FY 16
7,8%
3,9%
FY 16 FY 17
€m
in %
All segments contributed to positive lfl sales development
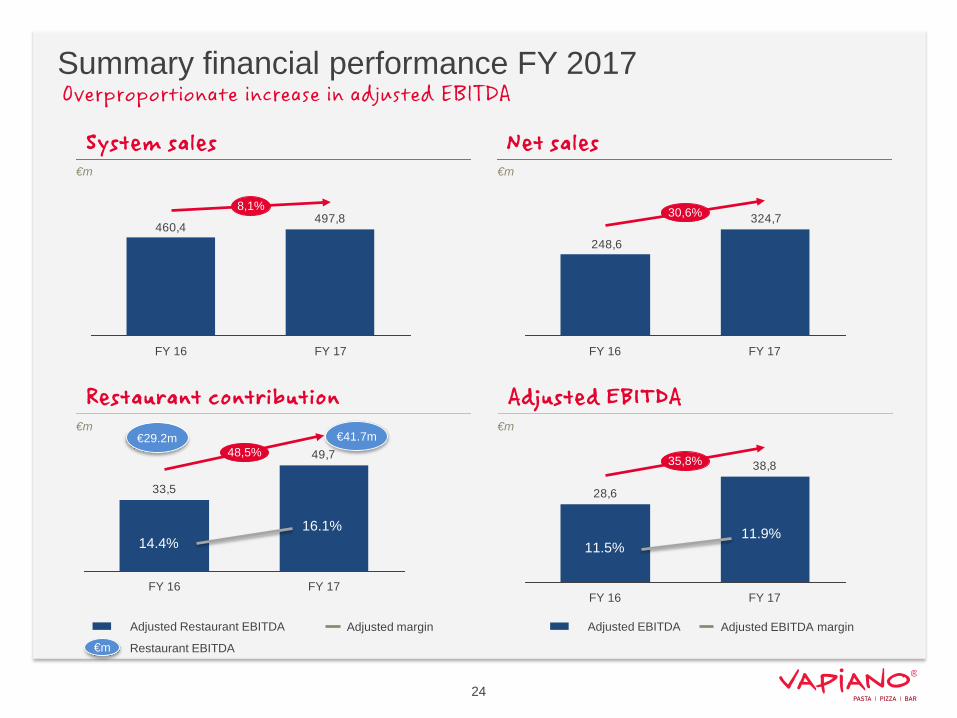
Summary financial performance FY 2017
€m €m
System sales Net sales
Adjusted EBITDA
Adjusted EBITDA Adjusted EBITDA margin
Restaurant EBITDA€m
Restaurant contribution
Adjusted Restaurant EBITDA Adjusted margin
€m €m€29.2m
49,7
33,5
FY 16
48,5%
FY 17
497,8460,4
FY 16
8,1%
FY 17
324,7
248,6
FY 17FY 16
30,6%
38,8
28,6
FY 17FY 16
35,8%
14.4%
€41.7m
16.1%11.5%
11.9%
24
Overproportionate increase in adjusted EBITDA

Segment EBITDA Overview – FY 2017Adjusted segment
EBITDAAdjusted franchise
EBITDAAdjusted restaurant
contribution
Germany
Rest of Europe
Rest of World
€m
Adjusted EBITDA MarginAdjusted EBITDA
129.0 143.9
89.2 151.5
13.8 13.5
€m
€m
4.2 4.4
7.7 5
2.2 2.9
133.2 148.3
97.0 156.4
16.0 16.3
Net Sales
14.3% 17.1%
18.1% 17.6%
2.0% 2.2%
LfL EBITDA margin
25
20,616,8
FY 16 FY 17
29,3
16,9
FY 17FY 16
-0,2-0,2
FY 16 FY 17
13.0% 14.3%
2,21,8
FY 16 FY 17
22,918,6
FY 16 FY 17
1,7
3,5
FY 16 FY 17
30,920,5
FY 17FY 16
1,81,4
FY 17FY 16
1,61,3
FY 16 FY 17
42.6% 50.9% 13.9% 15.4%
19.0% 19.3%45.8%
34.2%23.2% 19.8%
-1.2%64.3% 63.1% 7.9%
10.0%-1.7%
Shown lfl EBITDA margin for 2016 cannot be compared with prospectus due to different lfl cohort in 2017
Reconciliation of adjusted EBITDA
26
Comments
1
2
3
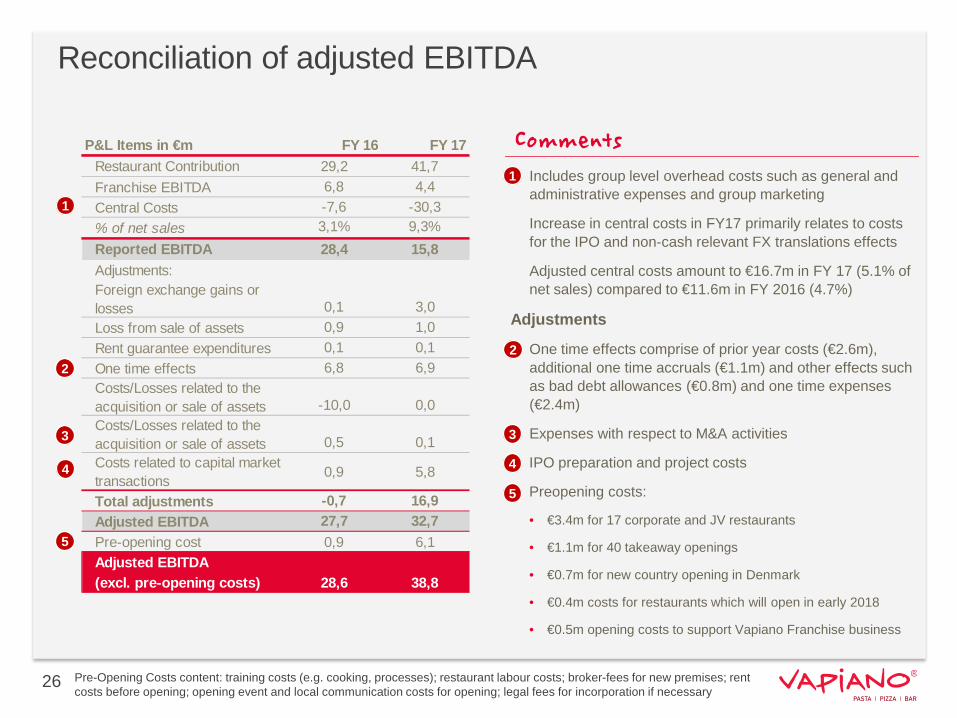
• Includes group level overhead costs such as general and administrative expenses and group marketing
Increase in central costs in FY17 primarily relates to costs for the IPO and non-cash relevant FX translations effects
Adjusted central costs amount to €16.7m in FY 17 (5.1% of net sales) compared to €11.6m in FY 2016 (4.7%)
Adjustments
• One time effects comprise of prior year costs (€2.6m), additional one time accruals (€1.1m) and other effects such as bad debt allowances (€0.8m) and one time expenses (€2.4m)
• Expenses with respect to M&A activities
IPO preparation and project costs
Preopening costs:
• €3.4m for 17 corporate and JV restaurants
• €1.1m for 40 takeaway openings
• €0.7m for new country opening in Denmark
• €0.4m costs for restaurants which will open in early 2018
• €0.5m opening costs to support Vapiano Franchise business
1
2
3
4 4
P&L Items in €m FY 16 FY 17Restaurant Contribution 29,2 41,7Franchise EBITDA 6,8 4,4Central Costs -7,6 -30,3% of net sales 3,1% 9,3%Reported EBITDA 28,4 15,8Adjustments:Foreign exchange gains or losses 0,1 3,0Loss from sale of assets 0,9 1,0Rent guarantee expenditures 0,1 0,1One time effects 6,8 6,9Costs/Losses related to the acquisition or sale of assets -10,0 0,0Costs/Losses related to the acquisition or sale of assets 0,5 0,1Costs related to capital market transactions 0,9 5,8
Total adjustments -0,7 16,9Adjusted EBITDA 27,7 32,7Pre-opening cost 0,9 6,1Adjusted EBITDA(excl. pre-opening costs) 28,6 38,8
5
5
Pre-Opening Costs content: training costs (e.g. cooking, processes); restaurant labour costs; broker-fees for new premises; rentcosts before opening; opening event and local communication costs for opening; legal fees for incorporation if necessary
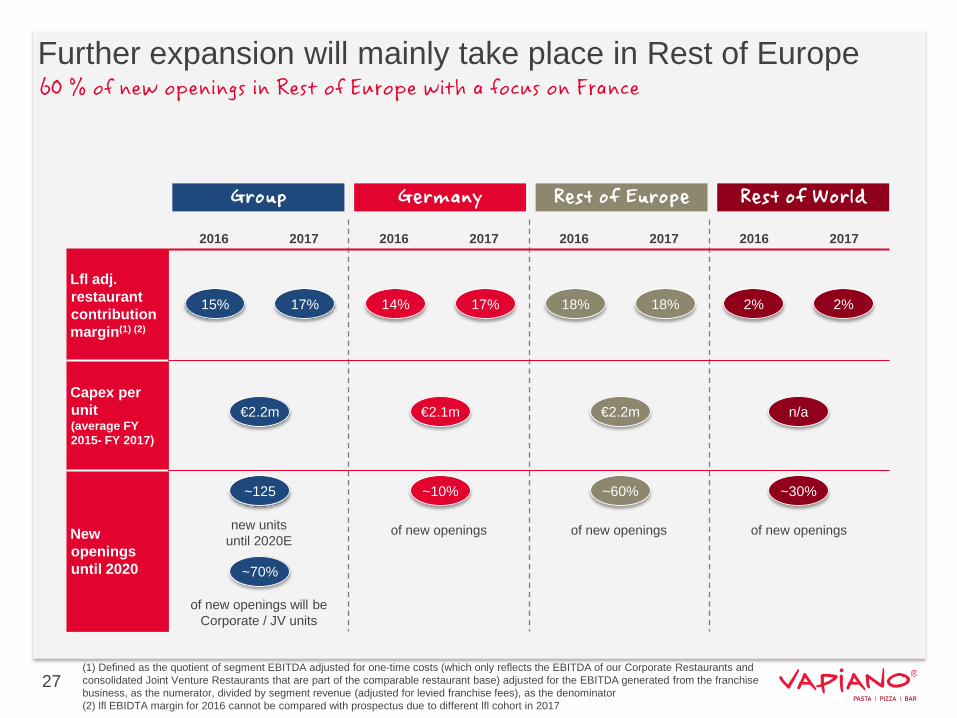
Further expansion will mainly take place in Rest of Europe
Group Germany Rest of Europe Rest of World
2016 2017 2016 2017 2016 2017 2016 2017
Lfl adj.restaurantcontributionmargin(1) (2)
Capex perunit (average FY 2015- FY 2017)
`
New openingsuntil 2020
new units until 2020E
of new openings will beCorporate / JV units
of new openings of new openings of new openings
(1) Defined as the quotient of segment EBITDA adjusted for one-time costs (which only reflects the EBITDA of our Corporate Restaurants and consolidated Joint Venture Restaurants that are part of the comparable restaurant base) adjusted for the EBITDA generated from the franchise business, as the numerator, divided by segment revenue (adjusted for levied franchise fees), as the denominator (2) lfl EBIDTA margin for 2016 cannot be compared with prospectus due to different lfl cohort in 2017
15% 17%
€2.2m
~125
~70%
14% 17%
€2.1m
~10%
18% 18%
€2.2m
~60%
2% 2%
n/a
~30%
27
60 % of new openings in Rest of Europe with a focus on France

25,7%
37,4%
DEC 16 DEC 17
28
Equity base significantly increased in FY 2017
Equity development Equity ratio
Significant increase in equity resulting from IPO net proceeds (€75m) in June 2017
Equity ratio on a healthy basis at 37.4% as at year-end 2017
€m €m
77,0
131,1
DEC 16 DEC 17

51,5
78,5
FY 16 FY 17
29
Net financial debt and Capex
Net financial debt development Capex
(1) Net debt includes €114.0m long-term financial liabilities, € 30.5m short-term financial liabilities less €14.8m cash and cash equivalents and €13.5m financial receivables
(1)
Net financial debt position significantly reduced post IPO
Medium-term leverage target of approximately 2x adjusted EBITDA, at end of FY 17 3.0x adjusted EBITDA
Capex comprises mainly capex for new restaurant openings (€42.8m), remodelling capex (€12.8m), investments for takeaway roll-out (€5.2m) as well as M&A capex (€5.0m) and IT capex (€3.6m)
134,3
116,219,4
75,0 78,5
Net IPO proceeds
Changes in financial liabilities
Net financial debt Dec16
Other cash flow
2,2
Capex Net financial debt Dec17
€m €m
Strong investment in growth of almost €80m in FY 2017

30
Outlook FY 2018Jochen Halfmann

Outlook for FY 2018
31
Restaurant openings 33 – 38 (1)
Group net sales €390m - €420m
Group lfl sales growth 1% - 3%
Adjusted EBITDA (excl. pre-opening costs) €48m - €54m
(1) Guidance includes 3 delayed openings from FY 2017
Accelerated expansion while further increasing profitability
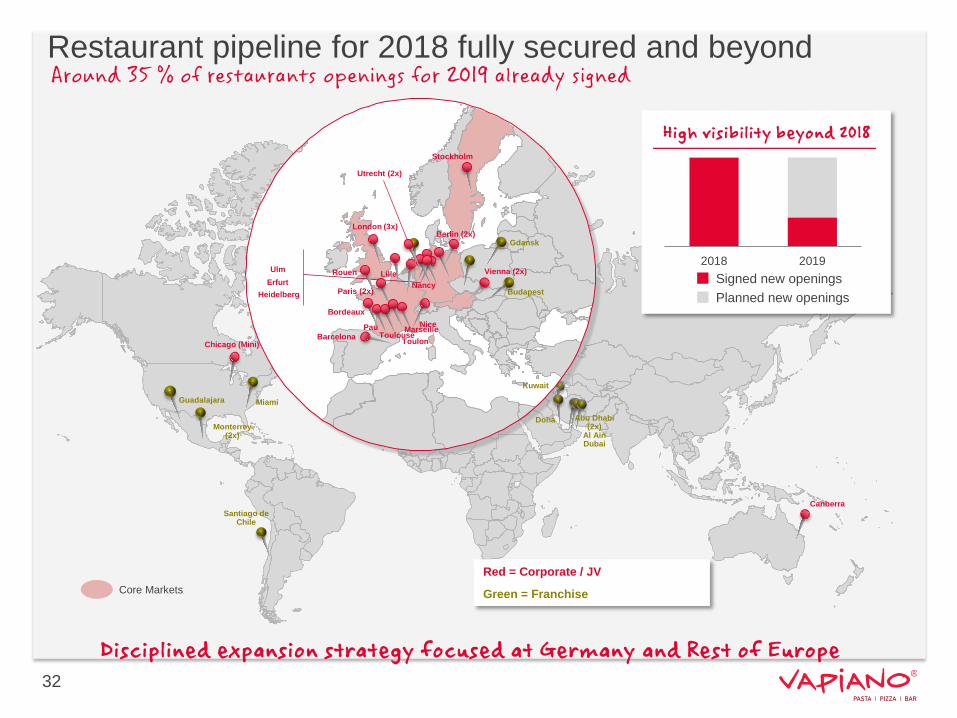
Doha
London (3x)
Paris (2x)
Vienna (2x)UlmErfurt
Budapest
Gdansk
Utrecht (2x)
Miami
Santiago de Chile
Red = Corporate / JV
Green = Franchise Core Markets
32
Toulouse
Canberra
Stockholm
Bordeaux
Berlin (2x)
Rouen
Nice
HeidelbergNancy
Marseille
Lille
Kuwait
Pau
Monterrey (2x)
Guadalajara
Abu Dhabi (2x)
Al AinDubai
Chicago (Mini)
2018 2019
High visibility beyond 2018
Signed new openingsPlanned new openings
Barcelona Toulon
Restaurant pipeline for 2018 fully secured and beyond
Disciplined expansion strategy focused at Germany and Rest of Europe
Around 35 % of restaurants openings for 2019 already signed
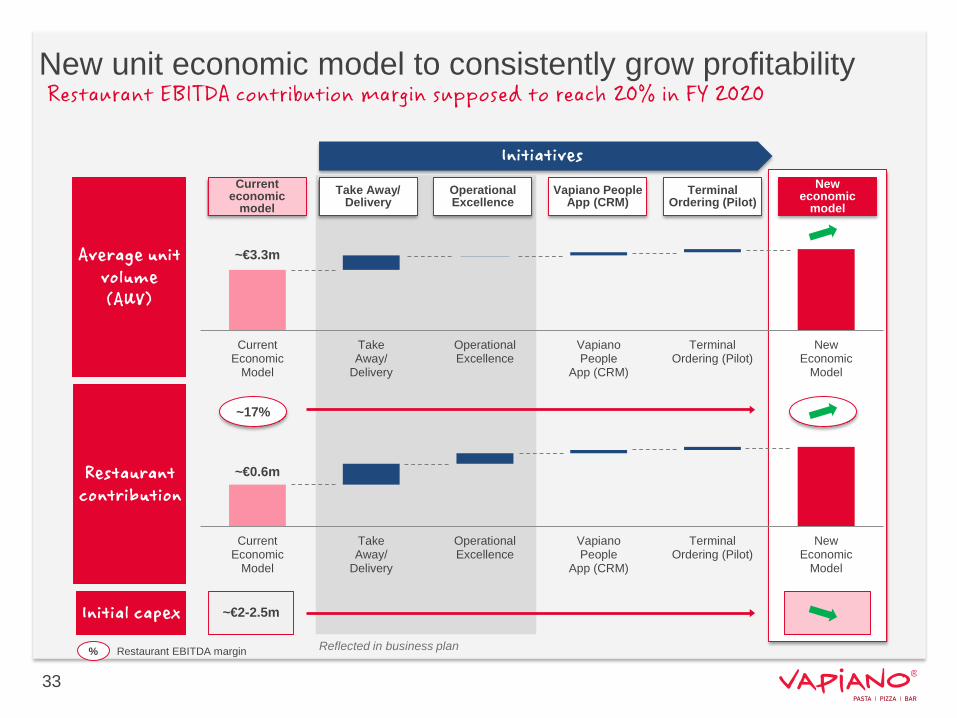
New unit economic model to consistently grow profitability
% Restaurant EBITDA margin
~€3.3m
CurrentEconomic
Model
TakeAway/
Delivery
OperationalExcellence
VapianoPeople
App (CRM)
TerminalOrdering (Pilot)
NewEconomic
Model
Average unit volume(AUV)
Restaurant contribution
Currenteconomic
model
Neweconomic
modelTerminal
Ordering (Pilot)Vapiano People
App (CRM)Take Away/
Delivery
Initiatives
~€0.6m
CurrentEconomic
Model
TakeAway/
Delivery
OperationalExcellence
VapianoPeople
App (CRM)
TerminalOrdering (Pilot)
NewEconomic
Model
~17%
Initial capex ~€2-2.5m
Operational Excellence
33
Reflected in business plan
Restaurant EBITDA contribution margin supposed to reach 20% in FY 2020

34
Appendix
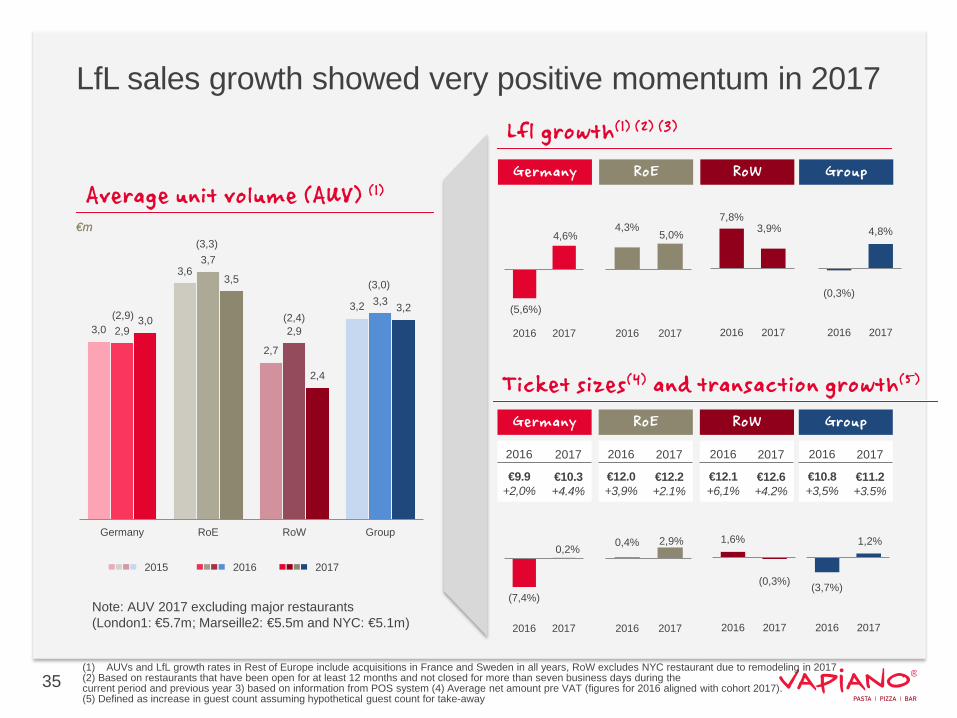
LfL sales growth showed very positive momentum in 2017Lfl growth(1) (2) (3)
(1) AUVs and LfL growth rates in Rest of Europe include acquisitions in France and Sweden in all years, RoW excludes NYC restaurant due to remodeling in 2017 (2) Based on restaurants that have been open for at least 12 months and not closed for more than seven business days during the current period and previous year 3) based on information from POS system (4) Average net amount pre VAT (figures for 2016 aligned with cohort 2017). (5) Defined as increase in guest count assuming hypothetical guest count for take-away
€m
Ticket sizes(4) and transaction growth(5)
Germany RoE RoW
(5,6%)
4,6%
2016 2017
Germany RoE RoW
4,3%5,0%
2016 2017
7,8%3,9%
2016 2017
2016
€9.9+2,0%
2017
€10.3+4.4%
2016
€12.0+3,9%
2017
€12.2+2.1%
2016
€12.1+6,1%
2017
€12.6+4.2%
Group
Group
2016
€10.8+3,5%
2017
€11.2+3.5%
(0,3%)
4,8%
2016 2017
35
(7,4%)
0,2%
2016 2017
0,4% 2,9%
2016 2017
1,6%
(0,3%)
2016 2017
(3,7%)
1,2%
2016 2017
3,0
3,6
2,7
3,2
2,9
3,7
2,9
3,3
3,0
3,5
2,4
3,2
Germany RoE RoW Group
Average unit volume (AUV) (1)
€m
201720162015
Note: AUV 2017 excluding major restaurants(London1: €5.7m; Marseille2: €5.5m and NYC: €5.1m)
(2,9)
(3,3)
(3,0)
(2,4)
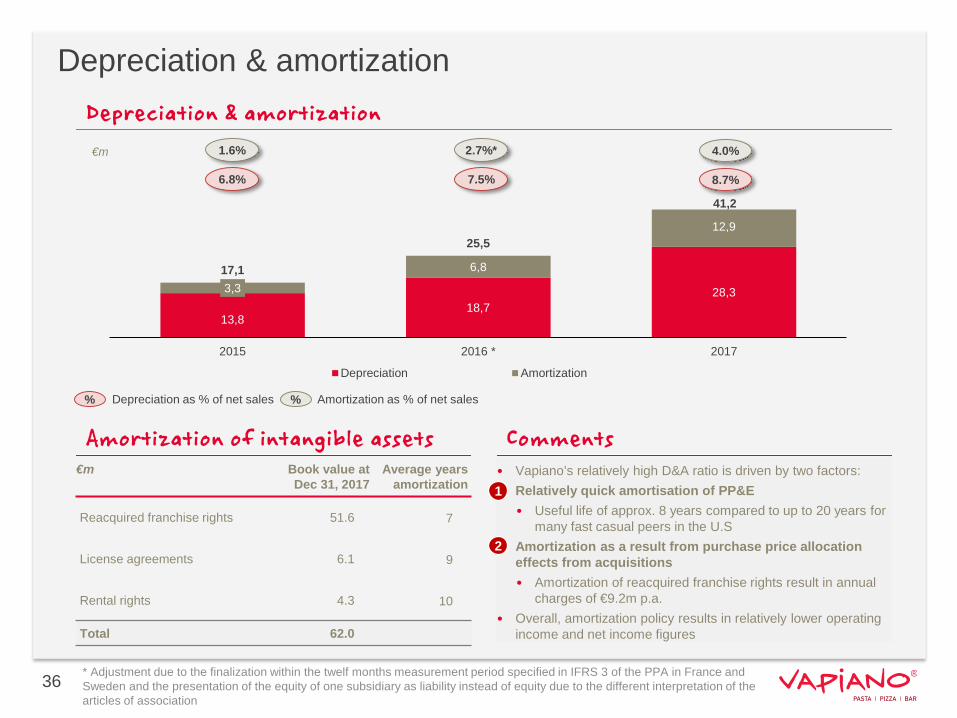
Depreciation & amortization
* Adjustment due to the finalization within the twelf months measurement period specified in IFRS 3 of the PPA in France and Sweden and the presentation of the equity of one subsidiary as liability instead of equity due to the different interpretation of the articles of association
%
Depreciation & amortization €m
• Vapiano’s relatively high D&A ratio is driven by two factors:• Relatively quick amortisation of PP&E
• Useful life of approx. 8 years compared to up to 20 years for many fast casual peers in the U.S
• Amortization as a result from purchase price allocation effects from acquisitions• Amortization of reacquired franchise rights result in annual
charges of €9.2m p.a.• Overall, amortization policy results in relatively lower operating
income and net income figures
Comments
1.6% 2.7%*
%Depreciation as % of net sales
1
2
6.8% 7.5%
Amortization of intangible assets€m Book value at
Dec 31, 2017Average years
amortization
Reacquired franchise rights 51.6 7
License agreements 6.1 9
Rental rights 4.3 10
Total 62.0
Amortization as % of net sales
36
4.0%
8.7%
13,818,7
28,33,3
6,8
12,9
17,1
25,5
2015 2016 * 2017
Depreciation Amortization
41,2

Consolidated income statement(€m) FY 2016 (*adjusted) FY 2017
Net sales 248.6 324.7 % growth 30.6%
Cost of materials (59.1) (81.4)
Gross profit 189.5 243.3 % margin 76.2% 74.9%
Other operating income 14.3 12.4
Capitalized development costs 0.9 1.0
Personnel expenses (104.2) (137.8)
Other operating expenses (72.2) (103.1)
Reported EBITDA 28.4 15.8% margin 11.4% 4.9%
Depreciation and amortization (25.5) * (41.2)
Reported EBIT 2.8 * (25.4) % margin 1.1% (7.8%)
Financial result (3.8) * (6.2)
Equity income (0.1) (0.2)
EBT (1.1) * (31.8)Income taxes 0.6 * 2.2
Net income for the period (0.5) * (29.6) of which attributable to the shareholders of Vapiano SE (0.7) (27.7)
of which attributable to non-controlling interests 0.2 (1.9)
37
* Adjustment due to the finalization within the twelf months measurement period specified in IFRS 3 of the PPA in France and Sweden and the presentation of the equity of one subsidiary as liability instead of equity due to the different interpretation of the articles of association
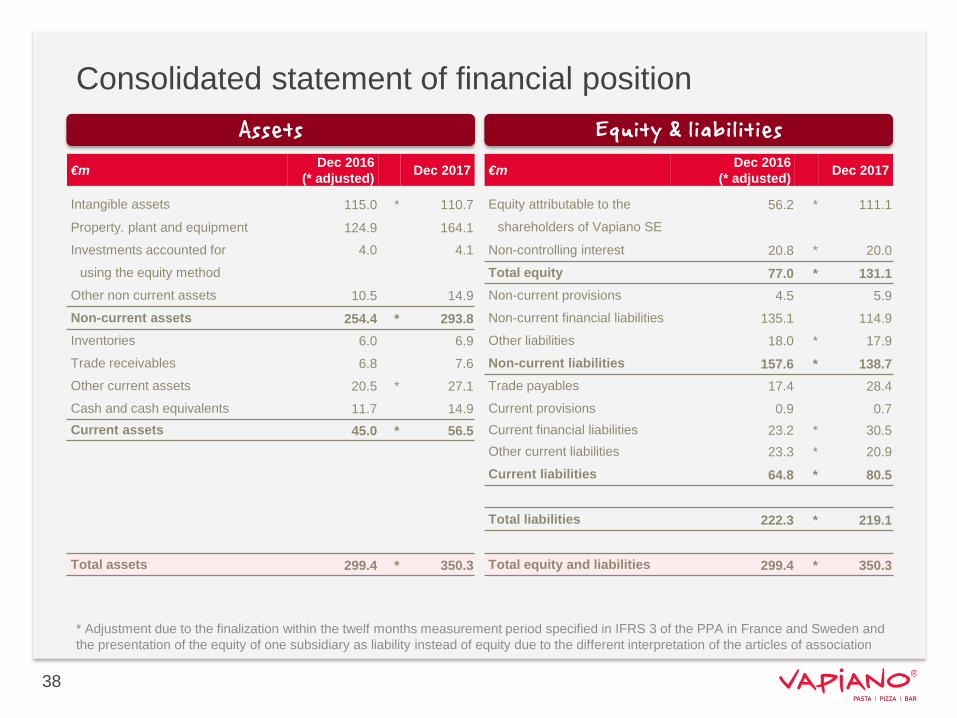
Consolidated statement of financial position
€m Dec 2016 (* adjusted) Dec 2017 €m Dec 2016
(* adjusted) Dec 2017
Intangible assets 115.0 * 110.7 Equity attributable to the 56.2 * 111.1 Property. plant and equipment 124.9 164.1 shareholders of Vapiano SE
Investments accounted for 4.0 4.1 Non-controlling interest 20.8 * 20.0 using the equity method Total equity 77.0 * 131.1
Other non current assets 10.5 14.9 Non-current provisions 4.5 5.9 Non-current assets 254.4 * 293.8 Non-current financial liabilities 135.1 114.9 Inventories 6.0 6.9 Other liabilities 18.0 * 17.9 Trade receivables 6.8 7.6 Non-current liabilities 157.6 * 138.7 Other current assets 20.5 * 27.1 Trade payables 17.4 28.4 Cash and cash equivalents 11.7 14.9 Current provisions 0.9 0.7 Current assets 45.0 * 56.5 Current financial liabilities 23.2 * 30.5
Other current liabilities 23.3 * 20.9 Current liabilities 64.8 * 80.5
Total liabilities 222.3 * 219.1
Total assets 299.4 * 350.3 Total equity and liabilities 299.4 * 350.3
Assets Equity & liabilities
38
* Adjustment due to the finalization within the twelf months measurement period specified in IFRS 3 of the PPA in France and Sweden and the presentation of the equity of one subsidiary as liability instead of equity due to the different interpretation of the articles of association
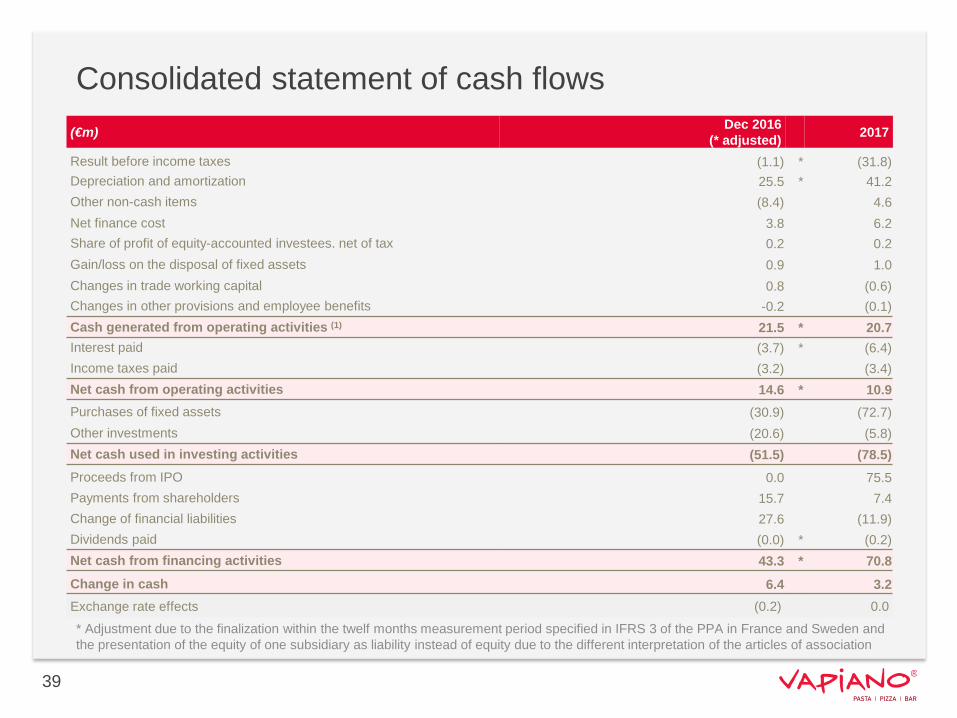
Consolidated statement of cash flows(€m) Dec 2016
(* adjusted) 2017
Result before income taxes (1.1) * (31.8)Depreciation and amortization 25.5 * 41.2Other non-cash items (8.4) 4.6Net finance cost 3.8 6.2 Share of profit of equity-accounted investees. net of tax 0.2 0.2 Gain/loss on the disposal of fixed assets 0.9 1.0 Changes in trade working capital 0.8 (0.6)Changes in other provisions and employee benefits -0.2 (0.1)Cash generated from operating activities (1) 21.5 * 20.7Interest paid (3.7) * (6.4)Income taxes paid (3.2) (3.4)Net cash from operating activities 14.6 * 10.9 Purchases of fixed assets (30.9) (72.7)Other investments (20.6) (5.8)Net cash used in investing activities (51.5) (78.5)Proceeds from IPO 0.0 75.5Payments from shareholders 15.7 7.4Change of financial liabilities 27.6 (11.9) Dividends paid (0.0) * (0.2)Net cash from financing activities 43.3 * 70.8 Change in cash 6.4 3.2 Exchange rate effects (0.2) 0.0
39
* Adjustment due to the finalization within the twelf months measurement period specified in IFRS 3 of the PPA in France and Sweden and the presentation of the equity of one subsidiary as liability instead of equity due to the different interpretation of the articles of association
Disclaimer
40
THIS COMMUNICATION IS PROVIDED FOR INFORMATION PURPOSES ONLY AND IS SUBJECT TO CHANGE. IT IS INDICATIVE, NOT BINDING AND WILL NOT BE UPDATED.
This communication and information included therein has been prepared solely by VAPIANO SE (the Company) has not been verified independently and is provided for information purposes only.This Presentation has been made available to financial analysts. Presentations are by their nature abbreviated information and cannot substitute for narrative information. In addition, the information herein is preliminary and is not comprehensive. Consistent with its purpose, this Presentation does not include all information that is material to evaluate the strengths and weaknesses as well as risks and opportunities of the Company.
This document contains forward-looking statements. Forward-looking statements include, but are not limited to, all statements other than statements of historical facts contained in this presentation, including, without limitation, projections, forecasts or estimates of cash flows, yields or return, scenario analyses and model illustrations regarding the Company’s and the Group’s results of operations, strategy, plans, objectives, goals and targets. These statements are based on plans, estimates, projections and assumptions as they are currently available to the management of the Company. Forward-looking statements are characterized by the use of words such as expect, intend, plan, predict, assume, believe, estimate, anticipate and similar formulations. Such statements are not to be understood as in any way guaranteeing that those expectations will turn out to be accurate. Future performance and the results actually achieved by the Company and its affiliated companies depend on a number of risks and uncertainties and may therefore differ materially from the forward-looking statements. Many of these factors are outside the Company’s control and cannot be accurately estimated in advance, such as the future economic environment and the actions of competitors and others involved in the marketplace. The Company neither plans nor undertakes to update any forward-looking statements. Any forward-looking information is based upon certain assumptions about future events or conditions and is intended only to illustrate hypothetical results under those assumptions (not all of which are specified herein or can be ascertained at this time). This Presentation contains information that prior to its disclosure may have constituted inside information under European Union Regulation 596/2014 on market abuse.The Company obtained certain industry and market data used in this Presentation from publications and studies conducted by third parties and estimates prepared by the Company based on certain assumptions. While the Company believes that the industry and market data from external sources is accurate and correct, neither the Company nor its advisers have independently verified such data or sought to verify that the information remains accurate as of the date of this Presentation and neither the Company nor its advisers make any representation as to the accuracy of such information. Similarly, the Company believes that its internal estimates are reliable, but these estimates have not been verified by any independent sources.The Company and its advisers, and any of their respective affiliates, personally liable partners, directors, officers, employees, advisers or agents, shall accept no responsibility and have no liability whatsoever (in negligence or otherwise) to you or to any third parties, for the quality, adequacy, reasonableness, accuracy, fairness, timeliness, continued availability or completeness of any data or calculations contained and/or referred to in this communication (or whether any information has been omitted from the Presentation) or any other information relating to the Company, whether written, oral or in a visual or electronic form, and howsoever transmitted or made available nor for any special, direct, indirect, incidental or consequential loss or damage which may be sustained because of the use of the information contained and/or referred to in this communication or otherwise arising in connection with the information contained and/or referred to in this communication, provided that this exclusion of liability shall not exclude or limit any liability under any law or regulation applicable to the Company that may not be excluded or restricted.
All information in this presentation is current at the time of publication but may be subject to change in the future. The Company and its advisors disclaim any obligation to update or revise any statements, in particular forward-looking statements, to reflect future events or developments.
This Presentation does not constitute or form part of, and should not be construed as an offer or invitation or recommendation to, purchase or sell or subscribe for, or as any solicitation of any offer to purchase or subscribe for, any securities of the Company, in any jurisdiction. Neither this Presentation, nor any part thereof nor anything contained or referred to therein, nor the fact of its distribution, should form the basis of or be relied on in connection with, or serve as an inducement in relation to, a decision to purchase or subscribe for or enter into any contract or make any other commitment whatsoever in relation to any such securities. Securities of the Company and its subsidiaries have not been, and are not intended to become, registered under the United States Securities Act of 1933 (the Act). This communication is not an offer of securities for sale in the United States of America. Securities may not be offered or sold in the United States of America absent registration or an exemption from registration under the Act, as amended. Securities may only be sold pursuant to, or in a transaction exempt from, the registration requirements of the Act. Any public offering of securities to be made in the United States of America would be made by means of a prospectus that can be obtained from the issuer and that contains detailed information about the company and management, as well as financial statements. There is no public offer of any securities of the Company in the United States of America. Any decision to purchase any product or enter into any transaction referred to in this communication should be based upon the information contained in any associated offering document. In receiving or otherwise accessing this Presentation, you will be deemed to have represented, agreed and undertaken (i) that you are permitted, in accordance with all applicable laws, to receive such information, (ii) that you are solely responsible for your own assessment of the business and financial position of the Company and that you will conduct your own analysis and be solely responsible for forming your own view of the potential future performance of the Company and (iii) that you have read and agree to comply with the contents of this notice.
This Presentation and its contents are strictly confidential and has been presented to you solely for your information; it may not be distributed or passed on to any other person or published or copied or reproduced, in whole or in part, by any medium or in any form for any purpose.
Recipients of this Presentation should not treat the contents of this Presentation as advice relating to legal, taxation or investment matters, and must make their own assessments concerning such matters and other consequences of a potential investment in the Company and its securities, including the merits of investing and related risks.

Reporting dates 2018 / Contact details
41
April 25, 2018
Sept 12, 2018 Publication Q2 results 2018
Full year results 2017 / Analyst conference/ Press conference
Annual General Meeting Cologne / Düsseldorf June 6, 2018
Nov 28, 2018 Publication Q3 results 2018
May 23, 2018 Publication Q1 results 2018
Dr. Andrea RolveringHead of Investor RelationsVAPIANO SEMobile: +49 151 5445 9750Office: +49 221 67001 301 Email: [email protected]