Embed Size (px)
Citation preview

1360 Redwood Way, Suite C
Petaluma, CA 94954-1169 707/665-9900
FAX 707/665-9800 www.sonomatech.com
PROCESSING AND VALIDATION OF DATA COLLECTED
BY RADAR WIND PROFILERS, RADIO ACOUSTIC SOUNDING SYSTEMS, AND SODARS DURING THE
1997 SOUTHERN CALIFORNIA OZONE STUDY FINAL REPORT
STI-99752A/B-2151-FR
By: Clinton P. MacDonald
Duc T. Nguyen Timothy S. Dye
Alexander N. Barnett Charles A. Knoderer
Paul T. Roberts Sonoma Technology, Inc.
1360 Redwood Way, Suite C Petaluma, CA 94954
Robert A. Baxter Parsons Corporation 100 W. Walnut Street Pasadena, CA 91124
Bob L. Weber National Oceanic and Atmospheric Administration
Environmental Technology Laboratory 325 Broadway
Boulder, CO 80303
Prepared for: Jim Pederson Dr. Xinqiu Zhang California Air Resources Board South Coast Air Quality 1001 I Street Management District Sacramento, CA 95814 21865 East Copley Drive Diamond Bar, CA 91765
May 24, 2002

This page is intentionally blank.
iii
ACKNOWLEDGMENTS
The authors of this report would like to acknowledge a number of individuals and agencies that provided assistance throughout the project. We extend our appreciation to all of the following:
• The California Air Resources Board for funding this project.
• Jim Pederson for managing and participating in the data reprocessing and quality control effort and for participating in the validation of the rawinsonde data.
• Xinqiu Zhang of the South Coast Air Quality Management District for providing a contract mechanism and for continual support of the contract to complete this work.
• Stella Weber, a National Oceanic and Atmospheric Administration Environmental Technology Laboratory guest worker, for providing the programming for the automated reprocessing of the RP/RASS data.
• Sonoma Technology, Inc.’s Publications staff members, Lisa DiStefano and Sandy Smethurst, who helped prepare the text and figures and published the report.

This page is intentionally blank.

v
TABLE OF CONTENTS
Section Page
ACKNOWLEDGMENTS ............................................................................................................. iii LIST OF FIGURES ........................................................................................................................ix LIST OF TABLES ..........................................................................................................................xi EXECUTIVE SUMMARY........................................................................................................ES-1
1. INTRODUCTION.............................................................................................................. 1-1 1.1 Details About the Rationale for This Project............................................................ 1-1 1.2 Guide to the Report................................................................................................... 1-2
2. DATA COLLECTION AND INITIAL PROCESSING.................................................... 2-1 2.1 Meteorological Monitoring Network Description.................................................... 2-1
2.1.1 RP/RASS Background ................................................................................. 2-1 2.1.2 Sodar Background ........................................................................................ 2-5
2.2 RP/RASS Data Processing Procedures..................................................................... 2-5 2.2.1 Traditional Method....................................................................................... 2-5 2.2.2 Met_0 and Met_1 Processing Methods ........................................................ 2-7 2.2.3 Met_0 Data Processing and QC Procedures as Compared with the
Traditional Data Processing and QC Procedures ......................................... 2-7 2.2.4 Met_1 Data Processing and QC Procedures................................................. 2-8 2.2.5 Summary ...................................................................................................... 2-9
3. DATA PROCESSING AND QUALITY CONTROL....................................................... 3-1 3.1 Radar Profiler and RASS.......................................................................................... 3-1
3.1.1 Correction of Physical Instrument and Setup Configuration Problems ....... 3-1 3.1.2 Merging of Low- and High-Mode Data and Data Reformatting.................. 3-2 3.1.3 Objective Data Processing and Validation................................................... 3-2 3.1.4 Rawinsonde Data Validation........................................................................ 3-4
3.2 Subjective Data Processing and Quality Control Procedures ................................... 3-5 3.3 Sodar ....................................................................................................................... 3-12
3.3.1 Data Review ............................................................................................... 3-12 3.3.2 Level 0.5 Validation................................................................................... 3-13 3.3.3 Level 1.0 Validation................................................................................... 3-13 3.3.4 Level 2.0 Validation................................................................................... 3-15 3.3.5 Final Review of Sodar Level 2.0 Data ....................................................... 3-15
3.4 Surface Winds......................................................................................................... 3-15
4. DATA FILE STRUCTURE ............................................................................................... 4-1
5. DATA QUALITY DESCRIPTORS .................................................................................. 5-1 5.1 Alpine........................................................................................................................ 5-2 5.2 Azusa ........................................................................................................................ 5-2 5.3 Barstow ..................................................................................................................... 5-3 5.4 Brown Field .............................................................................................................. 5-3

vi
TABLE OF CONTENTS (Continued)
Section Page
5.5 Carlsbad.................................................................................................................... 5-4 5.6 Central Los Angeles.................................................................................................. 5-4 5.7 El Centro................................................................................................................... 5-4 5.8 El Monte ................................................................................................................... 5-5 5.9 Goleta........................................................................................................................ 5-5 5.10 Hesperia .................................................................................................................... 5-5 5.11 Los Angeles International Airport ............................................................................ 5-5 5.12 Los Alamitos............................................................................................................. 5-6 5.13 Norton....................................................................................................................... 5-6 5.14 Ontario ...................................................................................................................... 5-6 5.15 Palmdale.................................................................................................................... 5-7 5.16 Point Loma................................................................................................................ 5-7 5.17 Port Hueneme ........................................................................................................... 5-8 5.18 Riverside................................................................................................................... 5-8 5.19 San Clemente Island ................................................................................................. 5-8 5.20 Santa Catalina Island ................................................................................................ 5-9 5.21 Santa Clarita.............................................................................................................. 5-9 5.22 Simi Valley ............................................................................................................. 5-10 5.23 Temecula................................................................................................................. 5-10 5.24 Thermal................................................................................................................... 5-11 5.25 Tustin ...................................................................................................................... 5-11 5.26 Twenty-Nine Palms – EAF1................................................................................... 5-11 5.27 Twenty-Nine Palms – EAF2................................................................................... 5-11 5.28 Twenty-Nine Palms – TUR .................................................................................... 5-11 5.29 Valley Center .......................................................................................................... 5-11 5.30 Vandenberg AFB.................................................................................................... 5-12 5.31 Van Nuys ................................................................................................................ 5-12 5.32 Warner Springs ....................................................................................................... 5-12
6. MAJOR PROBLEMS FOUND DURING SUBJECTIVE DATA VALIDATION .......... 6-1 6.1 Alpine........................................................................................................................ 6-2 6.2 Azusa ........................................................................................................................ 6-2 6.3 Barstow ..................................................................................................................... 6-2 6.4 Brown Field .............................................................................................................. 6-2 6.5 Carlsbad.................................................................................................................... 6-3 6.6 Central Los Angeles.................................................................................................. 6-3 6.7 El Centro................................................................................................................... 6-3 6.8 El Monte ................................................................................................................... 6-3 6.9 Goleta........................................................................................................................ 6-4 6.10 Hesperia .................................................................................................................... 6-4 6.11 Los Angeles International Airport ............................................................................ 6-4 6.12 Los Alamitos............................................................................................................. 6-4 6.13 Norton....................................................................................................................... 6-5

vii
TABLE OF CONTENTS (Concluded)
Section Page 6.14 Ontario ...................................................................................................................... 6-5 6.15 Palmdale.................................................................................................................... 6-5 6.16 Point Loma................................................................................................................ 6-5 6.17 Port Hueneme ........................................................................................................... 6-6 6.18 Riverside................................................................................................................... 6-6 6.19 San Clemente Island ................................................................................................. 6-6 6.20 santa Catalina Island ................................................................................................. 6-6 6.21 Santa Clarita.............................................................................................................. 6-6 6.22 Simi Valley ............................................................................................................... 6-7 6.23 Temecula................................................................................................................... 6-7 6.24 Thermal..................................................................................................................... 6-7 6.25 Tustin ........................................................................................................................ 6-7 6.26 Twenty-Nine Palms – EAF1..................................................................................... 6-8 6.27 Twenty-Nine Palms – EAF2..................................................................................... 6-8 6.28 Twenty-Nine Palms – TUR ...................................................................................... 6-8 6.29 Valley Center ............................................................................................................ 6-8 6.30 Vandenberg AFB...................................................................................................... 6-8 6.31 Van Nuys .................................................................................................................. 6-9 6.32 Warner Springs ......................................................................................................... 6-9
7. RECOMMENDATIONS ................................................................................................... 7-1
8. REFERENCES................................................................................................................... 8-1 APPENDIX A: SUMMARY OF RAWINSONDE, RADAR WIND PROFILER, AND
RASS EVALUATIONS .................................................................................. A-1

This page is intentionally blank.

ix
LIST OF FIGURES
Figure Page
2-1. SCOS97 field study RP/RASS and sodar sites ................................................................ 2-3
3-1. Example of poor RP/RASS and rawinsonde wind comparison above the region of consensus (>2500 m) ....................................................................................................... 3-4
3-2. Pre-Level 1.0 wind data at Barstow on August 6, 1997 .................................................. 3-7
3-3. Pre-Level 1.0 Tv data at Point Loma on August 4, 1997 ................................................. 3-7
3-4. Level 1.0 wind data at Barstow on August 6, 1997 ......................................................... 3-8
3-5. Level 1.0 Tv data at Point Loma on August 4, 1997........................................................ 3-8
3-6. Level 1.0 validated wind data at Hesperia on August 6, 1997....................................... 3-10
3-7. EDAS model wind data on August 6, 1997 at 0600 UTC (2200 PST) at 800 mb ......... 3-11
3-8. Level 2.0 wind data at Barstow on August 6, 1997 ....................................................... 3-11
3-9. Level 0.5 validated sodar winds at 29 Palms–EAF2 on August 27, 1997..................... 3-14
3-10. Level 1.0 validated sodar winds at 29 Palms–EAF2 on August 27, 1997..................... 3-15

This page is intentionally blank.
xi
LIST OF TABLES
Table Page
2-1. SCOS97 RP/RASS and sodar site identities and locations .............................................. 2-2
2-2. Specifications for the 915-MHz RP/RASS instrument .................................................... 2-1
2-3 Summary of RP/RASS data processing methods ............................................................ 2-6
3-1. Sites with offsets greater than or equal to 5º and action taken......................................... 3-1
3-2. Geographic classification of the RP/RASS sites.............................................................. 3-2
3-3. QC Flags .......................................................................................................................... 3-5
3-4. Possible data validity code changes ................................................................................. 3-6
3-5. Episode days for which Level 2.0 validation of the RP/RASS wind and Tv data were performed.................................................................................................... 3-9
3-6. QC Codes ....................................................................................................................... 3-13
4-1. Line-by-line description of the wind files........................................................................ 4-2
4-2. Line-by-line description of the Tv files ............................................................................ 4-3
4-3. Format and units of data records in the wind files........................................................... 4-4
4-4. Format and units of data records in the Tv files ............................................................... 4-4
5-1. Summary of data limitations ............................................................................................ 5-1
6-1. Summary of major data validation problems ................................................................... 6-1
ES-1
EXECUTIVE SUMMARY
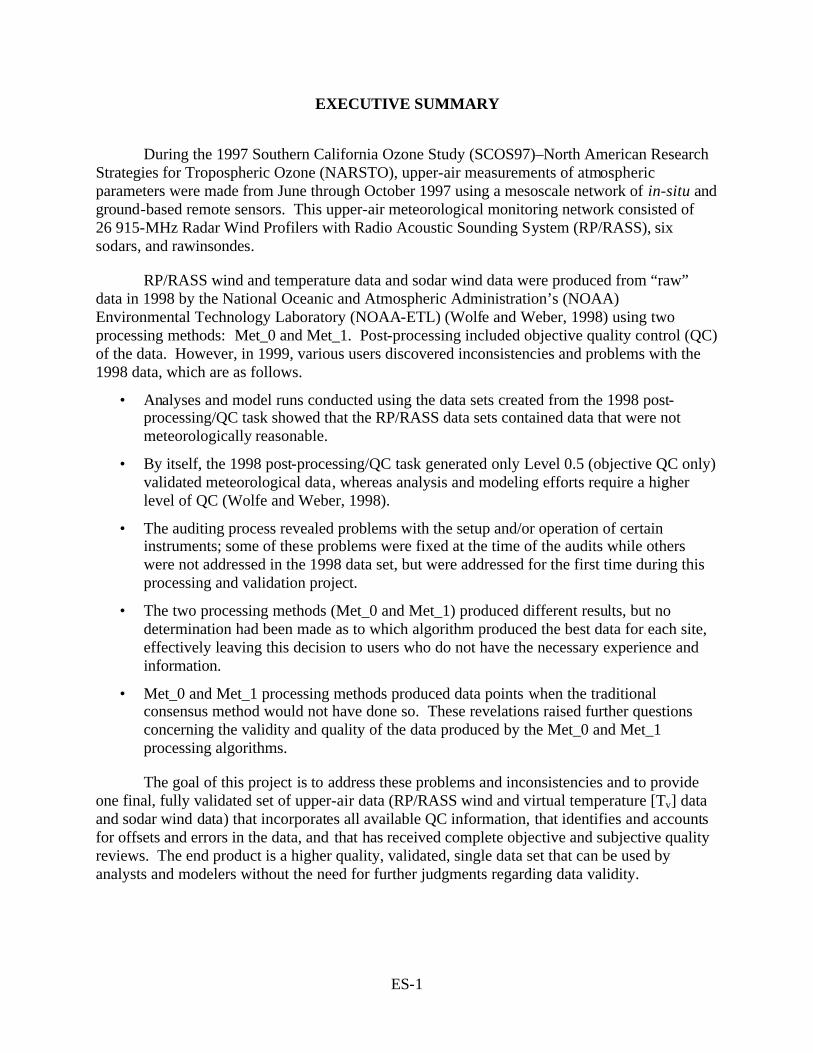
During the 1997 Southern California Ozone Study (SCOS97)–North American Research Strategies for Tropospheric Ozone (NARSTO), upper-air measurements of atmospheric parameters were made from June through October 1997 using a mesoscale network of in-situ and ground-based remote sensors. This upper-air meteorological monitoring network consisted of 26 915-MHz Radar Wind Profilers with Radio Acoustic Sounding System (RP/RASS), six sodars, and rawinsondes.
RP/RASS wind and temperature data and sodar wind data were produced from “raw” data in 1998 by the National Oceanic and Atmospheric Administration’s (NOAA) Environmental Technology Laboratory (NOAA-ETL) (Wolfe and Weber, 1998) using two processing methods: Met_0 and Met_1. Post-processing included objective quality control (QC) of the data. However, in 1999, various users discovered inconsistencies and problems with the 1998 data, which are as follows.
• Analyses and model runs conducted using the data sets created from the 1998 post-processing/QC task showed that the RP/RASS data sets contained data that were not meteorologically reasonable.
• By itself, the 1998 post-processing/QC task generated only Level 0.5 (objective QC only) validated meteorological data, whereas analysis and modeling efforts require a higher level of QC (Wolfe and Weber, 1998).
• The auditing process revealed problems with the setup and/or operation of certain instruments; some of these problems were fixed at the time of the audits while others were not addressed in the 1998 data set, but were addressed for the first time during this processing and validation project.
• The two processing methods (Met_0 and Met_1) produced different results, but no determination had been made as to which algorithm produced the best data for each site, effectively leaving this decision to users who do not have the necessary experience and information.
• Met_0 and Met_1 processing methods produced data points when the traditional consensus method would not have done so. These revelations raised further questions concerning the validity and quality of the data produced by the Met_0 and Met_1 processing algorithms.
The goal of this project is to address these problems and inconsistencies and to provide one final, fully validated set of upper-air data (RP/RASS wind and virtual temperature [Tv] data and sodar wind data) that incorporates all available QC information, that identifies and accounts for offsets and errors in the data, and that has received complete objective and subjective quality reviews. The end product is a higher quality, validated, single data set that can be used by analysts and modelers without the need for further judgments regarding data validity.
ES-2
This report provides information about the instrumentation, data processing methods, and procedures used to fully validate the RP/RASS wind and Tv data and sodar wind data. A large component of this validation effort included objective and subjective review of the internal and external consistency and reasonableness of the RP/RASS data and subsequent editing of the data.
The final RP/RASS and sodar data sets were provided in electronic format on a compact disc (CD) delivered to the California Air Resources Board (ARB) and the South Coast Air Quality Management District (SCAQMD) in February 2002 along with the draft report. The CD also contains log files of all changes to the data made during the validation effort. The CD is supported by a printed insert that contains the information needed to use the data, including formats and QC flag information.
RECOMMENDATIONS
In meeting the goals of this project, we identified several issues that, if considered in future projects, will aid in the production of a final upper-air data set. These issues are identified below with recommendations as to how future program planners might implement these findings.
Adherence to the quality assurance program plan (QAPP) The data collection efforts should start with an end-to-end quality assurance program plan (QAPP) and quality program that define all aspects of the data collection and data processing tasks, how those tasks should be implemented, and how quality assurance personnel should oversee their implementation. The QAPP should be implemented as written. Any deviation from the plan should be decided on before any action is taken, and the QAPP should be amended accordingly.
Performance of audits at all measurement sites Audits were not conducted at all measurements sites. Problems noted in the data collected at unaudited sites proved to be either impossible to resolve or difficult and time consuming to resolve. Audits would have mitigated the problems. In those cases where it was not possible to resolve the problems, the data were either flagged as suspect or invalidated. It is recommended that all sites be audited in a consistent manner. Additionally, a provision should be made to audit any sites that are added to a program after the measurement period has started. The cost of performing audits is small compared to the cost of collecting data that cannot be used in analyses or as model input with sufficient confidence.
Incorporation of audit findings Suspect data identified by the audits should be corrected, flagged, or invalidated before processing begins. It should not be assumed that automated data processing and validation algorithms will find and eliminate flawed data.
Requirement for manual data validation The first round of data processing and validation in 1998 subjected the data to automated processing and validation only. The present study uncovered numerous problems in the data that had not been corrected, flagged, or invalidated by the automated data processing routines. It is
ES-3
recommended that manual internal consistency checks and external comparison among adjacent sites be conducted following initial automated processing and screening to bring the data to the level of quality specified in the QAPP.
Testing of automated data processing and validation routines Generally, the end user should not be the final judge of data quality; rather, the data quality should be determined by the program designers at the beginning of the program and clearly stated in the QAPP. The automated routines used to process and validate data should be tested and proven before being used to process the program data, or, if experimental, a provision in the QAPP should include a task to validate and document the performance of the processing methods.
In this study, we determined that the Met_1 processing technique produced results that better compare with rawinsonde measurements—the measurement characteristics of which are well-documented. It is recommended that the Met_1 processing technique be independently tested to determine its performance characteristics and to enable suggestions for improvements as necessary.
1-1
1. INTRODUCTION
During the 1997 Southern California Ozone Study (SCOS97)–North American Research Strategies for Tropospheric Ozone (NARSTO), upper-air measurements of atmospheric parameters were made from June through October 1997 using a mesoscale network of in-situ and ground-based remote sensors. This upper-air meteorological monitoring network consisted of 26 915-MHz Radar Wind Profilers with Radio Acoustic Sounding System (RP/RASS); six sodars; and rawinsondes operated by the National Weather Service (NWS), the California Air Resources Board (ARB), and the military at various installations in and adjacent to the study domain. Most upper-air instruments had collocated surface meteorological observing stations. Sodars measured low altitude wind profiles each hour whereas the RP/RASS measured both low and high altitude hourly profiles of wind and virtual temperature (Tv). Rawinsonde measurements were not continuous but they were made more frequently during Intensive Operating Periods (IOPs) than traditional twice-per-day measurements.
RP/RASS wind and temperature data and sodar wind data were produced from “raw” data in 1998 by the National Oceanic and Atmospheric Administration’s (NOAA) Environmental Technology Laboratory (NOAA-ETL) (Wolfe and Weber, 1998). However, inconsistencies and problems with the 1998 data were discovered in 1999 by various users and provided the motivation for this project. The goal of this project was to provide one final, fully validated data set of RP/RASS wind and Tv data and sodar wind data that incorporated all available QC information, identified and accounted for offsets and errors in the data, and received complete objective and subjective quality reviews. Subjective quality reviews involved a trained meteorologist who examined the internal (Level 1.0 validation) and external (Level 2.0 validation) consistency and reasonableness of the data values from each site for each hour. Level 1.0 validation was performed on all available data for June through October, and Level 2.0 validation was performed on 35 selected days (see Section 3 for a list of days). The end product is a higher quality, validated, single data set that can be used by analysts and modelers without the need for further judgments regarding data validity. This project was a collaborative effort among Sonoma Technology, Inc. (STI), NOAA-ETL, and Parsons Corporation (Parsons).
1.1 DETAILS ABOUT THE RATIONALE FOR THIS PROJECT
“Raw” data were collected at all 26 RP/RASS sites and at all six sodar stations. RP/RASS data consisted of radar spectral and moments data, including radial velocities, signal-to-noise ratios, and other radar quality control (QC) parameters observed for each beam. Sodar data consisted of radial velocities and QC parameters observed for each beam. The “raw” data were typically collected at intervals of a few minutes for the RP/RASS data and 10-second intervals for the sodars. Those data were subjected to post-processing and objective QC in 1998 using signal processing methods and QC techniques developed by NOAA for processing RP/RASS data. RP/RASS processing was adapted for processing sodar data. The post-processing/QC task identifies and rejects most erroneous measurements (e.g., due to radio frequency interference, spurious radar return from birds and aircraft, ground clutter, noise, etc.) prior to the derivation of meteorological products (e.g., hourly averaged winds and temperatures). Integral to post-processing/QC is an objective analysis based on temporal and spatial consistency.

1-2
RP/RASS moments data were processed using two methods, referred to as Met_0 and Met_1, to provide users with information to evaluate the reliability of data. Only one data set was generated for the sodar data. NOAA uses these automated processing methods in its network of 404-MHz RP/RASS. However, these processing tools had not previously been applied to boundary-layer RP/RASS data, such as those employed for SCOS97–NARSTO. Furthermore, while Met_0 employs processing algorithms considered to be standard, it has long been recognized that processing algorithms employed in Met_1 can account for the presence of small-scale (temporal and spatial) variability (e.g., the presence of convection). The current effort revealed that the Met_0 and Met_1 data exhibited significant differences, but Met_1 generally provided more reliable measurements and was therefore selected as the data to quality-control. The significance of, and the differences between, the Met_0 and Met_1 data sets are discussed in Section 2.
By itself, the 1998 post-processing/QC task generated only Level 0.5 (objective QC only) validated meteorological data whereas analysis and modeling efforts require a higher level of QC (Wolfe and Weber, 1998). Additionally, judgment of the data quality was left to the users, who generally lack the necessary experience and information to make that judgment. Analyses and model runs conducted using the data sets created from the 1998 post-processing/QC task showed that the RP/RASS data sets contained problems that produced erroneous results. The auditing process revealed problems with the setup and/or operation of certain instruments; some of these problems were fixed at the time of the audits while others were not addressed in the 1998 data set, but were addressed for the first time during this processing and validation project. The two processing methods (Met_0 and Met_1) produced different results, but no determination had been made as to which algorithm produced the best data for each site, effectively leaving this decision to users who do not have the necessary information. Finally, it was determined that the Met_0 and Met_1 processing methods produced interpolated data points when the traditional consensus method would not have done so. These revelations raised further questions concerning the validity and quality of the data produced by the Met_0 and Met_1 processing algorithms.
1.2 GUIDE TO THE REPORT
This report provides information about the instrumentation, data processing methods, and procedures used to fully validate the RP/RASS wind and Tv data and sodar wind data (Sections 2 and 3); information on the data file structures (Section 4); and data quality descriptions for each site (Sections 5 and 6). The figures in this report contain color as an integral part of conveying information, so the report should always be viewed in color, whether electronic or printed. The final RP/RASS and sodar data sets are provided in electronic format on a compact disc (CD) delivered to the California Air Resource Board (ARB) and the South Coast Air Quality Management District (SCAQMD) with this report. The CD also contains log files of all changes to the data made during the Level 1.0 and Level 2.0 validation QC effort. The CD is supported by a printed insert that contains the information needed to use the data, including formats and QC flag information.
In meeting the goals of this project, several issues were identified that, if considered in future projects, will aid in the production of a final upper-air data set. These issues and suggested methods to address the issues are presented in Section 7 (Recommendations).
2-1
2. DATA COLLECTION AND INITIAL PROCESSING
2.1 METEOROLOGICAL MONITORING NETWORK DESCRIPTION
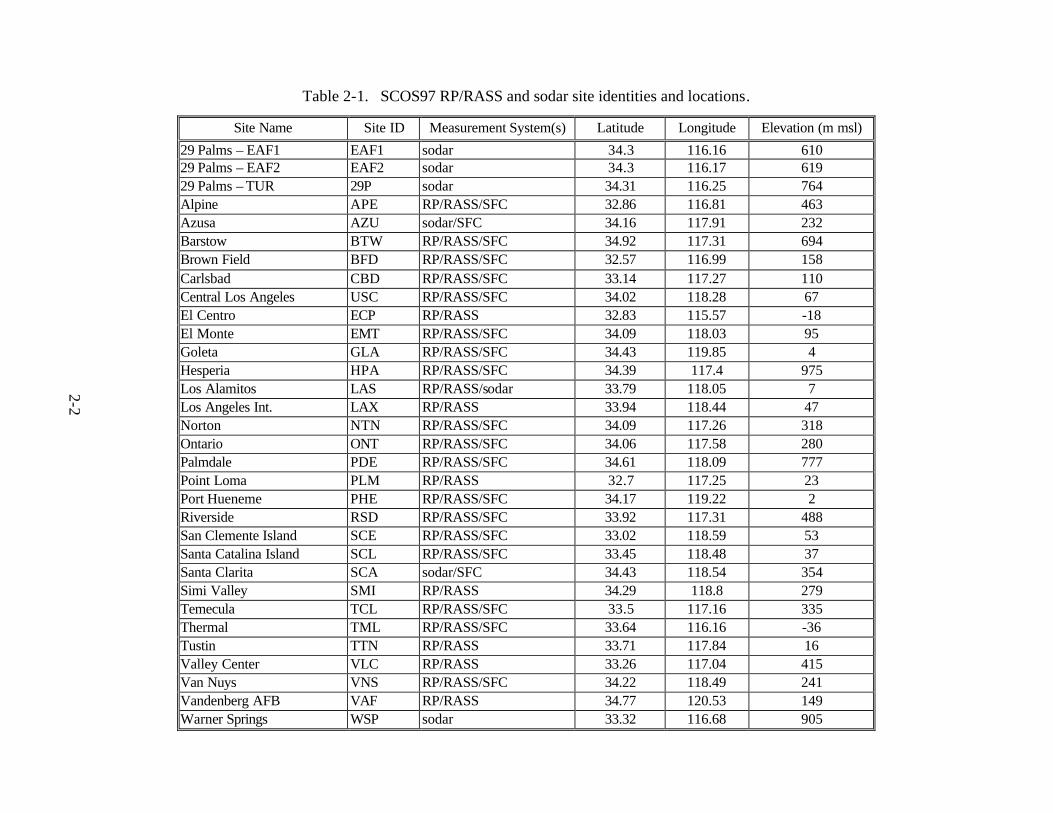
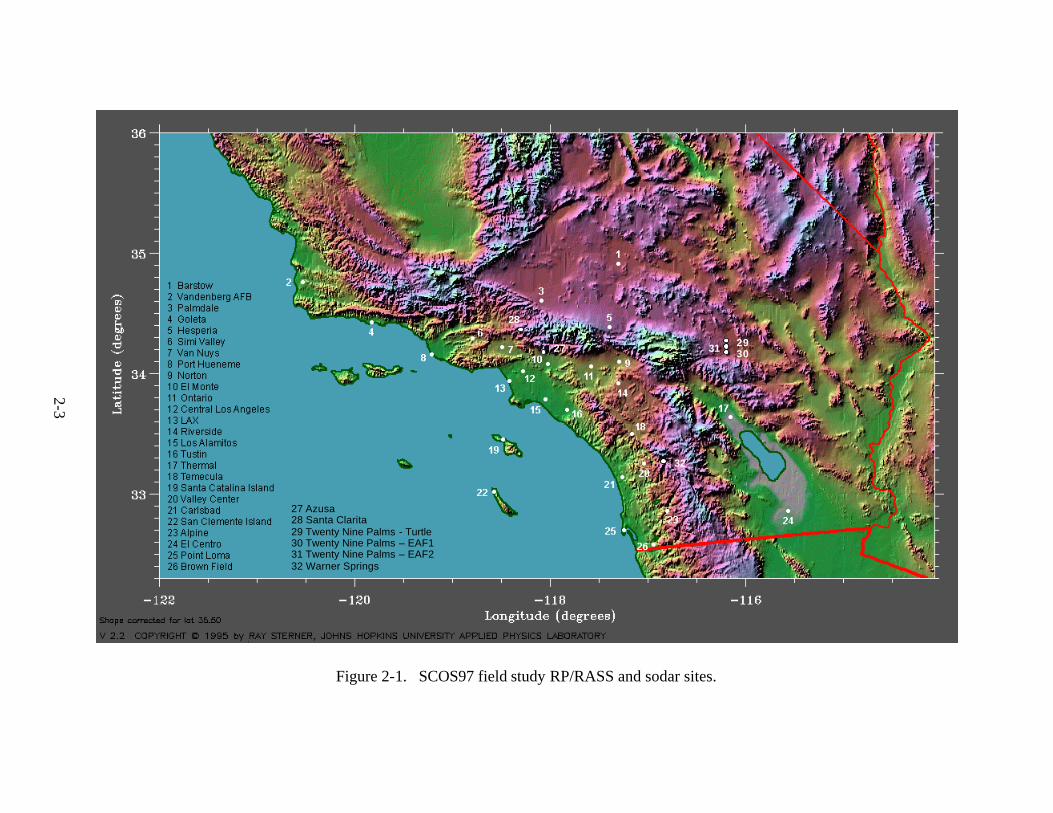
The SCOS97 upper air meteorological monitoring network consisted of 26 RP/RASS; six sodars that were operated at seven locations; and rawinsonde measurements operated by the NWS, ARB, and the military at various installations located within the study area. Table 2-1 lists the RP/RASS and sodar sites, their three-letter designators, and the latitude, longitude, and elevation above sea level of each. Upper-air stations with available collocated surface data are noted in the table by “SFC” under the Measurement System(s) column. Figure 2-1 shows the study area and locations of these RP/RASS and sodar sites.
The rawinsonde measurements were not processed in the same manner as those from the RP/RASS and sodar; thus, they are not the focus of this report and are not included on the CD delivered as part of this project. Those data, however, are available from ARB. The rawinsonde data were used to compare with the RP/RASS and sodar data in this analysis to determine which of the two validated data sets (Met_0, Met_1) best characterized the meteorological conditions at each site. The ARB worked with Parsons to develop the data validation routines needed to ensure the quality of the rawinsonde data for use in these comparisons. Section 3.1.4 presents information about the procedures used to process and validate the rawinsonde data sets. 2.1.1 RP/RASS Background
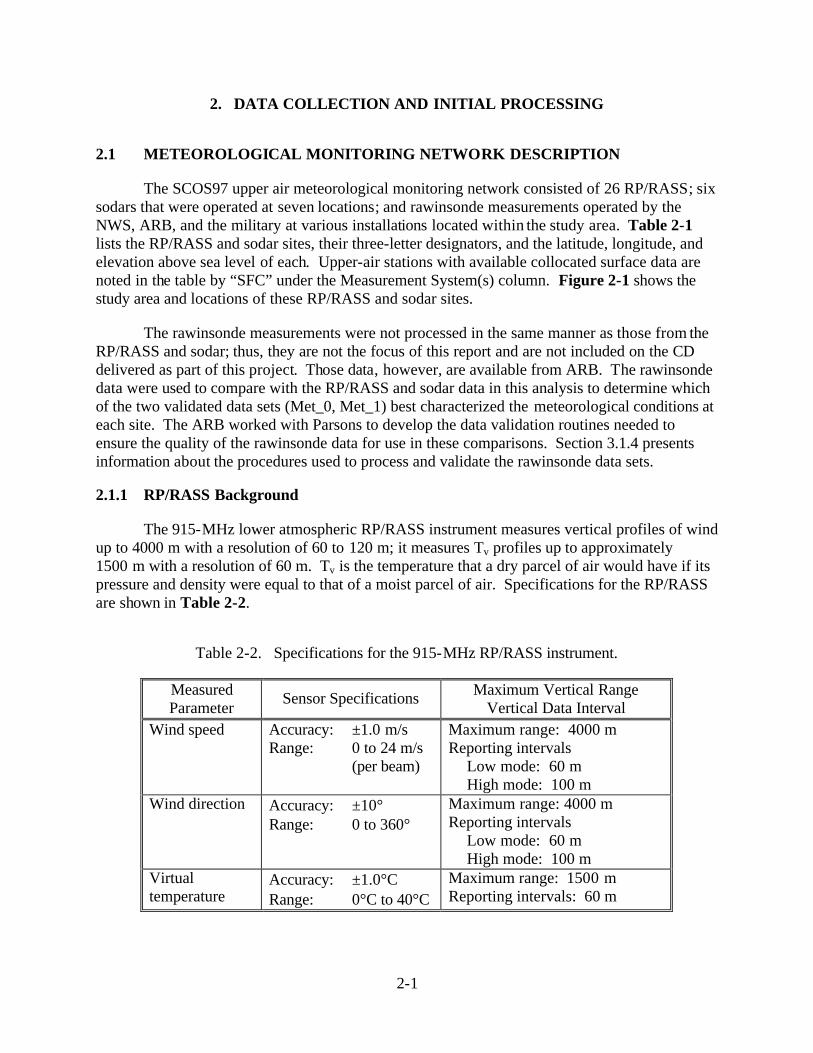
The 915-MHz lower atmospheric RP/RASS instrument measures vertical profiles of wind up to 4000 m with a resolution of 60 to 120 m; it measures Tv profiles up to approximately 1500 m with a resolution of 60 m. Tv is the temperature that a dry parcel of air would have if its pressure and density were equal to that of a moist parcel of air. Specifications for the RP/RASS are shown in Table 2-2.
Table 2-2. Specifications for the 915-MHz RP/RASS instrument.
Measured Parameter Sensor Specifications Maximum Vertical Range
Vertical Data Interval Wind speed Accuracy: ±1.0 m/s
Range: 0 to 24 m/s (per beam)
Maximum range: 4000 m Reporting intervals
Low mode: 60 m High mode: 100 m
Wind direction Accuracy: ±10° Range: 0 to 360°
Maximum range: 4000 m Reporting intervals
Low mode: 60 m High mode: 100 m
Virtual temperature
Accuracy: ±1.0°C Range: 0°C to 40°C
Maximum range: 1500 m Reporting intervals: 60 m
2-2
Table 2-1. SCOS97 RP/RASS and sodar site identities and locations.
Site Name Site ID Measurement System(s) Latitude Longitude Elevation (m msl)
29 Palms – EAF1 EAF1 sodar 34.3 116.16 610 29 Palms – EAF2 EAF2 sodar 34.3 116.17 619 29 Palms – TUR 29P sodar 34.31 116.25 764 Alpine APE RP/RASS/SFC 32.86 116.81 463 Azusa AZU sodar/SFC 34.16 117.91 232 Barstow BTW RP/RASS/SFC 34.92 117.31 694 Brown Field BFD RP/RASS/SFC 32.57 116.99 158 Carlsbad CBD RP/RASS/SFC 33.14 117.27 110 Central Los Angeles USC RP/RASS/SFC 34.02 118.28 67 El Centro ECP RP/RASS 32.83 115.57 -18 El Monte EMT RP/RASS/SFC 34.09 118.03 95 Goleta GLA RP/RASS/SFC 34.43 119.85 4 Hesperia HPA RP/RASS/SFC 34.39 117.4 975 Los Alamitos LAS RP/RASS/sodar 33.79 118.05 7 Los Angeles Int. LAX RP/RASS 33.94 118.44 47 Norton NTN RP/RASS/SFC 34.09 117.26 318 Ontario ONT RP/RASS/SFC 34.06 117.58 280 Palmdale PDE RP/RASS/SFC 34.61 118.09 777 Point Loma PLM RP/RASS 32.7 117.25 23 Port Hueneme PHE RP/RASS/SFC 34.17 119.22 2 Riverside RSD RP/RASS/SFC 33.92 117.31 488 San Clemente Island SCE RP/RASS/SFC 33.02 118.59 53 Santa Catalina Island SCL RP/RASS/SFC 33.45 118.48 37 Santa Clarita SCA sodar/SFC 34.43 118.54 354 Simi Valley SMI RP/RASS 34.29 118.8 279 Temecula TCL RP/RASS/SFC 33.5 117.16 335 Thermal TML RP/RASS/SFC 33.64 116.16 -36 Tustin TTN RP/RASS 33.71 117.84 16 Valley Center VLC RP/RASS 33.26 117.04 415 Van Nuys VNS RP/RASS/SFC 34.22 118.49 241 Vandenberg AFB VAF RP/RASS 34.77 120.53 149 Warner Springs WSP sodar 33.32 116.68 905
2-3
27
28
29
27 Azusa28 Santa Clarita
30 Twenty Nine Palms – EAF131 Twenty Nine Palms – EAF232 Warner Springs
29 Twenty Nine Palms - Turtle
32
31 3027
28
29
27 Azusa28 Santa Clarita
30 Twenty Nine Palms – EAF131 Twenty Nine Palms – EAF232 Warner Springs
29 Twenty Nine Palms - Turtle
32
31 30
Figure 2-1. SCOS97 field study RP/RASS and sodar sites.

2-4
RP/RASS consists of either a single phased-array antenna or three non-phased antennas. In the phased-array design, the radar beam is electronically pulsed vertically, 23° from the vertical, in any of four orthogonal directions. The three non-phased antennas are physically inclined and orientated to produce one vertical and two oblique 23o beams. Both the phased-array and non-phased systems include electronic subsystems that control the RP/RASS’ transmission, reception, and signal processing functions.
For wind measurements the RP/RASS transmits an electromagnetic pulse along each of the beam directions, one at a time. The duration of the transmission determines the length of the pulse emitted by the antenna, which, in turn, corresponds to the volume of air illuminated (in electrical terms) by the radar beam. These radio signals are then scattered by small-scale turbulent fluctuations that induce irregularities in the radio refractive index of the atmosphere. A receiver measures the small amounts of the transmitted energy that are scattered back toward the RP/RASS (referred to as “backscattering”). These backscattered signals are received at a slightly different frequency than the transmitted signal. This difference is called the Doppler frequency shift and is directly related to the velocity of the air moving toward or away from the RP/RASS along the pointing direction of the beam. The radial velocity measured by the tilted beams is the vector sum of the horizontal motion of the air toward or away from the RP/RASS and any vertical motion present in the beam. Using appropriate trigonometry, the three-dimensional meteorological velocity components (u,v,w) and wind speed and wind direction are calculated from the radial velocities with correction for vertical motions.
The Tv measurement components consist of four vertically pointing acoustic sources (which are equivalent to high-quality loudspeakers) placed around the radar antenna and an electronics subsystem consisting of an acoustic power amplifier and signal-generating circuit boards. The acoustic sources are enclosed by noise-suppression shields to minimize nuisance effects that might bother nearby neighbors or others working near the instrument. Each acoustic source transmits approximately 75 watts of power and produces acoustic signals in approximately the 2020- to 2100-Hz range.
The principle of RASS operation is that when the wavelength of the acoustic signal matches the half wavelength of the radar (called the Bragg match), enhanced scattering of the radar signal occurs. During RASS operation, acoustic energy transmitted into the vertical beam of the radar produces the Bragg match and allows the RP/RASS to measure the speed of the acoustic signals. By knowing the speed of sound as a function of altitude, Tv profiles can be calculated.
RP/RASS, like all radar, is sensitive to reflections from other targets and to electromagnetic radiation from sources other than the atmosphere. These interferences may produce spurious signals in the spectra data, which can introduce errors in the reported winds and temperatures or even meaningless measurements that have no meteorological significance. For instance, aircraft, birds, insects, or any flying objects may generate spurious radar echoes that can be mistaken for an atmospheric return. Migrating birds are a well-documented source of wind measurement errors (that were observed in the SCOS97 data set). Other sources of radar signal contamination include

2-5
atmospheric noise from lightning, instrument electronic noise, and radio frequency interference from man-made sources (e.g., cellular phones). Ground clutter from buildings, trees, power lines, and automobiles can obscure atmospheric signals. Even atmospheric returns from clouds and precipitation entering the radar antenna sidelobes can mask weaker clear-air returns in the main antenna beam.
2.1.2 Sodar Background
The sodar uses an observational process that is similar to the RP except that the sodar uses pulses of sound instead of electromagnetic energy. The sodar then detects the returned acoustic energy scattered from turbulent density fluctuations (instead of index of refraction fluctuations). It provides hourly averaged wind speed and direction up to 500 to 600 m maximum range with a lowest sampling height of approximately 50 to 60 m, and a vertical resolution of about 30 m. The sodar is sensitive to extraneous sources of sound; for example, it was found that noise from an air conditioner at the Los Alamitos site occasionally contaminated the data collected by the vertical beam.
2.2 RP/RASS DATA PROCESSING PROCEDURES
All raw data collected by RP/RASS are submitted for post-processing/objective QC that is applied at several levels. The post-processing/objective QC of RP/RASS moments data involves signal processing methods and QC techniques. The QC identifies and rejects noise and spurious radar measurements prior to the derivation of meteorological products (e.g., hourly averaged winds and Tv). The radial Doppler velocity measurements are then tested for temporal and spatial consistency in an objective analysis in order to eliminate contamination from ground clutter, radio frequency interference, echoes from migrating birds, etc. Three post-processing and objective QC methods—the “traditional method”, Met_0, and Met_1—were applied to the SCOS97 RP/RASS data. The important differences among the methods and the positive and negative aspects of each method are summarized in Table 2-3 and presented below.
2.2.1 Traditional Method
The traditional method for processing and applying QC to the RP/RASS wind and Tv data is carried out in three steps as follows:
• Step 1: The RP/RASS automatically calculates high-resolution mo ments data from the spectral data for both the wind and Tv sampling. For the wind measurements, these high-resolution moments data consist of 1- to 2-minute averages of the radial wind velocity and direction (away from or toward the antenna) for each of the oblique and the vertical beams. For the Tv data, the high-resolution moments data consist of averages of the vertical wind velocity and direction (measured during the Tv measurement phase) and the speed of sound measurements.

2-6
Table 2-3. Summary of RP/RASS data processing methods.
Is There a Vertical Velocity Correction? Method
Time-Height Consistency
Check RASS RP
Samples Needed to
Create Hourly Average
Positive Aspects Negative Aspects
Traditional On hourly averaged data
Yes and No: Two data sets are produced. For one data set the correction is applied to the hourly average data
Yes: Applied to the hourly averaged data
50% or more Demonstrated performance
Produces fewer suspect or invalid data points
May not perform well under atmospheric transitions or under convective conditions.
“Hourly” average may not be representative of entire hour
Met_0
On sub-hourly moments data and on hourly averaged data
No Yes: Applied to the hourly averaged data
At least one sample
May produce more accurate temperatures when air is dry, which causes vertical winds to be erroneous
One 5-minute data point can produce an hourly average value.
May not perform well under flow transitions or under convective conditions when vertical velocities are rapidly changing
Met_1
On sub-hourly moments data and on hourly averaged data
Yes: Applied to the sub-hourly moments data
Yes: Applied to the sub-hourly moments data
At least one sample
Performs best under flow transitions or convective conditions when vertical velocities are rapidly changing
One 5 minute data point can produce an hourly average value
2-7
• Step 2: At the end of each hour, the moments data from each beam-power combination are saved, and these values are examined and compared at the end of the averaging period to determine the consensus-averaged radial velocities. Consensus averaging consists of determining whether a certain percentage (e.g., 60%) of the values fall within a certain range of each other (e.g., 2 m/s). If they do, the average of those values is used to produce the velocity estimate. The radial velocity is then corrected for vertical wind speed and combined vectorally to produce the wind speed and direction. If the percentage of moments data falls below the predetermined consensus percentage, the program reports the data point as “missing”.
• Step 3: Wind data are then subjected to a Weber-Wuertz QC continuity algorithm (Wuertz and Weber, 1989) that identifies and edits those measurements that do not fall within a continuously connected pattern. This algorithm is based on the premise that the valid data should have spatial and temporal continuity with the adjacent data points.
2.2.2 Met_0 and Met_1 Processing Methods
Two RP/RASS processing methods (Met_0 and Met_1), operating on two different time scales, are used to ensure more reliable meteorological products. The two steps for objective processing and QC are as follows:
• Step 1 operates on the moments data created from the spectral data that is sampled every few minutes. In each method, processing and QC are applied independently to the moments data during each hour throughout the experiment, and noise and spurious signals in the moments data are rejected. The remaining estimates within each hour are averaged to produce hourly-averaged moments data.
• Step 2 operates on hourly-averaged moments data. QC is applied independently to the hourly-averaged moments data, and noise and spurious signals that were not detected in the first step are rejected. The remaining data are then used to derive the hourly meteorological products (i.e., winds and Tv).
The following section describes how the Met_0 and Met_1 data processing scenarios compare to the traditional data processing method that produces consensus- averaged wind and Tv data.
2.2.3 Met_0 Data Processing and QC Procedures as Compared with the Traditional Data Processing and QC Procedures
In the Met_0 procedure the continuity QC algorithm is applied to the moments data at the beginning of the procedure instead of at the end, as is the case in the traditional procedure (see Section 2.2.1, Step 3), during the derivation of the hourly wind and Tv profiles. This continuity QC algorithm takes the place of the consensus algorithm. However, it tests for consistency over both time and space whereas the consensus

2-8
algorithm only tests for consistency over time. The resulting data points that meet the continuity QC algorithm criteria are then combined using arithmetic averages to produce the hourly averaged wind and Tv moments data. The arithmetic average is used in place of the application of a consensus (in the traditional procedure) to derive the hourly wind data. The hourly averaged wind data are corrected for vertical velocity and then combined vectorally into hourly wind and Tv profiles. Note that the Tv data are not corrected for vertical velocity.
The application of the continuity algorithm in Met_0 processing rejects noise and tests both temporal and spatial consistency before and after the moments data are averaged. After the hourly averaging is performed, the hourly-averaged radial velocities are tested for temporal and spatial consistency over each daily (24-hour) period. Those hourly averaged radial velocity data lacking the required consistency are not included in the derivation of meteorological wind estimates.
For Tv data processing, the most important aspect of Met_0 processing is that the Tv data derived from the RASS moments are not corrected for any clear-air vertical wind component. When the vertical wind component is small (which is usually the case), ground clutter near zero Doppler velocity may introduce biases in the estimates of that vertical wind component. Hence, it is common practice to avoid correcting the Tv estimates, accepting errors on the order of a degree or more, rather than introducing unknown biases of the same order of magnitude.
It should be noted that the minimum number of data points resulting from the QC algorithm test is not limited, thereby allowing the hourly moments average calculations to be based on as few as one data point. This can produce widely varying results that should be carefully checked during the subjective review process.
It should also be noted that both traditional consensus processing and Met_0 processing do not require measurements which are made on different radar antenna beams to be made at the same time over the averaging period. This measurement difference contrasts with Met_1 processing.
2.2.4 Met_1 Data Processing and QC Procedures
In the Met_1 data processing and QC procedure, vertical velocity corrections and the continuity QC algorithm are applied to both the wind and Tv moments data. This application differs from the Met_0 procedure and the traditional consensus processing that apply the vertical velocity correction to the wind data only during the derivation of the resulting hourly wind profiles. As with Met_0 processing, the continuity QC algorithm is applied in place of the consensus method in calculating the moments data. The resulting data points that meet the continuity QC algorithm criteria are then combined using arithmetic averages to produce hourly averaged wind and Tv moments data. Again, the arithmetic average is used in place of the application of a consensus (in the traditional procedure) to derive the resulting hourly moments values. Finally, the
2-9
hourly averaged wind and Tv moments data are combined vectorally into hourly wind and Tv profiles.
In the Met_1 processing scenario, the radial velocities on each of the oblique antenna beams are corrected for vertical velocity by using the radial velocity measurement from the vertically directed antenna beam before testing for temporal and spatial consistency prior to calculation of the hourly averages. The temporal and spatial consistencies are tested for each hour independently, and any data not meeting the consistency requirement are not included in the hourly averages. Noise is rejected before averaging while outliers with unrealistic spectral widths and signal strengths are rejected after averaging. Temporal and spatial consistencies are tested over each hour before hourly averaging and over a full day after hourly averaging.
Significant vertical motion can introduce large errors in the temperatures if not corrected. Hence, in Met_1 processing, the RASS acoustic velocities are corrected for clear-air vertical motion before hourly averaging. Note that in cases when precipitation is present, the fall velocity of precipitation may be mistaken for the clear-air vertical wind component. Then, the temperatures reported in this scenario may contain large errors. This is the most significant potential problem with Met_1 RASS processing. (During Level 1.0 data validation, the reviewers flag data when this situation occurs.)
As in the Met_0 procedure, it should be noted that the minimum number of data points resulting from the QC algorithm test is not limited, thereby allowing the hourly moments average calculations to be based on as few as one data point. This can produce widely varying results that should be carefully checked during the subjective review process. On the other hand, both the traditional consensus and Met_0 processing may also produce widely varying results in the presence of small-scale (spatial and temporal) variability (e.g., during convection) when observations on different antenna beams are not made simultaneously. This perhaps explains why Met_1 processing generally produces more reliable results. Nevertheless, further processing is required in order to bring the data to Level 1.0 and Level 2.0 validation.
2.2.5 Summary
Since a vertical velocity correction is not applied to the Met_0 Tv data (while it is applied to the Met_1 Tv processing), Met_1 processing should provide more accurate data but with less altitude coverage. The rationale for this assumption is that, since the Met_1 procedure uses sub-hourly vertical velocity to calculate the winds and Tv data, the Met_1 data set should provide more accurate data under transitional periods, such as land/sea-breeze flows; in contrast, the Met_0 data should provide more accurate wind data under steady-state conditions when average vertical velocity data is used in the wind calculations. Analyses discussed in this report show that the Met_1 data compare better to the rawinsonde data at both coastal and inland sites and provide similar altitude coverage; therefore, the Met_1 data set was selected as the base data set to begin the data processing and validation to produce one final data set.

3-1
3. DATA PROCESSING AND QUALITY CONTROL
3.1 RADAR PROFILER AND RASS
At the beginning of this reprocessing and data validation project, the data were not ready for analysts and modelers to use. Offsets and errors identified during the audit process had not been fully incorporated into the data set. All data sets received only automatic objective QC which cannot remove all problems; thus, much of the judgment of the data quality was left to individual users. The data had been processed using two different algorithms, as discussed in Section 2, and no decision had been made as to which algorithm produced the best data for each site. The Met_0 and Met_1 wind data sets each contained separate high altitude (low resolution) and low altitude (high resolution) data, resulting in a total of four wind data sets for each site. Procedures used to address and correct these issues are discussed in this section.
3.1.1 Correction of Physical Instrument and Setup Configuration Problems
All available audit data and site notes were reviewed to determine whether identified offsets in antenna alignment, inclination angles, and time zones had been applied to the data set. If the offsets had not been applied to the data, the data were immediately updated to include these offsets, followed by a recalculation of winds and Tv.
Corrections of directional errors were made only if the errors were greater than or equal to 5° (Table 3-1). Changes to data collected by phased-array type RP/RASS were based on a total data rotation rather than individual antenna alignment, as was the case for the non-phased array systems. For sites that had offsets with respect to individual direction antennas, the recalculation of the directions was not performed, but the data were corrected for the average rotational error.
Table 3-1. Sites with offsets greater than or equal to 5o and action taken.
Site Name Audit Date Set Up Orientations (Degrees True)
Audit Determined Orientation (Degrees True)
Action
Hesperia 6/2/97 247 242 Reprocessed data prior to audit
Palmdale 7/1/97 359, 89 4, 90 Reprocessed all data because change not made following audit
Central Los Angeles 7/2/97 117 136
Reprocessed data prior to audit
Van Nuys 7/10/97 28, 128 29, 134 Reprocessed all data because non-orthogonal configuration
El Monte 7/29/97 350 345 Reprocessed data prior to audit
Point Loma 7/18/97 33 26 Reprocessed all data because incorrect entry in RP/RASS setup menu

3-2
3.1.2 Merging of Low- and High-Mode Data and Data Reformatting
The RP/RASS low- and high-mode wind data were merged to produce a single data set. The number of low-mode range gates that were merged into each wind profile was determined to be six range gates below the low-mode maximum altitude. Experience suggests that data in the upper-most six low-mode range gates are often erroneous. Where the two modes overlapped, the higher-resolution low mode was used unless the data for that mode was missing or invalid. The merging of the modes reduced the RP/RASS wind data sets from four sets to two.
The merged RP/RASS wind and Tv data sets were converted to STI Common Data Format (STICDF). The surface meteorological data collected at the RP/RASS sites were reformatted and merged with the corresponding RP wind and RASS Tv data when surface data were available. The reformatting included correcting the time standards, and converting the surface temperature data to Tv.
3.1.3 Objective Data Processing and Validation
To determine which data set (Met_0 or Met_1) best represented the actual meteorological conditions, validated rawinsonde data sets collected at sites closest to the RP/RASS measurement locations were used in the comparisons. To perform this analysis the RP/RASS sites were grouped into three regions: coastal/offshore, inland, and desert (Table 3-2). Coastal sites included locations within a few miles of the coast. Inland sites extended to and included Norton and Riverside, and the balance of sites was considered part of the desert group. Additionally, the original hourly consensus data available for some desert sites were used in the analysis to aid in the evaluation. These sites included Barstow, Hesperia, and Palmdale.
Table 3-2. Geographic classification of the RP/RASS sites.
Coastal/offshore Inland Desert Carlsbad Alpine Barstow Catalina Island Brown Field El Centro Goleta Central LA Hesperia Los Angeles Int. Airport El Monte Palmdale Los Alamitos Norton Thermal Point Loma Ontario Port Hueneme Riverside San Clemente Island Simi Valley Vandenberg AFB Temecula Tustin Valley Center Van Nuys

3-3
The Port Hueneme site was selected for the initial analysis due to its proximity to a number of military rawinsonde launch sites. Less detailed evaluations were then performed in the other geographic regions to confirm or change the decision as to which algorithm (Met_0 or Met_1) to use. Key criteria used in deciding which algorithm performed the best included the systematic and root mean square differences between the various data sets and the rawinsonde data, and the total number of valid data points provided by each method. A summary of the most relevant comparisons is provided in Appendix A.
Following all evaluations, it was decided that the Met_1 processing technique provided the most robust data set with the smallest differences when compared to the rawinsonde values for both winds and temperature in each geographic region. Subsequent processing and validation were then performed using only the Met_1 data for each site.
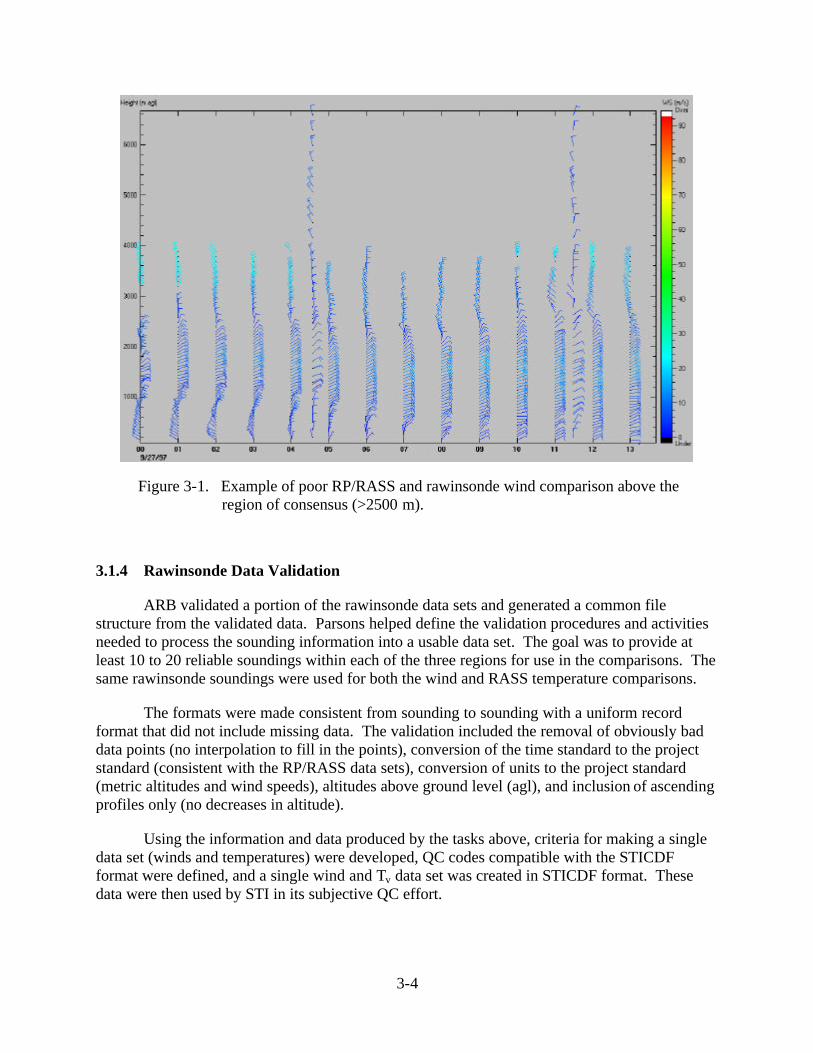
Once the Met_1 data set was decided on, additional analyses were performed using data from the Palmdale site and rawinsonde data from Edwards Air Force Base. The analyses evaluated how well the Met_1-processed data compared to the rawinsonde data in the region above the altitude where the consensus-calculated data ended (Region of Consensus [ROC]). Essentially, the quality of the additional data recovered using the Met_1 algorithm was evaluated. The results of this evaluation showed that within the ROC where there were data, the agreement between the rawinsonde and Met_1 data was quite good. However, above the ROC the agreement between the rawinsonde and Met_1 data sets degraded. In some cases the wind speeds appeared to have been overestimated by as much as a factor of 4. Figure 3-1 illustrates the first and second comparison periods performed on September 27, showing the rawinsonde-to-Met_1 comparisons. The reason for the observed differences is unclear, but at least half of the 11 soundings compared had wind speeds of more than two to three times the rawinsonde speeds above the ROC (above 2500 m). Also of interest is the rapid increase in the speeds above the ROC.
On the basis of the comparisons performed, it appeared that the use of Met_1 data for the Palmdale site, when there were no consensus data available, may have lead to erroneous wind estimations, especially in the magnitude of the wind speed. Because of these observed differences, it was decided to flag the data above the ROC as suspect to reflect the reduced confidence in the calculated Met_1 wind values. A discussion of the QC flags is presented in Section 3.2.
3-4
Figure 3-1. Example of poor RP/RASS and rawinsonde wind comparison above the region of consensus (>2500 m).
3.1.4 Rawinsonde Data Validation
ARB validated a portion of the rawinsonde data sets and generated a common file structure from the validated data. Parsons helped define the validation procedures and activities needed to process the sounding information into a usable data set. The goal was to provide at least 10 to 20 reliable soundings within each of the three regions for use in the comparisons. The same rawinsonde soundings were used for both the wind and RASS temperature comparisons.
The formats were made consistent from sounding to sounding with a uniform record format that did not include missing data. The validation included the removal of obviously bad data points (no interpolation to fill in the points), conversion of the time standard to the project standard (consistent with the RP/RASS data sets), conversion of units to the project standard (metric altitudes and wind speeds), altitudes above ground level (agl), and inclusion of ascending profiles only (no decreases in altitude).
Using the information and data produced by the tasks above, criteria for making a single data set (winds and temperatures) were developed, QC codes compatible with the STICDF format were defined, and a single wind and Tv data set was created in STICDF format. These data were then used by STI in its subjective QC effort.
3-5
3.2 SUBJECTIVE DATA PROCESSING AND QUALITY CONTROL PROCEDURES
A variety of QC flags were determined to better define the pedigree of the information from the RP/RASS Met_0 and Met_1 and the results of objective time-height consistency checks, signal-to-noise ratios, and subjective review efforts. The QC codes are defined in Table 3-3, in addition to the criteria for flagging and recommendations for using the data with the flags.
Table 3-3. QC Flags.
QC Flag
Meaning Criteria Notes Recommendation for use of data
0 Valid Passed all subjective and objective QC.
Can be used with high confidence at Level 1.0 and Level 2.0 validation*.
5 Suspect
Passed initial QC processing. Collected above 2000 m agl. Collocated consensus data was invalid. Passed signal-to-noise criteria. Passed all subjective QC.
Data below 2000 m agl was not addressed by this code because consensus might fail due to significant sub-hourly wind shifts often observed within the boundary layer.
Can be used with moderate confidence at Level 1.0 validation* and higher confidence at Level 2.0 validation*.
6 Suspect
Passed initial QC processing. Collocated consensus data invalid. Failed signal-to-noise criteria. Passed all subjective QC.
Can be used with moderate confidence at Level 1.0 validation* and higher confidence at Level 2.0 validation*.
7 Suspect
Passed all objective QC. Not clearly invalid or valid based on subjective QC or data appears valid but with unresolved processing issues.
Can be used with moderate confidence at Level 1.0 validation* and higher confidence at Level 2.0 validation*.
8 Invalid Failed either objective or subjective QC.
Data values are –980.0. Do not use.
9 Missing Data values are –999.0. Do not use.
*Level 1.0 and Level 2.0 are described below
STI validated all RP/RASS wind and Tv data to Level 1.0. This validation step was a subjective manual review of the internal consistency and reasonableness of the RP/RASS data values for each individual site for each hour. Table 3-4 lists the QC codes and how the codes may have been changed based on the subjective findings. For example, valid or suspect data was invalidated if the reviewer decided that the data failed gross reasonableness and consistency checks or, conversely, suspect data (QC code 7 only) was validated if the reviewer felt that the data met the reasonableness and consistency checks. Under no circumstances were data with QC

3-6
codes of 5 or 6 changed to a QC code of 0 (valid) because these codes were assigned based on consensus statistics. All changes made to the data were recorded to log files which accompanied the data.
Table 3-4. Possible data validity code changes.
Existing QC
Existing QC Meaning Subjective Findings New QC New QC
Meaning New Data
value 0,5,6,or 7 Valid, suspect,
suspect, suspect Invalid - point fails reasonableness and consistency checks
8 Invalid -999
0 Valid Suspect, but not invalid 7 Suspect No change
7 Suspect based on objective time height consistency
Valid 0 Valid No change
5 or 6 Suspect, Suspect Appears valid, but remains suspect based on data processing information
No change Suspect No change
8 or 9 Invalid or missing No data are available No change Invalid No change
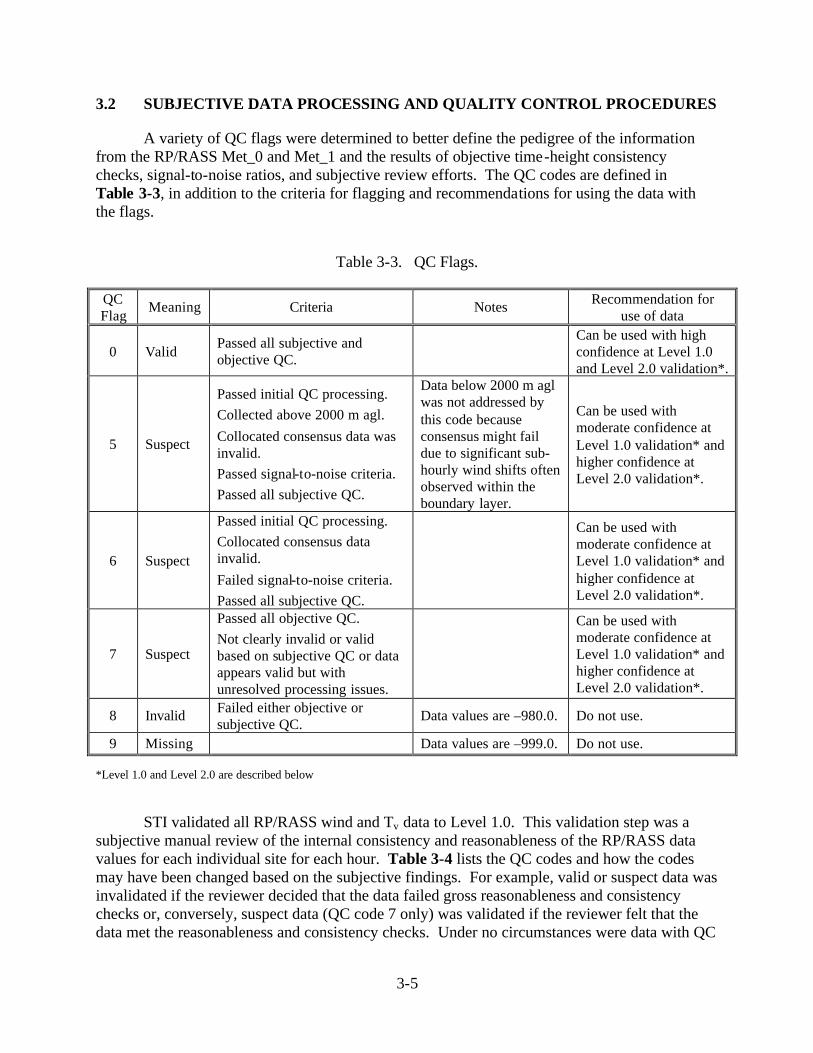
An example of pre-Level 1.0 RP/RASS wind data at the Barstow site is shown in Figure 3-2. The Tv data are shown in Figure 3-3 for the Point Loma site. The winds in Figure 3-2 exhibit rapid shifts in direction above 1400 m and are highly irregular in speed, characteristics that were closely examined during the Level 1.0 validation check. Much of the Tv data from 400 m and up at the Point Loma site (Figure 3-3) were initially flagged as highly suspect during the NOAA-ETL reprocessing in 2001 and were then invalidated during the Level 1.0 reviews. In addition, some of the data that were flagged as valid were subsequently found to be invalid.
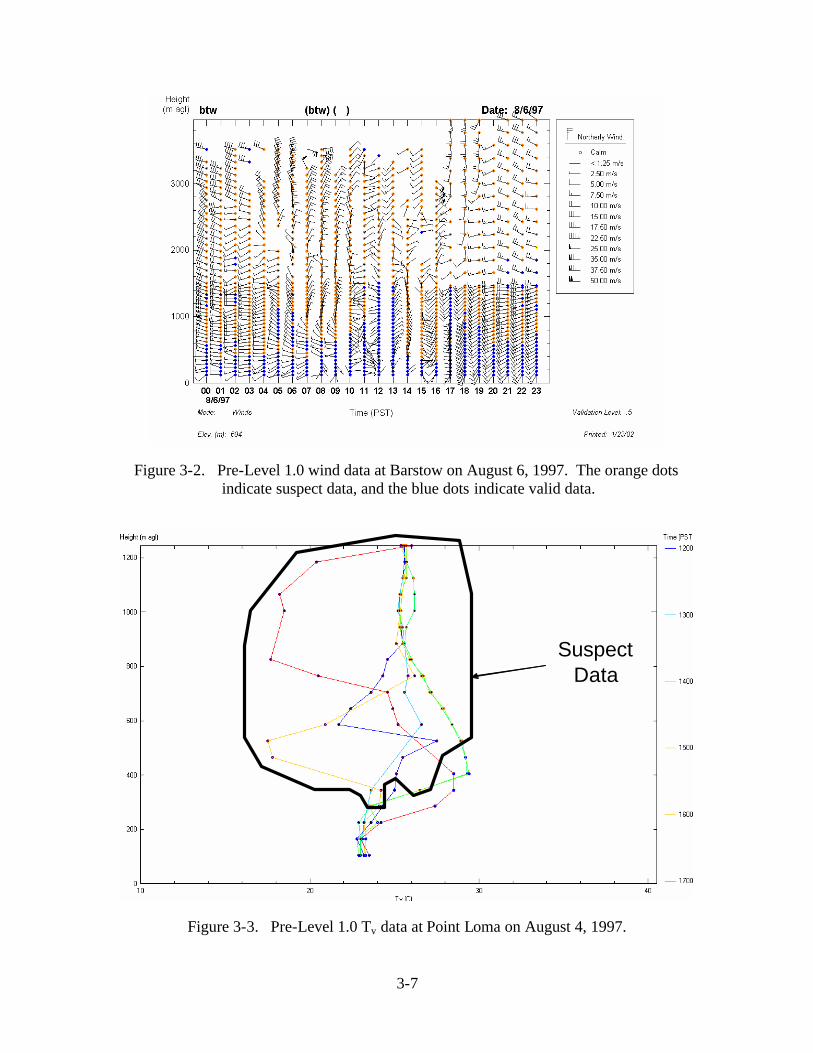
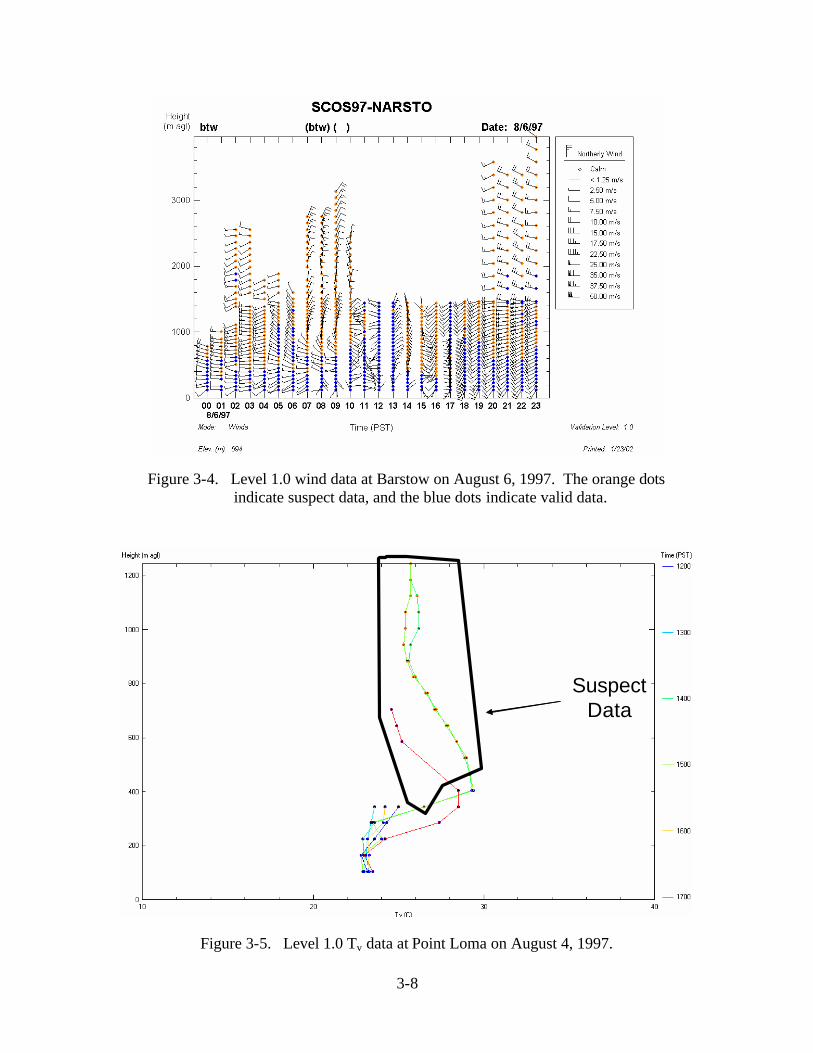
Figures 3-4 and 3-5 illustrate the same data sets as Figures 3-2 and 3-3, respectively—after Level 1.0 validation was applied. Data with rapid wind shifts and highly irregular wind speeds were removed during Level 1.0 validation at Barstow, and the majority of the suspect Tv data at Point Loma were removed above 400 m. Much of the variability in the Tv data was caused by radio frequency interference.
3-7
Figure 3-2. Pre-Level 1.0 wind data at Barstow on August 6, 1997. The orange dots indicate suspect data, and the blue dots indicate valid data.
SuspectData
SuspectData
Figure 3-3. Pre-Level 1.0 Tv data at Point Loma on August 4, 1997.
3-8
Figure 3-4. Level 1.0 wind data at Barstow on August 6, 1997. The orange dots indicate suspect data, and the blue dots indicate valid data.
SuspectData
SuspectData
Figure 3-5. Level 1.0 Tv data at Point Loma on August 4, 1997.

3-9
The Level 2.0 validation is a subjective review of data from each site compared to corresponding data collected at nearby sites. The reviewer examined the results from the Level 1.0 validation screening, either accepting or changing the results. The wind and Tv data at each site were manually reviewed and compared to other nearby sites for each day within each region, according to the geographic site groupings shown in Table 3-2. The meteorologists evaluated the wind data for meteorological reasonableness and external consistency. Additionally, other data, such as EDAS (Eta Data Assimilation System) data, NWS upper-air charts, and rawinsonde data (when available in STICDF format), were also used in the external consistency checks.
EDAS model plots of wind speed and direction were created at 950 mb, 800 mb, and 700 mb and used to evaluate the spatial consistency of the winds at equivalent levels in the RP/RASS wind data. In general, the criteria for agreement were considered to be ± 20° for wind direction and ±5 m/s for wind speed. NWS upper-air charts were used to perform checks that evaluated the spatial consistency of the upper-level winds based on geopotential height gradients depicted on 700-mb and 850-mb charts.
Level 2.0 validation was performed for 35 selected episode (ozone and PM) days only. A listing of these days is shown in Table 3-5:
Table 3-5. Episode days for which Level 2.0 validation of the RP/RASS wind and Tv data were performed.
Dates Episode Type Number of Days 8/2 to 8/8 Ozone 7
8/26 to 8/28 Aerosol 3 9/2 to 9/7
(9/4/ to 9/6) Ozone (Aerosol) 6 (3)
9/9 to 9/13 Aerosol 5 9/26 to 9/30 (9/27 to 9/28) Ozone (Aerosol) 5 (3)
10/2 to 10/5 Ozone 4 10/29 to 11/2 Ozone 5 Total Days 35
Figure 3-4 and Figures 3-6, 3-7, and 3-8 illustrate an example of Level 2.0 validation at the Barstow and Hesperia sites. Figure 3-4 depicts the Level 1.0 validated wind plot for on August 6 at Barstow. Figure 3-6 depicts the Level 1.0 validated wind plot at Hesperia on August 6. Figure 3-7 depicts the 800-mb EDAS plot for the same day at 2200 PST. Figure 3-8 depicts the final Level 2.0 validated wind plot at Barstow on August 6. The rationale for the data changes associated with Level 2.0 QC is as follows:
• At 2200 PST EDAS model winds around 2000 m agl (about 800 mb) in the Hesperia and Barstow areas were out of the west-northwest at about 10 to 12 knots (Figure 3-7).
• At 2200 PST RP/RASS winds at Hesperia around 2000 m agl (about 800 mb) were out of the northwest at around 5 m/s (about 10 knots) (Figure 3-6), which are in reasonable agreement with the model winds.

3-10
• Much of the Level 1.0 validated RP/RASS wind data at Barstow above 500 m agl are flagged as suspect based on the objective QC (Figure 3-4).
• RP/RASS winds at Barstow at 2200 PST and 2000 m agl were out of the west-northwest at about 12.5 m/s (about 25 knots). The wind speeds are more than double the wind speed of the model (Figure 3-7) and RP/RASS wind speeds at Hesperia (Figure 3-6).
• Data from other altitudes, sources, and times were compared in a ma nner similar to the above discussion, and similar inconsistencies with the Barstow data were found. Therefore, given that the Barstow data were already suspect, much of the Level 1.0 suspect data at Barstow on this day were changed to invalid during Level 2.0 validation. Figure 3-8 shows the Level 2.0 validated winds at Barstow with the originally suspect, now invalid data removed.
Figure 3-6. Level 1.0 validated wind data at Hesperia on August 6, 1997. The orange dots
indicate suspect data, and the blue dots indicate valid data.

3-11
Figure 3-7. EDAS model wind data on August 6, 1997 at 0600 UTC (2200 PST) at 800 mb.
Figure 3-8. Level 2.0 wind data at Barstow on August 6, 1997. The orange dots
indicate suspect data, and the blue dots indicate valid data.
Area of focus

3-12
3.3 SODAR
A total of six sodars were deployed as part of the monitoring network. Three of the systems were three-component 1600-Hz systems manufactured and operated by AeroVironment, Inc. (AV). These units were located at Warner Springs and three locations at the Marine Air Ground Combat Center in 29 Palms. The data were processed by AV and submitted to the project validated to Level 1.0. Data from the Warner Springs site were subsequently post-processed by NOAA-ETL to include a vertical velocity correction. This was recommended during the audits due to the relatively steep zenith angle of the oblique antennas. Data were also collected and processed by NOAA-ETL from a Radian 600PA phased-array sodar at the Los Alamitos site. This instrument was built into the RP/RASS unit. The Azusa and Santa Clarita sodars were two-component units built by NOAA-ETL.
Sodar data status differed from the RP/RASS data in that no data post-processing was performed. As with the RP/RASS data, all available audit data and site notes were reviewed to determine whether identified offsets in antenna alignment, inclination angles, and time zones had been applied to the data set. If they had not been applied, the data sets were updated to include these offsets and were then reprocessed based on the revised geometry. All recalculations in the data set were performed by NOAA-ETL. Specific details and notes describing the operation of the sodars and issues and occurrences that may have affected the quality of the data are identified in Section 5.
3.3.1 Data Review
Warner Springs and 29 Palms sites
Parsons reviewed the AV sodar data collected at the Warner Springs site and the three 29 Palms sites. These data already met the criteria for Level 1.0 validation since AV had subjected the data to an automatic screening program and manual review; however, the data were quality-controlled as part of this project to ensure validity.
During the measurement program, a performance and system audit was performed at the Warner Springs site but not at the 29 Palms sites. A check of the 29 Palms sites data quality was necessary to ensure that the quality of the data collected at these sites were reasonable with respect to the program data quality objectives. To this end comparisons were performed between the 29 Palms sites under reasonably homogeneous conditions. A review of the Warner Springs data was also performed to identify questionable data.
Los Alamitos site
Data from the Los Alamitos sodar were reviewed to determine the extent of the noise contamination in the data. Recommendations were made with regard to processing the data to minimize the contamination problem: screening for vertical velocities greater than a given value with appropriate action taken; reprocessing of the data to remove any vertical velocity correction; and manually invalidating selected time periods that were identified as contaminated.

3-13
Following this review, Parsons contacted and worked with NOAA-ETL to ensure that the recommendations could be implemented in an efficient manner.
Azusa and Santa Clarita sites
Parsons reviewed the data from the Azusa and Santa Clarita sites and made recommendations for processing the data. The Santa Clarita site required less effort because no special circumstances were identified during the audit. The Azusa site, on the other hand, required that time periods and altitudes that were affected by reflections in the canyon where it was operated be identified. The time of the software change that corrected the resultant vector calculation at each site was identified and recommendations were made to NOAA-ETL about correcting the prior data. The data review included comparisons to the 10-m surface meteorological data that was collected from each site.
3.3.2 Level 0.5 Validation
NOAA-ETL validated the Los Alamitos, Azusa, and Santa Clarita data to Level 0.5 (objective QC) using the Weber/Wuertz QC processing algorithm (Wuertz and Weber, 1989) and converted the data to STICDF format, including the QC codes. The finished product consisted of hourly winds calculated from the 15-minute initial data.
3.3.3 Level 1.0 Validation
The sodar wind data sets were validated to Level 1.0. A meteorologist manually reviewed each site/day for outliers and evaluated the wind for meteorological reasonableness and internal consistency. The meteorologist reviewed the results from NOAA-ETL’s automated QC screening, either accepting or changing the results. Table 3-6 shows changes to data QC codes based on subjective review findings.
Table 3-6. QC Codes.
Existing QC Existing QC Meaning Subjective Findings New QC New QC
Meaning New Data
value
0 or 7 Valid or suspect Invalid - point fails gross reasonableness and consistency checks
8 Invalid -999
0 Valid Suspect, but not invalid 7 Suspect No change
7 Suspect based on objective time height consistency
Valid 0 Valid No change
8 or 9 Invalid or missing No data are available No change Invalid No change
3-14
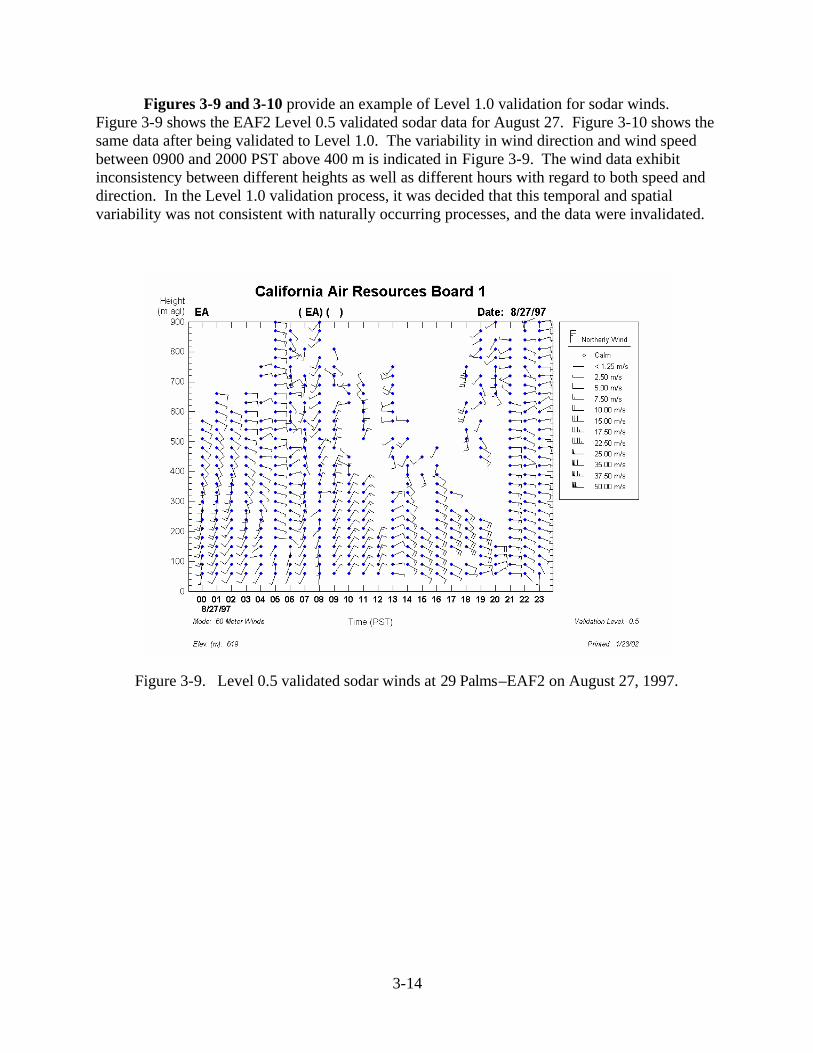
Figures 3-9 and 3-10 provide an example of Level 1.0 validation for sodar winds. Figure 3-9 shows the EAF2 Level 0.5 validated sodar data for August 27. Figure 3-10 shows the same data after being validated to Level 1.0. The variability in wind direction and wind speed between 0900 and 2000 PST above 400 m is indicated in Figure 3-9. The wind data exhibit inconsistency between different heights as well as different hours with regard to both speed and direction. In the Level 1.0 validation process, it was decided that this temporal and spatial variability was not consistent with naturally occurring processes, and the data were invalidated.
Figure 3-9. Level 0.5 validated sodar winds at 29 Palms–EAF2 on August 27, 1997.

3-15
Figure 3-10. Level 1.0 validated sodar winds at 29 Palms–EAF2 on August 27, 1997.
3.3.4 Level 2.0 Validation
The Level 1.0 validated CDF sodar wind data sets from all six sites were validated to Level 2.0 for the selected days shown in Table 3-5. A meteorologist manually reviewed each site/day for outliers and evaluated the wind for meteorological reasonableness and external consistency. External comparisons were made by comparing the data to RP and rawinsonde wind data collected at nearby sites and NWS surface map wind data.
3.3.5 Final Review of Sodar Level 2.0 Data
Following the Level 2.0 validation of all sodar data by STI, the data set was given a final review by Parsons. Data descriptors that describe the quality of the data, similar to that prepared for the RP/RASS sites, were prepared for each of the sodar sites.
3.4 SURFACE WINDS
The surface wind measurements made at each RP/RASS site were not subjected to the same NOAA-ETL data validation routines that were used to process the RP/RASS data. The surface wind data were merged into the corresponding RP/RASS wind data sets, and the merged surface wind data have been subjectively quality-controlled.

4-1
4. DATA FILE STRUCTURE
One CD containing all of the quality-controlled surface and upper-air meteorological data was delivered in February 2002 along with the draft report. The CD contains data in common data format (CDF) and includes upper-air wind, Tv, and merged surface meteorological data. The upper-air wind and Tv data are stored in space-delimited ASCII text files. Each file contains 24 hours of site data; separate files are used to report wind and temperature data.
The file naming convention for the upper-air wind and Tv data files in the CDF CD is
iiiymmdd.t1v
where:
iii = Three-letter site identifier (ape = Alpine, California) y = Last digit of the year (7 = 1997) mm = Month (05-11) dd = Day (01-31) t = Data type
w = upper-air winds t = upper-air Tv
1 = Sampling mode resolution: 1 = two modes have been merged
v = Data validation level: c = Level 1.0
d = Level 2.0
For example, the file ape70618.w1c contains the Level 1.0 upper-air merged wind data from Alpine, California, for June 18, 1997.
The RP/RASS wind and Tv file formats consist of a header section followed by a data section. The header appears at the beginning of each file and consists of records that describe the project and identify the sampling site and its location, the date on which the data were collected, the RP/RASS sampling parameters, and the names and units of data fields. The data section follows the header section and consists of a sub-header record for each averaging period followed by the data for that period. The data records are written as one record per sampling height. Tables 4-1 and 4-2 depict line-by-line descriptions of the RP/RASS wind and Tv files, respectively.
The records in the data section are organized as follows: for the first averaging period (i.e., hour) in the file, a sub header record is given that contains the start time of the profile (PST), the number of range gates (altitudes) sampled during the averaging period, the number of beams sampled, and the number of changes to the radar sampling parameters that took place since the last reporting (averaging) period. This record is followed by a data record for each sampling height, beginning with the first sampling height and continuing until the data for all

4-2
altitudes have been reported for the first averaging period. This process is then repeated for the remaining sampling periods reported in the file. Each data record consists of a field containing a QC code for that altitude, followed by the data fields. The formats of the upper-air wind and Tv data records are described in Tables 4-3 and 4-4, respectively.
Table 4-1. Line-by-line description of the wind files.
Line Number(s) Description
1 Common data format type, program, and version that created CDF file 2 Project name 3 Blank line 4 Blank line 5 Site ID 6 Date (mm/dd/yy) and Julian day 7 CDF file name, QC validation level 8 Program that created CDF file, date and time file was created 9 Station elevation msl (m) and (ft) 10 Latitude (decimal degrees), longitude (decimal degrees)
11 Universal Transverse Mercator (UTM) north-south coordinate (km), UTM east-west coordinate (km)
12 Time zone in which profiler is located, difference from Universal Coordinated Time (hr) 13 Mode number based on pulse length (1-4), descriptive title for the mode 14 Blank line 15 Blank line 16 Averaging interval (minutes), time convention (begin or end) 17 Pulse length (m), range gate spacing (m) 18 Maximum samples, required samples 19 Antenna azimuth and elevation angles for each beam (deg) 20 Blank line 21 Blank line 22 Definition of QC codes
23-25 Definitions of missing data codes 26-31 Blank lines
32 Name labels of fields in sub header records of data section 33 Format of sub-header record fields 34 Name labels of fields in data records 35 Units used in data records
36 First averaging period sub header: averaging period, number of range gates, number of beams, number of parameter changes
37 through x* First averaging period data records, one record per line 36+x+1+… Subsequent averaging period sub headers, data records, repeat data blocks
* x = 36 + number of range gates sampled

4-3
Table 4-2. Line-by-line description of the Tv files.
Line Number(s) Description
1 Common data format type, program, and version that created CDF file 2 Project name 3 Blank line 4 Blank line 5 Site ID 6 Date (mm/dd/yy) and Julian day 7 CDF file name, QC validation level 8 Program that created CDF file, date and time file was created 9 Station elevation msl (m) and (ft) 10 Latitude (decimal degrees), longitude (decimal degrees)
11 Universal Transverse Mercator (UTM) north-south coordinate (km), UTM east-west coordinate (km)
12 Time zone in which profiler is located, difference from Universal Coordinated Time (hr) 13 Mode number based on pulse length (1-4), descriptive title for the mode 14 Blank line 15 Blank line 16 Averaging interval (minutes), time convention (begin or end) 17 Pulse length (m), range gate spacing (m) 18 Maximum samples, required samples 19 Antenna azimuth and elevation angles for each beam (deg) 20 Blank line 21 Blank line 22 Definition of QC codes
23-25 Definitions of missing data codes 26-31 Blank lines
32 Name labels of fields in sub header records of data section 33 Format of sub-header record fields 34 Name labels of fields in data records 35 Units used in data records
36 First averaging period sub header: averaging period, number of range gates, number of beams, number of parameter changes
37 through x* First averaging period data records, one record per line 36+x+1+… Subsequent averaging period sub headers, data records, repeat data blocks
* x = 36 + number of range gates sampled

4-4
Table 4-3. Format and units of data records in the wind files.
Field Name Contents Units Format (FORTRAN style)
QC QC code for range gate - I1 Height Altitude of midpoint of range gate m agl I9 WS Wind speed m/s F7.1 WD Wind direction degrees F7.0 U E-W component of wind m/s F7.1 V N-S component of wind m/s F7.1 W Vertical component of wind m/s F7.1 V1 Number in consensus for vertical beam 1 m/s F7.1 V2 Number in consensus for vertical beam 2 m/s F7.1 V3 Number in consensus for vertical beam 3 m/s F7.1 SNR-V1 Signal-to-noise ratio of vertical beam 1 dB I7 SNR-V2 Signal-to-noise ratio of vertical beam 2 dB I7 SNR-V3 Signal-to-noise ratio of vertical beam 3 dB I7
Table 4-4. Format and units of data records in the Tv files.
Field Name Contents Units Format (FORTRAN Style)
QC QC code for range gate - I1 Height Altitude of range gate m agl I9 Tv Virtual temperature °C F7.1 * Vertical velocity m/s F7.1 * Number of Consensus Counts for Tv I7 * Number of Consensus Counts for w I7 * Signal-to-noise ratio for Tv dB I7 * Signal-to-noise ratio for w dB I7
* These field names do not exist since this data set does not contain these data. The data fields have been replaced with “0” as a place holder.

5-1
5. DATA QUALITY DESCRIPTORS
Important information related to the quality of the data at each site is summarized in Table 5-1 and described in more detail in this section. Key findings from the audits that affect the data quality are summarized in this section. Unless otherwise specified, the surface data quality is consistent with U.S. Environmental Protection Agency (EPA) guidelines in U.S. Environmental Protection Agency (1995) and upper-air data quality is consistent with EPA guidelines in U.S. Environmental Protection Agency (2000). Exceptions to these specifications are identified below under “Data Limitations”.
Table 5-1. Summary of data limi tations.
Site Name Sodar or RP/RASS Surface Data Limitation Upper-Air Data Limitations
Alpine RP/RASS Wind direction Yes Azusa Sodar Wind direction, relative humidity Yes Barstow RP/RASS Wind speed None Brown Field RP/RASS Wind direction None Carlsbad RP/RASS None None Central Los Angeles RP/RASS Siting, wind direction None El Centro RP/RASS No data available to merge None El Monte RP/RASS Siting None Goleta RP/RASS No audit performed No audit performed Hesperia RP/RASS Siting, relative humidity None Los Angeles Int’l Airport
RP/RASS No data available to merge Yes
Los Alamitos RP/RASS & Sodar No data available to merge Yes Norton RP/RASS No audit performed None Ontario RP/RASS Wind direction None Palmdale RP/RASS Wind direction None Point Loma RP/RASS No data available to merge Yes Port Hueneme RP/RASS None None Riverside RP/RASS Siting None San Clemente Island RP/RASS None None Santa Catalina Island RP/RASS Siting, wind direction None Santa Clarita Sodar Siting Yes Simi Valley RP/RASS No data available to merge Yes
Temecula RP/RASS Siting, wind speed, wind direction, dew point
None
Thermal RP/RASS None None Tustin RP/RASS No data available to merge None 29 Palms – EAF1 Sodar No audit performed Noisy site 29 Palms – EAF2 Sodar No audit performed No audit performed 29 Palms – TUR Sodar No audit performed No audit performed Valley Center RP/RASS No data available to merge None Vandenberg AFB RP/RASS No data available to merge No audit performed
Van Nuys RP/RASS Wind speed, wind direction, dew point
Yes
Warner Springs Sodar None None
5-2
5.1 ALPINE
Audit Date: 7/23 – 7/25
Data Limitations – Surface:
• While valid for general meteorological measurements, the temperature and relative humidity (RH) data were collected using a naturally ventilated radiation shield, which does not meet EPA guidelines for data used in regulatory modeling programs.
• While valid for general meteorological measurements, the wind speed and wind direction sensor did not meet EPA guidelines for data used in regulatory dispersion modeling.
• The surface wind sensor was found to be out of alignment by 10° during the audit. The sensor was realigned following the audit. It is unclear whether the surface data prior to the audit were corrected when the final data were merged into the upper-air measurements.
• While the surface meteorological sensors were good for general meteorological measurements, the data should not be used for dispersion modeling because the sensors did not meet EPA specifications for such data.
Data Limitations – Upper Air:
• The RP/RASS beam zenith angles were outside the criteria of ±0.5° (0.7 and 1.2), making the calculations of speed and direction somewhat less accurate. It is surmised that the differences may have underestimated the calculated radial speeds by about 5%, which would have affected the calculated resultant winds.
5.2 AZUSA
Audit Date: 7/13
Data Limitations – Surface:
• The surface wind sensor was found to be out of alignment by 10° during the audit. The sensor was realigned following the audit. It is unclear whether the surface data prior to the audit were corrected when the final data were merged into the upper-air measurements.
• While valid for general meteorological measurements, the temperature and RH data were collected using a naturally ventilated radiation shield, which did not meet EPA guidelines for data used in regulatory modeling programs.
• While valid for general meteorological measurements, the wind speed and wind direction sensor did not meet EPA guidelines for data used in regulatory dispersion modeling.
• The audit of the RH measurement system showed the RH measurement to be in excess of the EPA-recommended criteria of ±1.5ºC (equipment dew-point temperature). The calculated station dew point temperature exceeded the calculated audit dew point
5-3
temperature by 3ºC (station RH was 65% compared with the audit value of 54%). It is unclear whether any maintenance was performed on the sensor following the audit.
Data Limitations – Upper Air:
• The site was in a canyon that produces significant acoustic reflections. During data validation, an attempt was made to remove as many of these reflections as possible. The wind flow patterns reflect the up/down canyon patterns.
• Noted during the audit was an error in the calculation algorithm that converted the radial winds to vector winds. The software was revised and reinstalled, but the change appeared to reverse the winds by 180°. No resolution to the error could be identified or the software verified. Comparisons of the lowest levels on the sodar to the surface winds implied the wind shift was 180°; that adjustment was applied to the data and the data were labeled suspect.
5.3 BARSTOW
Audit Date: 6/17
Data Limitations – Surface:
• Prior to the audit the surface wind speed system had incorrect coefficients programmed into the data logger. The factors were changed following the audit. However, it is not known whether data prior to the audit were corrected.
Data Limitations – Upper Air:
• Some limitations in the vertical coverage of the RP/RASS were noted during the audit and in the subsequent review of the data. It is suspected the dry desert environment and a low signal-to-noise ratio may have contributed to the observed data limitations. Otherwise all validated data met the program data quality objectives.
5.4 BROWN FIELD
Audit Date: 7/21
Data Limitations – Surface:
• While valid for general meteorological measurements, the temperature and RH data were collected using a naturally ventilated radiation shield, which did not meet EPA guidelines for data used in regulatory modeling programs.
• The surface wind sensor was found to be out of alignment by 10° during the audit. The sensor was realigned following the audit. It is unclear whether the surface data prior to the audit were corrected when the final data were merged into the upper-air measurements.
5-4
• While valid for general meteorological measurements, the wind speed and wind direction sensor did not meet EPA guidelines for data used in regulatory dispersion modeling.
Data Limitations – Upper Air:
• No significant limitations noted.
5.5 CARLSBAD
Audit Date: 7/25 – 7/27
Data Limitations – Surface:
• While valid for general meteorological measurements, the temperature and RH data were collected using a naturally ventilated radiation shield, which did not meet EPA guidelines for data used in regulatory modeling programs.
• While valid for general meteorological measurements, the wind speed and wind direction sensor did not meet EPA guidelines for data used in regulatory dispersion modeling.
Data Limitations – Upper Air:
• No significant limitations noted.
5.6 CENTRAL LOS ANGELES
Audit Date: 7/11
Data Limitations – Surface:
• The surface meteorological station was situated on top of a building with the wind sensors at about 10 m above the rooftop and the temperature and RH sensors at about 2 m. The siting for general meteorological measurements was poor, and the intent of the data was to aid in the validation of the RP/RASS data. The wind data were influenced by the building wake, and the temperature and RH sensors were affected by heating from the rooftop.
• At the time of the audit the wind direction sensor orientation was incorrect causing all wind directions to be reported up to 10° clockwise (10° “high”). The orientation was corrected following the audit. It is not known whether the surface directions were corrected for the period prior to the audit.
Data Limitations – Upper Air:
• No significant limitations noted.
5.7 EL CENTRO
Audit Date: No audit performed

5-5
5.8 EL MONTE
Audit Date: 7/28 – 7/30
Data Limitations – Surface:
• To the south and south-southwest of the site was a retaining wall and bushes that created an obstruction to the flow, altering the meteorological conditions. Additionally, the trees to the east were closer than the EPA-recommended spacing from obstructions. Data indicated from this direction should be carefully scrutinized.
Data Limitations – Upper Air:
• No significant limitations noted.
5.9 GOLETA
Audit Date: No audit performed
5.10 HESPERIA
Audit Date: 6/20
Data Limitations – Surface:
• A water tank formed an obstruction that was closer than the EPA-recommended siting criteria for distance from obstructions. The surface wind measurements would not have been accurate when winds were from the southeast. Data from that direction should be carefully scrutinized.
• The site RH data accuracy was outside the QA audit criteria. It is unclear whether any maintenance was performed on the sensor following the audit. At the time of the audit the RH was 12% higher than the calculated audit RH.
Data Limitations – Upper Air:
• No significant limitations noted.
5.11 LOS ANGELES INTERNATIONAL AIRPORT
Audit Date: 6/26
Data Limitations – Upper Air:
• The orientation of the RP/RASS antenna was set to 307º; the audit measured the orientation at 309º. The operator decided not to change the antenna orientation.
5-6
• The level of the northeast RP/RASS acoustic sources exceeded the EPA PAMS recommended criteria of ± 1.0º. The level of this acoustic source was adjusted following the audit.
5.12 LOS ALAMITOS
Audit Date: 7/16
Data Limitations – Surface:
• No significant limitations noted.
Data Limitations – Upper Air:
• The sodar data prior to the audit had been removed from the database as the data showed noise contamination in the vertical beam. Since the horizontal beams were corrected for vertical velocity, this contamination severely limited the usefulness of the horizontal data. The sodar settings were changed following the audit so as not to correct the data for vertical velocity. While this reduced the accuracy of the sodar data somewhat, it minimized the noise contamination problem.
5.13 NORTON
Audit Date: 6/20
Data Limitations – Surface:
• While no performance audit was conducted, it was noted that the wind direction vane was warped.
Data Limitations – Upper Air:
• No significant limitations noted.
5.14 ONTARIO
Audit Date: 11/21
Data Limitations – Surface:
• The wind direction sensor was rotated –30° from true north. Additionally, the wind vane was not properly secured to the sensor shaft, and the crossarm and sensors were not tightened sufficiently to prevent them from being moved by the wind. At the time of the audit the wind direction sensor orientation was incorrect, causing all wind directions to be reported up to 9° clockwise (9° “high”). The orientation was corrected following the audit. It is not known whether the surface directions were corrected for the period prior to the audit.

5-7
• While valid for general meteorological measurements, the temperature data were collected using a naturally ventilated radiation shield, which did not meet EPA guidelines for data used in regulatory modeling programs.
Data Limitations – Upper Air:
• No significant limitations noted.
5.15 PALMDALE
Audit Date: 7/1
Data Limitations – Surface:
• While valid for general meteorological measurements, the temperature and RH data were collected using a naturally ventilated radiation shield, which did not meet EPA guidelines for data used in regulatory modeling programs.
• At the time of the audit the wind direction sensor orientation was incorrect, causing all wind directions to be reported up to 6° clockwise (6° “high”). The orientation was corrected following the audit. It is not known whether the surface directions were corrected for the period prior to the audit.
Data Limitations – Upper Air:
• No significant limitations noted.
5.16 POINT LOMA
Audit Date: 7/17 to 7/19
Data Limitations – Upper Air:
• At the time of the audit the RP/RASS antenna orientation was outside EPA-recommended criteria by a difference of –7°. The orientation was corrected following the audit. It is not known whether the data were corrected for the period prior to the audit.
• Following the audit, it was noted in the header information of the RP/RASS data that additional configuration changes had been made. These changes were incorporated as best as possible; however, due to the lack of documentation, there is a chance that some data may not have been corrected.

5-8
5.17 PORT HUENEME
Audit Date: 6/30
Data Limitations – Surface:
• While valid for general meteorological measurements, the temperature and RH data were collected using a naturally ventilated radiation shield, which did not meet EPA guidelines for data used in regulatory modeling programs.
• While valid for general meteorological measurements, the wind speed and wind direction sensor did not meet EPA guidelines for data used in regulatory dispersion modeling.
Data Limitations – Upper Air:
• No significant limitations noted.
5.18 RIVERSIDE
Audit Date: 6/18
Data Limitations – Surface:
• The surface meteorological station was situated on top of a building with the wind sensors at a height of about 10 m above the rooftop and the temperature and RH sensors at about 2 m above the rooftop. This placed the temperature and RH sensors about 10 m above the asphalt ground surface. The siting for general meteorological measurements was poor. The intent of the data was to be used only as an aid in the validation of the RP/RASS data. The surface wind data would have been influenced by the building wake, and the temperature and RH sensors affected by heating from the rooftop and water flowing through the chlorination process within the building. A different surface meteorological site, less than 0.5 km to the east, should be used for any needed surface data.
Data Limitations – Upper Air:
• No significant limitations noted.
5.19 SAN CLEMENTE ISLAND
Audit Date: 7/3
Data Limitations – Surface:
• While valid for general meteorological measurements, the temperature and RH data were collected using a naturally ventilated radiation shield, which did not meet EPA guidelines for data used in regulatory modeling programs.
• While valid for general meteorological measurements, the wind speed and wind direction sensor did not meet EPA guidelines for data used in regulatory dispersion modeling.
5-9
Data Limitations – Upper Air:
• No significant limitations noted.
5.20 SANTA CATALINA ISLAND
Audit Date: 7/11
Data Limitations – Surface:
• The site location was not representative of the entire island. Synoptic winds from the east, through the south and to the west, would have been influenced by the shadow of the island.
• While valid for general meteorological measurements, the temperature and RH data were collected using a naturally ventilated radiation shield, which did not meet EPA guidelines for data used in regulatory modeling programs.
• While valid for general meteorological measurements, the wind speed and wind direction sensor did not meet EPA guidelines for data used in regulatory dispersion modeling.
• At the time of the audit the wind direction sensor orientation was incorrect, causing all wind directions to be reported up to 9° clockwise (9° “high”). The orientation was corrected following the audit. It is not known whether the surface directions were corrected for the period prior to the audit.
Data Limitations – Upper Air:
• No significant limitations noted.
5.21 SANTA CLARITA
Audit Date: 7/11
Data Limitations – Surface:
• While valid for general meteorological measurements, the temperature and RH data were collected using a naturally ventilated radiation shield, which did not meet EPA guidelines for data used in regulatory modeling programs. Additionally, the temperature and RH sensors were not situated over representative terrain. The tower was placed over a gravel bed while the surrounding terrain comprised gravel and asphalt.
• The surface wind measurements would not be accurate when winds were from the east. Adjacent buildings formed an obstruction that was closer than the EPA siting criteria for distance from obstructions. Data from that direction should be carefully scrutinized. Additionally, while valid for general meteorological measurements, the wind speed and wind direction sensor did not meet EPA guidelines for data used in regulatory dispersion modeling.
5-10
Data Limitations – Upper Air:
• Noted during the audit was an error in the calculation algorithm that converted the radial winds to vector winds. The software was revised and reinstalled, but the change appeared to reverse the winds by 180°. No resolution to the error could be identified or the software verified. Comparisons of the lowest levels on the sodar to the surface winds implied the wind shift was 180°; that adjustment was applied to the data, and the data labeled suspect.
• The sodar was a two-component sodar with no vertical component. Given the relatively steep zenith angle of 20°, the accuracy of the horizontal winds would have been reduced during periods with significant vertical motion.
5.22 SIMI VALLEY
Audit Date: 6/24 to 6/26
Data Limitations – Surface:
• No significant limitations noted for the RASS data.
Data Limitations – Upper Air:
• The fact that the Simi Valley RP/RASS wind measurements did not operate in the high mode limited the vertical range of the wind measurements.
5.23 TEMECULA
Audit Date: 6/21 to 6/24
Data Limitations – Surface:
• The buildings to the south and west of the site obstructed the exposure of the wind sensors.
• The wind speed sensing system outputs differed from the corresponding audit inputs by more than the EPA-recommended criteria. The transfer coefficients that convert RPM to wind speed may not be correct. Following the audit, the operator contacted the manufacturer for the correct coefficients.
• The wind direction sensing system outputs differed from the audit inputs by more than the EPA-recommended criterion of ±5º for 180º and 270º. Following the audit, the sensor was replaced.
• The equivalent dew point temperature calculated from the site ambient temperature and RH sensing systems differed from the audit equivalent dew point temperature by more than the EPA-recommended criterion of ±1.5ºC. Following the audit, the RH sensing system was checked and the problem corrected.
5-11
Data Limitations – Upper Air:
• No significant limitations noted.
5.24 THERMAL
Audit Date: 6/19
Data Limitations – Surface:
• No significant limitations noted.
Data Limitations – Upper Air:
• No significant limitations noted.
5.25 TUSTIN
Audit Date: 7/24
Data Limitations – Upper Air:
• No significant limitations noted.
5.26 TWENTY-NINE PALMS – EAF1
Audit Date: No audit was performed.
5.27 TWENTY-NINE PALMS – EAF2
Audit Date: No audit was performed.
5.28 TWENTY-NINE PALMS – TUR
Audit Date: No audit was performed.
5.29 VALLEY CENTER
Audit Date: 7/19 to 7/20
Data Limitations – Upper Air:
• No significant limitations noted.
5-12
5.30 VANDENBERG AFB
Audit Date: No audit was performed.
5.31 VAN NUYS
Audit Date: 7/10
Data Limitations – Surface:
• The temperature and RH sensors were in a non-aspirated radiation shield. It is recommended that the temperature and humidity data collected during low wind speeds conditions (below 2 m/s) be invalidated.
• The 10-m wind direction sensor orientation was outside of criteria which produced a total error of 9°. The sensor was aligned following the audit and the alignment verified.
• The dew point temperature calculated from the site RH and ambient temperature sensing systems differed from the audit-determined dew point temperature by more than the EPA-recommended criterion of ± 1.5ºC.
• All sensors were scanned every 10 seconds with 5-minute averages recorded.
• Wind data recorded included scalar wind speed and resultant vector wind direction.
Data Limitations – Upper Air:
• The southeast RP/RASS antenna orientation differed from the audit measurement by 6°. The difference was verified, and a change in the system setup made following the audit.
• The RASS was operated in a course mode with range gate intervals of 106 m.
5.32 WARNER SPRINGS
Audit Date: 8/8 and 9/10
Data Limitations – Surface:
• No surface measurements were made at this site.
Data Limitations – Upper Air:
• No significant limitations noted.
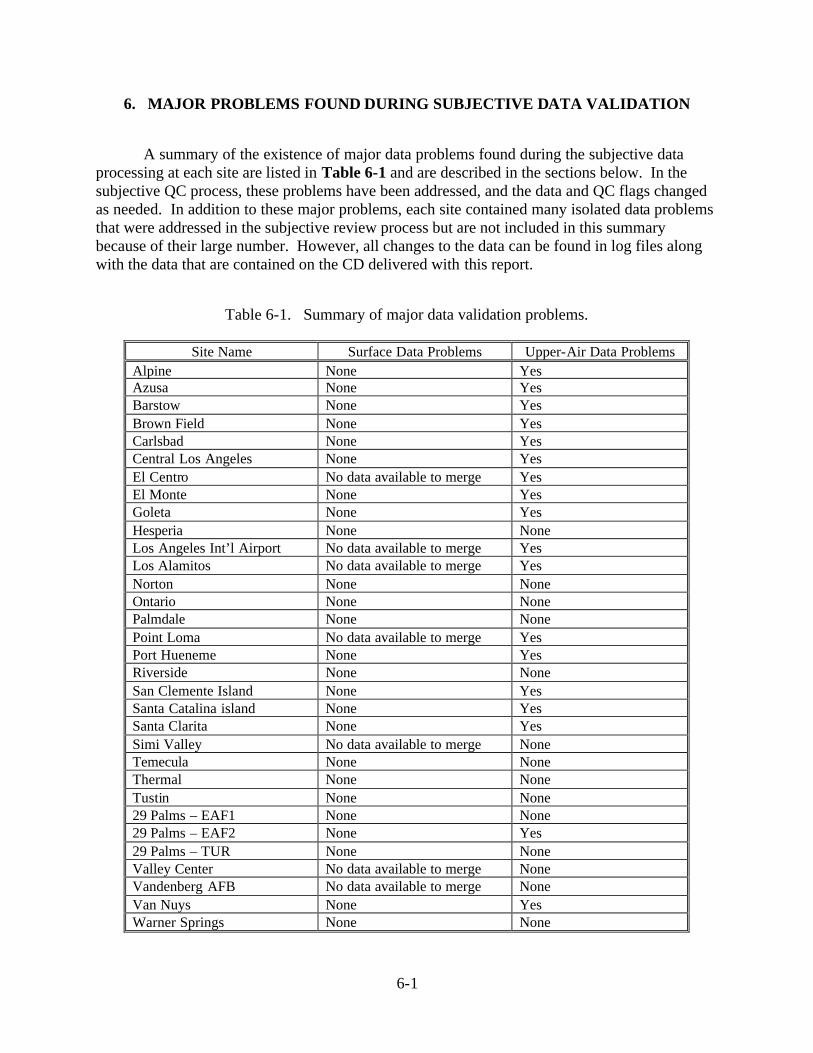
6-1
6. MAJOR PROBLEMS FOUND DURING SUBJECTIVE DATA VALIDATION
A summary of the existence of major data problems found during the subjective data processing at each site are listed in Table 6-1 and are described in the sections below. In the subjective QC process, these problems have been addressed, and the data and QC flags changed as needed. In addition to these major problems, each site contained many isolated data problems that were addressed in the subjective review process but are not included in this summary because of their large number. However, all changes to the data can be found in log files along with the data that are contained on the CD delivered with this report.
Table 6-1. Summary of major data validation problems.
Site Name Surface Data Problems Upper-Air Data Problems Alpine None Yes Azusa None Yes Barstow None Yes Brown Field None Yes Carlsbad None Yes Central Los Angeles None Yes El Centro No data available to merge Yes El Monte None Yes Goleta None Yes Hesperia None None Los Angeles Int’l Airport No data available to merge Yes Los Alamitos No data available to merge Yes Norton None None Ontario None None Palmdale None None Point Loma No data available to merge Yes Port Hueneme None Yes Riverside None None San Clemente Island None Yes Santa Catalina island None Yes Santa Clarita None Yes Simi Valley No data available to merge None Temecula None None Thermal None None Tustin None None 29 Palms – EAF1 None None 29 Palms – EAF2 None Yes 29 Palms – TUR None None Valley Center No data available to merge None Vandenberg AFB No data available to merge None Van Nuys None Yes Warner Springs None None
6-2
6.1 ALPINE
Data Problems – Surface:
• No significant problems noted.
Data Problems – Upper Air:
• Winds were found to be too fast and directionally inconsistent from June 2 at 1800 PST through June 12 at 1800 PST. These data were invalidated.
• In general, winds from about 3000 to 4000 m of each profile were found to be excessively large, and the data were invalidated.
6.2 AZUSA
Data Limitations – Surface:
• No significant problems noted.
Data Problems – Upper Air:
• Data above 200 m during the middle of each day were invalidated due to the presence of acoustic reflections.
• Data prior to July 14 were invalidated due to an apparent 180° shift in wind direction caused by the incorrect calculation algorithm.
6.3 BARSTOW
Data Limitations – Surface:
• No significant problems noted.
Data Problems – Upper Air:
• A majority of the wind data above 1500 m were invalidated from August 6 to August 17 due to inconsistent wind speeds and wind directions. Much of the remaining data were flagged as 5 or 6 (suspect based on processing information) during the objective QC process.
• From August 18 to August 30, there was no data available for QC.
6.4 BROWN FIELD
Data Problems – Surface:
• No significant problems noted.
6-3
Data Problems – Upper Air:
• In general, wind speeds from about 3000 to 4000 m were found to be excessively large and wind directions highly variable. These data were invalidated.
6.5 CARLSBAD
Data Problems – Surface:
• No significant problems noted.
Data Problems – Upper Air:
• In general, wind speeds from about 3000 to 4000 m were found to be excessively large and wind directions highly variable. These data were invalidated.
6.6 CENTRAL LOS ANGELES
Data Problems – Surface:
• No significant problems noted.
Data Problems – Upper Air:
• At approximately 2200 m, where the low-mode data changes to high-mode, the wind data were found to be inconsistent. Significant amounts of data at this level were invalidated.
6.7 EL CENTRO
Data Problems – Surface:
• No significant problems noted.
Data Problems – Upper Air:
• From September 17 to October 5, Level 2.0 QC revealed disagreement with the Thermal site data, which had previously been in good agreement with model data. From October 6 to October 14, no data appear to have been collected. All data from September 17 through October 5 were invalidated except for September 23, October 4, and October 5. On these days, the data appeared to agree with the Thermal site and model data.
• From October 15 to October 21, all winds above approximately 2200 m were found to be inconsistent with regard to wind speed and wind direction. The data were invalidated.
6.8 EL MONTE
Data Problems – Surface:
• No significant problems noted.
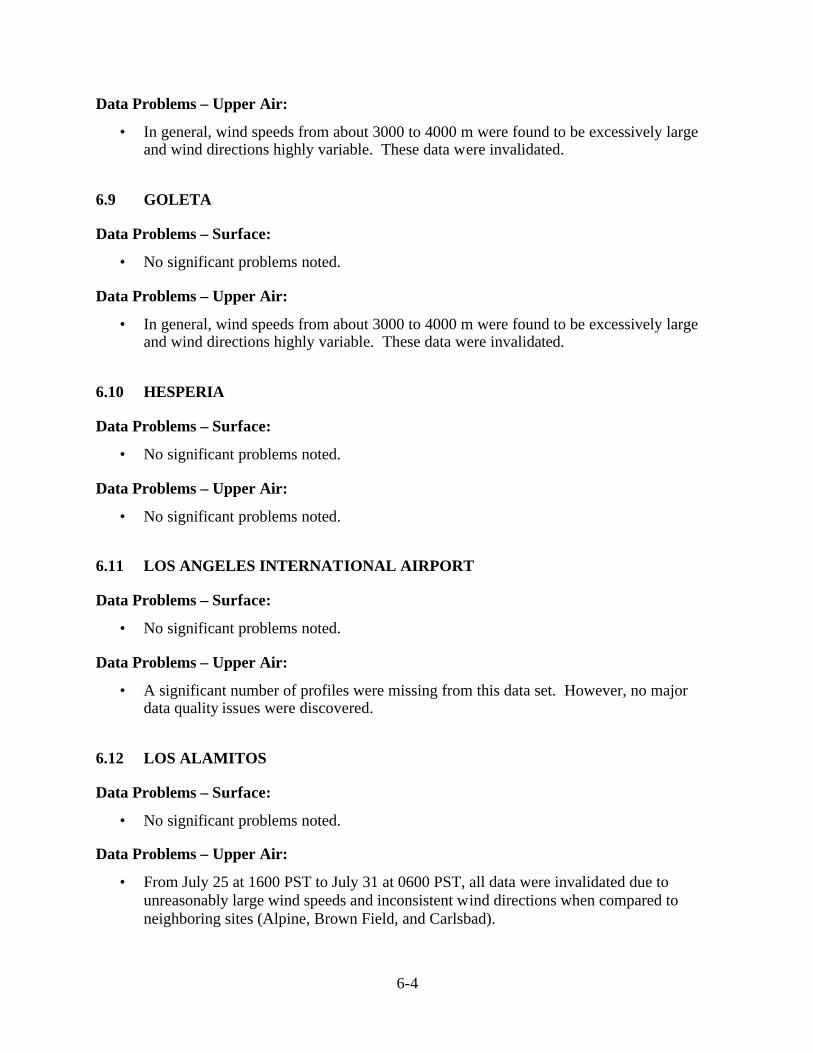
6-4
Data Problems – Upper Air:
• In general, wind speeds from about 3000 to 4000 m were found to be excessively large and wind directions highly variable. These data were invalidated.
6.9 GOLETA
Data Problems – Surface:
• No significant problems noted.
Data Problems – Upper Air:
• In general, wind speeds from about 3000 to 4000 m were found to be excessively large and wind directions highly variable. These data were invalidated.
6.10 HESPERIA
Data Problems – Surface:
• No significant problems noted.
Data Problems – Upper Air:
• No significant problems noted.
6.11 LOS ANGELES INTERNATIONAL AIRPORT
Data Problems – Surface:
• No significant problems noted.
Data Problems – Upper Air:
• A significant number of profiles were missing from this data set. However, no major data quality issues were discovered.
6.12 LOS ALAMITOS
Data Problems – Surface:
• No significant problems noted.
Data Problems – Upper Air:
• From July 25 at 1600 PST to July 31 at 0600 PST, all data were invalidated due to unreasonably large wind speeds and inconsistent wind directions when compared to neighboring sites (Alpine, Brown Field, and Carlsbad).

6-5
• From October 3 at 0400 PST to October 28 at 1400 PST, data were invalidated due to unreasonably large wind speeds and inconsistent wind directions when compared to neighboring sites (Alpine, Brown Field, and Carlsbad).
6.13 NORTON
Data Problems – Surface:
• No significant problems noted.
Data Problems – Upper Air:
• No significant problems noted.
6.14 ONTARIO
Data Problems – Surface:
• No significant problems noted.
Data Problems – Upper Air:
• No significant problems noted.
6.15 PALMDALE
Data Problems – Surface:
• No significant problems noted.
Data Problems – Upper Air:
• No significant problems noted.
6.16 POINT LOMA
Data Problems – Surface:
• No significant problems noted.
Data Problems – Upper Air:
• From September 6 at 1600 PST through September 8 at 2300 PST, all data were invalidated due to unreasonably large wind speeds and inconsistent wind directions.
• From September 8 at 1200 PST to September 17 at 0900 PST, no data exists.

6-6
6.17 PORT HUENEME
Data Problems – Surface:
• No significant problems noted.
Data Problems – Upper Air:
• A majority of the data above 3000 m prior to August 15 were invalidated due to unreasonably large wind speeds and frequent, rapid wind shifts.
6.18 RIVERSIDE
Data Problems – Surface:
• No significant problems noted.
Data Problems – Upper Air:
• No significant problems noted.
6.19 SAN CLEMENTE ISLAND
Data Problems – Surface:
• No significant problems noted.
Data Problems – Upper Air:
• In general, wind speeds from about 3000 to 4000 m were found to be excessively large and wind directions highly variable. These data were invalidated. This was particularly noticeable during the months of September and October.
6.20 SANTA CATALINA ISLAND
Data Problems – Surface:
• No significant problems noted.
Data Problems – Upper Air:
• In general, wind speeds from about 3000 to 4000 m were found to be excessively large and wind directions highly variable. These data were invalidated.
6.21 SANTA CLARITA
Data Problems – Surface:
• No significant problems noted.

6-7
Data Problems – Upper Air:
• All data were flagged as suspect due to lack of documentation of the wind speed calculation.
• Data prior to July 14 were invalidated due to an error in the calculation algorithm that converted the radial winds to vector winds.
6.22 SIMI VALLEY
Data Problems – Surface:
• No significant problems noted.
Data Problems – Upper Air:
• No significant problems noted.
6.23 TEMECULA
Data Problems – Surface:
• No significant problems noted.
Data Problems – Upper Air:
• No significant problems noted.
6.24 THERMAL
Data Problems – Surface:
• No significant problems noted.
Data Problems – Upper Air:
• No significant problems noted.
6.25 TUSTIN
Data Problems – Surface:
• No significant problems noted.
Data Problems – Upper Air:
• No significant problems noted.

6-8
6.26 TWENTY-NINE PALMS – EAF1
Data Problems – Surface:
• No significant problems noted.
Data Problems – Upper Air:
• No significant problems noted.
6.27 TWENTY-NINE PALMS – EAF2
Data Problems – Surface:
• No significant problems noted.
Data Problems – Upper Air:
• From August 26 to September 9 at 2000 PST, all data were invalidated due to a wiring problem that affected the wind direction.
6.28 TWENTY-NINE PALMS – TUR
Data Problems – Surface:
• No significant problems noted.
Data Problems – Upper Air:
• No significant problems noted.
6.29 VALLEY CENTER
Data Problems – Surface:
• No significant problems noted.
Data Problems – Upper Air:
• No significant problems noted.
6.30 VANDENBERG AFB
Data Problems – Surface:
• No significant problems noted.
Data Problems – Upper Air:
• No significant problems noted.

6-9
6.31 VAN NUYS
Data Problems – Surface:
• No significant problems noted.
Data Problems – Upper Air:
• In general, wind speeds from about 3000 to 4000 m were found to be excessively large and wind directions highly variable. These data were invalidated.
6.32 WARNER SPRINGS
Data Problems – Surface:
• No significant problems noted.
Data Problems – Upper Air:
• No significant problems noted.

7-1
7. RECOMMENDATIONS
The impetus for reviewing and revalidating the data collected by SCOS97 RP/RASS and sodars was that the data produced by the initial data processing and validation effort were not ready for use in analyses and modeling efforts. In fact, the initial data processing and validation effort produced two different data sets for the RP/RASS wind and Tv data that had only received objective QC.
The goal of this second data processing and validation effort was to provide one final, fully validated data set that would meet the requirements for the SCOS97 data analysis and modeling tasks, without the need for further judgment as to data quality. In meeting this goal, several additional issues were identified that, if taken into consideration, will aid future monitoring programs in the production of a final data set for upper-air measurements. These issues are identified below with recommendations as to how future program planners might implement these findings.
Issue 1: Adherence to the quality assurance program plan (QAPP)
The data collection efforts should start with an end-to-end quality assurance program plan (QAPP) and quality program that define all aspects of the data collection and data processing tasks, how those tasks should be implemented, and how quality assurance personnel should oversee their implementation. The QAPP should be implemented as written. Any deviation from the plan should be decided on before any action is taken, and the QAPP should be amended accordingly.
Issue 2: Performance of audits at all measurement sites
Audits were not conducted at all measurements sites. Problems noted in the data collected at unaudited sites proved to be either impossible to resolve or difficult and time consuming to resolve. Audits would have mitigated the problems. In those cases where it was not possible to resolve the problems, the data were either flagged as suspect or invalidated. It is recommended that all sites be audited in a consistent manner. Additionally, a provision should be made to audit any sites that are added to a program after the measurement period has started. The cost of performing audits is small compared to the cost of collecting data that cannot be used in analyses or as model input with sufficient confidence.
Issue 3: Incorporation of audit findings
For many of the SCOS97 sites, it was discovered that data errors caused by problems in the data collection process, and discovered by the audits, had not been corrected before the data were processed and validated. Suspect data identified by the audits should be corrected, flagged, or invalidated before processing begins. It should not be assumed that automated data processing and validation algorithms will find and eliminate flawed data.
7-2
Issue 4: Requirement for manual data validation
The first round of data processing and validation in 1998 subjected the data to automated processing and validation only. The present study uncovered numerous problems in the data that had not been corrected, flagged, or invalidated by the automated data processing routines. It is recommended that manual internal consistency checks and external comparison among adjacent sites be conducted following initial automated processing and screening to bring the data to the level of quality specified in the QAPP.
Issue 5: Testing of automated data processing and validation routines
For SCOS97, two different data processing and validation routines were originally applied to the RP/RASS and sodar data producing two distinct results. The use of one data set over the other (Met_0 versus Met_1) was ultimately left to analysts and modelers.
Generally, the end user should not be the final judge of data quality; rather, the data quality should be determined by the program designers at the beginning of the program and clearly stated in the QAPP. The automated routines used to process and validate data should be tested and proven before being used to process the program data, or, if experimental, a provision in the QAPP should include a task to validate and document the performance of the processing methods.
In this study, we determined that the Met_1 processing technique produced results that better compare with rawinsonde measurements—the measurement characteristics of which are well-documented. It is recommended that the Met_1 processing technique be independently tested to determine its performance characteristics and to enable suggestions for improvements as necessary.

8-1
8. REFERENCES
U.S. Environmental Protection Agency (1995) Quality assurance handbook for air pollution
measurement systems. Vol. IV, meteorological measurements. Report prepared by U.S. Environmental Protection Agency, Research Triangle Park, NC, EPA/600/R-94/038d, March.
U.S. Environmental Protection Agency (2000) Meteorological Monitoring Guidance for
Regulatory Modeling Applications. Office of Air Quality Planning and Standards, Research Triangle Park, NC, Document EPA-454/R-99-005, February.
Wuertz D.B. and Weber F.L. (1989) Editing wind profiler measurements. Report prepared by
NOAA/WPL, Boulder, CO, ERL 438-WPL 92. Wolfe D.E. and Weber B.L. (1998) Final Report: Data Management / Upper-Air Meteorological
Network, August 19 1998, Contract No. 96-323.

A-1
APPENDIX A
SUMMARY OF RAWINSONDE, RADAR WIND PROFILER AND RASS EVALUATIONS
The content of this appendix was supplied by Parsons Corporation. It is a compilation of the working notes and analysis that supports the discussion of data evaluation in Section 3 and is not intended to be a refined collection of analyses.

This page is intentionally blank.
A-3
To evaluate the performance of the Met_0 and Met_1 wind and virtual temperature processing algorithms, analyses were performed using data collected from standard Rawinsondes at locations near the radar wind profiler/RASS sites. Because of the relatively rich Rawinsonde data set at Point Mugu, the primary analyses were performed using these sondes for comparison to the data collect at the Port Hueneme site. Additional analyses were then performed in the desert locations to verify the findings at Port Hueneme. This appendix summarizes the analysis process and findings from the comparisons performed.
The analysis results are presented in four sections covering the wind and temperature comparisons at Port Hueneme (coastal region) and the wind and temperature comparisons at various sites in the desert region.
Note in the analysis discussed in this appendix, the meaning of the QC flags 5 and 6, which indicate when a Met_0 and Met_1 data points are different or one of the data types is missing, is not the same meaning of the QC flags 5 and 6 in the final data set. Refer to Section 3 for a discussion of the meaning of the QC flags 5 and 6 in the final data set.
COASTAL WIND EVALUATION AT PORT HUENEME
Comparisons were made between the Pt. Mugu rawinsondes and the radar data from Port Hueneme. Thirteen rawinsonde soundings were performed over a three-day period from September 27 through 29 (PST). Of the thirteen, one sounding (ntd0929.w04) had ambiguous times in the file and was not included in the analyses. The analysis used the QC flag of 6 as a valid data point in the analyses in addition to the QC flag of 0. The flag of 6 indicated that the Met_0 and Met_1 data values did not agree with each other. The analysis therefore looked at all available data to compare with the Rawinsonde data, even when the Met_0 and Met_1 data sets disagreed between themselves. The result was an objective analysis of which radar data set best agreed with the Rawinsonde data.
All analyses were performed in PST. Several of the rawinsonde soundings had altitudes that jumped down during the ascent and the “falling” points were removed before comparisons were made. Additionally, the sondes were a special variety that collected data during both the ascent and descent. The ascent data were used from all soundings with the exception of one, which had only descent data. It was felt that the ascent data would be more representative for the comparisons. For the twelve rawinsonde soundings, statistical comparisons were made between the sounding wind speeds and directions and the corresponding hourly reported radar data. The radar gate volume was assumed to include the altitude from half way below to halfway above the reported gate. For example, with gate spacing of 100 meters, the radar data at 300 meters would include the volume from 250 to 350 meters. All available rawinsonde data points that fell within this volume during the averaging hour were vector averaged to obtain a comparison point to the radar data.
Comparisons were made using meteorological u and v speeds and standard vector wind speed and direction data. For the wind speed and direction data sets, statistical values were calculated using six threshold speeds from 0 to 5 m/s. The threshold speed is the minimum speed (as measured by the “standard”) above which comparisons are made. In theory the wind
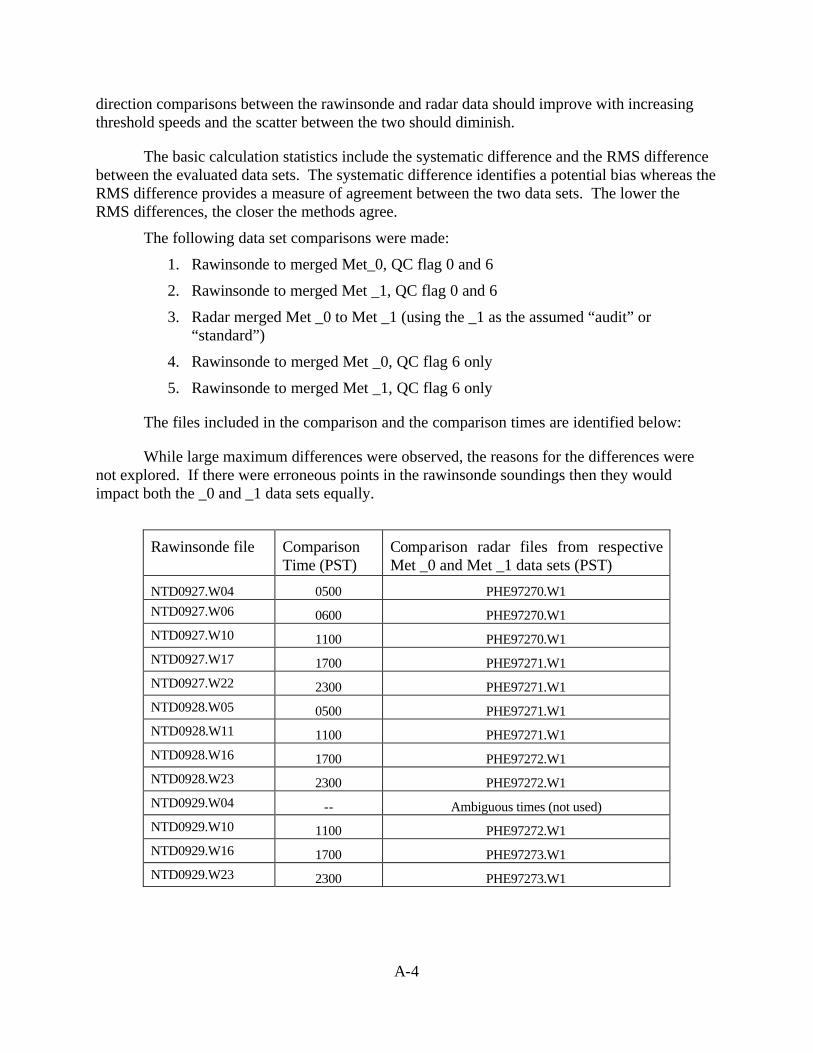
A-4
direction comparisons between the rawinsonde and radar data should improve with increasing threshold speeds and the scatter between the two should diminish.
The basic calculation statistics include the systematic difference and the RMS difference between the evaluated data sets. The systematic difference identifies a potential bias whereas the RMS difference provides a measure of agreement between the two data sets. The lower the RMS differences, the closer the methods agree.
The following data set comparisons were made:
1. Rawinsonde to merged Met_0, QC flag 0 and 6
2. Rawinsonde to merged Met _1, QC flag 0 and 6
3. Radar merged Met _0 to Met _1 (using the _1 as the assumed “audit” or “standard”)
4. Rawinsonde to merged Met _0, QC flag 6 only
5. Rawinsonde to merged Met _1, QC flag 6 only
The files included in the comparison and the comparison times are identified below:
While large maximum differences were observed, the reasons for the differences were not explored. If there were erroneous points in the rawinsonde soundings then they would impact both the _0 and _1 data sets equally.
Rawinsonde file Comparison Time (PST)
Comparison radar files from respective Met _0 and Met _1 data sets (PST)
NTD0927.W04 0500 PHE97270.W1 NTD0927.W06 0600 PHE97270.W1 NTD0927.W10 1100 PHE97270.W1 NTD0927.W17 1700 PHE97271.W1 NTD0927.W22 2300 PHE97271.W1 NTD0928.W05 0500 PHE97271.W1 NTD0928.W11 1100 PHE97271.W1 NTD0928.W16 1700 PHE97272.W1 NTD0928.W23 2300 PHE97272.W1 NTD0929.W04 -- Ambiguous times (not used) NTD0929.W10 1100 PHE97272.W1 NTD0929.W16 1700 PHE97273.W1 NTD0929.W23 2300 PHE97273.W1

A-5
Speed Direction Speed Direction Speed Direction Speed DirectionRawinsonde
QC 0 and 6 to _0 473 1.4 14 3.7 47 1.7 18 4.2 35QC 0 and 6 to _1 501 1.0 14 3.5 48 1.0 18 4.1 33
QC 6 only to _0 58 3.2 8 4.6 43 2.6 21 4.4 39QC 6 only to _1 58 0.8 13 3.7 54 0.8 14 4.1 37
Radar only
QC 0 and 6 _0 to _127-Sep 1179 0.6 -1 2.1 16 0.6 -2 2.2 1628-Sep 1160 0.4 -3 2.0 33 0.2 -3 2.3 3029-Sep 1228 0.3 -1 1.5 23 0.1 -2 1.6 16
Composite results -- 5 m/s thresholdSystematic Difference RMS Difference# of Data
PointsSystematic Difference RMS Difference
Composite results -- 2 m/s threshold
Results Summary
On the basis of the above results the following is concluded:
• The rawinsonde data was used as is, without any knowledge of the QA or QC procedures implemented in the collection of the data. The procedures and equipment used were presumed acceptable.
• The comparison of the Met_0 to Met_1 radar only high and low mode data sets showed no significant bias in the speed or direction calculations, as shown by the systematic difference results. However, the RMS differences in speed and direction show an uncertainty on the order of about 1.5 to 2.5 m/s and 15 to 30°. Thus, there is a difference in the calculated values that may be significant. General results from audits comparing rawinsondes to the radar have shown RMS differences comparable to the above results that indicate the radar data may be a little noisy just due to the processing techniques.
• The comparison of the rawinsonde to the Met_0 and Met _1 data sets showed the Met _1 data to have smaller systematic differences in both speed and direction for both the low and high modes. Additionally, RMS differences are generally less, albeit marginally less, in the Met _1 comparisons. This indicates the values of the Met _1 data set are closer to those observed by the rawinsondes.
• The number of radar data points is slightly greater in the Met _1 data sets (~6%).
• When comparing the radar data sets to the rawinsondes when the differences between Met _0 and Met _1 triggered the QC flag of 6, the Met _1 data set had significantly lower wind speed systematic differences than the Met _0 data set with wind direction differences being roughly comparable. RMS wind speed differences were slightly lower with the Met _1 data set. It is possible that the speed differences occur because of the different manner in which the vertical velocity is calculated and then applied to the data.

A-6
Conclusion
On the basis of the above analyses, use of the Met_1 wind data set was recommended. Also, given that when the two data sets diverge (a QC flag of 6 is present), the Met_1 showed smaller differences than the Met_0 set, which further supports the use of the Met_1 data set.
COASTAL RASS EVALUATION AT PORT HUENEME
Comparisons were made evaluating the Pt. Mugu rawinsondes and the RASS data from Port Hueneme. The RASS data set used was dated 22 January, 2001 and it was assumed that this would be representative of the final objective analysis product prior to the subjective analysis that would be performed. Thirteen rawinsonde soundings were performed over a three-day period from September 27 through 29 (PST). Of the thirteen, one sounding (ntd0929.w04) had ambiguous times in the wind file. For consistency, it was not included in the RASS analyses.
The analysis used the QC flags of 0, 5 and 6 as a valid data points in the analyses. While the codes of 5 and 6 were not officially labeled as valid, those codes were assigned when significant differences between the Met_0 and Met_1 data sets were present, or one or the other had missing data.
Two types of comparisons were performed. The first compared the rawinsonde data to what is considered the valid data points. The second used the subset of 5 and 6 compared to the rawinsonde data. This evaluated which RASS data set (Met _0 or Met _1) compared better to the rawinsondes when they disagreed between themselves.
All analyses were performed in PST. Several of the rawinsonde soundings had altitudes that jumped down during the ascent and the “falling” points were removed before comparisons were made. Additionally, the ascent data were used from all soundings with the exception of one, which had only descent data. It was felt that the ascent data would be more representative for the comparisons. For the twelve rawinsonde soundings, statistical comparisons were made between the RASS virtual temperatures and the corresponding hourly reported RASS data. The RASS gate volume was assumed to include the altitude from half way below to halfway above the reported gate. For example, with gate spacing of 100 meters, the RASS data at 300 meters would include the volume from 250 to 350 meters. All available rawinsonde data points that fell within this volume during the averaging hour were arithmetically averaged to obtain a comparison point to the RASS data.
The basic calculation statistics include the systematic difference and the RMS difference between the evaluated data sets. The systematic difference identifies a potential bias whereas the RMS difference provides a measure of agreement between the two data sets. The lower the RMS differences, the closer the methods agree.

A-7
The following data set comparisons were made:
• Rawinsonde to _0, QC flag 0, 5 and 6
• Rawinsonde to _1, QC flag 0, 5 and 6
• RASS _0 to _1 (using the _1 as the assumed “audit” or “standard”)
• Rawinsonde to _0, QC flag 5 and 6 only
• Rawinsonde to _1, QC flag 5 and 6 only
The files included in the comparison and the comparison times are identified below:
While some large maximum differences were observed, the reasons for the differences were not explored. If there were erroneous points in the rawinsonde soundings then they would impact both the _0 and _1 data sets equally.
Rawinsonde file Comparison Time (PST)
Comparison radar files from respective Met _0 and Met _1 data sets (PST)
NTD0927.T04 0500 PHE97270.T1 NTD0927.T06 0600 PHE97270.T1 NTD0927.T10 1100 PHE97270.T1 NTD0927.T17 1700 PHE97271.T1 NTD0927.T22 2300 PHE97271.T1 NTD0928.T05 0500 PHE97271.T1 NTD0928.T11 1100 PHE97271.T1 NTD0928.T16 1700 PHE97272.T1 NTD0928.T23 2300 PHE97272.T1 NTD0929.T04 -- Ambiguous times (not used) NTD0929.T10 1100 PHE97272.T1 NTD0929.T16 1700 PHE97273.T1 NTD0929.T23 2300 PHE97273.T1
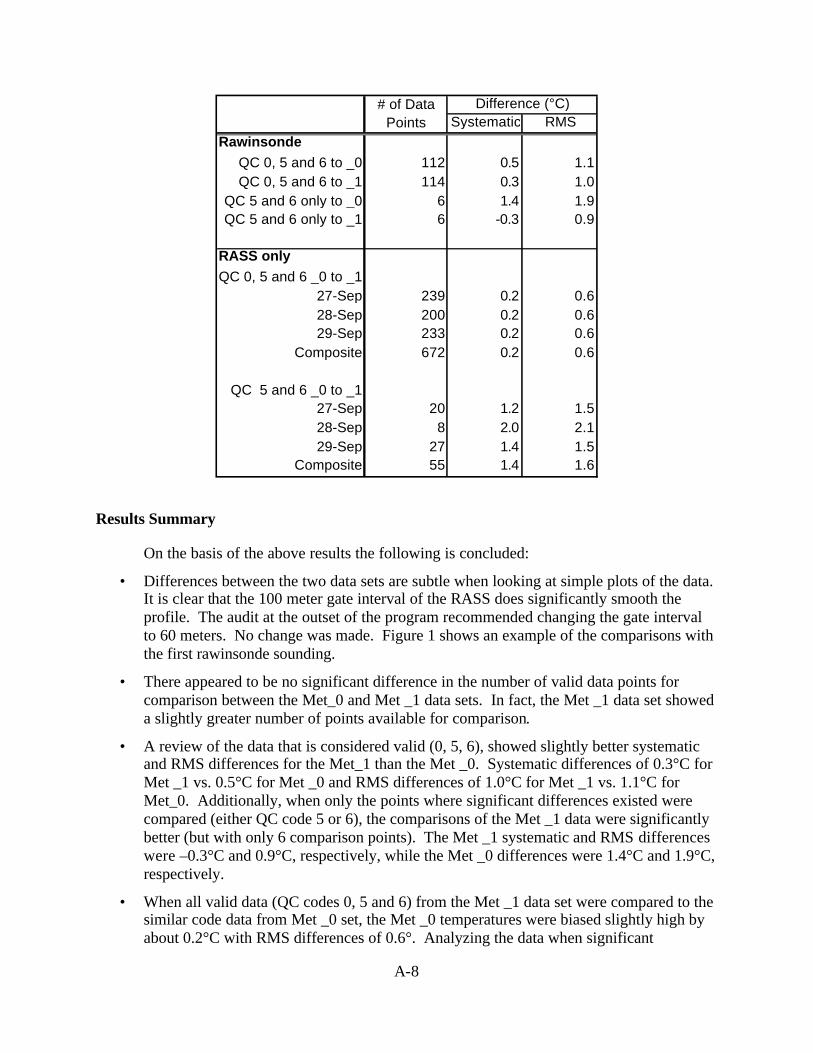
A-8
Systematic RMSRawinsonde
QC 0, 5 and 6 to _0 112 0.5 1.1QC 0, 5 and 6 to _1 114 0.3 1.0
QC 5 and 6 only to _0 6 1.4 1.9QC 5 and 6 only to _1 6 -0.3 0.9
RASS onlyQC 0, 5 and 6 _0 to _1
27-Sep 239 0.2 0.628-Sep 200 0.2 0.629-Sep 233 0.2 0.6
Composite 672 0.2 0.6
QC 5 and 6 _0 to _127-Sep 20 1.2 1.528-Sep 8 2.0 2.129-Sep 27 1.4 1.5
Composite 55 1.4 1.6
# of Data Points
Difference (°C)
Results Summary
On the basis of the above results the following is concluded:
• Differences between the two data sets are subtle when looking at simple plots of the data. It is clear that the 100 meter gate interval of the RASS does significantly smooth the profile. The audit at the outset of the program recommended changing the gate interval to 60 meters. No change was made. Figure 1 shows an example of the comparisons with the first rawinsonde sounding.
• There appeared to be no significant difference in the number of valid data points for comparison between the Met_0 and Met _1 data sets. In fact, the Met _1 data set showed a slightly greater number of points available for comparison.
• A review of the data that is considered valid (0, 5, 6), showed slightly better systematic and RMS differences for the Met_1 than the Met _0. Systematic differences of 0.3°C for Met _1 vs. 0.5°C for Met _0 and RMS differences of 1.0°C for Met _1 vs. 1.1°C for Met_0. Additionally, when only the points where significant differences existed were compared (either QC code 5 or 6), the comparisons of the Met _1 data were significantly better (but with only 6 comparison points). The Met _1 systematic and RMS differences were –0.3°C and 0.9°C, respectively, while the Met _0 differences were 1.4°C and 1.9°C, respectively.
• When all valid data (QC codes 0, 5 and 6) from the Met _1 data set were compared to the similar code data from Met _0 set, the Met _0 temperatures were biased slightly high by about 0.2°C with RMS differences of 0.6°. Analyzing the data when significant
A-9
differences were present between the Met _0 and Met _1 data sets (codes 5 and 6), showed the differences increased with the bias in the temperatures going to 1.4°C, i.e., the Met _0 temperatures were 1.4°C higher.
Conclusion
Given the observed better performance of the Met_1 data set, its use for the coastal stations was recommended. This is supported by the slightly better comparisons to the rawinsonde data during times when the Met_0 and Met_1 data sets both agree and disagree.

A-10
Figure 1. Comparison of the Met_0 and Met_1 data sets. The indicated “Audit” is the volume averaged rawinsonde sounding data.
Met_0 Data set
Met_1 Data set

A-11
DESERT SITE WIND EVALUATION
Comparisons were made for a representative desert site to evaluate the Met_1 algorithm performance and determine if the validation needed to include a review of the original consensus data. The evaluation included data from rawinsondes, original consensus data collected at the site, and processed Met_1 data. The purpose of the analysis was to aid in the development of the data flagging routines to assign data quality flags to the validated data.
A summary of findings for the comparisons performed at Palmdale (PDE) is provided below, followed by an analysis for each sounding set. For the summary and each of the discussions there is reference to the “Region of Consensus” (ROC). The ROC is the region in which the original CNS data reported values that met the consensus criteria. The top of the ROC refers to the level at which the data started to fail the consensus test. Shown below are the rawinsonde data collected at Edwards AFB that was used in the comparisons.
Edwards AFB soundings used in the analysis.
Summary of Comparisons performed at Palmdale (PDE)
On the basis of the comparisons performed it appears that for the PDE site, the use of Met_1 data when there were no consensus data available may lead to erroneous wind estimations, especially in the magnitude of the wind speed. In some cases the wind speed appeared to have been overestimated by as much as a factor of four. This problem was most obvious in the early part of the period. The figure below illustrates the first and second

A-12
comparison periods showing the rawinsonde to Met_1 comparisons. The reason for the observed differences is unclear, but for the 11 soundings compared, at least half had wind speeds more than two to three times the rawinsonde speeds above the ROC. Within the ROC, the speeds and directions generally compared well.
Initial two soundings on 9/27. The level of consensus was about 2500 meters for both soundings. Note the rapid increase in the speeds above the level of consensus.
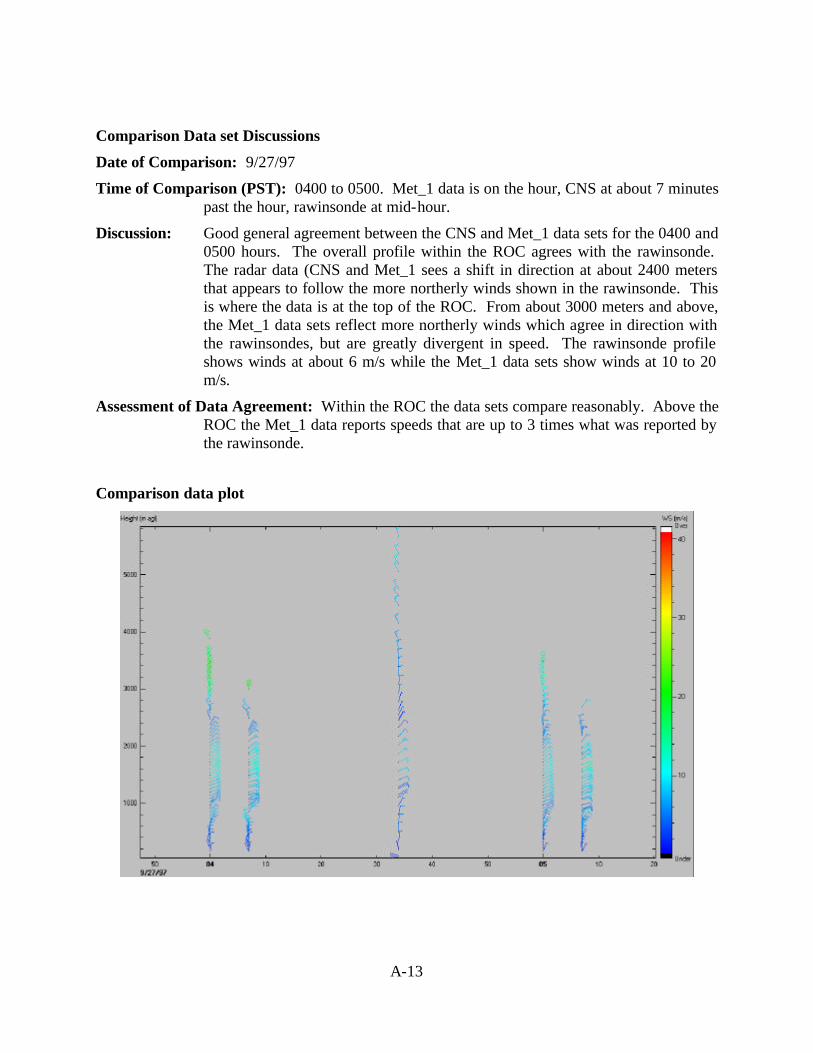
A-13
Comparison Data set Discussions
Date of Comparison: 9/27/97
Time of Comparison (PST): 0400 to 0500. Met_1 data is on the hour, CNS at about 7 minutes past the hour, rawinsonde at mid-hour.
Discussion: Good general agreement between the CNS and Met_1 data sets for the 0400 and 0500 hours. The overall profile within the ROC agrees with the rawinsonde. The radar data (CNS and Met_1 sees a shift in direction at about 2400 meters that appears to follow the more northerly winds shown in the rawinsonde. This is where the data is at the top of the ROC. From about 3000 meters and above, the Met_1 data sets reflect more northerly winds which agree in direction with the rawinsondes, but are greatly divergent in speed. The rawinsonde profile shows winds at about 6 m/s while the Met_1 data sets show winds at 10 to 20 m/s.
Assessment of Data Agreement: Within the ROC the data sets compare reasonably. Above the ROC the Met_1 data reports speeds that are up to 3 times what was reported by the rawinsonde.
Comparison data plot

A-14
Date of Comparison: 9/27/97
Time of Comparison (PST): 1100 to 1200. Met_1 data is on the hour, CNS at about 7 minutes past the hour, rawinsonde at mid-hour.
Discussion: Good general agreement between the CNS and Met_1 data sets for the 1100and 1200 hours with the shift to northwesterly reflected in both the CNS and Met_1 sets. The Met_1 set then continues with relatively strong speeds up to about 4000 meters. In review of the original CNS data for the site I would tend to invalidate the radar data above 2600 meters because of the fall off in the SNR, lower number of values in the consensus and the unrealistically strong wind shear in both speed and direction. The rawinsonde data also shows a direction shear, but matches the direction shear with relatively low wind speeds. Within the region at the top of the ROC the radar data looks questionable. This is supported by the lower speeds seen in the rawinsonde data. Within the ROC all data compares well with direction. Speed differences are seen, but are not unrealistic.
Assessment of Data Agreement: Within the ROC the data sets compare reasonably. For the upper areas of the ROC and above, the Met_1 data reports speeds that are up to 3 times what was reported by the rawinsonde.
Comparison data plot

A-15
Date of Comparison: 9/27/97
Time of Comparison (PST): 1600. Met_1 data is on the hour, CNS at about 7 minutes past the hour, rawinsonde is in between. It should be noted that the rawinsonde file has a time listing of 0000, not 1600. These comparisons were made after adjustment to the 1600 hour.
Discussion: Good general agreement between the CNS and Met_1 data sets. At the top, and above, of the ROC, the wind speeds in the Met_1 data sets are accelerated to more than double what is reported from the rawinsonde. Within the ROC, all data compares well with direction. Speed differences are seen, but are not unrealistic.
Assessment of Data Agreement: Within the ROC the data sets compare reasonably. For the upper areas of the ROC and above, the Met_1 data reports speeds that are more than double what was reported by the rawinsonde. The directions compare reasonably.
Comparison data plot

A-16
Date of Comparison: 9/27/97
Time of Comparison (PST): 2300. Met_1 data is on the hour, CNS at about 7 minutes past the hour, rawinsonde is in between.
Discussion: Good general agreement between the CNS and Met_1 data sets. The agreement between the rawinsonde and radar sets below 2800 meters is good, but deteriorates rapidly above that level. The radar shows a rotation in direction and a strong increase in speeds. The rawinsonde shows the direction rotation but reductions in wind speed are noted. A review of the original consensus data does show the increased speeds and one might consider that data valid based on the good SNR and high number of consensed values. SNRs are generally 0±10 and the number of moments consensed are 6 to 8.
Assessment of Data Agreement: Below about 2400 meters and within the ROC, the data sets compare reasonably. For the upper areas of the ROC and above, the Met_1 and CNS data report speeds that are more than four times what was reported by the rawinsonde. The directions compare reasonably except in the region where the winds rotated from about 2800 to 3400 meters.
Comparison data plot

A-17
Date of Comparison: 9/28/97
Time of Comparison (PST): 1100. Met_1 data is on the hour, CNS at about 7 minutes past the hour, rawinsonde is in between.
Discussion: Good general agreement between the CNS, Met_1 and rawinsonde data sets within the ROC. The top of the ROC appeared to be about 2100 meters, and above that level the rawinsonde winds changed significantly in speed and direction. Rawinsonde winds in the 2800 to 4000 meter region were light and variable while the Met_1 data sets showed a rotation around to the southwest with speeds in the 10 to 15 m/s range.
Assessment of Data Agreement: Below about 2100 meters and within the ROC, the data sets compare reasonably. Above the ROC, the Met_1 data report winds that are significantly different from the rawinsonde.
Comparison data plot

A-18
Date of Comparison: 9/28/97
Time of Comparison (PST): 1600 to 1700. Met_1 data is on the hour, CNS at about 7 minutes past the hour, and the rawinsonde is at about 1635.
Discussion: Good general agreement between the CNS and Met_1 data sets with a shear appearing at about 1800 meters. The rawinsonde profile shows the change starting at about 1900 meters with a rotation around to northerly winds at about 2500 meters. While there is some discontinuity between the radar sets and the rawinsonde, the radar CNS and Met_1 sets are in agreement.
Assessment of Data Agreement: Even with the differences in the transition layer at about 2000 meters, all data sets seem to be within reasonable agreement.
Comparison data plot
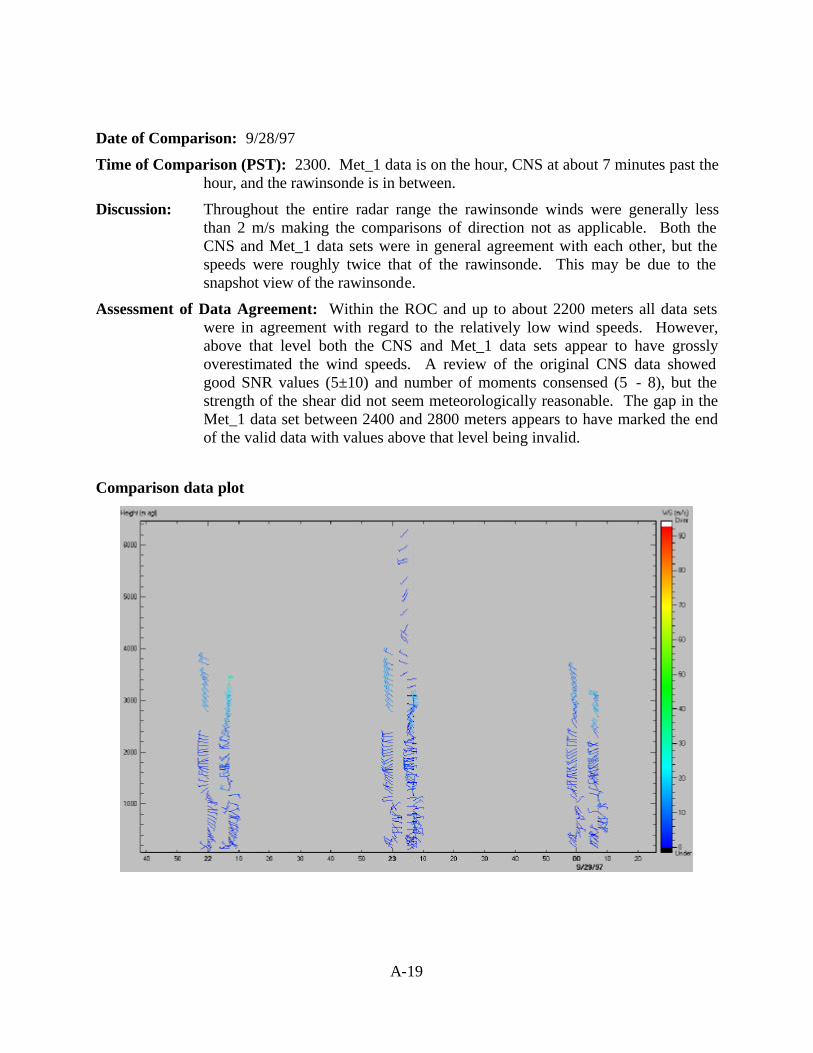
A-19
Date of Comparison: 9/28/97
Time of Comparison (PST): 2300. Met_1 data is on the hour, CNS at about 7 minutes past the hour, and the rawinsonde is in between.
Discussion: Throughout the entire radar range the rawinsonde winds were generally less than 2 m/s making the comparisons of direction not as applicable. Both the CNS and Met_1 data sets were in general agreement with each other, but the speeds were roughly twice that of the rawinsonde. This may be due to the snapshot view of the rawinsonde.
Assessment of Data Agreement: Within the ROC and up to about 2200 meters all data sets were in agreement with regard to the relatively low wind speeds. However, above that level both the CNS and Met_1 data sets appear to have grossly overestimated the wind speeds. A review of the original CNS data showed good SNR values (5±10) and number of moments consensed (5 - 8), but the strength of the shear did not seem meteorologically reasonable. The gap in the Met_1 data set between 2400 and 2800 meters appears to have marked the end of the valid data with values above that level being invalid.
Comparison data plot

A-20
Date of Comparison: 9/29/97
Time of Comparison (PST): 0400 to 0500. Met_1 data is on the hour, CNS at about 7 minutes past the hour, and the rawinsonde is in between.
Discussion: Throughout the entire radar range the rawinsonde winds were generally less than 2 m/s. Between 1500 and 2400 meters there was good agreement between all data sets.
Assessment of Data Agreement: Within the ROC and above there was reasonable agreement between the data sets. The only exception is the apparent rotation of the Met_1 data set at the top in the 0400 data that may not be real. More may be read into the Met_1 data rotation than is supported by the data.
Comparison data plot
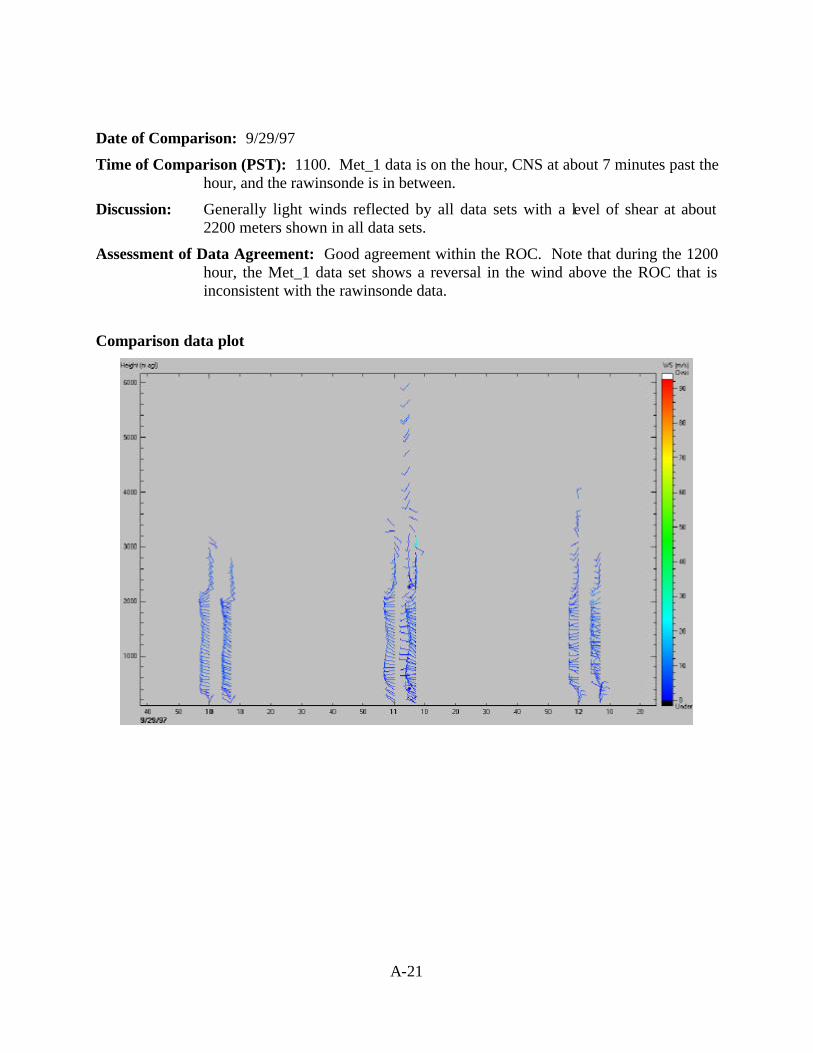
A-21
Date of Comparison: 9/29/97
Time of Comparison (PST): 1100. Met_1 data is on the hour, CNS at about 7 minutes past the hour, and the rawinsonde is in between.
Discussion: Generally light winds reflected by all data sets with a level of shear at about 2200 meters shown in all data sets.
Assessment of Data Agreement: Good agreement within the ROC. Note that during the 1200 hour, the Met_1 data set shows a reversal in the wind above the ROC that is inconsistent with the rawinsonde data.
Comparison data plot
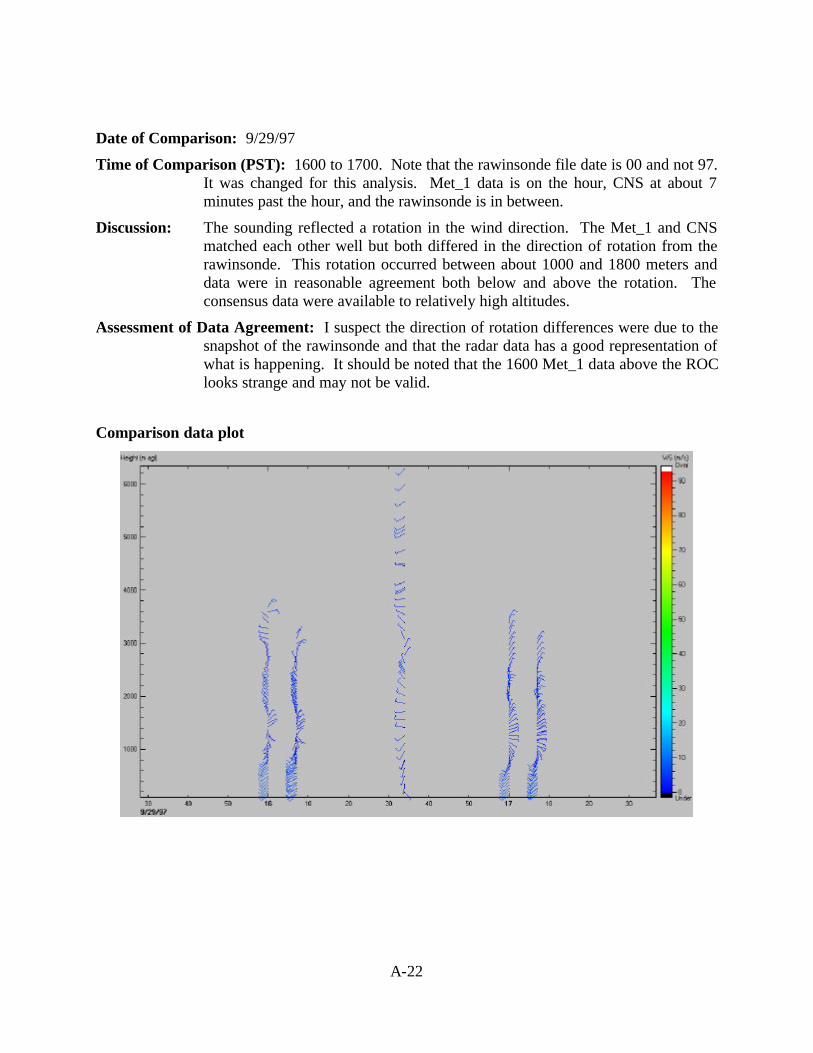
A-22
Date of Comparison: 9/29/97
Time of Comparison (PST): 1600 to 1700. Note that the rawinsonde file date is 00 and not 97. It was changed for this analysis. Met_1 data is on the hour, CNS at about 7 minutes past the hour, and the rawinsonde is in between.
Discussion: The sounding reflected a rotation in the wind direction. The Met_1 and CNS matched each other well but both differed in the direction of rotation from the rawinsonde. This rotation occurred between about 1000 and 1800 meters and data were in reasonable agreement both below and above the rotation. The consensus data were available to relatively high altitudes.
Assessment of Data Agreement: I suspect the direction of rotation differences were due to the snapshot of the rawinsonde and that the radar data has a good representation of what is happening. It should be noted that the 1600 Met_1 data above the ROC looks strange and may not be valid.
Comparison data plot

A-23
Date of Comparison: 9/29/97
Time of Comparison (PST): 2300. Met_1 data is on the hour, CNS at about 7 minutes past the hour, and the rawinsonde is in between.
Discussion: A wind shear was present throughout the entire sounding with CNS data available up to about 2500 meters. Throughout this region there was reasonable agreement.
Assessment of Data Agreement: Above the level of consensus, the Met_1 data showed another wind shear that was contrary to what is shown in the rawinsonde sounding. Since there are no consensus data in this region, one may conclude that the Met_1 data may be erroneous.
Comparison data plot

A-24
DESERT SITE RASS EVALUATION
Comparisons were made evaluating the RASS data from the Thermal site to two rawinsondes collected by the ARB audit team. The two rawinsonde soundings were performed at 1900 PST on 9/23/97 and 0800 PST on 9/24/97. Data from the soundings were edited to remove data points that dropped in altitude while the balloon was ascending. The analysis used the QC flags of 0, 5 and 6 as a valid data points in the analyses. While the codes of 5 and 6 are not officially labeled as valid, those codes were assigned when significant differences between the Met_0 and Met_1 data sets were present, or one or the other had missing data.
All analyses were performed in PST. Both of the rawinsonde soundings had altitudes that jumped down during the ascent and the “falling” points were removed before comparisons were made. For the two rawinsonde soundings, statistical comparisons were made between the RASS virtual temperatures and the corresponding hourly reported RASS data. The RASS gate volume was assumed to include the altitude from half way below to halfway above the reported gate. For example, with gate spacing of 100 meters, the RASS data at 300 meters would include the volume from 250 to 350 meters. All available rawinsonde data points that fell within this volume during the averaging hour were arithmetically averaged to obtain a comparison point to the RASS data.
The basic calculation statistics include the systematic difference and the RMS difference between the evaluated data sets. The systematic difference identifies a potential bias whereas the RMS difference provides a measure of agreement between the two data sets. The lower the RMS differences, the closer the methods agree.
The following data set comparisons were made:
1. Rawinsonde to Met_0, QC flag 0, 5 and 6
2. Rawinsonde to Met_1, QC flag 0, 5 and 6
3. RASS Met_0 to Met_1 (using the Met_1 as the assumed “audit” or “standard”)
The files included in the comparison and the comparison times are identified below:
Rawinsonde file Comparison Time (PST)
Comparison radar files from respective Met_0 and Met_1 data sets (PST)
TML0923.T19 1900 TML97266.T1 TML0924.T08 0800 TML97267.T1
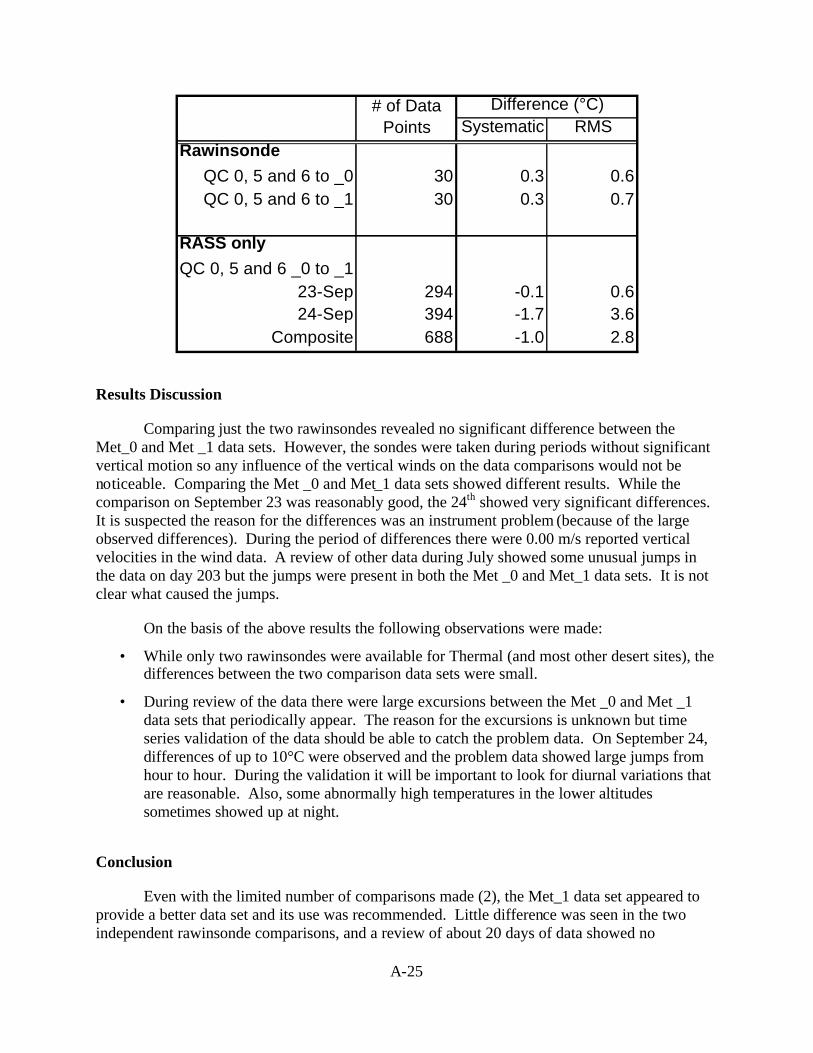
A-25
Systematic RMSRawinsonde
QC 0, 5 and 6 to _0 30 0.3 0.6QC 0, 5 and 6 to _1 30 0.3 0.7
RASS onlyQC 0, 5 and 6 _0 to _1
23-Sep 294 -0.1 0.624-Sep 394 -1.7 3.6
Composite 688 -1.0 2.8
# of Data Points
Difference (°C)
Results Discussion
Comparing just the two rawinsondes revealed no significant difference between the Met_0 and Met _1 data sets. However, the sondes were taken during periods without significant vertical motion so any influence of the vertical winds on the data comparisons would not be noticeable. Comparing the Met _0 and Met_1 data sets showed different results. While the comparison on September 23 was reasonably good, the 24th showed very significant differences. It is suspected the reason for the differences was an instrument problem (because of the large observed differences). During the period of differences there were 0.00 m/s reported vertical velocities in the wind data. A review of other data during July showed some unusual jumps in the data on day 203 but the jumps were present in both the Met _0 and Met_1 data sets. It is not clear what caused the jumps.
On the basis of the above results the following observations were made:
• While only two rawinsondes were available for Thermal (and most other desert sites), the differences between the two comparison data sets were small.
• During review of the data there were large excursions between the Met _0 and Met _1 data sets that periodically appear. The reason for the excursions is unknown but time series validation of the data should be able to catch the problem data. On September 24, differences of up to 10°C were observed and the problem data showed large jumps from hour to hour. During the validation it will be important to look for diurnal variations that are reasonable. Also, some abnormally high temperatures in the lower altitudes sometimes showed up at night.
Conclusion
Even with the limited number of comparisons made (2), the Met_1 data set appeared to provide a better data set and its use was recommended. Little difference was seen in the two independent rawinsonde comparisons, and a review of about 20 days of data showed no

A-26
significant differences other than the occasional excursions that should be identified in the data validation. Additionally, performing a simple time series observation of hour to hour in a type of animation, the Met _1 showed a smoother transition from hour to hour while the Met_0 jumped more. From the overview performed it appears that the Met_0 was more susceptible to both the small and large excursions, and had more noise in the observed profile.