Embed Size (px)
Citation preview

EXAMINING THE ROLE OF HEDGEHOG SIGNALING IN THE
PANCREATIC TUMOR MICROENVIORNMENT
by
Joseph Scott Dosch
A dissertation submitted in partial fulfillment
of the requirements for the degree of
Doctor of Philosophy
(Cellular and Molecular Biology)
in the University of Michigan
2011
Doctoral Committee:
Professor Charles Burant, Co-Chair
Professor Diane M. Simeone, Co-Chair
Professor Andrzej A. Dlugosz
Professor Eric R. Fearon
Professor Deborah L. Gumucio
Professor Sean Morrison

© Joseph Scott Dosch
2011

ii
To Kim, Erik, and all of my friends and family,
thanks for all of your love and support.

iii
ACKNOWLEDGEMENTS
I owe a great amount of thanks to my primary mentor Chuck Burant. Your
enthusiasm for science is infectious and under your guidance I feel as if I’ve acquired
the tools to tackle any problem in my future scientific career. I also owe a lot of
thanks to my co-mentor Diane Simeone and the members of the Simeone lab who
have engaged me in great discussions and are constantly challenging me to take my
research to the next level. Last, but certainly not least, I want to say thanks to my
wonderful wife Kimberley and my son Erik. Thanks for supporting me in good times
and bad, I could not have done this without you.

iv
PREFACE
The work described in this thesis represents both peer-reviewed and
manuscript-in preparation, first author data that I have generated as a graduate student
at the time of my thesis defense – April 25th
, 2011. For Chapter 2, I performed all of
the in vitro and in vivo experiments with the Hh pathway antagonist drugs provided
by Genentech. Histology was performed by Jimmy Hogan of the Pasca lab at the
University of Michigan. For Chapter 3, the Pasca lab assisted in the creation of the
mouse pancreatic stellate cell (MPSC) lines. Erin Shellman processed the raw
microarray data for the Shh treated MPSC lines and assisted in the data analysis by
Ingenuity Pathway Analysis (IPA). In Chapter 4, Wnt2 knock-out studies were
performed by Jingjiang Wu and clinical trial data was provided by Edward Kim.
Chapter 1 represents background and hypotheses that were the aim of my
thesis work. Parts of this chapter were taken from excerpts of Pancreatic cancer and
hedgehog pathway signaling: new insights. Pancreatology;10(2-3):151-7 [1]. I was
the first author of this review. Chapter 2 details work performed with primary human
pancreatic xenografts and their treatment with HhAntag (Hh pathway antagonist), the
chemotherapeutic agent gemcitabine and a combination of the two drugs. This work
is currently in preparation for a manuscript submission and I will be the first author.
Chapter 3 details our work in identifying the Hh pathway responsive genes in the
pancreatic mesenchyme using microarray analysis and primary activated pancreatic
stellate cell lines that were generated in our lab. This work is also in preparation for a

v
manuscript submission where I will be the first author. Chapter 4 details a
comprehensive review of the data from our experiments and present on-going studies,
including a clinical trial for Hh inhibitors for pancreatic cancer. All the work
described in this thesis was performed under the guidance of Dr. Charles Burant and
Dr. Diane Simeone.

vi
TABLE OF CONTENTS
DEDICATIONS. .................................................................. Error! Bookmark not defined.
ACKNOWLEDGEMENTS ................................................ Error! Bookmark not defined.
PREFACE ............................................................................. Error! Bookmark not defined.
LIST OF FIGURES ....................................................................................................... viii
LIST OF TABLES ............................................................................................................ x
ABSTRACT ...................................................................................................................... xi
CHAPTER 1: INTRODUCTION ....................................... Error! Bookmark not defined.
HEDGEHOG SIGNALING PATHWAY ....................................................................... 6
HEDGEHOG PATHWAY IN NORMAL PANCREATIC DEVELOPMENT ............. 9
HEDGEHOG PATHWAY ACTIVATION IN PANCREATIC CANCER ................ 10
BIOLOGICAL ROLE OF PARACRINE HEDGEHOG SIGNALING IN
PANCREATIC CANCER ............................................................................................ 14
HEDGEHOG PATHWAY AND CANCER STEM CELLS ........................................ 17
CLINICAL INHIBITORS OF THE HEDGEHOG PATHWAY ..................................... 21
CHAPTER 2: INHIBITION OF PARACRINE HEDGEHOG SIGNALING IN
HUMAN PANCREATIC ADENOCARCINOMA XENOGRAFTS .............................
SUMMARY .................................................................................................................. 29
INTRODUCTION ........................................................................................................ 30
MATERIALS AND METHODS .................................................................................. 32
RESULTS ..................................................................................................................... 36
DISCUSSION ............................................................................................................... 43
ACKNOWLEDGMENTS ............................................................................................ 48
CHAPTER 3: PARACRINE HEDGEHOG SIGNALING ACTIVATES CELL
MOTILITY PROGRAMS IN PANCREATIC STELLATE CELLS ............................
SUMMARY .................................................................................................................. 61
INTRODUCTION ........................................................................................................ 62

vii
MATERIALS AND METHODS .................................................................................. 64
RESULTS ..................................................................................................................... 68
DISCUSSION ............................................................................................................... 74
ACKNOWLEDGMENTS ............................................................................................ 79
CHAPTER 4: CONCLUSIONS AND FUTURE DIRECTIONS ...................................
SUMMARY .................................................................................................................. 98
CONCLUSIONS........................................................................................................... 99
ACKNOWLEDGMENTS .......................................................................................... 117
BIBLIOGRAPHY ......................................................................................................... 123

viii
LIST OF FIGURES
Figure 1.1 Pathology of Pancreatic Ductal Adenocarcinoma Progression ...................... 24
Figure 1.2 Progression Model of Pancreatic Cancer ........................................................ 25
Figure 1.3 Diagram of Canonical Hh Pathway Activation .............................................. 26
Figure 1.4 Expression of Shh in Human Pancreatic Adenocarcinoma ............................ 27
Figure 1.5 Paracrine Mechanism for Hedgehog Pathway Activation .............................. 28
Figure 2.1 Paracrine Hh Signaling in Human PDA Xenografts ...................................... 49
Figure 2.2 HhAntag Treatment Targets Hh Signaling in the Tumor Stroma .................. 50
Figure 2.3 Evidence of Differentiation for Tumors UM-PDA#1 and #2 following
HhAntag and Gemcitabine Treatment .............................................................................. 53
Figure 2.4 HhAntag Treatment Decreases Incidence of Distant Metastases ................... 55
Figure 2.5 Analysis of CD44+/CD24
+/ESA
+ Cells Following HhAntag
Treatment .......................................................................................................................... 57
Figure 2.6 Histological Analysis of Patient PDA Biopsy Before and After Treatment
with GDC-0449 ................................................................................................................. 58
Figure 3.1 Generation of Mouse Pancreatic Stellate Cell Lines ...................................... 82
Figure 3.2 Transcriptional Profiling of Shh-Regulated Target Genes in Mouse
Pancreatic Stellate Cells (MPSCs) .................................................................................... 83
Figure 3.3 Pathway Analysis of Shh-regulated Target Genes in MPSCs ........................ 85
Figure 3.4 Shh-regulated Expression of Hedgehog Target Genes in MPSCs. ................ 87
Figure 3.5 Shh-regulated Expression of Hedgehog Target Genes in Mouse
Embryonic Fibroblasts (MEFs) ........................................................................................ 88
Figure 3.6 Paracrine Hh Signaling Regulates 2D and 3D invasion of MPSCs in
Extracellular Matrix .......................................................................................................... 89

ix
Figure 4.1 Histological Comparison of Patient vs. Cell Line Xenografts ..................... 121
Figure 4.2 Bioluminescent Imaging (BLI) of Pancreatic Ductal Adenocarcinoma ....... 122
Figure 4.3 Differential Expression of Wnt ligands in Shh-treated PSCs ....................... 123
Figure 4.4 Knockdown of Wnt2 Decreases 2D Migration of Shh-stimulated PSCs ..... 123
Figure 4.5 Clinical Trial of GDC-0449 in Patients with Metastatic Pancreatic Cancer 124
Figure 4.6 Model for Paracrine Hh Signaling in the Pancreatic Tumor
Microenvironment........................................................................................................... 125

x
LIST OF TABLES
Table 2.1 Origin, stage, and pathology of human pancreatic ductal adenocarcinoma
tumors included in this study………………………………………………………...59
Table 2.2 Quantitative expression (qRT-PCR) of Hh pathway genes and cancer stem
cell profiles of human PDA xenografts used in this study…………………………...60
Table 3.1 Genes differentially regulated by Shh-treatment in Immortomouse-derived
MPSCs……………………………………………………………………………….87

xi
ABSTRACT
EXAMINING THE ROLE OF HEDGEHOG SIGNALING IN THE
PANCREATIC TUMOR MICROENVIRONMENT
by
Joseph Scott Dosch
Co-Chair: Charles Burant
Co-Chair: Diane Simeone
The Hedgehog (Hh) pathway is a conserved signaling network that plays a
critical role during embryonic development as well as in the maintenance of adult
tissues. Inappropriate activation of Hh signaling has been linked in the development
of several tumors, including pancreatic cancer. In the context of pancreatic cancer,
Hh pathway ligands secreted by the tumor cells activate this pathway in the tumor
mesenchyme by a paracrine mechanism. As the role of Hh signaling in the tumor
mesenchyme is not fully understood, we initiated two strategies to understand how
active Hh signaling promotes pancreatic carcinogenesis. In a first approach, we used
Hh pathway inhibitors to down-regulate paracrine Hh signaling in an orthotopic
xenograft model of human pancreatic adenocarcinoma to test how this pathway is
involved in tumor growth and progression. These experiments revealed that blocking
Hh signaling in the tumor stroma leads to a significant reduction in the ability of

xii
tumor cells to form metastases, along with affecting signals that are important in
maintaining the differentiation status of the tumor cells. Second, we established a
primary in vitro model of paracrine Hh signaling in pancreatic stellate cells. Using
bioinformatics analysis we found that paracrine Hh signaling activates an invasive
gene signature in pancreatic stellate cells. This was confirmed by three-dimensional
invasion assays in vitro. Several clinical trials for Hh pathway inhibitors, including
here at the University of Michigan Medical Center, have been initiated for testing the
efficacy of targeting paracrine Hh signaling in the treatment of pancreatic cancer.
Our studies established important in vivo and in vitro models to ask important
questions about the role of paracrine Hh signaling in pancreatic cancer progression.
These studies add insight to how targeting this pathway may provide important
therapeutic benefit to pancreatic cancer patients.

1
CHAPTER 1
INTRODUCTION
Pancreatic cancer is the 4th
leading cause of cancer death in the United States
with a 5-year survival of less than 6% [2]. The National Cancer Institute estimates
that 43,140 Americans will be diagnosed with the disease and 36,800 will succumb to
it in 2010 (www.seer.cancer.gov). The age-adjusted incidence of the disease is higher
in men vs. women (13.3 per 100,000 men vs. 10.5 per 100,000 women) and in
African-American men vs. Caucasian men (16.7 per 100,000 men vs. 13.2 per
100,000 men). The risk factors for developing pancreatic cancer include advanced
age, cigarette smoking, alcohol consumption, diabetes, obesity and a family history of
the disease [3,4,5,6].
Pancreatic tumors can have a varying histological profile that includes
adenosquamous carcinoma, colloid carcinoma, hepatoid carcinoma, medullary
carcinoma, signet-ring cell carcinoma, undifferentiated carcinoma, and
undifferentiated carcinoma with osteoclast-like giant cells [7]. Some of these
histologies correspond to a poorer prognosis, for instance, adenosquamous and
undifferentiated carcinoma, while others have better prognosis, such as colloid and
medullary carcinoma [7]. The most common form of pancreatic cancer is infiltrating
ductal adenocarcinoma. Pancreatic cancer is characterized by a glandular neoplastic
epithelium surrounded by an intense desmoplastic reaction, which in many cases, the

2
cells in the stromal compartment greatly outnumbers the amount of tumor cells
present in the tumor (Figure 1.1) [8]. The tumor cells express a variety of
cytokeratins (cytokeratins 7, 8, 13, 18, and 19) and several serum carbohydrate
antigens, such as carbohydrate antigen 19–9 (CA19–9) that are used as markers in the
diagnosis and follow-up of pancreatic cancer patients [9,10,11]. Additionally, these
tumors express several mucins; heavily glycosylated, high-molecular weight
glycoproteins which protect the surface of epithelial tissues and have been associated
with promoting the invasive and metastatic ability of several tumor types [12]. In
pancreatic cancer, the aberrant expression of mucins including MUC1, MUC3,
MUC4, and MUC5AC have been identified, with MUC4 expression correlating
strongly with advanced pancreatic disease [10,13].
While the cell of origin of pancreatic adenocarcinoma is still a matter of
debate, there is general consensus on a progression model for this disease. The most
common precursor lesions of pancreatic cancer are known as PanINs (Pancreatic
Intraepithelial Neoplasias) and are classified from 1A to 3 (the latter representing
carcinoma in situ) based on defined histological characteristics [14]. Genetic
alterations in PanIN lesions and pancreatic cancer have been the subject of numerous
studies. The defining mutation of human pancreatic cancer which is found in greater
than 80-90% of pancreatic cancers is a single amino acid change in the KRAS gene,
often in codon 12 or 13 that will generate a constitutively active form of the protein
[15,16]. The Ras signaling pathway includes a number of GTPases that control
signaling for many important cell functions, including proliferation, cell migration,
adhesion, and apoptosis.
3
While the KRAS mutation is considered an important early “hit” in the
development of pancreatic cancer, this mutation alone is not sufficient to drive the
progression of invasive pancreatic adenocarcinoma. Transgenic animals with a
conditionally activated mutant KRASG12D
under the control of pancreas-specific
promoters PDX-1 or p48 results in animals that develop high grade PanIN lesions (up
to PanIN-3) at 7 to 10 months of age, but few animals spontaneously progress to
invasive carcinoma [17]. Further progression of the disease requires additional
mutations or loss of tumor suppressor genes such as p53, p16Ink4a
, BRCA2, and
DPC4, a component of the TGFβ signaling pathway (Figure 1.2) [18,19,20].
The treatment options for patients diagnosed with pancreatic adenocarcinoma
are relatively poor. At the time of diagnosis, more than 85% of tumors have extended
beyond the organ margins, starting with invasion into the peritoneum and local lymph
nodes and then commonly followed by metastases to the liver [21]. Patients with
evidence of metastatic disease and/or tumor encasement of the mesenteric vasculature
are not considered candidates for surgical resection and undergo largely palliative
chemotherapeutic regimens that include the nucleoside analog, gemcitabine. Recent
clinical trials that have utilized FOLFIRINOX, a chemotherapeutic regimen
consisting of the drugs 5-FU (Fluorouracil), leucovorin (folic acid), irinotecan
(topoisomerase inhibitor), and oxaliplatin extended the survival of metastatic
adenocarcinoma patients for an additional 4 months compared to treatment with
gemcitabine alone [22]. However, these treatments do not offer a cure, and all
patients will eventually succumb to metastatic disease.

4
For the minority of patients with resectable disease, the complete surgical
resection of the adenocarcinoma represents the only option for long-term survival.
Surgical removal of the tumor is usually performed by a Whipple procedure
(pancreaticoduodenectomy) for tumors arising in the head of the pancreas or by distal
pancreatectomy for tumors in the body and tail of the pancreas [23]. Following
surgical resection, patients are treated with a chemotherapeutic regimen that often
includes platinum-based therapy along with the nucleoside analog, gemcitabine.
However, adjuvant chemotherapy only affords patients with an additional survival
benefit of two months compared to surgery alone [24].
Numerous clinical trials have been initiated to identify compounds that will
improve patient survival that include: platinums; fluoropyrimidines; topoisomerase
inhibitors; and various targeted agents including tipifarnib (farnesyltransferase
inhibitor), marimastat (matrix metalloproteinase inhibitor), cetuximab (epidermal
growth factor receptor (EGFR) inhibitor), erlotinib (tyrosine kinase inhibitor), and
bevacizumab (anti-vascular endothelial growth factor A (VEGF-A) inhibitor)
[25,26,27,28]. However, these trials have provided very limited survival benefit to
pancreatic cancer patients. The failure of these trials underscores our need to better
understand the biology of the disease and the important pathways involved in tumor
progression.
The Hedgehog (Hh) pathway has emerged as one of the most widely studied
signaling networks due to its important role in human development and disease. In
the development of the normal pancreas, Hh signaling is restricted; however, in the
adult organ the pathway is important for the proper function of the insulin-producing
5
endocrine cells [29]. Several studies have identified the abnormal expression of Hh
ligands, Sonic and Indian Hedgehog, in early PanIN lesions and in invasive
adenocarcinoma cells [30,31]. Importantly, these ligands have been shown not to
activate Hh signaling in pancreatic cancer cells directly, but rather to activate the
pathway in the tumor mesenchyme via a paracrine mechanism [32]. However, we
know very little about the Hh pathway target genes that are affected in the tumor
mesenchyme and how these genes may be part of a feedback loop that enhances the
progression of the tumor. Recent work that parallels our own studies have suggested
that currently available inhibitors of the pathway are only effective in down-
regulating the paracrine Hh signaling in the tumor mesenchyme and not Hh signaling
in the tumor cells [33]. These studies pose some very important questions for the
field that will be detailed in this thesis: Is active Hh signaling in the tumor
mesenchyme required for pancreatic tumor progression? What is the biological
significance of Hh activation in the pancreatic mesenchyme? What are the Hh
pathway responsive genes in the pancreatic stroma? Do these genes play a role in
tumor metastasis, differentiation, or maintenance of a cancer stem cell population?
Can targeting this pathway provide any therapeutic benefit to pancreatic cancer
patients? These questions are at the forefront of pancreatic tumor biology and have
significant implications for treatment of patients with pancreatic cancer, as Hh
pathway inhibitors are entering human clinical trials.
In this thesis, I will describe how a clinically relevant Hh pathway inhibitor,
HhAntag, affects primary human pancreatic tumor xenografts and how these data
may give us clues to how patients may benefit from targeting paracrine Hh signaling

6
in pancreatic adenocarcinoma. Additionally, I will detail an in vitro model system
that has allowed us to test how paracrine signaling from the tumor cells affects the
function of primary pancreatic mesenchymal cells. Finally, I will detail experiments
to identify the Hh responsive gene signature in pancreatic mesenchymal cells and
describe my bioinformatics analysis approach to demonstrate how paracrine Hh
signaling activates an invasive gene signature in these cells. Taken together, the data
described in this thesis will present a comprehensive analysis of the role for paracrine
Hh signaling in the pancreatic adenocarcinoma microenvironment.
HEDGEHOG SIGNALING PATHWAY
The Hedgehog pathway plays a critical role during development and
specification of embryonic tissues and organs. Signaling occurs through autocrine
and paracrine activation of cell surface receptors by peptide ligands. In the
mammalian system, active signaling is stimulated by three known ligands: Sonic
hedgehog (Shh), Indian hedgehog (Ihh), and Desert hedgehog (Dhh). As each ligand
enters the secretory machinery, each protein is modified by addition of a palmitoyl
group to its N-terminus and cholesterol to its C-terminus [34]. Shh is the most
widely studied Hh pathway ligand with expression observed in the gut, nervous
system, skin, and in limb bud [35,36]. Ihh is expressed in components of bone, along
with the gut and pancreas, while Dhh has been found in neuronal compartments,
testes and the pancreas [35]. Each ligand can equally activate the pathway and
initiate expression of downstream Hh pathway target genes; however some Hh
ligands may have greater potency of pathway activation in some cell types [37].

7
In the absence of ligand, the Hh ligand receptor Patched1 (Ptch1), which is
located on the plasma membrane, represses the activity of the transmembrane protein
Smoothened (Smo), through a mechanism that is still not clearly understood. To
further control the activation of the pathway, protein kinases in the cytoplasm, such as
Protein Kinase A (PKA) and Glycogen Synthase Kinase 3β (GSK3β), phosphorylate
the Gli family transcription factors. This leads to proteosome-mediated cleavage of
Gli into an N-terminal truncated form, which acts as a repressor of a subset of Hh
target genes [38,39] (Figure 1.3 A). In the mammalian system, there are three known
Gli transcription factors, Gli1, Gli2 and Gli3. Gli3 has been shown to demonstrate
the role of a repressor, while Gli2 can be either an activator or repressor depending on
the context, and Gli1 has been found to be an exclusive transcriptional activator [40].
Suppressor of fused (Sufu) is a conserved protein that can act as another negative
regulator of the Hh pathway by binding to Gli transcription factors, both in the
cytoplasm and in the nucleus, to prevent these factors from activating Hh target genes
[41,42]. Conversely, ligand binding to Ptch1 releases the repression of Smo and a
signaling cascade downstream of Smo leads to processing of the Gli transcription
factors, predominantly Gli2, as an activator allows these proteins to translocate to the
nucleus and activate the transcription of downstream target genes (Figure 1.3 B) [43].
It is not entirely clear how Smo leads to the activation of Gli transcription
factors in mammalian cells. In Drosophila, ligand binding to Patched releases a
Hedgehog signaling complex that is attached to microtubules and membranes and is
composed of the activating transcription factor Cubitus interruptus (Ci), the kinase
Fused (Fu) and the kinesin-like protein Costal2 (Cos2) [44,45]. Following the release

8
of this complex, Smo is stabilized by phosphorylation at its C-terminal tail by PKA
and Casein Kinase I (CKI), which are bound by Cos2, along with GSK3β [46]. The
three kinases are then released and can no longer process Ci into a repressor form,
and the full-length Ci protein is able to translocate to the nucleus to active
downstream target genes. In mammalian systems, Smo is found to be phosphorylated
by the GPCR kinase GRK2 and is likely involved with other kinases in the
stabilization of Smo in the context of Hh ligand stimulation [47,48]. The
phosphorylation of Smo causes the receptor to traffic to the cell membrane in the
primary cilium of the cell where the concentration of Gli transcription factors along
with other co-factors, possibly Kif7, promotes the processing of Gli peptides into
activating factors [49,50].
Recent studies have focused on the role of primary cilia in the transduction of
Hh pathway signaling. In the absence of ligand, Ptch receptors are located in the
primary cilia and prevent the accumulation of Smo in the cilia; however, following
ligand binding to Ptch, these roles are reversed and Ptch receptors are shuttled out of
the cilia while Smo receptors are concentrated in their place [51]. Gli transcription
factors are also known to shuttle in and out of the primary cilia. The primary cilia
appear to be able to form a signaling center that brings together Hh signaling
components to coordinate the dynamic interactions among Hh signaling components
that lead to the processing of Gli factors into either an activator or repressor form.
Among the best-characterized target genes associated with active Hh
signaling are components of the pathway itself, including Gli1, Ptch1 and the Hh-
interacting protein, Hhip. Gli1 as a target gene is specifically expressed to amplify

9
the initial Hh pathway signal and can be used as a reliable read-out for Hh pathway
activity. Hhip, Ptch1 and the growth arrest specific protein 1, Gas1 are target genes
that are expressed to regulate the negative feedback of Hh signaling by sequestering
Hh ligands from stimulating Ptch receptors [52,53]. This ensures that the activity
level of the Hh pathway is tightly regulated through a feedback mechanism.
Depending on the cellular context, other downstream targets include cell proliferation
and survival factors Cyclin D and Cyclin E, Bcl-2, angiogenesis related proteins
vascular endothelial growth factor A (VEGF-A) and angiopoietins-1/2, and epithelial-
to-mesenchymal transition (EMT) related factor SNAIL [54,55,56].
HEDGEHOG PATHWAY IN NORMAL PANCREATIC DEVELOPMENT
Active Hh signaling is required during the early embryonic specification of
the gastrointestinal tract, with the notable exception of the pancreas, where Hh
activity is repressed by activin βB and FGF2 signals released by the notochord [57].
This down-regulation of the Hh pathway is critical for pancreatic development as
forced expression of Shh in the pancreatic anlage results in agenesis of the pancreas
in mouse embryos [58]. Conversely, repression of Hh signaling in areas of the
developing gut that normally express Hh pathway genes results in ectopic expression
of pancreas-specific genes in the stomach and intestine [59]. While repressed during
the early specification of cell types in the pancreatic buds, recent work using
Patched1-LacZ transgenic mice, have identified expression of the Hh pathway
expression via β-galactosidase (β-gal) staining as early as e10.5 in pancreatic
epithelial cells along with some sporadic mesenchymal cell staining [29]. Patched1

10
staining increases during pancreatic development, however it later becomes restricted
to the developing endocrine cells and pancreatic ducts. Other studies have shown that
additional signaling components including Ihh, Dhh, and Hhip are sporadically
expressed around e14.5 in the developing pancreatic epithelium [60].
In the adult pancreas, Hh pathway activity is typically very low and restricted
to expression of Ihh, Dhh, Smo and Ptch1 in the islets housing the endocrine cells of
the organ [60,61]; however more widespread Hh signaling can be activated under
circumstances such as injury or disease [62]. Recent work has also demonstrated that
Hh signaling is required for adult pancreatic function, specifically in the endocrine
cells of the islet. By developing a transgenic animal carrying a pancreatic epithelium
specific promoter (Pdx-1) driving cre recombinase along with a “floxed” Smoothened
gene the authors produced an animal with normal pancreatic morphology, but
impaired Hh signaling in the pancreatic islets. Specifically, these animals do not
secrete insulin to levels comparable in wild-type animals and they developed a
glucose intolerant phenotype [29]. These results provide another layer of our
understanding in the role of Hh signaling in the pancreas, specifically its role in
maintaining normal endocrine pancreatic function.
HEDGEHOG PATHWAY ACTIVATION IN PANCREATIC CANCER
Activation of the Hh pathway in primary human pancreatic cancer was first
reported in two parallel studies [30] and [31]. The aberrant over-expression of the Hh
pathway ligands, Sonic and Indian Hedgehog was identified in about 70% of human
pancreatic cancer cases as well as in the majority of pancreatic cancer cell lines
11
(Figure 1.4) [31]. A similar mechanism of pathway activation has been described for
prostate [63] and lung cancer [64], which differs from the mutation-driven activation
of the Hh signaling pathway that has been well characterized in basal cell carcinoma
(BCC) and medulloblastoma [65,66].
A deeper insight on the role of Hh signaling in pancreatic cancer, and its
relationship with other oncogenic pathways, has been obtained through the study of
mouse models of this disease. The most representative mouse models of pancreatic
cancer are based on the expression of a mutated form of the KRAS gene, which
mimics what is found in primary human cancers, specifically in the developing
pancreatic epithelium [67,68]. In these transgenic animals, PanIN lesion
development and progression closely resemble the human disease and interestingly
Shh ligand is expressed in the majority of mouse PanINs even in very early
developing lesions. Similar activation of the Hh pathway following initiation of the
disease using KRAS mutation has been observed in a zebrafish model of pancreatic
cancer [69].
In these disease models, Hh pathway activation is downstream of KRAS
signaling. Some possible insight into the mechanism of Hh activation by oncogenic
KRAS is provided by studies indicating that Shh may be a downstream target of NF-
κB [70]. NF-κB is up-regulated in response to inflammatory stimuli and cellular
stress, conditions found in the inflamed and fibrotic environment of early-stage tumor
lesions. Detailed study of the Shh promoter and upstream region revealed multiple
NF-κB binding sites that were able to activate transcriptional activity of Shh in both
12
in vitro and in vivo models [71]. This study implies that NF-κB serves as a link
between oncogenic KRAS and Hh signaling.
Other mouse models have more directly addressed the role of Hh signaling in
pancreatic cancer. Initial examination of the role of Hh signaling in the pancreas was
examined in transgenic animals expressing Shh in the pancreatic epithelia using the
PDX1 promoter that drives expression to the early developing pancreatic epithelium.
These animals displayed lesions that closely resembled human PanINs and showed
elevated expression of HER2/neu and mutated KRAS typically seen in pancreatic
cancers [30]. However, it is not clear whether these animals would progress to a
more advanced phenotype as ectopic expression of Shh ligand in the pancreatic
epithelium disrupts normal pancreatic development in these animals, resulting in
neonatal death of the mice due to pancreatic developmental defects.
In an alternative approach, an active form of the transcription factor Gli2 was
expressed specifically in the pancreatic epithelium starting from early pancreatic
development [72]. Epithelial expression of the Gli2 transgene does not disrupt
pancreas development, but it does cause formation of pancreatic tumors described as
undifferentiated carcinomas in adult animals. Those tumors did not progress through
PanINs and bear little resemblance to human pancreatic ductal adenocarcinoma.
However, simultaneous expression of active Gli2 and mutant KRASG12D
resulted in
early onset of PanINs, indicating a synergy between activation of KRAS and the Hh
pathway in PanIN progression. However, a recent study that mimicked canonical Hh
signaling using transgenic animals with a constitutively active Smoothened (Rosa26-
LSL-SmoM2) that was activated via a pancreatic epithelium-specific promoter

13
(PDX1-Cre), revealed no formation of pancreatic neoplasms up to 18 months of age
[32]. Additionally, crossing these animals with KRASG12D
transgenic animals did not
accelerate the progression of the disease nor did they observe any evidence of Hh
signal transduction in pancreatic epithelial cells. Laser capture of primary human
pancreatic tumor stroma and tumor stroma from these mouse models of pancreatic
cancer confirmed that canonical Hh signaling was restricted to the stromal
compartment.
These studies confirm additional data that suggests active Hh signaling is un-
coupled from the canonical mechanism in pancreatic epithelial cells compared to the
pancreatic mesenchyme [73]. In these experiments, genetic crossing of animals with
a Smo loss-of-function allele (SmoF) [74] into the KRAS
G12D/Trp53
F/+ (constitutively
active KRAS / p53, loss-of-function allele) background did not affect the progression
of PanIN to adenocarcinoma, or the long term survival of the animals in the study. In
this model of pancreatic adenocarcinoma, downstream Hh target genes including Gli1
are up-regulated in the pancreatic tumor cells compared to normal pancreatic
epithelium. However, Smo-depletion had no effect on the expression of Hh target
genes, Gli1 and Ptch1 in micro-dissected tumor cells, suggesting that the expression
of these targets is controlled by a Smo-independent mechanism. Gli1 expression,
independent of active Smo, is partially explained by TGFβ signaling, which can
stimulate the expression of Gli1 in the absence of Hh pathway ligands. However,
while pancreatic tumor cells do not demonstrate canonical Hh signaling, the
expression of down-stream target genes, including Gli1 is important for cell survival.
Knockdown of Gli1 by siRNA in human pancreatic tumor cells resulted in increased

14
rates of apoptosis and a reduced ability to form colonies in soft agar. Importantly,
these studies point to divergent mechanisms for Hh signaling in the progression of
pancreatic adenocarcinoma, in which paracrine Hh signaling activates canonical
target genes in the tumor stroma, while Gli transcription is driven via a Smo-
independent mechanism in pancreatic tumor cells.
BIOLOGICAL ROLE OF PARACRINE HEDGEHOG SIGNALING IN
PANCREATIC CANCER
Paracrine Hh signaling in the tumor stroma has been identified as an important
mechanism for Hh pathway activation in pancreatic cancer. As pancreatic
adenocarcinoma is characterized by a dense, desmoplastic stroma, several studies
have taken aim to identify how Hh signaling may affect these cells. The fibrotic
reaction in pancreatic tumors is the result of the proliferation of supporting cell types
including fibroblasts and stellate cells, along with the recruitment of immune cells,
and vascular-associated cells to the growing tumor [75]. This abundance of
mesenchymal cells in the tumor stroma supports tumor growth and progression in
multiple ways. These cells have been shown to secrete growth factors that aid in
tumor proliferation by a direct feedback mechanism [76]. Additionally, these cells
can support the growth and invasion of the tumor by secretion of extra-cellular matrix
remodeling enzymes and expression of signaling factors that support the
neovascularization of the tumor [77]. Additional evidence has suggested the
desmoplastic reaction can result in the formation of a physical barrier that shields the
tumor cells from responding to pharmacological treatments [78,79].

15
This desmoplasia also leads to a tumor architecture that is relatively avascular
and poorly perfused, which limits the ability of drugs to reach the tumor cells
effectively [80]. Studies using a Smo-inhibitor, IPI-926, in a mouse model of
pancreatic cancer have important implications for the clinical application for targeting
the tumor stroma [80]. In this study, mouse models using mutant alleles of KRAS
and p53 were crossed to develop transgenic animals that develop tumors with similar
desmoplasia compared to human PDA. In this model it was observed that the tumors
were hypoxic, resistant to Gemcitabine, and demonstrated limited perfusion of
compounds into the bulk tumor. However, treatment with IPI-926 reduced the level
of stroma, increased the perfusion of the tumors, and subsequently rendered the
tumors more responsive to gemcitabine treatment.
While several studies have shown robust expression of Shh ligand in pancreatic
tumor cells, it is unclear how cells in the surrounding microenvironment respond to
the presence of Shh. Recent studies have suggested that stromal cells in the
pancreatic tissue are Hh responsive and Shh ligand signal the expansion of the
stromal compartment (Figure 1.5) [81]. Transformed pancreatic epithelial cells that
ectopically express Shh and transplanted orthotopically in nude mice stimulated the
proliferation of stromal cells as evaluated by staining with the differentiated
myofibroblast marker α-Smooth Muscle Actin (α-SMA). The proliferation of these
cells was modulated with treatment of the experimental animals with a blocking
antibody (5E1) that blocks the canonical ligand-receptor interaction, resulting in the
inhibition of downstream Hh signaling [81]. Additionally, the expression of extra-
cellular matrix (ECM) proteins collagen and fibronectin, which are characteristic of

16
the desmoplastic reaction in pancreatic cancer, were significantly higher in Shh
expressing tumors compared to tumors lacking Shh over-expression.
It has been hypothesized that Hh-activated stroma in pancreatic cancer may
provide feedback signals to the cancer cells, but the specific factors in this feedback
mechanism are still relatively unknown. A recent microarray study of the mouse
tumor stroma from pancreatic adenocarcinoma xenografts treated with an Hh pathway
antagonist revealed that members of the Wnt and IGF pathways may be differentially
regulated in response to Hh signaling [33]. Additional studies in both the intestine
and prostate, which have similar mechanisms of paracrine Hh activation in the local
mesenchyme, have identified pro-inflammatory and angiogenesis-related genes that
are differentially regulated in response to Hh ligands [82,83].
As the tumor stroma is composed of a mixture of several different cell types, it
is important to identify which cells are responsive to paracrine Hh signaling. Bone
marrow mesenchymal cells have been found to migrate to the tumor
microenvironment and play important roles in tumor progression and angiogenesis in
several tumor models [84,85]. Recent work has identified that these cells migrate to
pancreatic tumors and localize to tumor endothelial cells and participate in the
neovascularization of the tumor [86]. These cells were found to express Gli2, and
their migration to the tumor vasculature was blocked by treating the tumor xenografts
with the Hh pathway inhibitor, cyclopamine. Importantly, it was found that IGF-1 in
these cells was an important Hh target gene and that blocking this factor reduced the
promotion of angiogenesis in both in vitro and in vivo models. Of note, while Hh
signaling is activated in cells associated with the tumor vasculature, CD31+ vascular

17
cells express very low levels of Gli1 and do not respond to inhibition with Hh
pathway inhibitors [87].
Further evidence that paracrine Hh signaling is important for pancreatic tumor
progression has emerged from experiments using knockouts of Hh signaling receptors
in mesenchymal cells. Subcutaneous implantation of Shh-expressing pancreatic
cancer cells with mouse embryonic fibroblasts (MEFs) that have been rendered
unresponsive to Hh signaling by knockout of the Hh signaling receptor Smoothened
(Smo) resulted in a marked reduction in xenograft tumor growth compared to co-
implantation with wild-type MEFs [33]. These studies confirm that paracrine Hh
signaling in the tumor stroma plays an important role in the development of
pancreatic cancer.
HEDGEHOG PATHWAY AND CANCER STEM CELLS
A shifting paradigm in how we view cancer is the discovery that tumors are
comprised of a heterogeneous mixture of cells with distinct populations that have
unique tumor-initiation capability termed cancer stem cells. Much of the groundwork
for identifying these cells was initiated by the application of lessons and techniques
learned in identifying populations of normal, non-tumorigenic stem cells. To assess
for these tumor-initiating cells, primary tumor cells from blood-borne cancers [88]
along with solid tumors of the breast [89], brain [90], colon [91], along with several
other solid tumor systems, are isolated and single cell suspensions from these cancers
were stained with various cell surface marker combinations, sorted by fluorescent
activated cell sorting (FACS) analysis and then implanted orthotopically or

18
subcutaneously in immune compromised animals. The resulting tumors were
analyzed for their ability to recapitulate the histological and surface marker
phenotype of the primary tumor as well as the ability to retain these characteristics
following serial transplants into recipient animals to assay for self-renewal.
These concepts have been met with some controversy some research has
challenged that these cancer stem cells are the result of artifacts of the assay and that
given the proper conditions the “differentiated” cancer cell population could form
tumors in animals or even that these tumor-initiating cells may not be as rare as we
think [92]. Indeed, a recent study demonstrated that 1 out of 4 melanoma cells were
capable of forming new tumors in xenograft experiments, suggesting that these
tumorigenic cells are not a rare sub-fraction of cells in melanoma [93]. Counter to
this is a limiting dilution analysis study of tumor cells isolated from pancreatic
adenocarcinoma, lung cancer, and head/neck cancer which suggests that from this
group of tumors the tumorigenic capacity is 1/2500 to 1/36,000 cells depending on
the tumor type and individual sample [94]. While much work is still to be done to
answer these questions in all tumor model systems, evidence from the identification
of breast cancer stem cells in transgenic mouse models of breast cancer which bypass
concerns about human/mouse xenograft models [95], along with data describing
unique abilities of cancer stem cells to evade radiation [92] and chemotherapy
treatments [96], make it clear that these cells represent a distinct cell population for
further study in human cancers.
Evidence for a role of Hh signaling in cancer stem cells has come from both
hematopoietic and solid tumor models of cancer. Specifically, in breast cancer stem

19
cell populations, these cells were found to have 30 fold higher level of expression of
Gli1 along with significant up-regulation of Ptch1 and Gli2 compared to non-
tumorigenic cells [97]. Additionally, in human glioma cancer stem cells, Hh pathway
activation has been shown to be vital to the growth and survival of these cells, and
down-regulation of Gli transcription factors either by chemical or molecular
inhibitors leads to marked effects on cancer stem cell self-renewal and tumor
initiating capacity [98].
In our own studies, we have identified a distinct population of cells within
primary human pancreatic adenocarcinoma that are enriched in tumor-initiating cells
and exhibit self-renewal by serial passaging in NOD/SCID animals [99]. These cells
are marked by the expression of the cell surface markers CD44, CD24, and epithelial
cell adhesion molecule (EpCAM) and represents a self-renewing fraction of
tumorigenic cells which can establish tumors phenotypically identical to the primary
patient tumor [100]. Recent limiting dilution analysis (LDA) study of tumor cells
from multiple human pancreatic adenocarcinomas identified that the frequency of
tumorigenic cells ranges from 1/2,500 to 1/18,000 depending on the individual patient
tumor [94]. It is important to note that this study only evaluated three patient tumors,
and the range of tumor-initiating cells may vary greatly depending on the phenotype
and genotype of the individual patient tumors. Additionally, following our initial
publication we have identified pancreatic adenocarcinomas that either lack expression
of CD24 or have very high levels of expression of both CD44 and CD24, which in
some patient tumors greater than 40% of the tumor cells express these markers
(unpublished observations). A large scale LDA study would be ideal to compare if

20
tumor-initiating capacity correlates with the expression of CD44 and CD24
expression, or any of the other markers that have been attributed to cancer stem cells
in pancreatic cancer including CD133, c-Met or Aldefluor positive (ALDH+) cells
[94,101]. This will shed more light on whether these markers are indeed informative
of the cells which contain the tumorigenic activity in pancreatic adenocarcinoma.
The role of Hh signaling in pancreatic cancer stem cells is still very unclear.
Direct isolation and qRT-PCR of mRNA isolated from the tumorigenic
CD44+/CD24
+/ESA
+ pancreatic cancer cells vs. the non-tumorigenic CD44
-/CD24
-
/ESA- cells revealed higher levels of Shh expression in the tumorigenic population
compared to the non-tumorigenic population [99]. We can only speculate as to what
this may mean, but it is possible that this enhanced ligand expression plays an
important role in regulating the expression of Hh target genes in the neighboring
tumor stroma. Others have indirectly tested the importance of Hh signaling in
pancreatic cancer stem cells by treatment of a metastatic cell line model of pancreatic
cancer with the Smo inhibitor, cyclopamine [56]. These treatments did not
significantly alter tumor size but exhibited a significant effect on preventing tumor
metastasis and lead to a reduction of tumor cells with aldehyde dehydrogenase
(ALDH) activity, a marker used to identify tumorigenic populations in breast cancer
[102] and colon cancer [103]. However, these studies utilized xenografts generated
from immortalized pancreatic cell lines and it is unclear if the cells in these lines are
hierarchically organized and fit the cancer stem cell model. Additionally, while
ALDH activity may represent a tumorigenic population in some solid tumors, this
population of cells has not been validated by in vivo implantation assays for

21
pancreatic adenocarcinoma. Some unpublished observations in our lab suggest that
while ALDH+ cells have tumorigenic potential, they do not encompass all of the
tumorigenic cells within the tumor as we also see tumors arising from animals
implanted with ALDH- cells.
It is reasonable to hypothesize that Hh signaling in the tumor stroma may
provide positive feedback signals in the form of secreted factors or changes to the
tumor microenvironment that helps to maintain the pancreatic cancer stem cell
population. Down-regulating Hh signaling in either the tumor cells by targeting Gli
transcription factors by siRNAs or in the tumor stroma by use of Hh pathway
inhibitors will help to define the importance of Hh signaling to this cell population.
These will be important questions to answer in the future as we develop better in vitro
and in vivo models that allow us to construct a more comprehensive picture of the
role of Hh pathway signaling in the tumor microenvironment.
CLINICAL INHIBITORS OF THE HEDGEHOG PATHWAY
We have learned much about the role of Hh signaling in pancreatic tumor
development from genetic manipulation of the Hh pathway in mouse models. The
efficacy of targeting this pathway in xenograft models and in patients has been tested
by the development of several targeted inhibitors of the Hh pathway. The discovery
of an important Hh pathway inhibitor was made after newborn livestock were found
with developmental defects, including cyclopia, when the female parental animals
grazed in fields that contained corn lilies [104]. A specific compound isolated from
these plants was named, cyclopamine, and was found to be a potent antagonist to the

22
Hh signaling receptor, Smoothened (Smo) [105]. Several screens of small-molecule
libraries have identified more specific compounds with increased bioavailability that
also antagonize Smo signaling, including: HhAntag, SANTs1-4, GDC-0449, and IPI-
926 [106,107,108,109]. Additionally, other molecules that target different parts of
the Hh signaling pathway, including a blocking peptide against the Hh pathway
ligand, Sonic Hedgehog, and small molecules that target the Gli transcription factors,
Gli1 and Gli2, have been developed for down-regulation of Hh signaling [110,111].
Several of these Hh pathway inhibitors are now in Phase I and II clinical trials
to test their efficacy in patients with a variety of tumors involving the Hh pathway
including: basal cell carcinoma (BCC), breast cancer, gastric cancer,
medulloblastoma, small-cell lung cancer, myeloma, ovarian, and pancreatic cancer
[66]. Early results from clinical trials that have been published using GDC-0449 in
patients with basal cell carcinoma have been encouraging. In this report, 18 of 33
patients had distant metastatic disease, and the response rate for all 33 patients was
55% [112]. This study also demonstrated that patients were able to tolerate extended
Hh pathway inhibition. The median exposure to drug was 9.8 months, with side-
effects including weight-loss, fatigue, hyponatremia that did not go above grade 3 and
in fewer than 10% of patients in the study. Interestingly, in a separate case report of a
patient with metastatic medulloblastoma, GDC-0449 treatment resulted in a rapid
decrease of tumor burden; however, within several months the patient relapsed and
developed resistance to the treatment and ultimately succumbed to the disease [113].
These results underscore the limitations of targeting Hh signaling alone and why

23
expanding upon our knowledge of how Hh pathway is involved in tumor progression
is important for designing therapeutic treatments for patients.
In contrast to treatment of tumors driven by Hh pathway mutations, it
will be important to identify how targeting Hh signaling in tumor-stromal interactions
will affect the progression of the disease as the dominant effect will be on the tumor
microenvironment. A Phase I clinical trial is currently underway at the University of
Michigan Medical Center to test the clinical response of patients with pancreatic
adenocarcinoma treated with the Hedgehog pathway inhibitor, GDC-0449, in
combination with gemcitabine. Additionally, we and others have initiated studies to
identify the Hh responsive genes in the pancreatic tumor mesenchyme and this
information will help us to understand how these inhibitors are affecting the
pancreatic tumor microenvironment. These studies will provide important data to
determine if targeting paracrine Hh signaling may provide a therapeutic benefit for
pancreatic cancer patients

24
FIGURES
Figure 1.1 Pathology of Pancreatic Adenocarcinoma Progression. (A)
Histological stain of normal human pancreas. (B) High-power magnification of a
PanIN-2 lesion. (C) Low-power magnification of an infiltrating pancreatic
adenocarcinoma. (D) Gomari’s trichrome stain of human pancreatic adenocarcinoma.
Note the large amount of connective tissue staining (blue-green stain) compared to
the tumor cells (red stain) in the section.
A B
C D

25
Figure 1.2 Progression Model of Pancreatic Cancer. The most common pre-
cancerous lesions are termed pancreatic intraepithelial neoplasms (PanINs), graded
from 1-3. Hedgehog ligands have been detected as early as PanIN1. Adapted from
Bardeesy et. al Nature reviews 2002 [114].

26
Figure 1.3 Diagram of Canonical Hh Pathway Activation. (A) In the absence of
Hh ligand, Gli transcription factors are down-regulated or processed to a repressor
form which prevents activation of downstream target genes. (B) Following ligand
binding to Ptch, Smo is phosphorylated and stabilized at the cell membrane by a
kinase complex. Gli transcription factors are not processed to a repressor form and
instead translocate to the nucleus to activate downstream target genes.
SHH
Target Genes Target Genes
GLIA
PTCH SMO PTCH SMO
SUFU
GLIA
A) B)
Proteasomal
Cleavage
SUFU
GLIR
SUFU
GLIA
GRK2
OFF ON

27
Figure 1.4 Expression of Shh in Human Pancreatic Adenocarcinoma. IHC image
of normal human pancreas and a pancreatic adenocarcinoma xenograft stained for
human Sonic Hedgehog (Shh, brown color). Nuclei are counterstained with
hematoxylin. Staining is restricted to the neoplastic cells, while there is no Shh
expression detected in the neighboring stroma.
Pancreatic Cancer Xenograft Normal Human Pancreas
Anti-Sonic Hedgehog

28
Figure 1.5 Paracrine Mechanism of Hedgehog Pathway Activation. Pancreatic
tumor cells secrete Hh ligands (Shh, Ihh) into the tumor microenvironment, which
activates the pathway in surrounding tumor fibroblasts. This paracrine activation, in
turn, leads to the expression of a subset of yet uncharacterized Hh target genes that
may play a role in fibrosis, along with neo-vascularization, recruitment of
inflammatory cells, and stimulating growth factors for the tumor cells.

29
CHAPTER 2
INHIBITION OF PARACRINE HEDGEHOG SIGNALING IN HUMAN
PANCREATIC ADENOCARCINOMA XENOGRAFTS
SUMMARY
Aberrant activation of the Hedgehog (Hh) pathway has been associated with
the progression of several tumor types. In pancreatic cancer, a paracrine mechanism
has been identified in which pancreatic tumor cells secrete Hh ligands and activate
the hedgehog pathway in the surrounding tumor mesenchyme. We set out to identify
the role of paracrine Hh signaling in pancreatic cancer biology utilizing an orthotopic
model of human pancreatic ductal adenocarcinoma (PDA). Treatment of patient-
derived PDA xenografts grown ectopically in the pancreas of mice with HhAntag
alone, a potent Hh pathway inhibitor and Smoothened antagonist, did not
significantly affect primary tumor volume. However, we observed a significant
decrease in the number of distant metastases with HhAntag treatment. Co-treatment
with the nucleoside analog, gemcitabine, a chemotherapeutic agent commonly used to
treat pancreatic cancer, enhanced these affects and also resulted in differentiation of
the tumor cells to a mucin producing phenotype. Finally, we observed a significant
decrease in the pancreatic cancer stem cell population (CD44+/CD24
+/ESA
+) in
tumors treated with HhAntag. Re-implantation of tumor cells from both HhAntag-
treated and HhAntag/gemcitabine co-treated animals resulted in a significant decrease
in subsequent tumor growth compared to cells implanted from either control or
30
gemcitabine only treated animals, suggesting that HhAntag treatment decreases the
tumor-initiating capacity of cancer cells. These results provide important insights
into how targeting paracrine Hh signaling in pancreatic cancer may provide
therapeutic benefits to patients.
INTRODUCTION
Pancreatic ductal adenocarcinoma (PDA) is a devastating disease that ranks
fourth in cancer-related death in the United States, with 5-year survival rates of less
than 5% [115]. Most PDA patients present clinically with non-resectable, metastatic
disease. Current therapies include the cytotoxic agent gemcitabine, but a very limited
therapeutic effect is observed. Even in cases where the disease is identified in its
early stages, nearly all patients that undergo surgical resection of the tumor along
with adjuvant chemotherapy will eventually relapse and succumb to recurrent disease
[116,117]. Clinical trials that have evaluated the efficacy of targeting pancreatic
adenocarcinoma with antagonists of the human epidermal growth factor receptor
(EGFR) pathway, vascular endothelial growth factor (VEGF) pathway, insulin-like
growth factor (IGF) pathway, and phosphoinositide 3’-kinase (PI3k)/Akt/mammalian
target of rapamycin (mTOR) signaling have only demonstrated marginal clinical
response in patients [27,28,118,119]. This underlines the need to develop a better
understanding of pancreatic tumor biology and identify specific pathway targets
which will improve clinical response.
The Hedgehog (Hh) signaling pathway has become an important area of
research for pancreatic cancer following initial studies demonstrating up-regulation of

31
several pathway components in human cell line models and primary samples of
pancreatic cancer [30,31]. In normal pancreatic development, expression of Hh
signaling ligands is blocked in the developing pancreatic bud to allow for proper
specification of the gland [57]. In the adult organ, Hh signaling is active at low-levels
in pancreatic β-cells and is important for the regulation of insulin secretion [61]. In
pancreatic tumors, Hh ligands, Sonic hedgehog (Shh) and Indian hedgehog (Ihh), are
expressed in both early precursor pancreatic intraepithelial neoplasms (PanINs) and in
advanced adenocarcinoma [30,120]. Desert hedgehog (Dhh), a third Hh pathway
ligand that is involved in the formation of nerve sheaths and plays a role in the
regulation of insulin secretion of pancreatic β-cells has not been characterized in
pancreatic cancer [61].
Recent studies have demonstrated that while pancreatic tumor cells express
Hh ligands, the tumor cells are not competent to transduce canonical Hh signals [32].
This suggests that Hh ligands secreted from the tumor cells initiate a paracrine
mechanism in which Hh acts in the stromal compartment of the pancreatic tumor.
Paracrine Hh signaling in the stroma creates a feedback loop in which downstream
Hh-targets are secreted from the stroma and believed to aid in the growth and
invasion of the tumor. Although it is unclear which factors are involved, members of
the Wnt and IGF pathways have been shown to be differentially regulated in the
stroma of PDA xenografts treated with Hh pathway inhibitors [33,86]. Additionally,
over-expression of Shh by tumor cells may contribute to the intense desmoplasia that
is characteristic of the disease by stimulating the proliferation of pancreatic stellate
cells [81].

32
Hh pathway inhibitors have been shown to limit the growth of human PDA in
experimental models in vivo [30,121,122]. Recent data has suggested that targeting
paracrine Hh signaling in a mouse model of pancreatic adenocarcinoma may improve
the blood flow within the tumor by ablating the tumor stroma and allowing expansion
of the vasculature, thus dramatically improving the effectiveness of cytotoxic drugs,
such as gemcitabine, by increasing exposure to the tumor cells to the
chemotherapeutic agent [80]. Despite these studies, it is still relatively unknown how
targeting paracrine Hh signaling in primary human pancreatic adenocarcinoma can
affect important aspects of tumor biology that include proliferation, metastasis and
cancer stem cell function. It was our aim to develop an orthotopic model of paracrine
Hh-pathway inhibition, using primary human pancreatic adenocarcinoma xenografts
to answer these questions.
MATERIALS AND METHODS
Treatment of Orthotopic Human PDA Xenografts
Animals used in this study were maintained in facilities approved by the
American Association for the Accreditation of Laboratory Animal Care in accordance
with the current regulations and standards of the US Department of Agriculture and
Department of Health and Human Services. All studies were approved by the
University Committee on Use and Care of Animals at the University of Michigan.
Samples of human pancreatic adenocarcinomas were obtained within 30 min
following surgical resection according to Institutional Review Board–approved

33
guidelines. Expansion of primary human pancreatic adenocarcinoma samples using
NOD/SCID animals have been described previously [123].
To establish orthotopic xenografts, after administration of anesthesia, a small
subcostal laparotomy was performed, and single cell suspensions of human PDA
cells, transduced with a lentivirus-expressing Renilla-Luciferase, were then injected
(5.0 x 10⁵/ 50 μl) into the distal pancreas of NOD/SCID animals. Tumors were
allowed to engraft for 2 weeks, following confirmation of a positive bioluminescence
signal performed by i.p injection of luciferin and use of a Xenogen IVIS™ 200
Imager (Caliper Life Sciences; Alameda, CA). Animals were randomized into four
treatment groups, seven per group, and treated for 21 days with either vehicle (0.5%
methylcellulose (Sigma; St. Louis, MO) plus 0.2% Tween80 (Sigma), HhAntag 100
mg/kg by oral gavage (twice daily), gemcitabine 50 mg/kg once a week, or a
combination the HhAntag and gemcitabine regimens. After 21 days of treatment,
primary tumor weight was measured and metastases quantified along with harvesting
of tissue for histological and FACS analysis.
Drugs
HhAntag was provided by Genentech (South San Francisco, CA) [33].
HhAntag was prepared as a 10 mg/ml solution in 0.5% methylcellulose (Sigma) plus
0.2% Tween80 (Sigma) and delivered by oral gavage 10 mg/kg twice daily.
Gemcitabine (Eli Lilly; Indianapolis, IN) was re-suspended in sterile PBS and
injected intraperitoneally at 50 mg/kg once a week.
RNA Extraction and Quantitative Real-Time Reverse Transcription-PCR

34
Tumor fragments (20 mg) were harvested from each treatment group, and the
tissue was homogenized with a rotor-stator homogenizer (Polytron; Kinematica,
Bohemia, NY) in RLT buffer (Qiagen; Valencia, CA). Total RNA was extracted
using the RNeasy Mini kit (Qiagen). Total RNA quality and quantity was analyzed
using a NanoDrop (Thermo Scientific; Rockford, IL). One microgram of total RNA
was used to transcribe cDNA using the SuperScript® First-Strand Synthesis System
(Invitrogen; Carlsbad, CA). From this cDNA reaction, 2 μl of RT reaction was used
for qPCR using POWER SYBR Mix (Applied Biosystems; Carlsbad, CA) and the
reaction was carried out on a Roto-Gene Q Real-Time Cycler (Qiagen).
Primers used for qPCR are as follows: mouse Gli-1 forward: GGA AGT CCT
ATT CAC GCC TTG A, reverse: CAA CCT TCT TGC TCA CAC ATG TAA G;
mouse Ptch-1 forward: TTG TGG AAG CCA CAG AAA ACC, reverse: TGT CTG
GAG TCC GGA TGG A; mouse GAPDH forward: AGC CTC GTC CCG TAG ACA
AAA T, reverse: CCG TGA GTG GAG TCA TAC TGG A, human Gli-1 forward:
GTT CAC ATG CGC AGA CAC ACT, reverse: TTC GAG GCG TGA GTA TGA
CTT C; human Ptch-1 forward: CGG CAG CCG CGA TAA G, reverse: TTA ATG
ATG CCA TCT GCA TCC A, human GAPDH forward: CCA CAT CGC TCA GAC
ACC AT, reverse: GCA ACA ATA TCC ACT TTA CCA GAG TTA A.
Histology
Paraformaldehye-fixed (4%), paraffin-embedded tissue sections were stained
with H&E in the histology lab of the University of Michigan Comprehensive Cancer
Center Tissue Core. For immunohistochemistry, deparaffinized and rehydrated slides

35
were subjected to antigen retrieval via autoclaving in a 10 mM citric acid buffer (pH
6.0). Upon cooling to room temperature for 30 min, slides were blocked with 0.3%
H2O2 for 20 min, washed in phosphate-buffered saline (PBS), and then blocked with
1% BSA in PBS. Slides were incubated with diluted primary antibodies overnight at
4°C. The following primary antibodies were used: rabbit anti-ki67 (1:200 dilution;
Novocastra), Cleaved caspase 3 was detected using a rabbit anti-cleaved caspase 3
antibody (1:100 dilution; Cell Signaling Technologies; Danvers, MA). Slides were
developed using the Vectastain ABC kit (Vector Labs; Burlingame, CA). 3-3′-
Diaminobenzidine tetrahydrochloride was used as a chromogen and counterstained
with hematoxylin.
Flow Cytometry Analysis of Cancer Stem Cell Markers
Measurement of the CD44+/CD24
+/ESA
+ cancer stem cell population after
treatment with HhAntag or vehicle was carried out using FACS analysis as previously
described [123]. Dissociated cells were counted and transferred to a 5-mL tube,
washed twice with HBSS containing 2% heat-inactivated FBS, and re-suspended in
HBSS with 2% FBS at concentration of 106 cells/100 μL. Sandoglobin solution (1
mg/mL) was then added to the sample at a dilution of 1:20 and the sample was
incubated on ice for 20 min. The sample was then washed twice with HBSS/2% FBS
and re-suspended in HBSS/2% FBS. Antibodies were added and incubated for 20 min
on ice, and the sample was washed twice with HBSS/2% FBS. When needed, a
secondary antibody was added by re-suspending the cells in HBSS/2%FBS followed
by a 20-min incubation. After another washing, cells were re-suspended in HBSS/2%

36
FBS containing 4′, 6-diamidino-2-phenylindole (DAPI; 1 μg/mL final concentration).
The antibodies used were: anti-CD44 phycoerythrin (PE) (BD Biosciences; San
Diego, CA), anti-CD24 FITC (BD Biosciences), anti–EpCAM-allophycocyanin
(APC) (Miltenyi Biotec; Auburn, CA), and biotinylated anti-H2K (Southern Biotech;
Birmingham, AL) each at a dilution of 1:40. A strepavidin-APC-Cy7 (BD
Biosciences) was also used. In all experiments using human pancreatic cancer
primary xenograft tissue, infiltrating mouse cells were eliminated by discarding H2K+
(mouse histocompatibility class I) cells during flow cytometry. Dead cells were
eliminated by using the viability dye DAPI. Flow cytometry was done using a MoFlo
(Beckman Coulter; Brea, CA). Side scatter and forward scatter profiles were used to
eliminate cell doublets. Cells were routinely sorted twice, and the cells were
reanalyzed for purity, which typically was >98%.
Statistical Analysis
To compare the incidence of metastasis in the orthotopic model, we used a Fisher's
exact test to compare treatments, whereas a Mann–Whitney test was used to calculate
any significant difference in the weight of the primary tumors. Fischer’s exact test
was performed to calculate significant differences in the number of animals with
distant metastases. All statistics were compiled by using Prism version 5.01
(GraphPad Software, Inc.).
RESULTS
Paracrine Hh Signaling in Human Pancreatic Ductal Adenocarcinoma
Xenografts

37
Paracrine Hh signaling has been detected in mouse models of pancreatic
cancer and in human cell line xenografts [32,33]. To further define the role of Hh
signaling in pancreatic cancer, we established xenografts from tumor fragments
obtained from 13 patients that had undergone surgical resection for pancreatic ductal
adenocarcinoma (Table 2.1). In these xenotransplantation models, as the tumor
grows in the host mouse, the human tumor stroma is quickly replaced with host
mouse stroma [124]. To test whether paracrine Hh signaling was active in primary
human PDA xenografts, we examined the gene expression levels of several Hh
pathway related genes using mouse/human species specific probe sets. Expression of
Hh ligands, Sonic and Indian Hedgehog (Shh, Ihh), was found to be significantly up-
regulated in our PDA xenografts compared to the expression of these genes in several
samples of normal human pancreas (Figure 2.1 A). Additionally, using
human/mouse specific probes, we observed a correlation between the levels of Shh
and Ihh expression in the tumor and activation of Hh signaling, as evaluated by Gli1
and Ptch1 expression in the mouse stroma (Figure 2.1 B). This data supports the idea
that paracrine Hh signaling in the tumor stroma is active in human PDA xenografts.
HhAntag and Gemcitabine Treatment of Orthotopic PDA Xenografts
To test how paracrine Hh signaling contributes to pancreatic ductal
adenocarcinoma tumor growth and progression, we established an orthotopic model
of human PDA using low passage (≤ passage 2) cells derived from patient xenograft
tumors. After establishing these tumors in the pancreas of NOD/SCID animals, we
treated the mice with HhAntag, an orally bioavailable Hh pathway inhibitor that

38
targets the Smoothened (Smo) receptor of the Hh pathway and prevent downstream
activation of Hh target genes [33]. In parallel, we treated groups of animals with
weekly doses of gemcitabine, a chemotherapeutic drug commonly used in the
treatment of pancreatic cancer [24], or a combination of gemcitabine and HhAntag.
We selected two different patient xenografts from our initial Hh pathway
analysis for our in vivo study. UM-PDA#1 was classified histologically as a poorly
differentiated adenocarcinoma, expressed very high levels (40%) of cancer stem cell
markers CD44 and CD24 [99], and subsequent follow-up with the patient revealed
the disease had quickly progressed to Stage IV with metastasis to the liver (Table
2.1). UM-PDA#2 was classified as a moderately differentiated adenocarcinoma and
had a lower percentage of the cancer stem cell population (4%) (Table 2.1).
Quantitative expression analysis (2-^ΔCt
) by qRT-PCR of Sonic hedgehog for UM-
PDA#1 and UM-PDA#2 was found to be 0.026 and 0.020, respectively, which was
just below the statistical median (0.054) for the group of xenografts analyzed in this
study (Table 2.2).
Treatment of both tumor xenografts with HhAntag for 21 days resulted in
slight reductions in primary tumor volume; however, these changes did not reach
statistical significance (Figure 2.2 A). Treatment with gemcitabine alone did result
in significant decreases compared to controls, with a 47% and 87% reduction in
tumor volume for UM-PDA#1 and UM-PDA#2, respectively. Combinatorial therapy
with HhAntag and gemcitabine resulted in a 77% decrease for tumor UM-PDA#1 and
an 83% decrease in UM-PDA#2, compared to control treated tumors. The effect of
HhAntag and gemcitabine treatment on animals with UM-PDA#1 xenografts

39
demonstrated synergistic activity, while the same treatment of animals with UM-
PDA#2 xenografts was not statistically different from treating with gemcitabine
alone. Animal weights remained the same as vehicle treated controls and no animals
lost significant total body weight (>5%) which was determined by weekly weight
measurements taken during treatment (data not shown).
Next, we investigated the effects of Smo-inhibition on cell proliferation and
apoptosis. HhAntag treatment did not have a significant effect on the overall cellular
proliferation of either UM-PDA#1 or UM-PDA#2 as evaluated by Ki67 positive cells
(Figure 2.2 B). Additionally, treatment with gemcitabine alone did not result in
significant decreases in proliferation with either tumor xenograft. We did, however,
observe a significant decrease in the overall proliferation with co-treatment of
HhAntag and gemcitabine in both xenografts (Figure 2.2 B). Similar to the results
with overall proliferation, we did not observe significant changes in the number of
apoptotic cells in HhAntag or gemcitabine only treated xenografts (Figure 2.2 C).
However, we did observe a significant increase in cell death in the UM-PDA#1
animal xenografts co-treated with HhAntag and gemcitabine as evaluated by an
increase in the staining for cleaved caspase 3 (CC3) (Figure 2.2 C). Numbers of
apoptotic cells in the UM-PDA#2 animal xenografts co-treated with HhAntag and
gemcitabine were not statistically different from controls. These results suggest that
Smo-inhibition alone is not enough to slow the growth of the tumor by either
reduction of mitotic signals or an increase in pro-apoptotic mechanisms. However,
co-treatment with HhAntag and gemcitabine was able to decrease proliferation in
both patient xenografts and increase the amount of apoptosis in one of the xenografts

40
providing evidence that these drugs may act synergistically in reducing pancreatic
tumor growth.
To confirm that HhAntag treatment down-regulates the Hh pathway, we
performed qRT-PCR from RNA extracted from bulk tumor tissue from each
treatment group using mouse and human specific primers for Gli1 and Ptch1. We
observed that mouse stromal Gli1 and Ptch1 were significantly decreased compared
to controls in both HhAntag and combination treated xenografts, while Hh target gene
expression levels were unchanged in the infiltrating mouse stromal component in
gemcitabine treated animals (Figure 2.2 D). Unexpectedly, we observed increases in
human Gli1 levels in UM-PDA#1 and human Ptch1 levels in UM-PDA#2 with
gemcitabine and co-treatment with HhAntag (Figure 2.2 D). It is possible that these
treatments disrupted paracrine signals in the stroma that lead to non-canonical up-
regulation of these factors.
HhAntag Treatment Induces Differentiation in PDA Xenografts
Examination of histological sections from xenograft-derived tumors treated
with HhAntag alone or in combination with gemcitabine revealed the appearance of
vacuolated structures within the tumor cells. In tumors from UM-PDA#1 animals, we
observed these structures in both the HhAntag only and combination treated group,
but not in the vehicle or gemcitabine-only treated tumors (Figure 2.3 A). Trichrome
staining, which helps to differentiate tumor cells from the connective tissue, identified
a reduction in stromal cells in the regions surrounding the tumor cells with the
vacuolated pattern in the tumors co-treated with HhAntag and gemcitabine. Periodic

41
acid-Schiff (PAS) staining confirmed that the vacuolated structures contained large
amounts of mucin (Figure 2.3 A). In the UM-PDA#2 treated tumors, we only
observed these structures in the combined HhAntag and gemcitabine treated animals.
We also observed a significant change in the tumor architecture compared to control
treated tumors with the majority of tumor cells arranged in papillary-like structures
with large vacuolated spaces (Figure 2.3 B). Similar to UM-PDA#1 xenografts,
trichrome staining of UM-PDA#2 tumors from animals treated with HhAntag and
gemcitabine treated animals revealed a reduction in the stroma surrounding the
differentiated tumor cells. PAS staining of sections from these HhAntag and
gemcitabine treated tumors confirmed the expression of mucin in these structures
(Figure 2.3 B). To date, this change in the apparent differentiation of PDA tumors
following inhibition of paracrine Hh signaling alone, or in combination with
gemcitabine treatment, has not been previously described.
HhAntag Treatment Decreases Metastasis in Orthotopic PDA Xenografts
Pancreatic ductal adenocarcinoma is a highly metastatic disease; therefore we
determined whether inhibition of paracrine Hh signaling was capable of suppressing
the development of distant organ metastases in our orthotopic model. We selected
UM-PDA#1 for further analysis, as this tumor xenograft had demonstrated metastatic
potential in previously performed studies in our laboratory. UM PDA#2 did not
display metastatic potential when implanted in orthotopically in NOD/SCID mice.
After 21 days of control, HhAntag or gemcitabine only treatment, along with co-
treatment with both drugs we sacrificed the animals from each treatment group for
pathological analysis. We observed in control treated animals, significant metastatic

42
spread of the disease to the peritoneal cavity, along with invasion into mesenteric
lymph nodes and to the liver (Figure 2.4 A). Examination of these metastatic sites
revealed lesions histologically identical to the primary tumor (Figure 2.4 B). In
animals that were treated with HhAntag alone or co-treatment of HhAntag and
gemcitabine, we did not detect metastases to the lymph nodes or peritoneum (Figure
2.4 C). Animals treated with gemcitabine also had significant reductions in
metastases to the lymph nodes and peritoneum. We observed reductions in the
numbers of metastases to the liver with HhAntag treatment alone and in combination
with gemcitabine, although this did not reach statistical significance (Figure 2.4 C).
HhAntag Treatment Affects the Pancreatic Cancer Stem Cell Population
Previous work in our lab has identified a highly tumorigenic subpopulation of
cells within pancreatic ductal adenocarcinoma that express CD24, CD44, and
epithelial cell adhesion molecule (ESA) that we have termed cancer stem cells (CSC)
due to their ability to self-renew and produce the heterogeneity of cancer cells that are
present in the patient’s tumor [99]. We hypothesized that knockdown of paracrine Hh
signaling in the tumor stroma may alter factors that contribute to the maintenance and
self-renewal of this population. To evaluate whether HhAntag or gemcitabine
treatments affected this population of cells, we performed FACS analysis on single
cell suspensions prepared from tumors in each treatment group. Analysis of
xenograft UM-PDA#1 did not reveal any significant change in the
CD44+/CD24
+/ESA
+ population following any of the drug treatments compared to
vehicle (Figure 2.5 A). However, FACS analysis of xenograft UM-PDA#2 revealed
a 50% decrease in CD44+/CD24
+/ESA
+ cells following HhAntag treatment alone and

43
in combination with gemcitabine, while the cancer stem cell population in the
gemcitabine only treated animals did not change significantly from control animals
(Figure 2.5 B). To see if the tumorigenicity of these cells had been affected by the
treatment regimens, we FACS sorted and subcutaneously implanted in NOD/SCID
animals, 2.5x10⁴ DAPI
-/ H2K
- (viable, human tumor cells) from cells dissociated
from tumors in treatment group. After 6 weeks, we excised the tumors from each
group and compared their final tumor weights (Figure 2.5 C, D). Re-implanted cells
from HhAntag and co-treatment of HhAntag and gemcitabine resulted in tumors that
were significantly reduced in size compared to control or gemcitabine only treated
cells.
DISCUSSION
In this study, we tested the role of paracrine Hh signaling in the growth and
progression of human pancreatic ductal adenocarcinoma xenografts. Our findings are
consistent with other studies that have shown a significant reduction in metastases to
distant organ sites, including lymph nodes and peritoneum, following inhibition of
paracrine Hh signaling [122,125]. We also observed a previously unreported effect of
HhAntag to enhance the apparent differentiation of cancer cells with marked increase
in tumor production of mucin. In addition, the areas surrounding the differentiated
structures in the animals co-treated with HhAntag and gemcitabine were mostly
devoid of stroma compared to control and treatment with either drug alone. We also
demonstrated that HhAntag treatment can reduce the tumorigenic capacity of human
PDA cells following re-implantation of the treated cancer cells.

44
Our studies, along with others, have demonstrated that pancreatic tumor cells
secrete Hh ligands, and this activates Hh signaling in the surrounding tumor
mesenchyme [33]. However, down-regulation of paracrine Hh signaling alone in
human PDA xenografts does not result in a significant reduction in primary tumor
volume. This result is consistent with the finding that Smo-inhibition in a mutant
KRAS/p53 transgenic animal model of pancreatic cancer does not significantly affect
primary growth of the tumor [80]. However, we observed significant reductions in
primary tumor volume with combination treatment of HhAntag and gemcitabine in
both patient xenografts. The use of both drugs was synergistic in the treatment of
UM-PDA#1, but not UM-PDA#2. This suggests that different patient tumors respond
differently to Hh targeted therapy, and these differences warrant further investigation
to help identify which patients may optimally benefit from this therapy.
We also observed that the PDA xenograft model was sensitive to gemcitabine
treatment, raising a limitation to this model system as only 15% of patients respond to
gemcitabine treatment [24]. Recent studies have demonstrated that a transgenic
mouse model of human PDA, which conditionally expresses mutant KRAS and p53
alleles in pancreatic cells, generates pancreatic adenocarcinoma that is highly
desmoplastic and poorly perfused [80]. Cell lines made from these tumors, and re-
implanted back into immune competent animals, resulted in tumors that were well-
perfused and sensitive to gemcitabine treatment, suggesting that de novo tumor
development rather than xenotransplantation may better approximate the human PDA
disease response to gemcitabine. Noticeably, in our xenograft model, the infiltrating
mouse stroma that replaces the human stroma in the tumor appears reduced from the

45
primary patient tumor. Despite these limitations, treatment of xenotransplanted
tumors provided important insight into the response of individual patient tumors, and
demonstrated distinct responses to HhAntag not observed in the transgenic model of
pancreatic cancer, such as the development of a more-mucin-producing epithelial
component.
Our study also suggests a previously unreported role for paracrine Hh
signaling in maintaining the differentiation status of the tumor epithelium. Both
xenografts treated with a regimen of HhAntag alone or in combination with
gemcitabine resulted in tumor regions with punctuate, vacuolated structures in the
tumor cells that contained mucins. Interestingly, in the case of xenograft UM-PDA#2
co-treated with HhAntag and gemcitabine the tumor architecture was significantly
altered to a papillary structure, with very prominent glandular differentiation.
Typically, cell proliferation and differentiation display an inverse relationship, in that
the most aggressive tumor malignancies are characterized by a high rate of
proliferation and an absence of differentiation [126].
Our results suggest that paracrine Hh signaling in the tumor stroma likely
provides important feedback signals to the tumor cells that maintain their
differentiation status. Co-treatment with HhAntag and gemcitabine further enhances
this phenotype, and suggests that the combination of these two drugs could be used to
decrease the amount of stroma, enhance drug delivery, and induce a more
differentiated and less aggressive tumor cell phenotype. Interestingly, this
differentiated phenotype has also been observed in a patient following post-treatment
biopsies in a phase I clinical trial at the University of Michigan Medical Center using

46
GDC-0449, an Hh pathway inhibitor and Smoothened antagonist developed by
Genentech to treat naïve patients with metastatic pancreatic cancer (Figure 2.6).
While this clinical trial is still in the early stages, and we will need to do additional
studies to correlate the phenotypes seen in our xenograft studies with patients in the
clinical trial, our results may help predict how inhibition of paracrine Hh signaling
affects primary patient tumors and demonstrate the utility of the primary pancreatic
cancer xenograft model to predict results observed in human patients.
The reduction in the development of metastases following inhibition of
paracrine Hh signaling in animal models of pancreatic cancer has been reported in
several recent studies [80,122,125]. Unique to our study was the use of non-
immortalized patient-derived adenocarcinoma cells implanted orthotopically in
NOD/SCID animals. It has been our experience in developing primary xenografts
from several patient samples, that there is a range of tumor invasiveness in vivo,
amount of infiltrating mouse stroma, the level of tumor differentiation, and the
expression of signaling factors, including Hh pathway ligands. By testing a range of
patient tumors we hope to better understand what treatments might work for different
individual tumor phenotypes.
In our study, we utilized an invasive pancreatic ductal adenocarcinoma
xenograft that under control treatment conditions, led to significant invasion of the
liver, spleen, mesenteric lymph nodes, and the peritoneum. Following treatment with
HhAntag alone or in combination with gemcitabine, we were unable to detect
metastases in the lymph nodes or in the peritoneum. We also observed a reduction in
the number of animals with metastasis to the liver in HhAntag only treated and co-

47
treatment with gemcitabine, but this change was not statistically significant. While
we classified metastatic spread as evidence of any metastases to distant organs,
HhAntag and co-treatment with gemcitabine clearly had a significant impact in
limiting the tumor burden to the liver and peritoneum. Experiments are on-going to
track the level of metastases by using luciferase-tagged tumor cells and whole organ
imaging. This will help to establish quantitative measurement of changes in tumor
burden following treatment. Additionally, it will be important to assess if inhibition
of paracrine Hh signaling is able to inhibit the growth of established metastases, as
many patients present clinically with late-stage, metastatic disease.
The role of cancer stem cells is also a focused area of study for solid tumor
malignancies, including pancreatic cancer. In our studies, we observed a reduction in
CD44+/CD24
+/ESA
+ expression in one of our two treated xenografts following
HhAntag treatment alone and in combination with gemcitabine compared to control.
Our in vivo results with HhAntag suggest that this drug does not affect the tumor cells
directly, therefore any change in the tumorigenic cell population is likely to be due to
the differential expression of factors from the mesenchyme that maintain the cancer
stem cell niche. Studies are underway to perform limiting dilution analysis (LDA)
from tumor cells following each treatment regimen. This is a more robust
measurement of tumor initiating capacity [93] and will clarify whether Smo-
inhibition in the stroma is effective in disrupting the maintenance of the cancer stem
cell population.
Targeting paracrine Hh signaling in the pancreatic tumor mesenchyme may
provide an important therapeutic target for pancreatic adenocarcinoma patients.

48
There are still many questions to be answered about how paracrine Hh signaling
affects the biology of the tumor mesenchyme and what Hh responsive genes may be
differentially regulated that lead to the changes in tumor biology observed in our
studies. These studies add to our understanding of how Hh signaling may be working
in the pancreatic tumor microenvironment and may open up new strategies for
treatment regimens for pancreatic cancer.
ACKNOWLEDGMENTS
Author Contributions: Joseph S. Dosch performed all the in vivo work with
HhAntag. Trichrome, PAS, and Ki67 staining was done by Jimmy Hogan in Marina
Pasca di Magliano’s lab at the University of Michigan. FACS analysis was done with
assistance by the University of Michigan Flow Cytometry Core with special thanks to
Dave Adams, Ann Marie Des Lauriers, Mike Pihalja and Danielle Fasseel. Thanks to
Genentech for providing the HhAntag along with suggestions for its in vivo use from
Dr. Fred de Sauvage.

49
FIGURES
Figure 2.1 Paracrine Hh Signaling in Human PDA Xenografts. (A) Quantitative
RT–PCR profiling of SHH and IHH mRNA in a panel of samples from normal human
pancreas and low-passage (≤ 2) human PDA xenografts (normal, n=6, PDA, n=13).
Gene expression normalized to species-specific GAPDH levels. (B) Correlation
between stromal-derived Gli1 and Ptch1 mRNA levels versus tumor-derived Hh
ligand (SHH and IHH) levels in human PDA xenografts (n = 13) by species-specific
qRT–PCR.
SHH
Norm
al
PDA
0.00
0.05
0.10
0.15
0.20
Gen
e E
xp
ressio
n (
2^
-dd
T)
IHH
Norm
al
PDA
0.0000
0.0005
0.0010
0.0015
0.0020
0.0025
Gen
e E
xp
ressio
n (
2^
-dd
T)
hSHH vs. mGli1
0.0 0.2 0.4 0.6 0.80.000
0.005
0.010
0.015
0.020
r2= 0.6219
p = 0.0014
hSHH Gene Expression (2^-ddT)
mG
li1 G
en
e E
xp
ressio
n (
2^
-dd
T)
hIHH vs. mGli1
0.0000 0.0005 0.0010 0.0015 0.0020 0.00250.000
0.005
0.010
0.015
0.020
r2=0.7102
p=0.0003
hIHH Gene Expression (2^-ddT)
mG
li1 G
en
e E
xp
ressio
n (
2^
-dd
T)
hSHH vs. mPtch1
0.0 0.1 0.2 0.3 0.4 0.50.00
0.05
0.10
0.15
r2=0.5667
p=0.005
hSHH Gene Expression (2^-ddT)
mP
tch
1 G
en
e E
xp
ressio
n (
2^
-dd
T) hIHH vs. mPtch1
0.0000 0.0005 0.0010 0.0015 0.0020 0.00250.00
0.05
0.10
0.15
r2=0.5930
p=0.002
hIHH Gene Expression (2^-ddT)
mP
tch
1 G
en
e E
xp
ressio
n (
2^
-dd
T)
A)
B)

50
Figure 2.2 HhAntag Treatment Targets Hh Signaling in the Tumor Stroma. (A)
Final tumor weights (g) of Tumor UM-PDA#1 and UM-PDA#2 following treatment
(n = 6 in each group, * denotes p-value < 0.05. (B) IHC staining for Ki67 revealed a
decrease in proliferation in HhAntag + Gemcitabine treated tumors for both patient
tumors tested. (C) IHC staining for Caspase-3 revealed an increase in apoptosis in
HhAntag+Gemcitabine treated tumors in UM-PDA#1 but not UM-PDA#2. (D) qRT-
PCR analysis of each tumor following treatment using mouse/human specific Gli1
and Ptch1 primers. Gene expression was evaluated from two separate animals from
each treatment group and run in triplicate. V= vehicle, G= gemcitabine, H=
HhAntag, H+G= HhAntag + Gemcitabine treatment.
A)
V H G H+G0
1
2
3
4
5
UM-PDA#1
ns
*
*
Fin
al T
um
or
Weig
ht
(g)
UM-PDA#2
V H G H+G0.0
0.5
1.0
1.5
* *
ns
Fin
al T
um
or
Weig
ht
(g)

51
B) UM-PDA#1
V H G H+G0
50
100
150
*
Ki6
7+
cells/4
0x f
ield
UM-PDA#2
V H G H+G
0
50
100
150
*
Ki6
7+
cells/4
0x f
ield
C) UM-PDA#1
V H G H+G0
5
10
15
*
CC
3+
cells/2
0x F
ield
UM-PDA#2
V H G H+G0
5
10
15
CC
3+
cells/4
0x F
ield
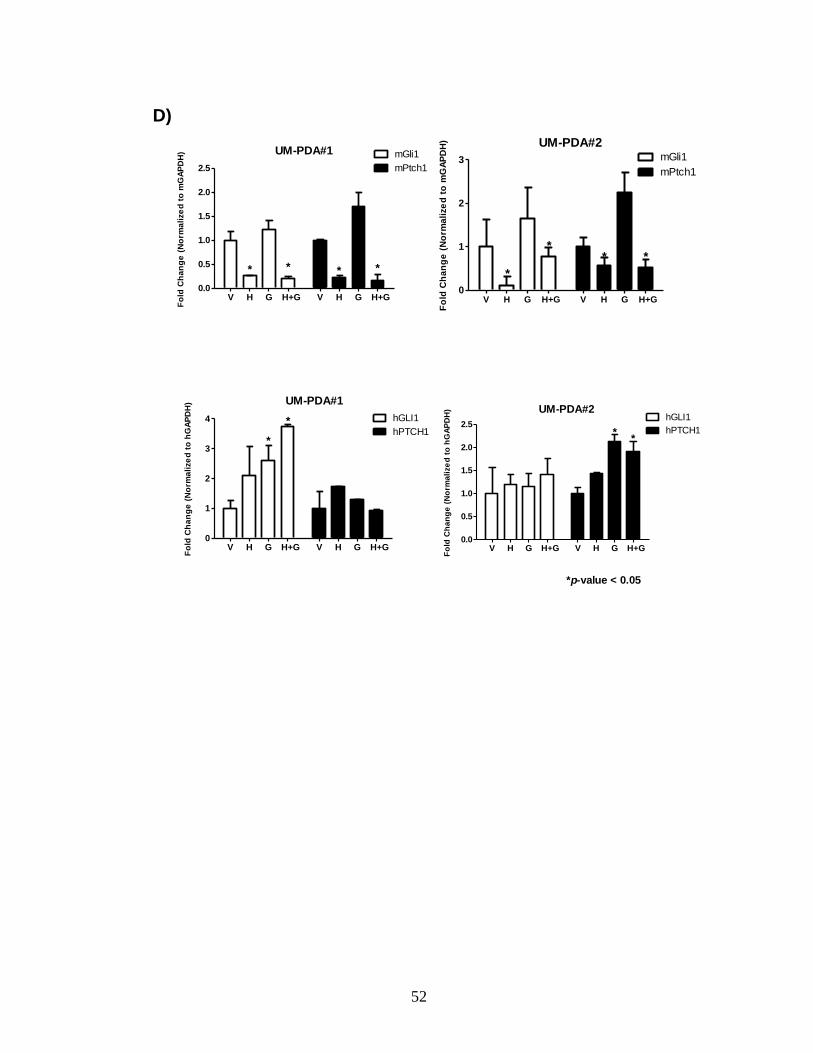
52
UM-PDA#1
V H G H+G V H G H+G0.0
0.5
1.0
1.5
2.0
2.5
mGli1
mPtch1
** * *
Fo
ld C
ha
ng
e (
No
rma
lize
d t
o m
GA
PD
H)
V H G H+G V H G H+G0
1
2
3
UM-PDA#2mGli1
mPtch1
*
***
Fo
ld C
ha
ng
e (
No
rma
lize
d t
o m
GA
PD
H)
V H G H+G V H G H+G0
1
2
3
4 hGLI1
hPTCH1
UM-PDA#1
*
*
Fo
ld C
ha
ng
e (
No
rma
lize
d t
o h
GA
PD
H)
V H G H+G V H G H+G0.0
0.5
1.0
1.5
2.0
2.5hGLI1
hPTCH1
UM-PDA#2
**
Fo
ld C
ha
ng
e (
No
rma
lize
d t
o h
GA
PD
H)
*p-value < 0.05
D)

53
Figure 2.3 Evidence of Differentiation for Tumors UM-PDA#1 and #2 following
HhAntag and Gemcitabine Treatment. (A, C) Trichrome stain of tumor UM-
PDA#1 and UM-PDA#2 treatment groups. Note the cytoplasmic vesicles and
intracytoplasmic lumens found in the groups treated with both
HhAntag+Gemcitabine. (B, D) Periodic acid-Schiff (PAS) staining of tumor UM-
PDA#1 and UM-PDA#2 treatment groups. Robust PAS staining for both tumor sets
with HhAntag+gemcitabine treatment indicates increases in mucinous secretions.
Control HhAntag
Gem HhAntag+Gem
Control HhAntag
Gem
HhAntag+Gem
Gem HhAntag+Gem
A)
B)

54
Control HhAntag
Gem HhAntag+Gem
Control HhAntag
Gem HhAntag+Gem
C)
D)

55
Figure 2.4 HhAntag Treatment Decreases Incidence of Distant Metastases. (A)
UM-PDA#1 orthotopic xenografts following 21 days of treatment. Black arrow
denotes the primary tumor site. (B) H&E sections from metastatic lesions from the
control treated xenografts (i) Tumor implant in the muscle wall of the diaphragm, (ii)
tumor implant superficial to the liver (iii) tumor lesion in the lymph nodes adjacent to
the small intestine, (iv) tumor lesion in the spleen. (C) Graphical representation of the
number of mice with metastasis to different organ sites. Statistical comparisons were
made from each treatment group compared to controls (n = 7 each, *denotes p-value
< 0.05). V= vehicle, G= gemcitabine, H= HhAntag, H+G= HhAntag + Gemcitabine
treatment.
Control HhAntag
Gem HhAntag+Gem
A)

56
i ii
iii iv
B)
Liver
Veh
icle
HhA
ntag
Gem
HhA
ntag+G
em
0
20
40
60
80
% o
f M
ice w
ith
Meta
sta
sis
Peritoneum
Veh
icle
HhA
ntag
Gem
HhA
ntag+G
em
0
20
40
60
80
100
*
* *% o
f M
ice w
ith
Meta
sta
sis
Lymph node
Veh
icle
HhA
ntag
Gem
HhA
ntag+G
em
0
20
40
60
80
*
* *% o
f M
ice w
ith
Meta
sta
sis
* p-value < 0.05Fisher's exact test
n= 7 per group
C)

57
Figure 2.5 Analyses of CD44+/CD24
+/ESA
+ Cells Following HhAntag Treatment.
(A, B) FACS analysis of UM-PDA#1 and UM-PDA#2 xenografts following
treatment. Analysis was performed in triplicate from three individually treated
animals (*denotes p-value < 0.05). (C) Tumors derived from subcutaneous
implantation of UM-PDA#2 cells from each treatment group. C=control, H=HhAntag
only, G=Gemcitabine only, H+G=HhAntag + Gemcitabine combination (n = 3). (D)
Graphical representation of re-implanted UM-PDA#2 tumors (*denotes p-value <
0.05).
UM-PDA#1
Contr
ol
HhA
ntag
Gem
HhA
ntag+G
em
0
20
40
60
CD
44+
/CD
24+
/ES
A+
(%
)
UM-PDA#2
Contr
ol
HhA
ntag
Gem
HhA
ntag+G
em
0
1
2
3
4
* *
ns
Fin
al T
um
or
Weig
ht
(g)
UM-PDA#2
Contr
ol
HhA
ntag
Gem
HhA
ntag+G
em
0
1
2
3
4
5
* *
CD
44+
/CD
24+
/ES
A+
(%
)
A)
B)
C)
D) C
H
G
H+G

58
Figure 2.6 Histological Analysis of Patient PDA Biopsy Before and After
treatment with GDC-0449. H&E sections of patient tumor biopsies prior and post
treatment with GDC-0449. Arrows highlight the vacuolated structures observed in
the tumor cells post treatment (20 x magnifications).
Pre-Treatment 3wks Post-Treatment GDC-0449

59
Table 2.1 Origin, stage, and pathology of human pancreatic ductal
adenocarcinoma tumors included in this study.

60
Table 2.2 Quantitative expression (qRT-PCR) of Hh pathway genes and cancer
stem cell profiles of human PDA xenografts used in this study.

61
CHAPTER 3
PARACRINE HEDGEHOG SIGNALING ACTIVATES CELL MOTILITY
PROGRAMS IN PANCREATIC STELLATE CELLS
SUMMARY
The Hedgehog (Hh) signaling pathway plays an important role in the
development and function of the pancreas. Several studies have demonstrated
aberrant Hh signaling in the progression of pancreatic cancer. Active Hh signaling in
pancreatic cancer occurs through a paracrine mechanism in which pancreatic tumor
cells secrete Hh ligands that activate the pathway in the surrounding stromal cells.
The biological role of Hh signaling in the tumor stroma is unclear. To identify the Hh
responsive genes which may be activated in the pancreatic tumor mesenchyme, we
performed transcriptional profiling on a primary, immortalized mouse pancreatic
stellate cell line stimulated with recombinant Sonic hedgehog (Shh) ligand. We
identified 206 genes that were differentially regulated by Shh in these cells.
Bioinformatic analysis of the Shh-responsive gene data set revealed a strong
correlation with genes that increased the motility of mesenchymal cells in
extracellular matrix. This was confirmed by 2D and 3D invasion assays that
demonstrated that paracrine Hh signaling increases the invasion of pancreatic stellate
cells in type I collagen. These results confirm that paracrine Hh signaling enhances
the invasiveness of pancreatic stellate cells and down-regulation of this pathway may
provide an important therapeutic target for treating pancreatic cancer patients.

62
INTRODUCTION
The aberrant activation of Hedgehog (Hh) signaling has been characterized in
pancreatic cancer in several studies [30,31]. Active Hh signaling in pancreatic cancer
occurs through a paracrine mechanism in which tumor cells secrete Hh ligands, Sonic
and Indian hedgehog (Shh and Ihh, respectively) which activate Hh pathway target
genes in the tumor mesenchyme [32,33]. It is still unclear what biological effect
paracrine Hh signaling imparts on the tumor mesenchyme. However, ectopic
expression of Shh by normal pancreatic epithelial cells has been shown to stimulate a
desmoplastic reaction in the pancreas [81]. This expansion of stromal cells and
extensive production of extracellular matrix components is a feature that defines
pancreatic cancer, and appears to play a major role in the resistance of tumor cells to
chemotherapeutic treatments and in mediating the invasiveness of pancreatic tumor
cells [79,127].
The pancreatic tumor stroma is comprised of several different components
including stellate cells, endothelial cells, nerve cells, and immune cells such as
macrophages, lymphocytes, dendritic cells, along with the extracellular matrix.
Pancreatic stellate cells (PSCs) have become the main focus of studies involving
pancreatic tumor-stromal interactions due to their critical role in the desmoplastic
response [76]. In the normal pancreas, these cells envelop the acinar structures of the
exocrine pancreas and remain quiescent with vacuoles that contain large vitamin-A
deposits. However, these cells can become activated by growth factors and cytokines
(PDGF, IL-1, TNF-α, TGF-β, activin A) or in response to pancreatic injury or disease
[128]. Activated PSCs lose the vitamin-A droplets, proliferate rapidly, and transition
63
to a myofibroblast-like phenotype with increased secretion of extracellular matrix
components, including type I collagen, laminin, and fibronectin [129].
Several studies have demonstrated that canonical Hh signaling in pancreatic
adenocarcinoma is confined to the stromal compartment [32,33]. Additionally,
stromal cells which are negative for platelet endothelial cell adhesion molecule
(PECAM-1 or CD31), which include pancreatic stellate cells, are responsive to
inhibitors of the Hh pathway, while CD31+ vascular cells do not show reduced levels
of Hh pathway target genes in pancreatic cancer xenografts treated with an Hh
pathway inhibitor (unpublished observations). This suggests that pancreatic stellate
cells are the main target of Hh ligands in the pancreatic tumor microenvironment.
Paracrine Hh signaling in pancreatic cancer creates a positive feedback loop in
which Hh-regulated factors are differentially expressed to promote the growth and
progression of the pancreatic tumor cells. These factors are likely to include mitotic
and angiogenesis-related factors, extracellular matrix remodeling enzymes, and anti-
apoptotic proteins. Only a small number of factors induced by paracrine Hh signaling
in the tumor stroma have been characterized. Bone marrow derived mesenchymal
cells which home to the pancreatic tumor microenvironment in an Hh-regulated
mechanism expresses Angiopoietin-1 (Ang-1) and Insulin-like growth factor-1 (IGF-
1), which supports the neovascularization of the tumor [86]. We set out to identify
the Hh responsive gene signature in pancreatic stellate cells and identify how these
target genes may impact pancreatic tumor biology.

64
MATERIALS AND METHODS
Isolation and Cell Culture of Primary Pancreatic Fibroblasts
Primary pancreatic fibroblasts were obtained by treating either CD-1 (Charles River;
Wilmington, MA) mice or Immortomouse® animals (Charles River) with caerulein,
50μg/kg every hour for 6 hours three times a week, to induce chronic pancreatitis.
Following treatment, the fibrotic pancreata were excised and minced with a sterile
razor blade in Media 199. The tissue fragments were digested with 200U/ml of
Collagenase IV (Worthington; Lakewood, NJ) for 30 min to 1 hr. Tissue digests were
washed several times with serum media and filtered through a 40 μm nylon mesh (BD
Biosciences). Wild-type cells were cultured in DMEM 10% FBS media at 37°C/5%
CO2. Immortomouse-derived cells were cultured in 33°C/5% CO2 with the addition
of 10 U of mouse interferon gamma (R&D Systems; Minneapolis, MN).
Cell Culture for Array and Gene Validation
Prior to stimulation with Shh, primary and immortalized fibroblasts were incubated in
DMEM low-serum (0.5% FBS) overnight. Cells were treated 24 hrs with a range of
recombinant mouse Shh (R&D systems) at 100-1000ng/ml reconstituted in sterile
PBS. For experiments using 5E1, a Shh blocking antibody (Iowa Hybridoma Bank),
was added to the cultures at 1.0µg/ml at the same time as recombinant Shh. Total
RNA from control and treated cells was prepared for Illumina array analysis by using
the Illumina® TotalPrep™ RNA Amplification Kit (Ambion; Foster City, CA)
according to manufacturer’s instructions. Samples were checked for purity and
65
normalized for the Illumina MouseRef-8 v2.0 BeadChip by the University of
Michigan Sequencing Core.
Gene Expression Analysis of Target Genes
Following treatment, cells were trypsinized and pelleted using serum containing
media. Cells lysis was performed with buffer RLT (Qiagen) containing 2-
mercaptoethanol (Sigma-Aldrich). Cell lysates were collected and homogenized with
QiaShredder spin columns (Qiagen). For RNA extraction from tumor samples, the
tissue was homogenized with a rotor-stator homogenizer (Polytron). Total RNA was
extracted using the RNeasy Mini kit (Qiagen) according to the standard protocol
provided by the manufacturer with on-column DNAase digestion.
Total RNA quality and quantity was analyzed using a NanoDrop spectrophotometer
(Thermo Scientific). One microgram of Total RNA was used to transcribe cDNA
using the SuperScript® First-Strand Synthesis System (Invitrogen). From this cDNA
reaction, 2 µl of RT reaction was used for qPCR using POWER SYBR Mix (Applied
Biosystems) and the reaction was carried out on a DNA Engine Opticon Real-Time
Cycler (MJ Research). Primers used for qPCR are as follows: mouse Gli-1 forward:
GGA AGT CCT ATT CAC GCC TTG A, reverse: CAA CCT TCT TGC TCA CAC
ATG TAA G; mouse Ptch-1 forward: TTG TGG AAG CCA CAG AAA ACC,
reverse: TGT CTG GAG TCC GGA TGG A; mouse GAPDH forward: AGC CTC
GTC CCG TAG ACA AAA T, reverse: CCG TGA GTG GAG TCA TAC TGG A;
mouse TGFß2 forward: TCG ACA TGG ATC AGT TTA TGC G, reverse: CCC

66
TGG TAC TGT TGT AGA TGG A; mouse JAM2 forward: GTG CCC ACT TCT
GTT ATG ACT G, reverse: TTC CCT AGC AAA CTT GTG CCA; mouse SFRP2
forward: CGT GGG CTC TTC CTC TTC G, reverse: ATG TTC TGG TAC TCG
ATG CCG; mouse FGF9 forward: ATG GCT CCC TTA GGT GAA GTT, reverse:
TCA TTT AGC AAC ACC GGA CTG; mouse ANGPT4 forward: AGC AGC AAC
TGA CGG AGT TT, reverse: CTC TGC ACA GTC CTG GAA CA; mouse Tiam1
forward: CCT CAC TGG GAA AGT GGA AA, reverse: TCT TCT GCT TGG AAC
CGT CT; mouse MMP13 forward: AGT TGA CAG GCT CCG AGA AA, reverse:
GGC ACT CCA CAT CTT GGT TT; mouse IL-6, forward TAG TCC TTC CTA
CCC CAA TTT CC, reverse: TTG GTC CTT AGC CAC TCC TTC; mouse VEGFA
forward: GCA CAT AGA GAG AAT GAG CTT CC, reverse: CTC CGC TCT GAA
CAA GGC T; mouse GDF10 forward: CAG GAC ATG GTC GCT ATC CAC,
reverse: ACA GGC TTT TGG TCG ATC ATT TC; mouse Wnt-2 forward: CTC
GGT GGA ATC TGG CTC TG, reverse: CAC ATT GTC ACA CAT CAC CCT.
Microarray Data Analysis
Transcriptional profiling was performed on Illumina MouseRef-8 v2.0
BeadChips (San Diego, CA) according to the manufacturer directions. All
microarray data were analyzed in the statistical software R (v 2.10.1) with associated
packages from the Bioconductor Suite for molecular biology. The “lumi” package
was used for quality control and normalization of the chips, including background
adjustment, variance stabilization and quantile normalization. Following
normalization, empirical Bayes estimation of moderated t- and F-statistics was

67
computed to test for differential expression. Because of the relatively small number
of samples, an unadjusted p-value of less than 0.05 was used to determine statistical
significance.
Differentially regulated genes were further analyzed using Ingenuity Pathway
Analysis (IPA; Ingenuity Systems, Mountain View, CA; http://www.ingenuity.com).
IPA is a Java based program used to interpret the differentially expressed genes in
terms of an interaction network and identify predominant canonical pathways.
Canonical pathways analysis identified the pathways from the Ingenuity Pathways
Analysis library of canonical pathways that were most significant to the data set.
Molecules from the data set that met the statistically significant cutoff of an adjusted
p-value <0.05 and were associated with a canonical pathway in Ingenuity’s
Knowledge Base were considered for the analysis.
Collagen Invasion Assays
To analyze cell invasion, 20,000 pancreatic stellate cells were embedded in 20 μl of
type I collagen gel (2.0 mg/ml, BD Biosciences). After gelling, the plug was
embedded in a cell-free, 300 μl collagen gel (2.0 mg/ml) cultured within a 24-well
plate. After allowing the surrounding collagen to gel (1 h at 37°C), invasion was
stimulated with DMEM 10% FBS or DMEM 10% FBS media conditioned for 24 hrs
from L3.6pl cells, a human pancreatic cancer cell line . HhAntag was reconstituted in
DMSO and replaced in the culture every 2 days. 3D invasion was evaluated after 5
days in culture. Invasion distance from the inner collagen plug into the outer collagen
gel was quantified. This distance was calculated as the tip of the leading front of

68
stellate cells in 5 high power fields. Imaging was obtained using a Nikon Instruments
Eclipse Ti-U Microscope and processed using Nikon NIS-Elements software.
RESULTS
Primary culture of Mouse Pancreatic Stellate Cells (MPSCs)
Pancreatic stellate cells are specialized pancreatic support cells that have been
identified as a major source of the desmoplasia in chronic pancreatitis and in
pancreatic cancer [76,130]. To determine the biological role of paracrine Hh
signaling in the pancreatic mesenchyme, we developed cultures of primary mouse
pancreatic stellate cells (MPSCs) from both normal CD-1 mice (designated wild-type)
and from Immortomice, the latter in order to establish a primary, immortal cell line.
Cells isolated from an Immortomouse express a temperature-sensitive mutant of the
simian virus-40 large T-antigen (tsTAg) and allows for conditional immortalization of
primary cells [131]. These cells were isolated by culturing fibrotic pancreatic tissue
fragments from animals treated chronically with caerulein, a cholecystokinin (CCK)
analog which induces pancreatitis and activation of pancreatic stellate cells [78,132].
The outgrowths from these tissue fragments yielded spindle-like cells that are
characteristic of pancreatic stellate cells. Immunohistochemical staining of both
MPSC lines confirmed the expression of stellate cell markers: α-smooth muscle actin
(α-SMA) and vimentin (Figure 3.1 A). Flow cytometric analysis (FACS) was used
to ensure that the stellate cell lines were free of cells expressing vascular,
hematopoietic, or epithelial markers. MPSCs were less than 0.5% positive for both
CD31 and CD45 and negative for expression of the ductal epithelial marker CD133

69
[133] (Figure 3.1 B). Studies of MPSC cultures treated with recombinant mouse
Sonic hedgehog ligand showed that downstream Hh pathway target genes Gli1, Gli2,
Ptch1, and Ptch2 were up-regulated in a dose-dependent manner following Shh
stimulation, as evaluated by qRT-PCR analysis (Figure 3.1 C).
Transcriptional Profiling of Shh-Regulated Genes in MPSCs
To identify Shh-responsive genes in pancreatic stellate cell lines, we
performed microarray analysis using RNA isolated from both wild-type and
Immortomouse-derived pancreatic MPSCs cultured for 24 hrs in the presence or
absence of recombinant Sonic hedgehog (Shh). Isolated mRNA from 4 independent
cultures of both wild-type and immortomouse-derived cells were biotin-labeled and
hybridized to Illumina MouseRef-8 v2.0 BeadChips. In both the wild-type pancreatic
MPSC line and those derived from the Immortomouse, hierarchical clustering
dendrograms showed a distinct pattern of gene expression in cells treated with
recombinant Shh ligand compared with control cells (Figure 3.2 A).
To investigate the level of overlap between the statistically significant genes
that were changed between wild-type and Immortomouse cells treated with
recombinant Shh we used the R statistical software to compute an adjusted p-value of
(p < 0.05), used as a cut-off for detecting significant difference in expression levels.
In general, a narrow range of fold difference between the up/down Shh-regulated
genes were observed compared to control. We found that for the wild-type MPSC
data set this range was 2.48 to -1.69 fold change and for the Immortomouse MPSC
data set the range was 2.40 to -1.98 fold change. We chose to investigate genes with

70
≥ 1.2 fold-changes with an adjusted p-value of < 0.05 for further analysis. We
identified 340 genes differentially expressed in the wild-type MPSC Shh treated cells
and 206 genes differentially expressed in the Immortomouse, Shh treated cells with
an overlap of 51 genes between the two lines (Figure 3.2 B).
Bioinformatics Analysis of Hh Target Genes in MPSCs
To simplify our analysis of Hedgehog pathway target genes in subsequent
experiments, we utilized the data set from the Immortomouse-derived MPSCs treated
with Shh. We selected this set because the Immortomouse-derived MPSCs can be
manipulated easily in vitro for co-culture with tumor cells or knockdown studies used
for functional validation of target genes, and these cells are easily transfectable using
standard techniques. Additionally, it was our experience that the wild-type (normal)
pancreatic stellate cell line would senesce in vitro after 5 passages. Therefore, using
the immortomouse-derived pancreatic stellate cells gave us the greatest flexibility in
testing the role of Hh signaling in this cell type. In the immortomouse Shh-regulated
gene set, 125 genes were found to be up-regulated and 81 genes were found to be
down-regulated (Figure 3.3 A, Table 3.1).
Next, we compared our data set against two existing transcriptional profiles of
Shh-treated mesenchyme in the intestine and prostate [82,83]. We performed this
analysis to learn what genes and pathways are consistent with Hh activation in
mesenchymal cells and what Hh-regulated genes may be specific to the pancreatic
tumor microenvironment. Meta-analysis of all three data sets was performed by
using Ingenuity Pathway Analysis (IPA), a bioinformatics program designed to

71
identify differentially expressed genes in terms of an interaction network and identify
predominant canonical pathways. Among the top functional pathways consistent
with all three Shh-responsive gene data sets were: cellular growth and proliferation,
cell movement, cell cycle, cell death and immune cell tracking (Figure 3.3 B).
Individual genes that overlapped between the pancreatic and intestinal data set
include insulin-like growth factor-1 (IGF-1), growth differentiation factor 10
(GDF10), homeobox protein Nkx2-3 and leukemia inhibitory factor (LIF). Genes in
overlap between our pancreatic data set and the prostate data set were identified as
angiopoientin-4 (ANG-4), T-cell lymphoma invasion and metastasis 1 (TIAM1),
hairy and enhancer of split 1 (HES1), and Peptidyl-prolyl cis-trans isomerase
(FKBP1A). Two genes, 11β-hydroxysteroid dehydrogenase type 1 (HSD11B1) and
Sodium-and chloride-dependent taurine transporter (SLC6A6) were differentially
regulated in all three data sets. Additionally, we identified some factors that had not
been shown to be Hh-related genes and were found only in the pancreatic stellate cell
data set. These genes included Wnt2, TGFβ2, R-spondin1, and Fgf9. Our results
suggest that there may be some overlap in the Hh-regulated genes in organ-specific
mesenchyme, but there are subsets of Hh responsive genes that are specific to each
stromal environment.
Shh-regulated Expression of Hedgehog Pathway Target Genes in MPSCs
Analysis of Shh-regulated target genes in MPSCs revealed altered regulation
of genes related to secretory functions, cell movement, and angiogenesis pathways.
These results are consistent with the hypothesis that paracrine Hh signaling in these

72
cells supports tumor growth by altering the microenvironment. To further validate
these pathways, we assessed mRNA expression of representative genes identified in
the microarray data set. We selected nine mRNAs that were up-regulated and three
that were down-regulated for further analysis. The nine up-regulated genes we
selected for validation were: Fgf9, Gdf10, Angpt4, Wnt2, Tgfβ2, Tiam1, IL6, VegfA,
and Gli1. The three down-regulated genes we selected for analysis were: Sfrp2,
Jam2, and Mmp13. In addition, as there is some speculation that commercially
available recombinant Shh products may be contaminated with endotoxins that can
affect expression of chemokines [134], we also assessed the specificity of the Shh-
induced gene response by culturing MPSCs in 500 ng/ml of recombinant Shh with or
without addition of 1.0 µg/ml of the Shh blocking antibody, 5E1 [135]. Of the twelve
genes evaluated by qRT-PCR, ten out of the twelve genes exhibited significant Shh
regulated expression consistent with our microarray data (Figure 3.4).
To determine if the genes identified in our Shh regulated gene profile were
specific to pancreatic mesenchymal cells or general to Shh regulated gene expression
in other mesenchymal cell types we performed the same gene expression analysis in
primary mouse embryonic fibroblasts (MEFs). We found that only five out of the
twelve genes analyzed exhibited significant Shh regulated gene expression (Figure
3.5). This suggests that there is a subset of Hh pathway responsive genes, including
Fgf9, Tgfβ2, VegfA, IL6 and Sfrp2, that may be pancreatic specific.
Hh Pathway Regulates Motility of MPSCs in 2D and 3D Extracellular Matrix
Culture

73
We identified several Shh-responsive genes in MPSCs that have been
implicated in cell motility. To test whether paracrine Hh signaling affects cell
motility, we examined how MPSCs responded to Hh pathway stimulation or
inhibition in 2-dimensional (2D) and 3-dimensional (3D) invasion assays. For 2D
invasion, MPSCs were seeded in the upper-well of a Boyden chamber (8 µm pores)
and overlaid with a thin-layer of Matrigel. Increasing amounts of recombinant Shh
ligand was added to the lower well of the chamber and the number of invading cells
that had transversed to the other side of the membrane were counted after 24 hrs.
Increasing amounts of recombinant Shh added to the lower chamber resulted in
corresponding increases in the amount of invading MPSCs through Matrigel (Figure
3.6 A).
To assess how inhibition of paracrine Hh signaling affects the ability of
MPSCs to invade in 3D extra-cellular matrix, we imbedded MPSCs in type I collagen
plugs surrounded by a field of cell-free type I collagen. Invasion was stimulated by
either standard DMEM 10% serum media, conditional media from L3.6pl cells (a
high Shh expressing pancreatic cancer cell line [33]), or conditioned media with
increasing doses of HhAntag, a Smoothened inhibitor and Hh pathway antagonist.
We observed a significant increase in the invasion of MPSCs following addition of
the L3.6pl conditioned media compared to the standard media. Following addition of
HhAntag to conditioned media, we observed a decrease in invasion in a dose-
dependent manner (Figure 3.6 B).

74
DISCUSSION
The tumor mesenchyme has long been implicated in playing an important role
in tumor angiogenesis, metastasis, and overall growth and proliferation of cancer
cells. Work in our lab and others has demonstrated that Hh signaling is activated in
the pancreatic tumor stroma via a paracrine mechanism in which tumor cells secrete
Hh ligands and activate the downstream Hh target genes [33]. However, very little
was known about what downstream genes and biological changes may be induced in
the tumor mesenchyme by paracrine Hh signaling. These studies are the first
documentation of an Hh responsive gene signature in pancreatic mesenchymal cells,
and the role of Hh signaling in stimulating the motility of these cells in extracellular
matrix.
The lack of definitive cell-surface markers and early senescence of primary
cultures prevents the direct isolation and long-term culture of pancreatic stellate cells
from the normal pancreas. By using a pancreatitis-induced method to activate
pancreatic stellate cells from Immortomouse animals, we were able to derive a
permanent cell line to manipulate for long-term in vitro and in vivo experiments.
These cells express established markers of pancreatic stellate cells, which include α-
smooth muscle actin and vimentin [129] and are responsive to Sonic hedgehog
ligand.
The time point selected for microarray analysis of our pancreatic stellate cell
lines stimulated with Hh ligand was based on previously published studies
characterizing the kinetics of Ptch1 and Gli1 induction in Shh-treated prostate and
intestinal mesenchymal cells [82,83,136]. Our preliminary experiments suggested

75
that 24 hrs after Shh stimulation was an optimal time point to measure a strong
transcriptional response of both primary and secondary Hh-responsive genes.
Quantitative expression analysis of Hh target genes, Gli1 and Patched1 (Ptch1),
which are indicative of active Hh signaling [43] were significantly up-regulated in
MPSCs following stimulation with Sonic hedgehog.
Several previous studies have used microarrays to investigate the target genes
of Shh signaling in mesenchymal cell types. Shh-stimulation of C3H/10T1/2 cells, an
immortalized mouse embryonic fibroblast cell line, identified 11 induced genes
(including IGF2) and 4 repressed genes (including Sfrp-1 and Sfrp-2) [137]. Recent
studies with Shh-stimulation of organ specific mesenchymal cells from the prostate
and intestine have also been profiled by microarray analysis [82,83]. In comparison
to these studies, we identified several genes in our data set that were previously
identified as potential Hh target genes in mesenchymal cells. These include Gdf10,
Nkx2-3, Ang-4, Tiam1, Hes1, Sfrp-2, IGF1 and IGF2. Several of these genes have
demonstrated important functions in pancreatic cancer and other malignancies. IGF-1
and Ang-2 have been shown to be up-regulated by Sonic hedgehog in bone marrow
derived mesenchymal cells and these factors are involved in promoting the
neovascularization of growing pancreatic tumors [86]. Additionally, aberrant
regulation of Tiam1 in breast cancer associated fibroblasts has been shown to increase
the invasiveness of breast cancer cells [138].
Our studies also identified several genes that had not been previously
identified as Hh targets. These potential target genes included Wnt2, TGFβ2, R-
spondin1, and Fgf9. The activation of pancreatic stellate cells from their normal

76
quiescent state to a highly proliferative state is mediated in part by TGFß signaling
[139]. It is possible that paracrine Hh signals from the tumor help to perpetuate this
phenotype in pancreatic stellate cells as we observed several TGFß signaling genes
that were up-regulated with Shh-stimulation in pancreatic stellate cells. While there
has not been a role established for Wnt signaling in pancreatic mesenchyme, the Wnt
pathway is up-regulated in pancreatic cancer and micro-dissection studies of tumor
stroma from patients with pancreatic adenocarcinoma has identified the up-regulation
of Wnt5a and down-regulation of Sfrp-1 [140,141]. Recent studies have suggested a
role for Wnt to enhance proliferation in the epithelium and stroma of chemically
induced bladder cancer in mice [142]. In this work, sonic hedgehog expression in
basal cells of the bladder increases upon injury and elicits increased stromal
expression of Wnt protein signals, including Wnt-2 expression, which in turn
stimulates the proliferation of both urothelial and stromal cells. This type of feedback
mechanism may also be at work in the pancreatic tumor microenvironment.
Inhibition of paracrine Hh signaling in mouse models of pancreatic cancer and
in cell line xenograft studies have demonstrated a reduction in distant metastases
without dramatic changes in primary tumor volume [80,122]. This suggests that a
primary role of paracrine Hh signaling in pancreatic tumor stroma is to mediate the
invasion and extravasation of tumor cells. Therefore, we used Ingenuity Pathways
Analysis (IPA) to determine whether Hh-responsive genes in mesenchymal cells
derived from organs with known paracrine Hh signaling mechanisms correlated with
an invasive gene signature. IPA meta-analysis confirmed that paracrine Hh signaling
in MPSCs, along with data sets in prostate and intestinal mesenchyme, induces the

77
expression of genes that correspond with cell motility, inflammation, and mitotic
activity. Genes that were in overlap between the pancreatic and intestinal data set
include insulin-like growth factor-1 (IGF1), growth differentiation factor 10
(GDF10), homeobox protein Nkx2-3 and leukemia inhibitory factor (LIF).
Expression of Nkx2-3 in gut mesenchyme has been linked to the specification and
proliferation of the intestinal epithelium [143]. In overlap with the prostate data set
we identified angiopoientin-4 (ANG-4), T-cell lymphoma invasion and metastasis 1
(TIAM1), hairy and enhancer of split 1 (HES1), and Peptidyl-prolyl cis-trans
isomerase (FKBP1A). Two genes, 11β-hydroxysteroid dehydrogenase type 1
(HSD11B1) and Sodium-and chloride-dependent taurine transporter (SLC6A6) were
differentially regulated in all three data sets, although these genes have not been
linked to tumor invasion.
In order for pancreatic tumor cells to invade into the surrounding tissues, the
cells have to overcome several physical barriers. These barriers include degradation
of the epithelial basement membrane, navigation of the interstitial matrix, along with
neovascularization of the growing tumor and extravasation of tumor cells out of the
vascular network [144]. Many of these processes are normally controlled by
mesenchymal cells during the development of the organ and during tissue repair
following injury [75]. When we directly examined 12 genes related to these
functional pathways, 10 out of 12 showed specific regulation by Hh ligand which was
reversed by treatment with 5E1 blocking peptide that inhibited downstream Hh
pathway activation. Interestingly, three of the genes that we analyzed including
Wnt2, Gdf10, and IL6 were identified as differentially regulated in a microarray study

78
of tumor stroma from animals with pancreatic adenocarcinoma xenografts treated
with a Hh pathway inhibitor [33]. Independent validation of these genes by a
reciprocal transcriptional profiling study, suggests that these genes are indeed Hh
target genes in the pancreatic tumor mesenchyme.
While we identified genes that are induced by paracrine Hh signaling, there is
little known about how activation of this pathway affects the biological function of
pancreatic stellate cells or cancer cells. Recent studies using an organotypic model of
tumor invasion has suggested that tumor cells rely on mesenchymal cells to carve
tracks in the interstitial matrix in order to invade into the surrounding tissues [145].
We observed that MPSCs stimulated with sonic hedgehog increased their
transmigration through Matrigel, a pseudo-model of epithelial basement membrane.
To test how paracrine Hh signaling affects the ability of MPSCs to navigate the
interstitial matrix we utilized a 3D invasion assay in type I collagen. Conditioned
media from an Hh ligand-expressing pancreatic cancer cell line was able to increase
the invasiveness of MPSCs in type I collagen, but this was inhibited in a dose
response with Smo-inhibition. These results suggest that paracrine Hh signaling in
MPSCs plays an important role in the motility of these cells through the extracellular
matrix.
In summary, we have developed a primary mouse pancreatic stellate cell line
for use in validating Hedgehog target genes in vitro, and have compiled the first data
set describing the Hedgehog responsive genes in pancreatic stellate cells. These
studies have provided insight into how paracrine Hh signaling in the tumor
mesenchyme increases the 3D migration of these cells and in turn we hypothesize that

79
this may lead to increased invasion of pancreatic tumor cells. Future studies will be
aimed at elucidating the functional role of these Hedgehog responsive genes and how
they are involved in the pancreatic tumor microenvironment. This information may
help us to learn how Hedgehog pathway inhibitors may be working in the pancreatic
tumor and provide insight into how we may target this pathway to improve patient
responses to treatment.
ACKNOWLEDGMENTS
Author Contributions: Joseph S. Dosch performed all the in vitro work with
the MPSCs. Special thanks to Marina Pasca di Magliano and Sabita Rakshit lab for
their assistance in inducing pancreatitis in both wild-type and Immortomouse
animals. Erin Shellman processed the all of the raw microarray data, performed
statistical analysis and uploaded files to IPA. The University of Michigan DNA
sequencing core processed the Illumina array chips with special assistance from
Susan Dagenai.

80
FIGURES
Figure 3.1 Generation of Mouse Pancreatic Stellate Cell Lines. (A)
Representative bright-field and immunofluorescence staining of MPSCs for α-SMA
and vimentin. MPSCs maintained their stellate-like or spindle shape through
passaging (original magnification: ×20). (B) FACS analysis of MPSCs for CD31,
CD45, and CD133. (C) Shh-stimulated dose response of downstream Hh pathway
genes Gli1, Gli2 and Ptch1, and Ptch2 in MPSCs as evaluated by qRT-PCR.
A)
B)
C)
CD31
CD133 CD45
IgG
α-SMA Vimentin Brightfield
0.1% 0.3%
0.5% 0.1%

81
Figure 3.2 Transcriptional Profiling of Shh-Regulated Target Genes in Mouse
Pancreatic Stellate Cells (MPSCs). (A) Hierarchical clustering of MPSC data sets
from wild-type (WT) and immortomouse-derived (Imm) treated with recombinant
Shh. The R software package was used to cluster and annotate the normalized array
data. (B) Venn diagram and table of Shh-regulated genes in overlap between the wild-
type (normal) and the immortomouse-derived MPSCs. While 51 genes were found in
overlap, only 42 of these genes were differentially changing in the same positive or
negative direction in both wild-type and immortomouse MPSC data sets.
A)
B)

82
Figure 3.3 Pathway Analysis of Shh-regulated Target Genes in MPSCs.
(A) Heat-map of the top 50 up and down regulated Shh-regulated target genes in
immortomouse-derived MPSCs. (B) Ingenuity Pathways Analysis (IPA) of
conserved functional pathways associated with Shh-regulated target genes in MPSCs
along with prostate and intestinal mesenchymal cells.
Control Shh Treated A)

83
B)

84
Figure 3.4 Shh-regulated Expression of Hedgehog Target Genes in MPSCs.
Specific target genes related to mitotic or invasive activity were selected for further
analysis. Gene expression was analyzed by qRT-PCR from MPSCs treated with
either Shh alone or in combination with the Shh blocking antibody, 5E1 for 24hrs (n
= 3; **, p < 0.01; *, p < 0.05).
FGF9
Control +Shh +Shh+5E10.000
0.005
0.010
0.015E
xp
ressio
n R
ela
tive t
o m
GA
PD
H
GDF10
Control +Shh +Shh+5E10.000
0.001
0.002
0.003
Exp
ressio
n R
ela
tive t
o m
GA
PD
H
ANGPT4
Control +Shh +Shh+5E10.00
0.01
0.02
0.03
0.04
0.05
Exp
ressio
n R
ela
tive t
o m
GA
PD
H
Wnt2
Control +Shh +Shh+5E10.0000
0.0005
0.0010
0.0015
0.0020
Exp
ressio
n R
ela
tive t
o m
GA
PD
H
TGFB2
Control +Shh +Shh+5E10.00
0.02
0.04
0.06
Exp
ressio
n R
ela
tive t
o m
GA
PD
H
Tiam1
Control +Shh +Shh+5E10.00
0.02
0.04
0.06
0.08
Exp
ressio
n R
ela
tive t
o m
GA
PD
H
IL6
Control +Shh +Shh+5E10.000
0.005
0.010
0.015
Exp
ressio
n R
ela
tive t
o m
GA
PD
H
VEGFA
Control +Shh +Shh+5E10.00
0.05
0.10
0.15
Exp
ressio
n R
ela
tive t
o m
GA
PD
H Gli1
Control +Shh +Shh+5E10.000000
0.000002
0.000004
0.000006
Exp
ressio
n R
ela
tive t
o m
GA
PD
H
SFRP2
Control +Shh +Shh+5E10.000
0.005
0.010
0.015
0.020
0.025
Exp
ressio
n R
ela
tive t
o m
GA
PD
H
JAM2
Control +Shh +Shh+5E10.00
0.01
0.02
0.03
0.04
Exp
ressio
n R
ela
tive t
o m
GA
PD
H
MMP13
Control +Shh +Shh+5E10.000
0.002
0.004
0.006
0.008
0.010
Exp
ressio
n R
ela
tive t
o m
GA
PD
H
* * *
**
* *
**
* *
Up
Down

85
Figure 3.5 Shh-regulated Expression of Hedgehog Target Genes in Mouse
Embryonic Fibroblasts (MEFs). Specific target genes related to mitotic or invasive
activity were selected for further analysis. Gene expression was analyzed by qRT-
PCR from MPSCs treated with either Shh alone or in combination with the Shh
blocking antibody, 5E1 for 24hrs (n = 3; **, p < 0.01; *, p < 0.05).
Fgf9
Control +Shh +Shh+5E10.0000
0.0005
0.0010
0.0015
Exp
ressio
n R
ela
tive t
o m
GA
PD
H
GDF10
Control +Shh +Shh+5E10.00
0.05
0.10
0.15
Exp
ressio
n R
ela
tive t
o m
GA
PD
H ANGPT4
Control +Shh +Shh+5E10.000
0.002
0.004
0.006
0.008
0.010
Exp
ressio
n R
ela
tive t
o m
GA
PD
H
Wnt2
Control +Shh +Shh+5E10.000
0.002
0.004
0.006
0.008
Exp
ressio
n R
ela
tive t
o m
GA
PD
H
TGFB2
Control +Shh +Shh+5E10.00
0.05
0.10
0.15E
xp
ressio
n R
ela
tive t
o m
GA
PD
H Tiam1
Control +Shh +Shh+5E10.000
0.005
0.010
0.015
0.020
0.025
Exp
ressio
n R
ela
tive t
o m
GA
PD
H
IL6
Control +Shh +Shh+5E10.0000
0.0005
0.0010
0.0015
Exp
ressio
n R
ela
tive t
o m
GA
PD
H VEGFA
Control +Shh +Shh+5E10.00
0.05
0.10
0.15
Exp
ressio
n R
ela
tive t
o m
GA
PD
H
Gli1
Control +Shh +Shh+5E10.0000
0.0005
0.0010
0.0015
Exp
ressio
n R
ela
tive t
o m
GA
PD
H
SFRP2
Control +Shh +Shh+5E10.000
0.005
0.010
0.015
0.020
0.025
Exp
ressio
n R
ela
tive t
o m
GA
PD
H
JAM2
Control +Shh +Shh+5E10.000
0.005
0.010
0.015
0.020
0.025
Exp
ressio
n R
ela
tive t
o m
GA
PD
H
MMP13
Control +Shh +Shh+5E10.00
0.05
0.10
0.15
Exp
ressio
n R
ela
tive t
o m
GA
PD
H
*
*
*
*
**
UP
Down

86
Figure 3.6 Paracrine Hh Signaling Regulates 2D and 3D invasion of MPSCs in
Extracellular Matrix. (A) 2D Matrigel transmigration assay. MPSCs seed in the
upper well of a Boyden chamber (8um pores) and increasing amounts of recombinant
Shh added to the lower chamber. Number of invading cells counted in 5 random
high-power fields (n = 3; **, p < 0.01; *, p < 0.05). (B) 3D collagen invasion assay.
MPSCs seeded in a droplet of type I collagen (2mg/ml) surrounded by a field of cell
free collagen. Invasion induced with standard media, conditioned media (CM) from
L3.6pl cells, or CM with increasing doses of HhAntag (n = 3; *, p < 0.05, # < 0.05
(compared to conditioned media stimulated cells)
A) 0 µg/ml SHH 0.5 µg/ml SHH
1.0 µg/ml SHH 2.0 µg/ml SHH
Contr
ol
0.5u
g/ml S
hh
1.0u
g/ml S
hh
2.0u
g/ml S
hh
0
200
400
600
800
*
**
*
Cells In
vad
ed
per
40x F
ield
DMEM CM
CM+1uM HhAntag CM+10uM HhAntag
B)
Sta
ndard M
edia
Conditi
oned M
edia
CM
+ 1
uM H
hAnta
g
CM
+ 1
0uM
HhA
ntag
0
200
400
600
800
Invasio
n D
ep
th (
µm
) *
#
#

87
Table 3.1 Genes Differentially Regulated by Shh-treatment in Immortomouse
derived MPSCs. Table generated for genes with a statistical p-value < 0.05 and a
fold change ± 1.2.
Gene
Symbol
Description
Fold
Change
KRT18 Mus musculus keratin 18 (Krt18), mRNA. 2.206558
LMCD1
Mus musculus LIM and cysteine-rich domains 1 (Lmcd1),
mRNA.
2.054663
PPFIBP2
Mus musculus protein tyrosine phosphatase, receptor-type, F
interacting protein, binding protein 2 (Ppfibp2), mRNA.
2.045533
GOLGA2
Mus musculus golgi autoantigen, golgin subfamily a, 2
(Golga2), transcript variant 1, mRNA.
2.042706
WFDC1 Mus musculus WAP four-disulfide core domain 1, mRNA 1.959638
TGFB3
Mus musculus transforming growth factor, beta 3 (Tgfb3),
mRNA.
1.851058
COL4A1 Mus musculus procollagen, type IV, alpha 1 (Col4a1), mRNA. 1.83121
TST
Mus musculus thiosulfate sulfurtransferase, mitochondrial (Tst),
nuclear gene encoding mitochondrial protein, mRNA.
1.588525
KRT8 Mus musculus keratin 8 (Krt8), mRNA. 1.579524
FGF9 Mus musculus fibroblast growth factor 9 1.573808
MID1IP1
Mus musculus Mid1 interacting protein 1 (gastrulation specific
G12-like (zebrafish)) (Mid1ip1), mRNA.
1.551006
FADS2 Mus musculus fatty acid desaturase 2, mRNA 1.531375
GDF10 Mus musculus growth differentiation factor 10 (Gdf10), mRNA. 1.517269
SMTNL2 Mus musculus smoothelin-like 2 (Smtnl2), mRNA. 1.512132
COL4A2 Mus musculus collagen, type IV, alpha 2 (Col4a2), mRNA. 1.508298
TGM2
Mus musculus transglutaminase 2, C polypeptide (Tgm2),
mRNA.
1.503153
GAS6 Mus musculus growth arrest specific 6 (Gas6), mRNA. 1.482343
BOK Mus musculus BCL2-related ovarian killer protein 1.47937
ANGPT4 Mus musculus angiopoietin 4 (Angpt4), mRNA. 1.472825
WNT2 Mus musculus wingless-related MMTV integration site 2 1.460694

88
Gene
Symbol
Description
Fold
Change
(Wnt2), mRNA.
CP Mus musculus ceruloplasmin (Cp), transcript variant 2, mRNA. 1.457289
CYP2S1
Mus musculus cytochrome P450, family 2, subfamily s,
polypeptide 1 (Cyp2s1), mRNA.
1.447383
COL6A1 Mus musculus procollagen, type VI, alpha 1 (Col6a1), mRNA. 1.440276
KRT7 Mus musculus keratin 7 (Krt7), mRNA. 1.428984
RSPO1
Mus musculus R-spondin homolog (Xenopus laevis) (Rspo1),
mRNA.
1.427315
ZFYVE21
Mus musculus zinc finger, FYVE domain containing 21
(Zfyve21), mRNA.
1.426355
USP2
Mus musculus ubiquitin specific peptidase 2 (Usp2), transcript
variant 2, mRNA.
1.426266
ARL6 Mus musculus ADP-ribosylation factor-like 6 (Arl6), mRNA. 1.426228
CTSA Mus musculus cathepsin A (Ctsa), transcript variant 2, mRNA. 1.417241
HIST1H2AD Mus musculus histone cluster 1, H2ad (Hist1h2ad), mRNA. 1.404944
HIST1H2AK Mus musculus histone cluster 1, H2ak (Hist1h2ak), mRNA. 1.404306
DIO3 Mus musculus deiodinase, iodothyronine type III 1.401211
TNFRSF21
Mus musculus tumor necrosis factor receptor superfamily,
member 21 (Tnfrsf21), mRNA.
1.400688
COL6A2 Mus musculus procollagen, type VI, alpha 2 (Col6a2), mRNA. 1.395217
TNFRSF22
Mus musculus tumor necrosis factor receptor superfamily,
member 22 (Tnfrsf22), mRNA.
1.394095
BMPER
Mus musculus BMP-binding endothelial regulator (Bmper),
mRNA.
1.392803
SLC6A6
Mus musculus solute carrier family 6 (neurotransmitter
transporter, taurine), member 6 (Slc6a6), mRNA.
1.38631
HSD11B1
Mus musculus hydroxysteroid 11-beta dehydrogenase 1
(Hsd11b1), transcript variant 1, mRNA.
1.385022
TGFB2
Mus musculus transforming growth factor, beta 2 (Tgfb2),
mRNA.
1.383533
GNL2 Mus musculus guanine nucleotide binding protein-like 2 1.370491

89
Gene
Symbol
Description
Fold
Change
(nucleolar) (Gnl2), mRNA.
PLTP Mus musculus phospholipid transfer protein (Pltp), mRNA. 1.356291
FBLIM1 Mus musculus filamin binding LIM protein 1 (Fblim1), mRNA. 1.352369
TIAM1
Mus musculus T-cell lymphoma invasion and metastasis 1
(Tiam1), mRNA.
1.348358
NNAT Mus musculus neuronatin (Nnat), transcript variant 1, mRNA. 1.344158
TSPAN33 Mus musculus tetraspanin 33 (Tspan33), mRNA. 1.338362
WWC1
Mus musculus WW, C2 and coiled-coil domain containing 1
(Wwc1), mRNA.
1.337408
PLEKHA7
Mus musculus pleckstrin homology domain containing, family
A member 7 (Plekha7), mRNA.
1.331558
PMP22 Mus musculus peripheral myelin protein (Pmp22), mRNA. 1.32949
ZFP521
Mus musculus zinc finger protein 521 (Zfp521), transcript
variant 2, mRNA.
1.328459
CDH3 Mus musculus cadherin 3 (Cdh3), transcript variant 1, mRNA. 1.324222
BLMH Mus musculus bleomycin hydrolase (Blmh), mRNA. 1.321113
CLTB Mus musculus clathrin, light polypeptide (Lcb) (Cltb), mRNA. 1.32065
RAP2A Mus musculus RAS related protein 2a (Rap2a), mRNA. 1.314896
ST6GAL1
Mus musculus beta galactoside alpha 2,6 sialyltransferase 1
(St6gal1), mRNA.
1.312454
NKX2-3
Mus musculus NK2 transcription factor related, locus 3
(Drosophila)
1.306788
CYGB Mus musculus cytoglobin (Cygb), mRNA. 1.300345
CCND1 Mus musculus cyclind1, mRNA 1.297539
NUAK2
Mus musculus NUAK family, SNF1-like kinase, 2 (Nuak2),
mRNA.
1.296356
GADD45G
Mus musculus growth arrest and DNA-damage-inducible 45
gamma (Gadd45g), mRNA.
1.293528
HES1
Mus musculus hairy and enhancer of split 1 (Drosophila) (Hes1),
mRNA.
1.292308

90
Gene
Symbol
Description
Fold
Change
OLFML3 Mus musculus olfactomedin-like 3 (Olfml3), mRNA. 1.29014
PLEKHO2
Mus musculus pleckstrin homology domain containing, family
O member 2 (Plekho2), mRNA.
1.287191
DCTN6 Mus musculus dynactin 6 (Dctn6), mRNA. 1.287151
DUSP1 Mus musculus dual specificity phosphatase 1 (Dusp1), mRNA. 1.287093
ZFP36 Mus musculus zinc finger protein 36 (Zfp36), mRNA. 1.28126
RHOB
Mus musculus ras homolog gene family, member B (Rhob),
mRNA.
1.279543
IGF2 Mus musculus insulin-like growth factor 2 (Igf2), mRNA. 1.274712
THY1 Mus musculus thymus cell antigen 1, theta (Thy1), mRNA. 1.271593
MGAT3
Mus musculus mannoside acetylglucosaminyltransferase 3
(Mgat3), mRNA.
1.270836
APRT Mus musculus adenine phosphoribosyl transferase, mRNA 1.26981
SH3KBP1
Mus musculus SH3-domain kinase binding protein 1 (Sh3kbp1),
mRNA.
1.265921
SERPINA3G
Mus musculus serine (or cysteine) peptidase inhibitor, clade A,
member 3G (Serpina3g), mRNA.
1.263668
IRF1 Mus musculus interferon regulatory factor 1 (Irf1), mRNA. 1.262768
PALM Mus musculus paralemmin (Palm), mRNA. 1.261623
IGF1
Mus musculus insulin-like growth factor 1 (Igf1), transcript
variant 1, mRNA.
1.260723
HRBL
Mus musculus HIV-1 Rev binding protein-like (Hrbl), transcript
variant 2, mRNA.
1.254217
ETS2
Mus musculus E26 avian leukemia oncogene 2, 3' domain
(Ets2), mRNA.
1.251346
PLK2 Mus musculus polo-like kinase 2 (Drosophila) (Plk2), mRNA. 1.250674
HIC1
Mus musculus hypermethylated in cancer 1 (Hic1), transcript
variant 1, mRNA.
1.249158
SMO
Mus musculus smoothened homolog (Drosophila) (Smo),
mRNA.
1.247802
BCAM Mus musculus basal cell adhesion molecule (Bcam), mRNA. 1.247336

91
Gene
Symbol
Description
Fold
Change
ZCCHC3
Mus musculus zinc finger, CCHC domain containing 3
(Zcchc3), mRNA.
1.246931
AW548124
Mus musculus expressed sequence AW548124 (AW548124),
mRNA.
1.246607
BIRC5
Mus musculus baculoviral IAP repeat-containing 5 (Birc5),
transcript variant 1, mRNA.
1.246125
IGSF9
Mus musculus immunoglobulin superfamily, member 9 (Igsf9),
mRNA.
1.245336
PPP1R13B
Mus musculus protein phosphatase 1, regulatory (inhibitor)
subunit 13B (Ppp1r13b), mRNA.
1.244152
H19 Mus musculus H19 fetal liver mRNA (H19) on chromosome 7. 1.241052
TOP2A Mus musculus topoisomerase (DNA) II alpha (Top2a), mRNA. 1.237934
NDST1
Mus musculus N-deacetylase/N-sulfotransferase (heparan
glucosaminyl) 1 (Ndst1), mRNA.
1.236784
SETD8
Mus musculus SET domain containing (lysine
methyltransferase) 8 (Setd8), mRNA.
1.231298
IGFBP4
Mus musculus insulin-like growth factor binding protein 4,
mRNA
1.230639
ACCN2
Mus musculus amiloride-sensitive cation channel 2, neuronal
(Accn2), mRNA.
1.230346
DUSP6 Mus musculus dual specificity phosphatase 6 (Dusp6), mRNA. 1.229589
TNFRSF11B
Mus musculus tumor necrosis factor receptor superfamily,
member 11b (osteoprotegerin) (Tnfrsf11b), mRNA.
1.227648
CHST11
Mus musculus carbohydrate sulfotransferase 11 (Chst11),
mRNA.
1.225853
RPIA Mus musculus ribose 5-phosphate isomerase A (Rpia), mRNA. 1.225795
LSM3
Mus musculus LSM3 homolog, U6 small nuclear RNA
associated (S. cerevisiae) (Lsm3), mRNA.
1.223725
BMP3 Mus musculus bone morphogenetic protein 3 (Bmp3), mRNA. 1.222016
FGF5 Mus musculus fibroblast growth factor 5 (Fgf5), mRNA. 1.221948
TMEM8
Mus musculus transmembrane protein 8 (five membrane-
spanning domains) (Tmem8), mRNA.
1.221207

92
Gene
Symbol
Description
Fold
Change
HMGA1
Mus musculus high mobility group AT-hook 1 (Hmga1),
transcript variant 1, mRNA.
1.220418
C1QTNF1
Mus musculus C1q and tumor necrosis factor related protein 1
(C1qtnf1), mRNA.
1.220298
BBX Mus musculus bobby sox homolog (Drosophila) (Bbx), mRNA. 1.215977
CHI3L1 Mus musculus chitinase 3-like 1 (Chi3l1), mRNA. 1.215013
MTHFD1
Mus musculus methylenetetrahydrofolate dehydrogenase
(NADP+ dependent), methenyltetrahydrofolate cyclohydrolase,
formyltetrahydrofolate synthase (Mthfd1), mRNA.
1.213704
E2F1 Mus musculus E2F transcription factor 1 (E2f1), mRNA. 1.212262
BANF1
Mus musculus barrier to autointegration factor 1 (Banf1),
transcript variant 2, mRNA.
1.20883
BICC1
Mus musculus bicaudal C homolog 1 (Drosophila) (Bicc1),
mRNA.
1.208602
GOLM1
Mus musculus golgi membrane protein 1 (Golm1), transcript
variant 2, mRNA.
1.208051
AXUD1 Mus musculus AXIN1 up-regulated 1 (Axud1), mRNA. 1.205341
LIF
Mus musculus leukemia inhibitory factor (Lif), transcript variant
2, mRNA.
1.205123
NME4
Mus musculus non-metastatic cells 4, protein expressed in
(Nme4), mRNA.
1.204789
FKBP1A Mus musculus FK506 binding protein 1a (Fkbp1a), mRNA. 1.204717
ISG20L2
Mus musculus interferon stimulated exonuclease gene 20-like 2
(Isg20l2), mRNA.
1.204517
BCAR3
Mus musculus breast cancer anti-estrogen resistance 3 (Bcar3),
mRNA.
1.203903
BHLHB2
Mus musculus basic helix-loop-helix domain containing, class
B2 (Bhlhb2), mRNA.
1.203725
CSRP1
Mus musculus cysteine and glycine-rich protein 1 (Csrp1),
mRNA.
1.202695
HS6ST1
Mus musculus heparan sulfate 6-O-sulfotransferase 1 (Hs6st1),
mRNA.
1.201955
CD44 Mus musculus CD44 antigen (Cd44), transcript variant 2, 1.201885

93
Gene
Symbol
Description
Fold
Change
mRNA.
PEAR1
Mus musculus platelet endothelial aggregation receptor 1
(Pear1), transcript variant 1, mRNA.
1.200346
SFRP2
Mus musculus secreted frizzled-related protein 2 (Sfrp2),
mRNA.
-1.98215
TGFBI
Mus musculus transforming growth factor, beta induced (Tgfbi),
mRNA.
-1.49519
PDLIM3 Mus musculus PDZ and LIM domain 3 (Pdlim3), mRNA. -1.46603
ALDOC Mus musculus aldolase 3, C isoform (Aldoc), mRNA. -1.45095
SGK1
Mus musculus serum/glucocorticoid regulated kinase 1 (Sgk1),
mRNA.
-1.43483
INSIG1 Mus musculus insulin induced gene 1 (Insig1), mRNA. -1.41735
UNC45B
Mus musculus unc-45 homolog B (C. elegans) (Unc45b),
mRNA.
-1.36753
OSR1
Mus musculus odd-skipped related 1 (Drosophila) (Osr1),
mRNA.
-1.36551
GUCY1A3
Mus musculus guanylate cyclase 1, soluble, alpha 3 (Gucy1a3),
mRNA.
-1.3646
PRPH Mus musculus peripherin (Prph), mRNA. -1.36395
FLRT2
Mus musculus fibronectin leucine rich transmembrane protein 2
(Flrt2), mRNA.
-1.35086
THBD Mus musculus thrombomodulin (Thbd), mRNA. -1.34709
PTGS1
Mus musculus prostaglandin-endoperoxide synthase 1 (Ptgs1),
mRNA.
-1.34438
ADAMTS2
Mus musculus a disintegrin-like and metallopeptidase
(reprolysin type) with thrombospondin type 1 motif, 2
(Adamts2), mRNA.
-1.33129
JAM2 Mus musculus junction adhesion molecule 2 (Jam2), mRNA. -1.32023
OGN Mus musculus osteoglycin (Ogn), mRNA. -1.31751
SEPP1
Mus musculus selenoprotein P, plasma, 1 (Sepp1), transcript
variant 2, mRNA.
-1.30435

94
Gene
Symbol
Description
Fold
Change
TAF9
Mus musculus TAF9 RNA polymerase II, TATA box binding
protein (TBP)-associated factor (Taf9), transcript variant 1,
mRNA.
-1.30409
KRT14 Mus musculus keratin 14 (Krt14), mRNA. -1.3036
GNB2L1
Mus musculus guanine nucleotide binding protein (G protein),
beta polypeptide 2 like 1 (Gnb2l1), mRNA.
-1.29407
MMP11 Mus musculus matrix metallopeptidase 11 (Mmp11), mRNA. -1.29144
CALCA
Mus musculus calcitonin/calcitonin-related polypeptide, alpha
(Calca), transcript variant 2, mRNA.
-1.29039
SEMA3C
Mus musculus sema domain, immunoglobulin domain (Ig), short
basic domain, secreted, (semaphorin) 3C, mRNA
-1.28747
IFITM1
Mus musculus interferon induced transmembrane protein 1
(Ifitm1), mRNA.
-1.28349
SNX1 Mus musculus sorting nexin 1 (Snx1), mRNA. -1.28272
MYH8
Mus musculus myosin, heavy polypeptide 8, skeletal muscle,
perinatal (Myh8), mRNA.
-1.28221
GPC2 Mus musculus glypican 2 (cerebroglycan) (Gpc2), mRNA. -1.28021
MCCC1
Mus musculus methylcrotonoyl-Coenzyme A carboxylase 1
(alpha) (Mccc1), mRNA.
-1.27913
PDE4DIP
Mus musculus phosphodiesterase 4D interacting protein
(myomegalin) (Pde4dip), transcript variant 1, mRNA.
-1.26682
PLEKHA4
Mus musculus pleckstrin homology domain containing, family
A (phosphoinositide binding specific) member 4 (Plekha4),
mRNA.
-1.26674
GRTP1 Mus musculus GH regulated TBC protein 1 (Grtp1), mRNA. -1.26576
OXR1 Mus musculus oxidation resistance 1 (Oxr1), mRNA. -1.26367
XDH Mus musculus xanthine dehydrogenase (Xdh), mRNA. -1.26142
NNMT
Mus musculus nicotinamide N-methyltransferase (Nnmt),
mRNA.
-1.26025
SEPT7 Mus musculus septin 7 (Sept7), mRNA. -1.26024
TUBB2B Mus musculus tubulin, beta 2b (Tubb2b), mRNA. -1.25523
UGT1A6A Mus musculus UDP glucuronosyltransferase 1 family, -1.25502
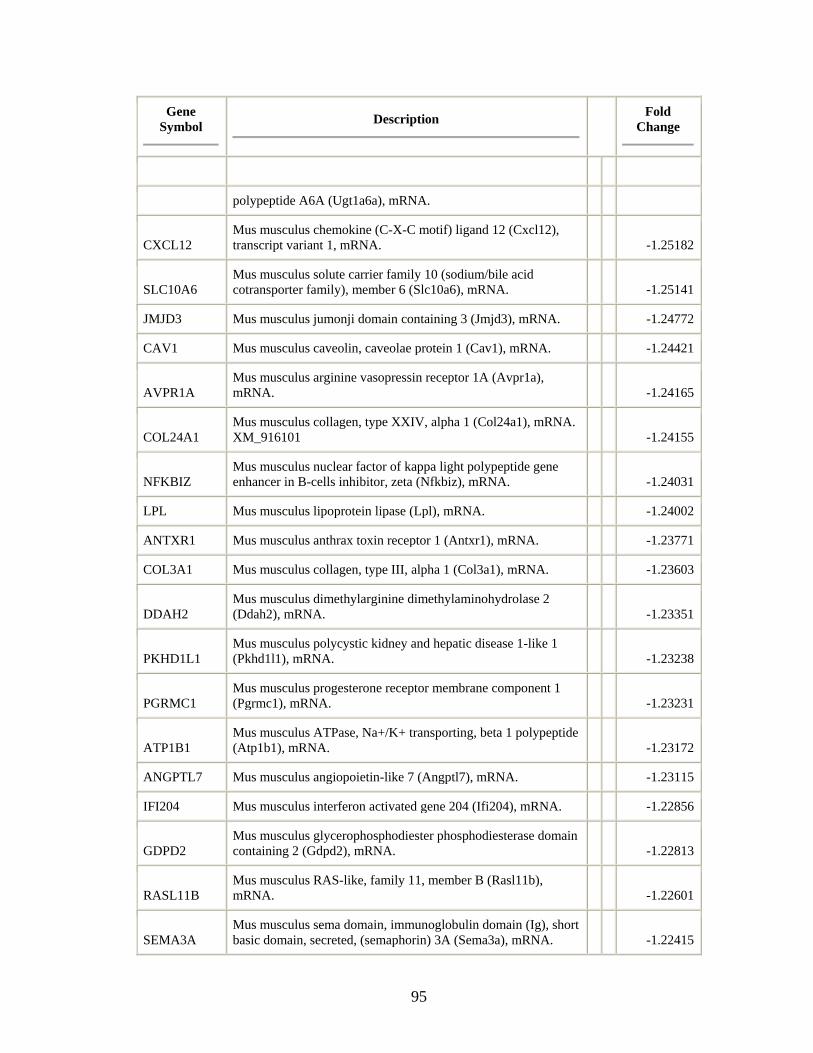
95
Gene
Symbol
Description
Fold
Change
polypeptide A6A (Ugt1a6a), mRNA.
CXCL12
Mus musculus chemokine (C-X-C motif) ligand 12 (Cxcl12),
transcript variant 1, mRNA.
-1.25182
SLC10A6
Mus musculus solute carrier family 10 (sodium/bile acid
cotransporter family), member 6 (Slc10a6), mRNA.
-1.25141
JMJD3 Mus musculus jumonji domain containing 3 (Jmjd3), mRNA. -1.24772
CAV1 Mus musculus caveolin, caveolae protein 1 (Cav1), mRNA. -1.24421
AVPR1A
Mus musculus arginine vasopressin receptor 1A (Avpr1a),
mRNA.
-1.24165
COL24A1
Mus musculus collagen, type XXIV, alpha 1 (Col24a1), mRNA.
XM_916101
-1.24155
NFKBIZ
Mus musculus nuclear factor of kappa light polypeptide gene
enhancer in B-cells inhibitor, zeta (Nfkbiz), mRNA.
-1.24031
LPL Mus musculus lipoprotein lipase (Lpl), mRNA. -1.24002
ANTXR1 Mus musculus anthrax toxin receptor 1 (Antxr1), mRNA. -1.23771
COL3A1 Mus musculus collagen, type III, alpha 1 (Col3a1), mRNA. -1.23603
DDAH2
Mus musculus dimethylarginine dimethylaminohydrolase 2
(Ddah2), mRNA.
-1.23351
PKHD1L1
Mus musculus polycystic kidney and hepatic disease 1-like 1
(Pkhd1l1), mRNA.
-1.23238
PGRMC1
Mus musculus progesterone receptor membrane component 1
(Pgrmc1), mRNA.
-1.23231
ATP1B1
Mus musculus ATPase, Na+/K+ transporting, beta 1 polypeptide
(Atp1b1), mRNA.
-1.23172
ANGPTL7 Mus musculus angiopoietin-like 7 (Angptl7), mRNA. -1.23115
IFI204 Mus musculus interferon activated gene 204 (Ifi204), mRNA. -1.22856
GDPD2
Mus musculus glycerophosphodiester phosphodiesterase domain
containing 2 (Gdpd2), mRNA.
-1.22813
RASL11B
Mus musculus RAS-like, family 11, member B (Rasl11b),
mRNA.
-1.22601
SEMA3A
Mus musculus sema domain, immunoglobulin domain (Ig), short
basic domain, secreted, (semaphorin) 3A (Sema3a), mRNA.
-1.22415

96
Gene
Symbol
Description
Fold
Change
DHRS7
Mus musculus dehydrogenase/reductase (SDR family) member
7 (Dhrs7), mRNA.
-1.22376
ACPP
Mus musculus acid phosphatase, prostate (Acpp), transcript
variant 1, mRNA.
-1.22278
SEL1L
Mus musculus sel-1 suppressor of lin-12-like (C. elegans)
(Sel1l), transcript variant 1, mRNA.
-1.22089
SCYL1BP1
Mus musculus SCY1-like 1 binding protein 1 (Scyl1bp1),
mRNA.
-1.22006
HNRPDL
Mus musculus heterogeneous nuclear ribonucleoprotein D-like
(Hnrpdl), mRNA.
-1.21822
MMP13 Mus musculus matrix metallopeptidase 13 (Mmp13), mRNA. -1.21802
SYTL2
Mus musculus synaptotagmin-like 2 (Sytl2), transcript variant 5,
mRNA.
-1.21772
PON3 Mus musculus paraoxonase 3 (Pon3), mRNA. -1.2172
PDGFRA
Mus musculus platelet derived growth factor receptor, alpha
polypeptide (Pdgfra), transcript variant 1, mRNA.
-1.21708
CCDC109B
Mus musculus coiled-coil domain containing 109B (Ccdc109b),
mRNA.
-1.21553
PALMD Mus musculus palmdelphin, mRNA -1.2153
NAMPT
Mus musculus nicotinamide phosphoribosyltransferase (Nampt),
mRNA.
-1.21523
KRBA1 Mus musculus KRAB-A domain containing 1 (Krba1), mRNA. -1.21488
IGFBP2
Mus musculus insulin-like growth factor binding protein 2
(Igfbp2), mRNA.
-1.21339
ATG2A
Mus musculus ATG2 autophagy related 2 homolog A (S.
cerevisiae) (Atg2a), mRNA.
-1.21226
NRG1 Mus musculus neuregulin 1 (Nrg1), mRNA. -1.21063
RGS10
Mus musculus regulator of G-protein signalling 10 (Rgs10),
mRNA.
-1.20682
SULF1 Mus musculus sulfatase 1 (Sulf1), mRNA. -1.20658
CACNA1G
Mus musculus calcium channel, voltage-dependent, T type,
alpha 1G subunit (Cacna1g), mRNA.
-1.20605

97
Gene
Symbol
Description
Fold
Change
RAET1B
Mus musculus retinoic acid early transcript beta (Raet1b),
mRNA.
-1.20511
ARRDC3 Mus musculus arrestin domain containing 3, mRNA -1.20489
CLK4 Mus musculus CDC like kinase 4 (Clk4), mRNA. -1.20106
COL4A6 Mus musculus procollagen, type IV, alpha 6 (Col4a6), mRNA. -1.20092

98
CHAPTER 4
CONCLUSIONS AND FUTURE DIRECTIONS
SUMMARY
Pancreatic ductal adenocarcinoma (PDA) is a highly aggressive disease that
takes the lives of the vast majority of affected patients. Our knowledge of the
molecular events underlying the development and progression of PDA has steadily
increased, but this has not translated into more effective therapeutic approaches for
treatment of the disease. The work described in this thesis has taken a focused
approach at trying to better characterize the pancreatic tumor microenvironment. A
detailed understanding of the cross-talk between tumor and stromal cells may hold
clues to affectively targeting pancreatic tumors in new ways. We have identified that
Hedgehog (Hh) signaling is one of the important feedback mechanisms between
pancreatic tumor cells and the infiltrating stroma. Targeting paracrine Hh signaling
in the tumor stroma can have significant effects on tumor biology, including
reduction in metastatic spread, changes in tumor cell differentiation, decreases in
tumor desmoplasia, and disruption of the cancer stem cell population. Future studies
will be aimed at understanding how paracrine Hh signaling and downstream Hh-
target genes affect the biological function of the tumor mesenchyme and of the tumor
cells themselves and how this may translate to more effective therapies for pancreatic
cancer.

99
CONCLUSIONS
The Hedgehog pathway is widely studied for its role in the regulation of
growth, development and maintenance of many different tissues within the organism.
While this pathway has a clear, canonical mechanism for autocrine and paracrine
signaling in normal tissues, this is not the case for pancreatic tumor cells [33]. The
experiments described in this thesis confirmed a role for paracrine Hh signaling in the
pancreatic tumor microenvironment. Our studies have also shown an important role
of Hh signaling in mediating the invasiveness of the tumor along with maintaining the
differentiation of the tumor cells which has not been previously described.
Additionally, this thesis details the first transcriptional profiling analysis of Hh
responsive genes in pancreatic stellate cells. Bioinformatics analysis of differentially
expressed genes proposed several ways in which the Hh pathway may impact the
pancreatic tumor microenvironment. One of these functional roles was related to
enhancing the motility of pancreatic stellate cells in three-dimensional extracellular
matrix, which was validated using an in vitro model system. The functional studies
and model systems that are described in this thesis provide the framework for asking
important questions about the role of paracrine Hh signaling in pancreatic cancer.
Role of Paracrine Hh signaling in vivo
In Chapter 2, we examined the effect of Hh pathway antagonist, HhAntag,
alone or in combination with gemcitabine in an orthotopic model of human pancreatic
ductal adenocarcinoma (PDA). Essentially all drugs that are approved for anti-cancer
therapy have been tested using a subcutaneous xenograft model in immune-deficient

100
mice and showed promising activity before being evaluated in early clinical trials.
Unfortunately, these successes have often been met by failures in a clinical trial
setting, including trials for: antagonists of the human epidermal growth factor
receptor (EGFR) pathway, vascular endothelial growth factor (VEGF) pathway,
insulin-like growth factor (IGF) pathway, and phosphoinositide 3’-kinase
(PI3k)/Akt/mammalian target of rapamycin (mTOR) signaling [27,28,118,119]. In a
retrospective study performed by the National Cancer Institute (NCI), only one-third
of all tested human xenograft studies had some activity in Phase II clinical trials, but
even this was highly variable depending on the particular tumor histology [146].
Activity in breast cancer xenografts predicted poorly, whereas lung cancers,
particularly adenocarcinomas, tend to respond better in comparison to the other
diseases.
Why are subcutaneous xenograft models systems so poor at predicting
therapeutic activity in the clinic? One reason may be that these pre-clinical studies
often use xenografts established from immortalized cancer cell lines. These
individual lines have often been established decades prior to use in pre-clinical
models and after years of in vitro culture and selection, these cells likely do not retain
the same genetic background or phenotypic characteristics as the original tumor from
which the cell line was derived [147]. Our personal observation in deriving
xenografts from patients with pancreatic adenocarcinoma is that there is a diverse
phenotype in primary patient tumors that does not correlate with xenograft tumors
from pancreatic cancer cell lines. These differences range from the amount of
desmoplasia that the tumor develops, varying degrees of tumor histolopathology

101
which range from highly undifferentiated to mucionous neoplasms, along with
differing levels of expression of important signaling ligands such as Sonic hedgehog
(Chapter 2, Figure 2.1). Validating these observations are pre-clinical studies done
from a large panel of xenografts derived from patient biopsies, instead of cancer cell
lines, and activity in these xenografts was compared with clinical response. A strong
prediction of clinical outcome was observed for both tumor resistance (97%) and
tumor sensitivity (90%) in these studies [148].
In line with using individual patient xenografts for establishing pre-clinical
models, our lab has established over 30 primary xenografts from patients with
pancreatic adenocarcinoma. We utilized 13 of these tumors in our study and
compared the pathology and gene expression profile of Hh signaling ligands and
downstream target genes (Chapter 2, Table 2.2). As might be expected, we
identified a range of expression of Sonic and Indian hedgehog ligands in these
tumors, and the expression of these factors correlated with the expression of Hh target
genes, Gli1 and Patched1, in the mouse stroma. Ectopic expression of Sonic
hedgehog in a transformed, ductal-derived pancreatic epithelial cell line has
correlated with a strong desmoplastic reaction that is reversible with inhibitors of the
pathway [81]. An observation that we note is that two patient xenografts with the
highest levels of Shh and Ihh expression also have the highest amount of infiltrating
mouse stroma of the tumors that we examined in this study (Figure 4.1). Recent
studies in transgenic animal models of pancreatic cancer have shown that the high
level of desmoplastic stroma corresponds to tumors with a disorganized vasculature
which limits the ability of chemotherapeutic drugs to reach their target within the

102
tumor [80,125]. This warrants expansion of our study to more patient xenografts to
determine if there is a correlation with Hh ligand expression, tumor pathology and
patient survival. This might aid in identifying patient groups which would benefit
most from inhibition of paracrine Hh signaling.
Subcutaneous xenograft models of pancreatic cancer are not ideal due to their
rare metastatic potential and reduced propensity to display highly invasive
phenotypes. These properties are important as 85% of patients present clinically with
advanced, inoperable disease [21]. For our studies, we established an orthotopic
model of pancreatic adenocarcinoma by implanting tumor cells that were dissociated
from individual patient xenografts (one that was spontaneously metastatic), directly in
the distal pancreas of NOD/SCID mice. The advantage of this approach is that it
allowed us to test the effect of inhibition of paracrine Hh signaling with or without
co-treatment with gemcitabine on the progression of tumors with the genetic and
histological profiles that reflected the in vivo characteristic found in the patient.
These tumor cells were “tagged” by transducing them with a lentiviral construct that
expresses Renilla-luciferase, and allowed us to perform non-invasive imaging of the
animals to establish baseline tumor sizes prior to beginning therapy and monitor
progression of the tumor growth during treatment (Figure 4.2) [149]. We believe
that this is the first description of this platform using pancreatic adenocarcinoma cells
derived from individual patients and provides a unique pre-clinical model for testing
potential therapies.
To test how inhibition of paracrine Hh signaling affected the progression of
pancreatic tumor growth in our system, we compared the treatment of two patient

103
xenografts with an inhibitor of the Hh pathway, HhAntag, and gemcitabine, the drug
most commonly given to pancreatic cancer patients. HhAntag is a compound that
was developed by Genentech that is 10 times more potent than the natural,
Smoothened antagonist of the pathway, cyclopamine, and has been used in animal
models to down-regulate Hh signaling in a wide range of malignancies [33,150].
Both PDA xenografts treated with HhAntag alone did not demonstrate a significant
reduction in primary tumor size from vehicle treated animals. This is somewhat
contrary to a previous report showing that blocking paracrine Hh signaling with
HhAntag in a subcutaneous xenograft of pancreatic cancer led to a delay in tumor
growth [33]. However, this study used a single pancreatic tumor implanted
subcutaneously, which did not metastasize and the amount of desmoplasia was
undocumented. These discrepancies highlight the need to expand treatment studies to
a large range of tumors to be able to draw better conclusions on the effect of Hh
pathway inhibition on a wide range of patient tumors. Additionally, in the analysis of
the expression of Hh ligands expressed in the PDA tumors in our study we observed a
wide range of Shh and Ihh expression in tumors. The xenografts chosen for our study
expressed Shh and Ihh at levels slightly below the statistical median for the tumors
that we analyzed. It is possible the HhAntag may be more affective at slowing the
growth of pancreatic tumors with a higher level of paracrine Hh activation. Our
results would suggest that testing a wide range of tumors with different Hh expression
may help identify the phenotype of tumors which will respond best to inhibition of
paracrine Hh signaling.

104
The orthotopic tumors in our studies responded significantly better to
gemcitabine than the observed clinical response of patients in the clinic. There is
some debate as to whether the orthotopic transplantation into SCID mice used in our
study are the best model for pancreatic cancer as these animals lack important
components of the immune system which may limit the desmoplastic reaction
[80,151]. Indeed, de novo pancreatic disease arising from transgenic expression of
mutant KRAS and p53 alleles in the pancreas result in tumors that have a higher
desmoplastic reaction and more deficient vascular network than xenotransplanted
pancreatic tumor cells [80]. While we do observe a decreased amount of infiltrating
stroma in our PDA xenografts compared to patient sections from the original tumor,
this is variable from tumor to tumor and indeed may be dependent on the expression
of signals, including Hh ligands, from the tumor cells.
Interestingly, we have also observed evidence of decreased perfusion of
tumors, and possibly chemotherapeutics in our orthotopic xenograft model. We
utilize non-invasive bioluminescent imaging (BLI) to monitor the progression of
tumors during treatment. Several times near the end of the 21 day treatment protocol,
we encountered the complete loss of signal from a tumor that had a clear BLI signal
the previous week, primarily in those animals treated with vehicle or HhAntag. The
mechanism for this imaging is via intraperitoneal (IP) injection of luciferin, an
oxidizable substrate that travels through the bloodstream and upon encountering the
luciferase enzyme (expressed by our “tagged” tumor cells) releases a bioluminescent
signal detected by a sensitive charge-couple device (CCD) camera [152]. When we
recovered tumors from the animals that showed a loss of BLI signal and tested them
105
in culture with luciferin, these cells demonstrated competent BLI activity suggesting
that the construct was not silenced. We believe this suggests that there is a point
during the growth of the orthotopic xenograft tumors where there is a reduction in
vascular integrity. Supportive of this contention is the observed increase in necrosis
in the center of tumors, especially those recovered from animals that were treated
with vehicle or HhAntag alone. It is possible that the continued sensitivity to
gemcitabine treatment in our model is more about timing of the treatment: we are
treating the animals during a time period where the tumor is highly vascularized and
permits diffusion of compounds to the tumor. Studies are on-going to see if we can
accelerate the process of desmoplasia by co-implanting tumor cells along with tumor
associated fibroblasts. This may help us achieve a more clinically accurate tumor
model in which the xenografts are less sensitive to gemcitabine.
Despite the limitations described above, we believe that our model is relevant
to investigation of the interactions between tumor cells and the stroma. The
orthotopic tumors in our model system develop a desmoplastic reaction and we have
identified several patient xenografts which form spontaneous metastases that have
only been seen in specially selected pancreatic cell line xenografts [153].
Additionally, transgenic animal models of pancreatic cancer generate a single genetic
and histopathological profile of the disease, while use of primary PDA xenografts
allows us access to test therapies against tumors with varying grades of
differentiation, genetic background and stromal involvement which represents the
true patient population.

106
The most striking result from our in vivo experiments was the marked
inhibition of metastases in xenograft UM-PDA#1 with HhAntag treatment alone or in
combination with gemcitabine while the primary tumor showed only a marginal
decrease in size. These experiments show the vital dependence of the pancreatic
tumor cells with its mesenchyme in the tumor microenvironment. A recent study
using an organotypic assay of tumor cell invasion demonstrated how mesenchymal
cells at the leading edge of the tumor carve tracks through the extracellular matrix,
which the tumor cells then use to invade into surrounding tissues [145]. Additionally,
presence of stromal cells in a three-dimensional model of pancreatic tumor cell
invasion leads to an epithelial-to-mesenchymal transition with significant decreases in
E-cadherin expression and an increase in β-catenin signaling resulting in the
increased invasion of the tumor cells [154]. These studies highlight the potential
importance of modulating the tumor stroma in prevention or possible treatment of
metastatic disease.
While we are not exactly sure how blockage of paracrine Hh signaling in the
stroma results in the reduction in metastatic spread, we have some clues from our
experiments and from similar studies in the literature. The negative effect of
HhAntag treatment on the metastatic seeding of pancreatic adenocarcinoma cells
suggests that HhAntag does one or several things to the tumor mesenchyme. It may
reduce the expression of factors in the stroma that promote the functional ability of
cancer cells to invade. For example, tumor cells and mesenchymal cells are
dependent on an MT1-MMP mechanism for degradation of basement membrane and
invasion in type I collagen matrix [155,156]. It is possible that HhAntag treatment
107
disrupts signals in mesenchymal cells that localize MT1-MMP to the membrane, and
this leads to a reduction in cell motility. Additionally, some of the same motility
factors, including MMP-2, MT1-MMP, and TIMP-2 are involved in the extravasation
of tumor cells from the bloodstream so it is possible that some tumor cells may be
able to leave the tumor but cannot engraft in a new site [157]. Importantly, we find
that Hh treatment of pancreas-derived fibroblasts up-regulate motility and
angiogenesis pathways, indicating a mechanism that could be important for metastatic
disease. Another possibility is that tumor-derived Shh is required to produce
desmoplastic stroma at the site of metastasis and by blocking this with Hh inhibitors it
prevents the establishment of these distant lesions.
Treatment with HhAntag alone and in combination with gemcitabine also
revealed distinct changes in the tumor histological profile, with an apparent increase
in differentiation of tumor cells and expression of mucins. The change observed in
tumor histology with Hh inhibition has not been previously reported. Mucins
comprise a large family of glycoproteins that are secreted or bound to the cellular
membrane and either directly or indirectly, act to maintain the integrity of the cellular
membrane, along with lubricating and protecting the epithelial surfaces in animal
tissues [158]. In our studies, we observed a significant up-regulation of MUC2, a
secreted mucin, with HhAntag plus gemcitabine treated tumors (not shown). It is
unclear whether the change in histology alters the invasiveness of pancreatic cancer
cells or simply reflects a less aggressive phenotype, but a clinical study of MUC2
expression across a panel of pancreatic adenocarcinoma tumors revealed a better
prognosis with higher MUC2 expression [159].

108
Another hypothesis for the reduced metastatic potential of tumors following
HhAntag is that the drug treatment disrupts factors that maintain the minor population
of cells which are capable of new tumor initiation. However, in the case of UM-
PDA#1 this population was not minor, in fact it has one of the highest levels of
CD44+/CD24
+/EpCAM
+ cells (greater than 40%) that we have analyzed and neither
HhAntag or gemcitabine treatment affected the level of this cell population compared
to vehicle treated animals. In contrast, we did observe significant reductions in
markers related to the tumorigenic population of cells in UM-PDA#2 and this
corresponded with delayed growth following re-implantation, but this xenograft
tumor did not show evidence of metastases in vivo. A similar study using the Smo-
inhibitor, IPI-269609 (Infinity Pharmaceuticals) to treat pancreatic cell line
xenografts noted a reduction of Aldefluor positive (ALDH+) cells, an activity assay
for aldehyde dehydrogenase used to profile cancer stem cells in several malignancies
[102,103,122]. Some preliminary experiments suggest that ALDH+ cells were
reduced in our HhAntag treatment groups in UM-PDA#1 xenografts (not shown). It
is possible that our current markers are not as accurate at marking the true tumor
initiating population and current studies in our laboratory suggest that a more accurate
stem cell marker includes c-Met, also known as the hepatocyte growth factor receptor
(HGFR). MET/HGFR is a receptor tyrosine kinase that binds hepatocyte growth
factor (HGF) and has been implicated in cell survival and invasiveness in pancreatic
cancer [160]. FACS analysis of tumor cells from HhAntag treatment groups with c-
Met may reveal more accurate changes in the tumor-initiating cell population.
109
Pancreatic adenocarcinoma has a multi-decade long history of failed efforts in
identifying an effective chemotherapeutic treatment regimen. The latest failed efforts
included the use of use epidermal growth factor receptor (EGFR) inhibitors (Erbitux)
in combination with radiation and treatments with vascular endothelial growth factor
receptor (VEGFR) inhibitor, bevacizumab (Avastin). None showed significant
effects in patient outcomes [27,161]. Gemcitabine, the currently accepted regimen
for pancreatic cancer, only affords patients an average of a few weeks of increased
survival [151]. These failures are likely due in part to the unique biology of the
pancreatic tumor microenvironment. Pancreatic tumors are very fibrotic and recent
studies suggest that these tumors have a disorganized vasculature which does not
allow robust tumor perfusion [80]. Any therapy which may help to control the
desmoplasia of the tumor could significantly impact the ability of chemotherapeutic
agents or other secondary therapies to reach the tumor. It is clear from our studies
that use of Hh antagonists in pancreatic tumors can affect the tumor mesenchyme and
these effects are materialized in the inability of the tumor from invading into the local
organ environment and altering the native differentiation of the epithelial cells. These
are exciting results that will help us better understand how to use Hh pathway
inhibition in combination with secondary agents to affect patient outcomes.
Functional Changes Induced by Hh signaling in Pancreatic Stellate Cells
In Chapter 3, we have provided the first documented transcriptional analysis
of pancreatic stellate cells following Sonic Hedgehog stimulation. Our previous
studies in Chapter 2 had demonstrated how pancreatic tumor cells activate Hh

110
signaling in the tumor mesenchyme by secretion of Hh pathway ligands but it was not
clear which gene pathways were modulated by Hh signaling. The importance of
these pathways were validated by targeted inhibition of paracrine Hh signaling in vivo
that led to reduced tumor spread. The Hh pathway is well characterized for its role as
a morphogen in developing epithelial tissues [162]. There is less information as to
how activation of this pathway affects the mesenchyme and mediates cross-talk
between epithelial and mesenchymal interactions. In the intestinal epithelium, Hh
signaling mediates anti-inflammatory signals with the local mesenchyme. Inhibition
of Hh signaling can lead to intestinal inflammation and death in animal models [82].
In pancreatic development, ectopic expression of Sonic hedgehog under the control of
the Pdx-1 promoter in the developing epithelial anlage is incompatible with pancreas
organogenesis with loss of both exocrine and endocrine tissue [58]. The pancreatic
mesenchyme itself is transformed into duodenal mesoderm with functional layers of
muscle that possess the ability to constrict, demonstrating that epithelial-derived Shh
can impart important biological changes in the local mesenchyme. Recent studies of
specialized pancreatic duct glands (PDGs) in the adult organ have been shown to
express Shh in response to injury and may induce Hh-related factors in the stroma
that mediate the transition of epithelial duct cells to a mucinous, metaplastic
phenotype [163].
The pancreatic tumor microenvironment is dominated by infiltrating stroma
and desmoplasia that surround the tumor cells. A major cause is the activation of
pancreatic stellate cells (PSCs), which are specialized pancreatic fibroblast cells
located at the periphery of the acini in the exocrine pancreas and are normally

111
quiescent [129]. Activation of PSCs can be mediated by growth factors and
cytokines, such as TGF-β1, or oxidant stress which results in their transformation
from a quiescent to a myofibroblast-like phenotype, which secretes excess amounts of
extracellular matrix components [139]. To characterize the role of Hh signaling in
these cells, we developed two cell lines to use for in vitro experiments. Initial
attempts at culturing normal fibroblasts from human or mouse pancreas revealed that
these cells often senesce in culture after only a few passages. We changed our
strategy to culture pancreatic fibroblasts from mice induced with chronic pancreatitis,
as correspondence with our collaborators suggested that fibroblasts from these mice
have a higher proliferative capacity in vitro. We utilized this strategy in
Immortomouse animals, which allowed us to develop a primary, conditionally
immortalized cell line [131]. The development of these tools allowed us to ask
important questions about the consequences of Hh signaling in pancreatic stellate
cells.
Several previous studies have been performed to identify the Hh-related genes
in mesenchymal cells, including embryonic fibroblasts and organ specific
mesenchyme in the intestine and prostate [82,83,164]. Profiling studies of tumor-
stromal interaction of prostate mesenchyme revealed that Shh-stimulation altered the
transcriptional response of adult prostate mesenchyme to mimic the growth
promoting actions of the fetal mesenchyme [165]. Studies analyzing the
transcriptional profile of Shh and Ihh stimulated intestinal mesenchyme revealed a
previous unknown function of Hh signaling in mediating anti-inflammatory signals in
the tissue [82]. We performed transcriptional profiling of Shh-stimulated pancreatic

112
stellate cells and meta-analysis with prostate and intestinal Hh-related gene sets to
learn what genes and pathways are consistent with Hh activation in mesenchymal
cells and what genes may be specific to the pancreatic tumor microenvironment. Not
surprisingly, we identified several genes that have been identified as Hh-related genes
in Gdf10, Nkx2-3, Ang-4, Hes1, Sfrp-2, IGF1 and IGF2. Additionally, we identified
some factors that had not been shown to be Hh-related genes in Wnt2, TGFβ2, R-
spondin1, and Fgf9. We propose that these target genes may have roles in regulating
the angiogenic-function of pancreatic stellate cells along with mediation of epithelial-
to-mesenchymal transition and increased invasion of pancreatic tumor cells.
A recent study of Hh-responsive bone marrow-derived mesenchymal cells
demonstrated the reliance of paracrine Hh signaling in regulating the expression of
Ang-1 and IGF-1, which promoted the neovascularization of the tumor [86]. In our
data set we observed the up-regulation of VEGFA, which has been shown to be the
predominant vascular endothelial growth factor related protein in pancreatic tumor
epithelial cells and likely plays an important role in mediating the neo-vascularization
of the tumor [166]. While VEGF inhibitors have not provided significant clinical
benefit to pancreatic cancer patients, this result may have more to do with drug
delivery to the effective area in the tumor rather than the dependence of the tumor on
these factors for tumor growth and development [27]. Alternatively, the tumors may
have adapted to a relatively oxygen poor environment, rendering the reduction in
vascularity by VEGF relatively ineffective. Interestingly, while we observed a
number of angiogenic-related factors that were increased in pancreatic stellate cells
following Shh-stimulation, study of a transgenic mouse model of pancreatic cancer

113
showed an increase in the vasculature following treatment of the animals with an Hh
pathway inhibitor [80]. This seems counter-intuitive to successful treatment of
pancreatic cancer, but the authors suggest that the more organized vascular network
allows better penetrance of chemotherapeutic compounds. Closer study of
angiogenesis-related genes following paracrine Hh inhibition in vivo may provide
more answers into how these factors are manipulated by Hh signaling in the tumor
microenvironment.
A striking result in our studies in Chapter 2 was the abrogation of metastases
in animals treated with HhAntag alone or in combination with gemcitabine. We
hypothesized that transcriptional profiling of Hh target genes in pancreatic stellate
cells might provide us clues into how this pathway mediates the invasiveness of
tumor cells. Interestingly, we noted a number of Wnt pathway related genes in our
data set including increases in Wnt2 and R-spondin-1, and the single most down-
regulated gene in our data set was Sfrp-2, an important inhibitor of Wnt pathway
signaling [167]. Additional studies have shown that the pro-invasive activity of Wnt2
may go through a non-canonical mechanism involving GSK-3β and c-Jun/AP-1
signaling [168]. Canonical Wnt signaling has been shown to be active in pancreatic
adenocarcinoma cells [140]. While there is a report of Wnt5a up-regulation and Sfrp-
1 down-regulation in the pancreatic tumor stroma [141], to date there is not a clear
mechanism of how Wnt pathway affects the biological function of pancreatic tumor
mesenchyme. Recent studies have suggested a role for Wnt to enhance proliferation
in the epithelium and stroma of chemically induced bladder cancer in mice [142]. In
this work, Shh expression in basal cells of the bladder increases upon injury and

114
elicits increased stromal expression of Wnt protein signals, which in turn stimulate
the proliferation of both urothelial and stromal cells. This type of feedback
mechanism may also be at work in the pancreatic tumor microenvironment.
Preliminary data examining the differential expression of Wnt ligands in Shh-
stimulated pancreatic stellate cells revealed that only Wnt2, Wnt5b, and Wnt3a were
significantly changed (Figure 4.3). We have also targeted the knock-down of Wnt2
in PSCs and this appears to block the ability of the cells to migrate in response to
sonic hedgehog (Figure 4.4). Future studies will be aimed at identifying how
Hedgehog/Wnt feedback may play an important role in mediating the growth and
invasion of pancreatic tumor cells.
Clinical Efficacy of Paracrine Hh Inhibition in Treating Pancreatic Cancer
While we have demonstrated some exciting results in targeting paracrine Hh
signaling in xenograft models of pancreatic cancer, we realize that success in animal
models have rarely translated to success in the clinic. To date, the only hope for a
cure from pancreatic cancer is surgical resection of the disease; however, roughly
85% of patients diagnosed with pancreatic adenocarcinoma are presented with an
inoperable diagnosis. That makes identifying therapies that are effective at reducing
tumor growth that convert a patient into a surgical candidate, or finding therapies that
help to prevent the recurrence of pancreatic disease crucial.
Recently, a phase I clinical trial (UMCC 2010.003) has been initiated at the
University of Michigan Medical Center for the treatment of patients with metastatic
pancreatic ductal adenocarcinoma with GDC-0449, a Smoothened antagonist and

115
potent Hh pathway inhibitor developed by Genentech. The plan for this study is to
include 25 patients with metastatic disease. The primary endpoint is to assess the
biological effects of Hh inhibition on cancer stem cells and Hh signaling with
secondary endpoints examining clinical outcome parameters. All patients in this trial
will have core biopsies taken before treatment with GDC-0449 to establish a baseline
of Hh pathway activity. Patients will then undergo a first cycle of GDC-0449
monotherapy for two weeks, following which another core biopsy will be taken to
assess Hh-regulated changes in the tumor. Cycle 2 will then administer Gemcitabine
infusion 3 times a week for 28 days. CT scans will be used to assess response at 8
week intervals.
Preliminary results of this trial have demonstrated some exiting results and
important correlations with our xenograft study. Five patients have been evaluated
for a response to GDC-0449 pre-treatment followed by gemcitabine treatment and
have confirmed a partial response in 3 out of 5 patients. CT scans of patients
following GDC-0449 treatment alone revealed very little change in the amount and
size of metastases, which correlates with our xenograft study that demonstrated very
little change in tumor volume with HhAntag treatment. However, following a
treatment cycle with both gemcitabine and GDC-0449 a significant reduction in the
metastatic liver lesions of several patients was observed (Figure 4.5 A). In addition,
a reduction in CA-19-9 levels, a serum marker used diagnostically in pancreatic
cancer, following the GDC-0449 and gemcitabine treatment cycle (Figure 4.5 B) has
been observed. Additionally, histological changes with increased vacuolated
structures in tumor cells of one patient following GDC-0449 treatment, consistent

116
with our findings following treatment of orthotopic tumors in mice with HhAntag
(Chapter 2, Figure 2.6).
While this clinical trial is still in the early stages, the results are encouraging
that targeting paracrine Hh signaling in pancreatic cancer patients may be a viable
therapeutic strategy. As treatment has resulted in variable response in patients, it will
be important to identify what parameters correlate with success, whether that may be
levels of Hh ligands, expression of cancer stem cell markers, or the expression of
certain Hh target genes in the tumor stroma. In the future, we hope to test inhibition
of Hh signaling in a model of established liver metastases. This model may help us
understand how Hh signaling of tumor cells in metastatic sites affects other organ
microenvironments.
Proposed Model of Hh Signaling in Pancreatic Cancer
Based on the studies presented in this thesis, we propose an updated model for
how paracrine Hh signaling in the tumor microenvironment plays critical roles in the
epithelial to mesenchymal cross-talk of the tumor (Figure 4.6). We believe that in
early neoplasms of the pancreas, where Sonic hedgehog has been shown to be
expressed [30], activation of Hh signaling acts as a activator and mitogen, increasing
the proliferation of pancreatic stellate cells and enhancing the desmoplastic reaction
and possibly attracting bone marrow derived pro-angiogenic cells to the tumor site
[86]. As the tumor progresses to more advanced stages, Hh pathway activation in
stellate cells stimulates the release of factors that allow the tumor to invade into the
vascular and lymphatic system. These factors are likely related to VEGFA, IGF, and
117
TGFβ pathways along with increased expression of ECM remodeling proteins
defined in our gene profiling experiments. Additionally, Hh signaling in the
mesenchyme causes the expression of factors that maintain the differentiation status
of the tumor, which we proposed is mediated by Wnt pathway signals from the tumor
mesenchyme.
In all, this thesis details experiments which have increased our understanding
for the role of Hh pathway signaling in the pancreatic tumor microenvironment.
Future work will aim to answer additional important questions about the key factors
that are involved in the different aspects of pancreatic tumor biology. We hope that
these studies will provide important clues in how we can use Hh pathway inhibition
to provide better therapeutic options for pancreatic cancer patients.
ACKNOWLEDGMENTS
Author Contributions: Joseph S. Dosch has performed the IHC, BLI, and Wnt ligand
analysis. Jingjiang Wu performed the Wnt2 knockdown experiments. Edward Kim
provided the clinical trial data for patients being treated with GDC-0449 at the
University of Michigan Medical Center.

118
FIGURES
Figure 4.1 Histological Comparison of Patient vs. Cell Line Xenografts.
Representative sections from three individual patient xenografts and one xenograft
generated from implantation of Panc-1 cells. Upper left and right panels represent
xenografts with the highest expression of Sonic hedgehog (Shh), while the bottom left
shows a xenograft with comparatively low expression of Shh. Notice the difference
in tumor architecture and in the amount of infiltrating stroma. Bottom right is a Panc-
1 pancreatic cancer cell line xenograft stained for sonic hedgehog. Tumor cells are
very compact with little or no gland formation.
Shh High Shh High
Shh Low Panc-1

119
Figure 4.2 Bioluminescent Imaging (BLI) of Pancreatic Ductal Adenocarcinoma.
(A) Animals with luciferase “tagged” patient tumor cells implanted in the pancreas, 3
weeks post-implantation (B) Whole organ systems; bowel, lungs, kidneys, and spleen
shown here, can be imaged individually to detect both macro- and micro-metastases
of pancreatic tumor cells.
Bowel
Spleen
Lungs
Kidneys
A) B)

120
Figure 4.3 Differential Expression of Wnt ligands in Shh-treated PSCs.
Quantitative expression analysis (qRT-PCR) of Wnt pathway ligands following Shh-
stimulation of PSCs.
Wnt Ligands
Wnt1
Wnt1
0a
Wnt1
0b
Wnt1
1
Wnt1
6
Wnt2
Wnt2
b
Wnt3
Wnt3
a
Wnt4
Wnt5
a
Wnt5
b
Wnt6
Wnt7
a
Wnt7
b
Wnt8
a
Wnt8
b
Wnt9
a
Wnt9
b
0
1
2
3
nd nd nd
*
*
*
nd: not detected, *p < 0.05
Fo
ld C
ha
ng
e (
Sh
h v
s.
Co
ntr
ol
PS
Cs
)
Figure 4.4 Knockdown of Wnt2 Decreases 2D Migration of Shh-stimulated
PSCs. (A) PSCs transfected with Wnt2 siRNAs decreases the amount of Wnt2
transcript by 60% after 48hrs. (B) PSCs with Wnt2 knockdown show a significant
decrease in 2D migration following stimulation with sonic hedgehog.
Contr
ol siR
NA
Wnt2
siR
NA
0
1e-006
2e-006
3e-006
4e-006
5e-006
*
Wn
t2 /
mG
AP
DH
Contr
ol siR
NA
Wnt2
siR
NA
Contr
ol siR
NA
Wnt2
siR
NA
0
50
100
150
200
250
*
*
2 ug/ml Shh
0 ug/ml Shh
# M
igra
ted
Ce
lls/H
igh
Po
we
r F
ield
A) B)
* p-value < 0.05

121
Figure 4.5 Clinical Trial of GDC-0449 in Patients with Metastatic Pancreatic
Cancer. Above, CT scans from a patient pre and post treatment with GDC-0449 and
gemcitabine. Arrows denote liver metastases found prior to treatment. Below,
patient CA-19-9 serum levels (diagnostic measure of tumor burden) actually increases
with GDC-0449 treatment but then drops following the GDC-0449 plus gemcitabine
treatment cycles.
Pre-Treatment Post-GDC-0449 alone Post GDC+Gem 2m Post GDC+Gem 3m

122
Figure 4.6 Model for Paracrine Hh Signaling in the Pancreatic Tumor
Microenvironment. (A) Paracrine activation of Hh signaling in the tumor
mesenchyme activates stellate cell proliferation and deposition of collagen,
fibronectin and other ECM components. (B) Activation of Hh-target genes in the
tumor stroma creates a positive feedback loop with tumor cells. These secreted
factors may include Wnt, IGF and TGFβ proteins. Neo-vascularization of the tumor
may be aided by IGF-1 and Angiopoietins that may be secreted by the stromal cells in
response to Hh ligands.
GLI
KRAS TGFβ
GLI2/3
SHH
Tumor Cell
GLI
SHH
PTCH GLI
SHH
PTCH
GLI
SHH
PTCH
IGF
WNT
WNT
IGF
GLI1
SHH
PTCH
WNT
Rspo1
TGFβ IGF
VEGF
ANG
A)
B)
Invasive
Tumor Cells MMPs

123
BIBLIOGRAPHY
1. Dosch JS, Pasca di Magliano M, Simeone DM Pancreatic cancer and hedgehog
pathway signaling: new insights. Pancreatology 10: 151-157.
2. Jemal A, Siegel R, Xu J, Ward E Cancer statistics, 2010. CA Cancer J Clin 60:
277-300.
3. Lowenfels AB, Maisonneuve P (2006) Epidemiology and risk factors for
pancreatic cancer. Best Pract Res Clin Gastroenterol 20: 197-209.
4. Michaud DS, Giovannucci E, Willett WC, Colditz GA, Stampfer MJ, et al. (2001)
Physical activity, obesity, height, and the risk of pancreatic cancer. JAMA
286: 921-929.
5. Yalniz M, Pour PM (2005) Diabetes mellitus: a risk factor for pancreatic cancer?
Langenbecks Arch Surg 390: 66-72.
6. Klein AP, Brune KA, Petersen GM, Goggins M, Tersmette AC, et al. (2004)
Prospective risk of pancreatic cancer in familial pancreatic cancer kindreds.
Cancer Res 64: 2634-2638.
7. Maitra A, Hruban RH (2008) Pancreatic cancer. Annu Rev Pathol 3: 157-188.
8. Maitra A, Kern SE, Hruban RH (2006) Molecular pathogenesis of pancreatic
cancer. Best Pract Res Clin Gastroenterol 20: 211-226.
9. Fry LC, Monkemuller K, Malfertheiner P (2008) Molecular markers of pancreatic
cancer: development and clinical relevance. Langenbecks Arch Surg 393:
883-890.
10. Adsay NV, Basturk O, Cheng JD, Andea AA (2005) Ductal neoplasia of the
pancreas: nosologic, clinicopathologic, and biologic aspects. Semin Radiat
Oncol 15: 254-264.
11. Liu MP, Guo XZ, Xu JH, Wang D, Li HY, et al. (2005) New tumor-associated
antigen SC6 in pancreatic cancer. World J Gastroenterol 11: 7671-7675.
12. Bhavanandan VP (1991) Cancer-associated mucins and mucin-type glycoproteins.
Glycobiology 1: 493-503.
13. Balague C, Gambus G, Carrato C, Porchet N, Aubert JP, et al. (1994) Altered
expression of MUC2, MUC4, and MUC5 mucin genes in pancreas tissues and
cancer cell lines. Gastroenterology 106: 1054-1061.
14. Hruban RH, Maitra A, Goggins M (2008) Update on pancreatic intraepithelial
neoplasia. Int J Clin Exp Pathol 1: 306-316.

124
15. Smit VT, Boot AJ, Smits AM, Fleuren GJ, Cornelisse CJ, et al. (1988) KRAS
codon 12 mutations occur very frequently in pancreatic adenocarcinomas.
Nucleic Acids Res 16: 7773-7782.
16. Almoguera C, Shibata D, Forrester K, Martin J, Arnheim N, et al. (1988) Most
human carcinomas of the exocrine pancreas contain mutant c-K-ras genes.
Cell 53: 549-554.
17. Hingorani SR, Petricoin EF, Maitra A, Rajapakse V, King C, et al. (2003)
Preinvasive and invasive ductal pancreatic cancer and its early detection in the
mouse. Cancer Cell 4: 437-450.
18. DiGiuseppe JA, Hruban RH, Goodman SN, Polak M, van den Berg FM, et al.
(1994) Overexpression of p53 protein in adenocarcinoma of the pancreas. Am
J Clin Pathol 101: 684-688.
19. Hruban RH, Goggins M, Parsons J, Kern SE (2000) Progression model for
pancreatic cancer. Clin Cancer Res 6: 2969-2972.
20. Goggins M, Hruban RH, Kern SE (2000) BRCA2 is inactivated late in the
development of pancreatic intraepithelial neoplasia: evidence and
implications. Am J Pathol 156: 1767-1771.
21. Janes RH, Jr., Niederhuber JE, Chmiel JS, Winchester DP, Ocwieja KC, et al.
(1996) National patterns of care for pancreatic cancer. Results of a survey by
the Commission on Cancer. Ann Surg 223: 261-272.
22. Kim R FOLFIRINOX: a new standard treatment for advanced pancreatic cancer?
Lancet Oncol 12: 8-9.
23. Michalski CW, Weitz J, Buchler MW (2007) Surgery insight: surgical
management of pancreatic cancer. Nat Clin Pract Oncol 4: 526-535.
24. Heinemann V, Quietzsch D, Gieseler F, Gonnermann M, Schonekas H, et al.
(2006) Randomized phase III trial of gemcitabine plus cisplatin compared
with gemcitabine alone in advanced pancreatic cancer. J Clin Oncol 24: 3946-
3952.
25. Philip PA (2008) Improving treatment of pancreatic cancer. Lancet Oncol 9: 7-8.
26. Van Cutsem E, Verslype C, Grusenmeyer PA (2007) Lessons learned in the
management of advanced pancreatic cancer. J Clin Oncol 25: 1949-1952.
27. Van Cutsem E, Vervenne WL, Bennouna J, Humblet Y, Gill S, et al. (2009) Phase
III trial of bevacizumab in combination with gemcitabine and erlotinib in
patients with metastatic pancreatic cancer. J Clin Oncol 27: 2231-2237.

125
28. Moore MJ, Goldstein D, Hamm J, Figer A, Hecht JR, et al. (2007) Erlotinib plus
gemcitabine compared with gemcitabine alone in patients with advanced
pancreatic cancer: a phase III trial of the National Cancer Institute of Canada
Clinical Trials Group. J Clin Oncol 25: 1960-1966.
29. Lau J, Hebrok M Hedgehog signaling in pancreas epithelium regulates embryonic
organ formation and adult beta-cell function. Diabetes 59: 1211-1221.
30. Thayer SP, di Magliano MP, Heiser PW, Nielsen CM, Roberts DJ, et al. (2003)
Hedgehog is an early and late mediator of pancreatic cancer tumorigenesis.
Nature 425: 851-856.
31. Berman DM, Karhadkar SS, Maitra A, Montes De Oca R, Gerstenblith MR, et al.
(2003) Widespread requirement for Hedgehog ligand stimulation in growth of
digestive tract tumours. Nature 425: 846-851.
32. Tian H, Callahan CA, DuPree KJ, Darbonne WC, Ahn CP, et al. (2009)
Hedgehog signaling is restricted to the stromal compartment during pancreatic
carcinogenesis. Proc Natl Acad Sci U S A 106: 4254-4259.
33. Yauch RL, Gould SE, Scales SJ, Tang T, Tian H, et al. (2008) A paracrine
requirement for hedgehog signalling in cancer. Nature 455: 406-410.
34. Mann RK, Beachy PA (2004) Novel lipid modifications of secreted protein
signals. Annu Rev Biochem 73: 891-923.
35. Bitgood MJ, McMahon AP (1995) Hedgehog and Bmp genes are coexpressed at
many diverse sites of cell-cell interaction in the mouse embryo. Dev Biol 172:
126-138.
36. Echelard Y, Epstein DJ, St-Jacques B, Shen L, Mohler J, et al. (1993) Sonic
hedgehog, a member of a family of putative signaling molecules, is implicated
in the regulation of CNS polarity. Cell 75: 1417-1430.
37. Pathi S, Pagan-Westphal S, Baker DP, Garber EA, Rayhorn P, et al. (2001)
Comparative biological responses to human Sonic, Indian, and Desert
hedgehog. Mech Dev 106: 107-117.
38. Price MA, Kalderon D (2002) Proteolysis of the Hedgehog signaling effector
Cubitus interruptus requires phosphorylation by Glycogen Synthase Kinase 3
and Casein Kinase 1. Cell 108: 823-835.
39. Jia J, Amanai K, Wang G, Tang J, Wang B, et al. (2002) Shaggy/GSK3
antagonizes Hedgehog signalling by regulating Cubitus interruptus. Nature
416: 548-552.
40. Sasaki H, Nishizaki Y, Hui C, Nakafuku M, Kondoh H (1999) Regulation of Gli2
and Gli3 activities by an amino-terminal repression domain: implication of

126
Gli2 and Gli3 as primary mediators of Shh signaling. Development 126: 3915-
3924.
41. Cheng SY, Bishop JM (2002) Suppressor of Fused represses Gli-mediated
transcription by recruiting the SAP18-mSin3 corepressor complex. Proc Natl
Acad Sci U S A 99: 5442-5447.
42. Kogerman P, Grimm T, Kogerman L, Krause D, Unden AB, et al. (1999)
Mammalian suppressor-of-fused modulates nuclear-cytoplasmic shuttling of
Gli-1. Nat Cell Biol 1: 312-319.
43. Rubin LL, de Sauvage FJ (2006) Targeting the Hedgehog pathway in cancer. Nat
Rev Drug Discov 5: 1026-1033.
44. Lum L, Zhang C, Oh S, Mann RK, von Kessler DP, et al. (2003) Hedgehog signal
transduction via Smoothened association with a cytoplasmic complex
scaffolded by the atypical kinesin, Costal-2. Mol Cell 12: 1261-1274.
45. Jia J, Tong C, Jiang J (2003) Smoothened transduces Hedgehog signal by
physically interacting with Costal2/Fused complex through its C-terminal tail.
Genes Dev 17: 2709-2720.
46. Apionishev S, Katanayeva NM, Marks SA, Kalderon D, Tomlinson A (2005)
Drosophila Smoothened phosphorylation sites essential for Hedgehog signal
transduction. Nat Cell Biol 7: 86-92.
47. Chen W, Ren XR, Nelson CD, Barak LS, Chen JK, et al. (2004) Activity-
dependent internalization of smoothened mediated by beta-arrestin 2 and
GRK2. Science 306: 2257-2260.
48. Meloni AR, Fralish GB, Kelly P, Salahpour A, Chen JK, et al. (2006)
Smoothened signal transduction is promoted by G protein-coupled receptor
kinase 2. Mol Cell Biol 26: 7550-7560.
49. Denef N, Neubuser D, Perez L, Cohen SM (2000) Hedgehog induces opposite
changes in turnover and subcellular localization of patched and smoothened.
Cell 102: 521-531.
50. Cheung HO, Zhang X, Ribeiro A, Mo R, Makino S, et al. (2009) The kinesin
protein Kif7 is a critical regulator of Gli transcription factors in mammalian
hedgehog signaling. Sci Signal 2: ra29.
51. Rohatgi R, Milenkovic L, Scott MP (2007) Patched1 regulates hedgehog
signaling at the primary cilium. Science 317: 372-376.
52. Chuang PT, McMahon AP (1999) Vertebrate Hedgehog signalling modulated by
induction of a Hedgehog-binding protein. Nature 397: 617-621.

127
53. Lee CS, Buttitta L, Fan CM (2001) Evidence that the WNT-inducible growth
arrest-specific gene 1 encodes an antagonist of sonic hedgehog signaling in
the somite. Proc Natl Acad Sci U S A 98: 11347-11352.
54. Duman-Scheel M, Weng L, Xin S, Du W (2002) Hedgehog regulates cell growth
and proliferation by inducing Cyclin D and Cyclin E. Nature 417: 299-304.
55. Pola R, Ling LE, Silver M, Corbley MJ, Kearney M, et al. (2001) The morphogen
Sonic hedgehog is an indirect angiogenic agent upregulating two families of
angiogenic growth factors. Nat Med 7: 706-711.
56. Feldmann G, Dhara S, Fendrich V, Bedja D, Beaty R, et al. (2007) Blockade of
hedgehog signaling inhibits pancreatic cancer invasion and metastases: a new
paradigm for combination therapy in solid cancers. Cancer Res 67: 2187-
2196.
57. Hebrok M, Kim SK, Melton DA (1998) Notochord repression of endodermal
Sonic hedgehog permits pancreas development. Genes Dev 12: 1705-1713.
58. Apelqvist A, Ahlgren U, Edlund H (1997) Sonic hedgehog directs specialised
mesoderm differentiation in the intestine and pancreas. Curr Biol 7: 801-804.
59. Kim SK, Melton DA (1998) Pancreas development is promoted by cyclopamine,
a hedgehog signaling inhibitor. Proc Natl Acad Sci U S A 95: 13036-13041.
60. Hebrok M, Kim SK, St Jacques B, McMahon AP, Melton DA (2000) Regulation
of pancreas development by hedgehog signaling. Development 127: 4905-
4913.
61. Thomas MK, Rastalsky N, Lee JH, Habener JF (2000) Hedgehog signaling
regulation of insulin production by pancreatic beta-cells. Diabetes 49: 2039-
2047.
62. Fendrich V, Esni F, Garay MV, Feldmann G, Habbe N, et al. (2008) Hedgehog
signaling is required for effective regeneration of exocrine pancreas.
Gastroenterology 135: 621-631.
63. Karhadkar SS, Bova GS, Abdallah N, Dhara S, Gardner D, et al. (2004)
Hedgehog signalling in prostate regeneration, neoplasia and metastasis.
Nature 431: 707-712.
64. Watkins DN, Berman DM, Burkholder SG, Wang B, Beachy PA, et al. (2003)
Hedgehog signalling within airway epithelial progenitors and in small-cell
lung cancer. Nature 422: 313-317.
65. Li C, Chi S, Xie J Hedgehog signaling in skin cancers. Cell Signal.

128
66. Low JA, de Sauvage FJ Clinical Experience With Hedgehog Pathway Inhibitors. J
Clin Oncol.
67. Tuveson DA, Shaw AT, Willis NA, Silver DP, Jackson EL, et al. (2004)
Endogenous oncogenic K-ras(G12D) stimulates proliferation and widespread
neoplastic and developmental defects. Cancer Cell 5: 375-387.
68. Aguirre AJ, Bardeesy N, Sinha M, Lopez L, Tuveson DA, et al. (2003) Activated
Kras and Ink4a/Arf deficiency cooperate to produce metastatic pancreatic
ductal adenocarcinoma. Genes Dev 17: 3112-3126.
69. Park SW, Davison JM, Rhee J, Hruban RH, Maitra A, et al. (2008) Oncogenic
KRAS induces progenitor cell expansion and malignant transformation in
zebrafish exocrine pancreas. Gastroenterology 134: 2080-2090.
70. Nakashima H, Nakamura M, Yamaguchi H, Yamanaka N, Akiyoshi T, et al.
(2006) Nuclear factor-kappaB contributes to hedgehog signaling pathway
activation through sonic hedgehog induction in pancreatic cancer. Cancer Res
66: 7041-7049.
71. Kasperczyk H, Baumann B, Debatin KM, Fulda S (2008) Characterization of
sonic hedgehog as a novel NF-{kappa}B target gene that promotes NF-
{kappa}B-mediated apoptosis resistance and tumor growth in vivo. FASEB J.
72. Pasca di Magliano M, Sekine S, Ermilov A, Ferris J, Dlugosz AA, et al. (2006)
Hedgehog/Ras interactions regulate early stages of pancreatic cancer. Genes
Dev 20: 3161-3173.
73. Nolan-Stevaux O, Lau J, Truitt ML, Chu GC, Hebrok M, et al. (2009) GLI1 is
regulated through Smoothened-independent mechanisms in neoplastic
pancreatic ducts and mediates PDAC cell survival and transformation. Genes
Dev 23: 24-36.
74. Long F, Zhang XM, Karp S, Yang Y, McMahon AP (2001) Genetic manipulation
of hedgehog signaling in the endochondral skeleton reveals a direct role in the
regulation of chondrocyte proliferation. Development 128: 5099-5108.
75. Apte MV, Wilson JS (2007) The Desmoplastic Reaction in Pancreatic Cancer: An
Increasingly Recognised Foe. Pancreatology 7: 378-379.
76. Apte MV, Park S, Phillips PA, Santucci N, Goldstein D, et al. (2004)
Desmoplastic reaction in pancreatic cancer: role of pancreatic stellate cells.
Pancreas 29: 179-187.
77. Phillips PA, McCarroll JA, Park S, Wu MJ, Pirola R, et al. (2003) Rat pancreatic
stellate cells secrete matrix metalloproteinases: implications for extracellular
matrix turnover. Gut 52: 275-282.

129
78. Omary MB, Lugea A, Lowe AW, Pandol SJ (2007) The pancreatic stellate cell: a
star on the rise in pancreatic diseases. J Clin Invest 117: 50-59.
79. Hwang RF, Moore T, Arumugam T, Ramachandran V, Amos KD, et al. (2008)
Cancer-associated stromal fibroblasts promote pancreatic tumor progression.
Cancer Res 68: 918-926.
80. Olive KP, Jacobetz MA, Davidson CJ, Gopinathan A, McIntyre D, et al. (2009)
Inhibition of Hedgehog signaling enhances delivery of chemotherapy in a
mouse model of pancreatic cancer. Science 324: 1457-1461.
81. Bailey JM, Swanson BJ, Hamada T, Eggers JP, Singh PK, et al. (2008) Sonic
hedgehog promotes desmoplasia in pancreatic cancer. Clin Cancer Res 14:
5995-6004.
82. Zacharias WJ, Li X, Madison BB, Kretovich K, Kao JY, et al. Hedgehog is an
anti-inflammatory epithelial signal for the intestinal lamina propria.
Gastroenterology 138: 2368-2377, 2377 e2361-2364.
83. Yu M, Gipp J, Yoon JW, Iannaccone P, Walterhouse D, et al. (2009) Sonic
hedgehog-responsive genes in the fetal prostate. J Biol Chem 284: 5620-5629.
84. Gao D, Nolan DJ, Mellick AS, Bambino K, McDonnell K, et al. (2008)
Endothelial progenitor cells control the angiogenic switch in mouse lung
metastasis. Science 319: 195-198.
85. Joyce JA, Pollard JW (2009) Microenvironmental regulation of metastasis. Nat
Rev Cancer 9: 239-252.
86. Nakamura K, Sasajima J, Mizukami Y, Sugiyama Y, Yamazaki M, et al.
Hedgehog promotes neovascularization in pancreatic cancers by regulating
Ang-1 and IGF-1 expression in bone-marrow derived pro-angiogenic cells.
PLoS One 5: e8824.
87. Tremblay MR, Lescarbeau A, Grogan MJ, Tan E, Lin G, et al. (2009) Discovery
of a potent and orally active hedgehog pathway antagonist (IPI-926). J Med
Chem 52: 4400-4418.
88. Bonnet D, Dick JE (1997) Human acute myeloid leukemia is organized as a
hierarchy that originates from a primitive hematopoietic cell. Nat Med 3: 730-
737.
89. Al-Hajj M, Wicha MS, Benito-Hernandez A, Morrison SJ, Clarke MF (2003)
Prospective identification of tumorigenic breast cancer cells. Proc Natl Acad
Sci U S A 100: 3983-3988.
90. Singh SK, Hawkins C, Clarke ID, Squire JA, Bayani J, et al. (2004) Identification
of human brain tumour initiating cells. Nature 432: 396-401.

130
91. Dalerba P, Dylla SJ, Park IK, Liu R, Wang X, et al. (2007) Phenotypic
characterization of human colorectal cancer stem cells. Proc Natl Acad Sci U
S A 104: 10158-10163.
92. Bao S, Wu Q, McLendon RE, Hao Y, Shi Q, et al. (2006) Glioma stem cells
promote radioresistance by preferential activation of the DNA damage
response. Nature 444: 756-760.
93. Quintana E, Shackleton M, Sabel MS, Fullen DR, Johnson TM, et al. (2008)
Efficient tumour formation by single human melanoma cells. Nature 456:
593-598.
94. Ishizawa K, Rasheed ZA, Karisch R, Wang Q, Kowalski J, et al. Tumor-initiating
cells are rare in many human tumors. Cell Stem Cell 7: 279-282.
95. Cho RW, Wang X, Diehn M, Shedden K, Chen GY, et al. (2008) Isolation and
molecular characterization of cancer stem cells in MMTV-Wnt-1 murine
breast tumors. Stem Cells 26: 364-371.
96. Jorgensen HG, Holyoake TL (2007) Characterization of cancer stem cells in
chronic myeloid leukaemia. Biochem Soc Trans 35: 1347-1351.
97. Liu S, Dontu G, Mantle ID, Patel S, Ahn NS, et al. (2006) Hedgehog signaling
and Bmi-1 regulate self-renewal of normal and malignant human mammary
stem cells. Cancer Res 66: 6063-6071.
98. Clement V, Sanchez P, de Tribolet N, Radovanovic I, Ruiz i Altaba A (2007)
HEDGEHOG-GLI1 signaling regulates human glioma growth, cancer stem
cell self-renewal, and tumorigenicity. Curr Biol 17: 165-172.
99. Li C, Heidt DG, Dalerba P, Burant CF, Zhang L, et al. (2007) Identification of
pancreatic cancer stem cells. Cancer Res 67: 1030-1037.
100. Lees CW, Zacharias WJ, Tremelling M, Noble CL, Nimmo ER, et al. (2008)
Analysis of germline GLI1 variation implicates hedgehog signalling in the
regulation of intestinal inflammatory pathways. PLoS Med 5: e239.
101. Hermann PC, Huber SL, Herrler T, Aicher A, Ellwart JW, et al. (2007) Distinct
populations of cancer stem cells determine tumor growth and metastatic
activity in human pancreatic cancer. Cell Stem Cell 1: 313-323.
102. Ginestier C, Hur MH, Charafe-Jauffret E, Monville F, Dutcher J, et al. (2007)
ALDH1 is a marker of normal and malignant human mammary stem cells and
a predictor of poor clinical outcome. Cell Stem Cell 1: 555-567.
103. Dylla SJ, Beviglia L, Park IK, Chartier C, Raval J, et al. (2008) Colorectal
cancer stem cells are enriched in xenogeneic tumors following chemotherapy.
PLoS ONE 3: e2428.

131
104. Bryden MM, Evans HE, Keeler RF (1971) Cyclopia in sheep caused by plant
teratogens. J Anat 110: 507.
105. Chen JK, Taipale J, Cooper MK, Beachy PA (2002) Inhibition of Hedgehog
signaling by direct binding of cyclopamine to Smoothened. Genes Dev 16:
2743-2748.
106. Frank-Kamenetsky M, Zhang XM, Bottega S, Guicherit O, Wichterle H, et al.
(2002) Small-molecule modulators of Hedgehog signaling: identification and
characterization of Smoothened agonists and antagonists. J Biol 1: 10.
107. Chen JK, Taipale J, Young KE, Maiti T, Beachy PA (2002) Small molecule
modulation of Smoothened activity. Proc Natl Acad Sci U S A 99: 14071-
14076.
108. Robarge KD, Brunton SA, Castanedo GM, Cui Y, Dina MS, et al. (2009) GDC-
0449-a potent inhibitor of the hedgehog pathway. Bioorg Med Chem Lett 19:
5576-5581.
109. Tremblay MR, Nevalainen M, Nair SJ, Porter JR, Castro AC, et al. (2008)
Semisynthetic cyclopamine analogues as potent and orally bioavailable
hedgehog pathway antagonists. J Med Chem 51: 6646-6649.
110. Ericson J, Morton S, Kawakami A, Roelink H, Jessell TM (1996) Two critical
periods of Sonic Hedgehog signaling required for the specification of motor
neuron identity. Cell 87: 661-673.
111. Lauth M, Bergstrom A, Shimokawa T, Toftgard R (2007) Inhibition of GLI-
mediated transcription and tumor cell growth by small-molecule antagonists.
Proc Natl Acad Sci U S A 104: 8455-8460.
112. Von Hoff DD, LoRusso PM, Rudin CM, Reddy JC, Yauch RL, et al. (2009)
Inhibition of the hedgehog pathway in advanced basal-cell carcinoma. N Engl
J Med 361: 1164-1172.
113. Rudin CM, Hann CL, Laterra J, Yauch RL, Callahan CA, et al. (2009)
Treatment of medulloblastoma with hedgehog pathway inhibitor GDC-0449.
N Engl J Med 361: 1173-1178.
114. Bardeesy N, DePinho RA (2002) Pancreatic cancer biology and genetics. Nat
Rev Cancer 2: 897-909.
115. Jemal A, Siegel R, Ward E, Hao Y, Xu J, et al. (2009) Cancer statistics, 2009.
CA Cancer J Clin 59: 225-249.
116. Lohr JM (2007) Medical treatment of pancreatic cancer. Expert Rev Anticancer
Ther 7: 533-544.

132
117. Ujiki MB, Talamonti MS (2007) Guidelines for the surgical management of
pancreatic adenocarcinoma. Semin Oncol 34: 311-320.
118. Herbst RS, Kurzrock R, Hong DS, Valdivieso M, Hsu CP, et al. A first-in-
human study of conatumumab in adult patients with advanced solid tumors.
Clin Cancer Res 16: 5883-5891.
119. Javle MM, Shroff RT, Xiong H, Varadhachary GA, Fogelman D, et al.
Inhibition of the mammalian target of rapamycin (mTOR) in advanced
pancreatic cancer: results of two phase II studies. BMC Cancer 10: 368.
120. Morton JP, Mongeau ME, Klimstra DS, Morris JP, Lee YC, et al. (2007) Sonic
hedgehog acts at multiple stages during pancreatic tumorigenesis. Proc Natl
Acad Sci U S A 104: 5103-5108.
121. Jimeno A, Feldmann G, Suarez-Gauthier A, Rasheed Z, Solomon A, et al.
(2009) A direct pancreatic cancer xenograft model as a platform for cancer
stem cell therapeutic development. Mol Cancer Ther 8: 310-314.
122. Feldmann G, Fendrich V, McGovern K, Bedja D, Bisht S, et al. (2008) An orally
bioavailable small-molecule inhibitor of Hedgehog signaling inhibits tumor
initiation and metastasis in pancreatic cancer. Mol Cancer Ther 7: 2725-2735.
123. Dierks C, Grbic J, Zirlik K, Beigi R, Englund NP, et al. (2007) Essential role of
stromally induced hedgehog signaling in B-cell malignancies. Nat Med 13:
944-951.
124. Duda DG, Fukumura D, Munn LL, Booth MF, Brown EB, et al. (2004)
Differential transplantability of tumor-associated stromal cells. Cancer Res
64: 5920-5924.
125. Bailey JM, Mohr AM, Hollingsworth MA (2009) Sonic hedgehog paracrine
signaling regulates metastasis and lymphangiogenesis in pancreatic cancer.
Oncogene 28: 3513-3525.
126. Miyake S, Sellers WR, Safran M, Li X, Zhao W, et al. (2000) Cells degrade a
novel inhibitor of differentiation with E1A-like properties upon exiting the
cell cycle. Mol Cell Biol 20: 8889-8902.
127. Xu Z, Vonlaufen A, Phillips PA, Fiala-Beer E, Zhang X, et al. Role of pancreatic
stellate cells in pancreatic cancer metastasis. Am J Pathol 177: 2585-2596.
128. Duner S, Lopatko Lindman J, Ansari D, Gundewar C, Andersson R Pancreatic
cancer: the role of pancreatic stellate cells in tumor progression.
Pancreatology 10: 673-681.

133
129. Apte MV, Haber PS, Applegate TL, Norton ID, McCaughan GW, et al. (1998)
Periacinar stellate shaped cells in rat pancreas: identification, isolation, and
culture. Gut 43: 128-133.
130. Casini A, Galli A, Pignalosa P, Frulloni L, Grappone C, et al. (2000) Collagen
type I synthesized by pancreatic periacinar stellate cells (PSC) co-localizes
with lipid peroxidation-derived aldehydes in chronic alcoholic pancreatitis. J
Pathol 192: 81-89.
131. Whitehead RH, Joseph JL (1994) Derivation of conditionally immortalized cell
lines containing the Min mutation from the normal colonic mucosa and other
tissues of an "Immortomouse"/Min hybrid. Epithelial Cell Biol 3: 119-125.
132. Neuschwander-Tetri BA, Bridle KR, Wells LD, Marcu M, Ramm GA (2000)
Repetitive acute pancreatic injury in the mouse induces procollagen alpha1(I)
expression colocalized to pancreatic stellate cells. Lab Invest 80: 143-150.
133. Oshima Y, Suzuki A, Kawashimo K, Ishikawa M, Ohkohchi N, et al. (2007)
Isolation of mouse pancreatic ductal progenitor cells expressing CD133 and c-
Met by flow cytometric cell sorting. Gastroenterology 132: 720-732.
134. Wakelin SJ, Forsythe JL, Garden OJ, Howie SE (2008) Commercially available
recombinant sonic hedgehog up-regulates Ptc and modulates the cytokine and
chemokine expression of human macrophages: an effect mediated by
endotoxin contamination? Immunobiology 213: 25-38.
135. Maun HR, Wen X, Lingel A, de Sauvage FJ, Lazarus RA, et al. Hedgehog
pathway antagonist 5E1 binds hedgehog at the pseudo-active site. J Biol
Chem 285: 26570-26580.
136. Lipinski RJ, Gipp JJ, Zhang J, Doles JD, Bushman W (2006) Unique and
complimentary activities of the Gli transcription factors in Hedgehog
signaling. Exp Cell Res 312: 1925-1938.
137. Ingram WJ, Wicking CA, Grimmond SM, Forrest AR, Wainwright BJ (2002)
Novel genes regulated by Sonic Hedgehog in pluripotent mesenchymal cells.
Oncogene 21: 8196-8205.
138. Xu K, Rajagopal S, Klebba I, Dong S, Ji Y, et al. The role of fibroblast Tiam1 in
tumor cell invasion and metastasis. Oncogene 29: 6533-6542.
139. Apte MV, Haber PS, Darby SJ, Rodgers SC, McCaughan GW, et al. (1999)
Pancreatic stellate cells are activated by proinflammatory cytokines:
implications for pancreatic fibrogenesis. Gut 44: 534-541.
140. Pasca di Magliano M, Biankin AV, Heiser PW, Cano DA, Gutierrez PJ, et al.
(2007) Common activation of canonical Wnt signaling in pancreatic
adenocarcinoma. PLoS ONE 2: e1155.

134
141. Pilarsky C, Ammerpohl O, Sipos B, Dahl E, Hartmann A, et al. (2008)
Activation of Wnt signalling in stroma from pancreatic cancer identified by
gene expression profiling. J Cell Mol Med 12: 2823-2835.
142. Shin K, Lee J, Guo N, Kim J, Lim A, et al. Hedgehog/Wnt feedback supports
regenerative proliferation of epithelial stem cells in bladder. Nature.
143. Pabst O, Zweigerdt R, Arnold HH (1999) Targeted disruption of the homeobox
transcription factor Nkx2-3 in mice results in postnatal lethality and abnormal
development of small intestine and spleen. Development 126: 2215-2225.
144. Schoumacher M, Goldman RD, Louvard D, Vignjevic DM Actin, microtubules,
and vimentin intermediate filaments cooperate for elongation of invadopodia.
J Cell Biol 189: 541-556.
145. Ridky TW, Chow JM, Wong DJ, Khavari PA Invasive three-dimensional
organotypic neoplasia from multiple normal human epithelia. Nat Med 16:
1450-1455.
146. Johnson JI, Decker S, Zaharevitz D, Rubinstein LV, Venditti JM, et al. (2001)
Relationships between drug activity in NCI preclinical in vitro and in vivo
models and early clinical trials. Br J Cancer 84: 1424-1431.
147. Bignold LP (2007) Variation, "evolution", immortality and genetic instabilities
in tumour cells. Cancer Lett 253: 155-169.
148. Fiebig HH, Maier A, Burger AM (2004) Clonogenic assay with established
human tumour xenografts: correlation of in vitro to in vivo activity as a basis
for anticancer drug discovery. Eur J Cancer 40: 802-820.
149. Lee CJ, Spalding AC, Ben-Josef E, Wang L, Simeone DM In vivo
bioluminescent imaging of irradiated orthotopic pancreatic cancer xenografts
in nonobese diabetic-severe combined immunodeficient mice: a novel method
for targeting and assaying efficacy of ionizing radiation. Transl Oncol 3: 153-
159.
150. Romer JT, Kimura H, Magdaleno S, Sasai K, Fuller C, et al. (2004) Suppression
of the Shh pathway using a small molecule inhibitor eliminates
medulloblastoma in Ptc1(+/-)p53(-/-) mice. Cancer Cell 6: 229-240.
151. Tempero M, Plunkett W, Ruiz Van Haperen V, Hainsworth J, Hochster H, et al.
(2003) Randomized phase II comparison of dose-intense gemcitabine: thirty-
minute infusion and fixed dose rate infusion in patients with pancreatic
adenocarcinoma. J Clin Oncol 21: 3402-3408.
152. Lyons SK, Meuwissen R, Krimpenfort P, Berns A (2003) The generation of a
conditional reporter that enables bioluminescence imaging of Cre/loxP-
dependent tumorigenesis in mice. Cancer Res 63: 7042-7046.

135
153. Bruns CJ, Harbison MT, Kuniyasu H, Eue I, Fidler IJ (1999) In vivo selection
and characterization of metastatic variants from human pancreatic
adenocarcinoma by using orthotopic implantation in nude mice. Neoplasia 1:
50-62.
154. Froeling FE, Mirza TA, Feakins RM, Seedhar A, Elia G, et al. (2009)
Organotypic culture model of pancreatic cancer demonstrates that stromal
cells modulate E-cadherin, beta-catenin, and Ezrin expression in tumor cells.
Am J Pathol 175: 636-648.
155. Ota I, Li XY, Hu Y, Weiss SJ (2009) Induction of a MT1-MMP and MT2-
MMP-dependent basement membrane transmigration program in cancer cells
by Snail1. Proc Natl Acad Sci U S A 106: 20318-20323.
156. Rowe RG, Li XY, Hu Y, Saunders TL, Virtanen I, et al. (2009) Mesenchymal
cells reactivate Snail1 expression to drive three-dimensional invasion
programs. J Cell Biol 184: 399-408.
157. Ries C, Egea V, Karow M, Kolb H, Jochum M, et al. (2007) MMP-2, MT1-
MMP, and TIMP-2 are essential for the invasive capacity of human
mesenchymal stem cells: differential regulation by inflammatory cytokines.
Blood 109: 4055-4063.
158. Moniaux N, Andrianifahanana M, Brand RE, Batra SK (2004) Multiple roles of
mucins in pancreatic cancer, a lethal and challenging malignancy. Br J Cancer
91: 1633-1638.
159. Pantano F, Baldi A, Santini D, Vincenzi B, Borzomati D, et al. (2009) MUC2
but not MUC5 expression correlates with prognosis in radically resected
pancreatic cancer patients. Cancer Biol Ther 8: 996-999.
160. Matsushita A, Gotze T, Korc M (2007) Hepatocyte growth factor-mediated cell
invasion in pancreatic cancer cells is dependent on neuropilin-1. Cancer Res
67: 10309-10316.
161. Arnoletti JP, Frolov A, Eloubeidi M, Keene K, Posey J, et al. A phase I study
evaluating the role of the anti-epidermal growth factor receptor (EGFR)
antibody cetuximab as a radiosensitizer with chemoradiation for locally
advanced pancreatic cancer. Cancer Chemother Pharmacol.
162. Dessaud E, McMahon AP, Briscoe J (2008) Pattern formation in the vertebrate
neural tube: a sonic hedgehog morphogen-regulated transcriptional network.
Development 135: 2489-2503.
163. Strobel O, Rosow DE, Rakhlin EY, Lauwers GY, Trainor AG, et al. Pancreatic
duct glands are distinct ductal compartments that react to chronic injury and
mediate Shh-induced metaplasia. Gastroenterology 138: 1166-1177.

136
164. Yoon JW, Kita Y, Frank DJ, Majewski RR, Konicek BA, et al. (2002) Gene
expression profiling leads to identification of GLI1-binding elements in target
genes and a role for multiple downstream pathways in GLI1-induced cell
transformation. J Biol Chem 277: 5548-5555.
165. Shaw A, Gipp J, Bushman W (2009) The Sonic Hedgehog pathway stimulates
prostate tumor growth by paracrine signaling and recapitulates embryonic
gene expression in tumor myofibroblasts. Oncogene 28: 4480-4490.
166. Fukasawa M, Korc M (2004) Vascular endothelial growth factor-trap suppresses
tumorigenicity of multiple pancreatic cancer cell lines. Clin Cancer Res 10:
3327-3332.
167. Esteve P, Bovolenta P The advantages and disadvantages of sfrp1 and sfrp2
expression in pathological events. Tohoku J Exp Med 221: 11-17.
168. Le Floch N, Rivat C, De Wever O, Bruyneel E, Mareel M, et al. (2005) The
proinvasive activity of Wnt-2 is mediated through a noncanonical Wnt
pathway coupled to GSK-3beta and c-Jun/AP-1 signaling. FASEB J 19: 144-
146.