Embed Size (px)
Citation preview

Kuwait Chapter of Arabian Journal of Business and Management Review Vol. 5, No.12, August 2016
11
www.arabianjbmr.com
EXAMINING THE INFLUENCE OF SERVICE QUALITY AND
CUSTOMER SATISFACTION ON CUSTOMER REPATRONAGE AT AN OPTICAL DISPENSING PRACTICE IN SOUTH AFRICA
Jitesh Jared S. Lalaram Graduate of the Regent Business School, Durban, Republic of South Africa
Nadeem Cassim Postgraduate Research Manager and Academic, Regent Business School, Durban, Republic of South
Africa Anis Mahomed Karodia
Professor, Senior Academic and Researcher, Regent Business School, Durban, Republic of South Africa
Corresponding author: [email protected]
Abstract Optical health-care providers, such as Aum Optics, aim to create an exceptional customer experience for its clients. This paper provides an overview of the existing literature on two inter-related concepts, Service Quality and Customer Satisfaction, and expands on it to examine their influence on Repatronage intentions. Contemporary business organisations have therefore recognised that customers are important stakeholders. There is consensus among researches that the delivery of high levels of service quality and customer satisfaction holds many benefits: it is a significant predictor of customer loyalty-related intentions (Fullerton, 2005:101); and it increases customers’ purchase intentions, store loyalty, favourable word-of-mouth recommendations (Mc Alexander, Kalenburg, and Koening, 2004:34). The aim of the study is to assess the influence that Service Quality and Customer Satisfaction has on a customer’s intention to make repeat purchases from the same optometry service provider. Key Words: Service Quality, Customer, Satisfaction, Repatronage, Optical Dispensing, Stakeholders, Optometry
ONE: INTRDUCTION Introduction In an increasingly competitive and dynamic commercial environment, companies need to identify, anticipate and satisfy customers to ensure growth potential, business sustainability and the maximization of profit. Considering that the field of optometry involves direct, close and personal contact with clients, marketing strategies which include policies on Customer Satisfaction and Service Quality will greatly enhance the competitiveness of these health care providers. This study is aimed at examining the significant influence that Customer Satisfaction and Service Quality has on a customer’s intention to make repeat purchases from the same optometry service provider. According to Gitman (2008:48), in a competitive marketplace where businesses compete for customers, customer satisfaction is seen as a key differentiator and increasingly has become a key element of business strategy. Weitz and Wessley (2002:340) stated that service quality is a measure of how well the service level delivered matches customer expectations. By implication, these are important concepts as justified by the customer oriented philosophy and the principles of continuous improvement

Kuwait Chapter of Arabian Journal of Business and Management Review Vol. 5, No.12, August 2016
12
in most modern business entities. The net impact hereof has strong positive effects on customer loyalty intentions by virtue of the combination of the customer's professed likelihood to repurchase from the same supplier in the future, and the likelihood to purchase at various price points. For smaller, private optometry practices, achieving the desired results of profitability and sustainability is frequently a result of customer purchasing behaviour and attitudes towards the respective optometric healthcare provider. The inverse hereof translates to degraded business performance and inevitable closure when customers are subtracted from commercial equations. Therefore it reasons to acknowledge that without the customer it is impossible for businesses to sustain itself. Due to the rapid increase of optometry service providers, it is pertinent for organisations herein to imbibe the concept of customer satisfaction and service quality in their business operations. This study will examine the influence that Service Quality and Customer Satisfaction have on a customer’s intention to make repeat purchases Considering, the penetration of large practices which include franchised business entities such as Spectacle Warehouse and Torga Optical, the competitive arena becomes increasingly wide. As a result of their size, business models and their ability to capitalize on the benefits of franchising, it creates greater pressure on the profitability of smaller private practices. In the case of private practices where mass media advertising is almost non-existent, a substantial portion of their clientele are attracted by word-of-mouth referrals similar to a specialist medical practice (from clients who have already used the services before) thereby adding a further dimension of complexity to business growth potential. Aim of the Study The aim of the study is to assess the influence that Service Quality and Customer Satisfaction has on a customer’s intention to make repeat purchases from the same optometry service provider Objectives of the Study
To identify the key factors which influence the customer’s decision-making process involved with making purchases from optometry service providers;
To identify the customers’ definitions of Service Quality and Customer Satisfaction in
order to gain a better understanding of the perceived definitions versus academic definitions;
To assess the impact of the lack of focus on service quality and customer satisfaction
on business continuity;
Make specific recommendations on how to improve Service Quality and Customer Satisfaction at Aum Optics.

Kuwait Chapter of Arabian Journal of Business and Management Review Vol. 5, No.12, August 2016
13
LITERATURE REVIEW Understanding the Significance of Competitive Strategy In today’s fast-paced and increasingly competitive markets, the bottom line of a company’s marketing strategies and tactics is to make profit and contribute to the growth of the company. Customer satisfaction, service quality and retention are global issues that affect all organisations, be it large or small, profit or non-profit, global or local. Many companies are interested in studying, evaluating and implementing marketing strategies that aim at improving customer retention and maximizing share of customers in view of the beneficial effects on the financial performance for the company. In business, as in the military, strategy bridges the gap between policy and tactics. Together, strategy and tactics bridge the gap between ends and means (Pradhan, 2009:137). Strategies which incorporates a magnified focus on customer services encompasses every aspect of a company’s offering including the quality of customer care, advertising, packaging, product and service features, ease of use, and reliability. As mentioned by Porter (2011:61), competitive strategy is "about being different” and further adds that, "it means deliberately choosing a different set of activities to deliver a unique mix of value." Given this orientation, Porter (2011) argues that strategy is about competitive position, about differentiating yourself in the eyes of the customer, about adding value through a mix of activities different from those used by competitors. Moreover, Porter (2011:34) draws on the definition of competitive strategy as "a combination of the ends (goals) for which the firm is striving and the means (policies) by which it is seeking to get there." Thus, Porter seems to embrace strategy as both plan and position. No matter which definition of strategy one considers, the decisions called for are relatively the same. These decisions pertain to choices between and among products and services, market segments, customer portfolios, distribution channels, chosen technologies, pricing and geographic operations, to name a few. A broader perspective has been adopted by Chelst and Canbolat (2012:22) who argues that a primary factor of quality decision-making is transparency, clarifying the rational basis for a decision so as to facilitate effective implementation. The net requirement herein is to ensure a structured, disciplined and systematic way of making these decisions. However only few role-players responsible for strategy formulation have given sustained thought to how their separate decisions shape an organisations ability to be competitive. To the extent that such role-players do think about it, the resultant is that they all have different viewpoints about the meaning of competitiveness; additionally no-one more senior administers the overall efforts. In hindsight, according to Kazmi (2007:33), competition is likely to be intensifying as many other players in the industry see the market opportunity and enter the segment. By justification, businesses craft and implement marketing strategies which include those aimed at addressing its competitors. Two common interrelated factors of influence impacting an organisations ability to be competitive are namely service quality and customer satisfaction. The lack of focus thereof has an impact on customer experience of which may influence Repatronage intentions.

Kuwait Chapter of Arabian Journal of Business and Management Review Vol. 5, No.12, August 2016
14
Synopsis of the concept of Service Quality In its simplest definition constructed from synthesized research, “services” include all economic activities which are intangible, not physically apparent like products and that which provide value to the customer. Given the absence of tangible properties, services are evaluated differently when compared to goods (Hoffman and Bateson, 2010:60). Services have become very crucial in all business industries due to several factors such as globalization and technological advancements. Likewise, services encompasses almost every aspects of contemporary life, starting from the most essential demands such as eatery to other entertainment activities such as sport, cinema and travel. Intrinsically, they are not bound to only service-based businesses such as banks, telecommunications, hotels, restaurants, and beauty salons, but it is part of companies’ strategic tools for gaining a competitive advantage. Notably, nowadays products heavily rely on its services to acquire competitive advantage, and to satisfy customers’ needs. In their book “Managing Quality”, the authors Dale, Van der Wiele and Van Lwaarden (2013:237) stated that service quality is variously defined, but essentially is to do with meeting customer needs and requirements and with how well the service level delivered matches customers’ expectations. Dissecting this definition construes quality as being recognized as a strategic tool for attaining efficiency and premium business performance. Considering the element of service assurance, companies not only retain their existing customers but also increase the propensity of attracting new customers. Consequently, service quality represents the consumer’s overall impression of the relative inferiority or superiority of the organisation and its services. Arguably, the aspect of service quality has become a major area of attention for managers, researchers, practitioners and so on due to its huge impact on business performance. Research has provided substantial indication that customers prefer and value companies that provide high service quality. According to Milakovich (2005:21), as the “quality circle” expands, more and more otherwise isolated, protected, and regulated public and private services are responding to customers by learning how to become more competitive. Customers judge service quality relative to what they want by comparing their perceptions of service experiences with their expectations of what the service performance should be. Often quality is described and measured with tangible goods, whereas quality in services are largely undefined and sparsely researched. It can be deduced that service quality has become a measure of the extent to which the service provided meets the customer’s expectations. Companies have found that in order to be profitable and to grow market share, they should commit to focusing on service quality. The significance of the refocus is that service quality has become a key strategic factor for companies to differentiate their products and services from other competitors by using service quality as a process that customers evaluate. Research to date suggests that customers assess service quality by comparing what they feel a seller should offer and compare it against the seller’s actual service performance. The importance of quality to companies and customers is unequivocal because of its benefits contributing to market share and return on investment. Perspectives on Service Quality According to Pride and Ferrell (2012:438), service quality is customers’ perception of how well a service meets or exceeds their expectations. By justification, service quality is viewed

Kuwait Chapter of Arabian Journal of Business and Management Review Vol. 5, No.12, August 2016
15
as a form of attitude representing a long-run overall evaluation. Maintaining a certain level of service quality with tractions of improving it assimilate life-time efforts for those companies who desire life-time prosperity from their customers. Notably, several authors have argued about the importance of service quality, and have demonstrated its relationship with profits, increased markets share, return on investment, customer satisfaction, and Repatronage intentions. Thus, service quality can be said to be a significant differentiator and a powerful competitive weapon to possess. Given this scenario, companies try to achieve advantage by assuring quality in their services in order to be more competitive in the marketplace. “Service quality is a measure of how well the service level delivered matches customer expectations” (Weitz and Wessley, 2002:340). Weitz and Wessley (2002) argued that service quality results from customers’ expectations of what should the service provider offer in contrast to how the provider actually performs to meet those expectations. Thus delivering quality service means ensuring consistency in service delivery performances on daily basis (Weitz and Wessley, 2002:340). The significance hereof is that companies need to develop a customer oriented strategy concerning customer satisfaction and quality service, if they want to ensure a long term presence in the marketplace. Considering the above significance, a service quality measurement is very crucial for organisation in order to track customer expectations with company performance. According to Kotler and Keller (2006: 68), service quality is very important to attract and retain customers. This is due to the fact that customers derive the perceptions of service quality on the levels of satisfaction they experience with the particular business. As Harrison and Estelami (2014:178) states: “Services are largely people-based processes and as such involve interactions between people”. By implication, service quality is traditionally viewed to be at the transactional level and is the difference between customer’s perception and perceptions of services delivered by service providers. In terms of marketing strategies, optometry service providers employ this as a significant strategic factor to differentiate their products and services from other competitors by using service quality as a process that customers evaluate. Literature suggests that customers assess service quality by comparing what they feel a service provider should offer and compare it against the actual service performance. It may be the case therefore that service quality plays a pivotal role in the customer decision-making process, expressly so when deciding to repurchase from the same service provider, either for the same, different or additional products and services. In addition, different customers have different levels of service tolerance (Zeithaml, Bitner and Gremler, 2009:80). Some customers have narrow zones of tolerance and expect a narrow range of service from providers; whereas on the other hand some customers have higher levels of service expectations that if not met cause dissatisfaction (Zeithaml, Bitner and Gremler, 2009:80). If service quality is above the zone of tolerance, where service performed by the business exceeds the desired level, customers will have favourable responses to the business. This becomes a problem when service performance falls below what customers are willing to accept. The service gets customers’ attention in either positive or negative way. Customer’s zone of tolerance increases or decreases with the influence of a number of factors including price (Zeithaml, Bitner and Gremler, 2009:81). For example, when prices are high customer expect quality service and therefore are less tolerant of poor or unreliable service (Zeithaml, Bitner and Gremler, 2009:81).
Kuwait Chapter of Arabian Journal of Business and Management Review Vol. 5, No.12, August 2016
16
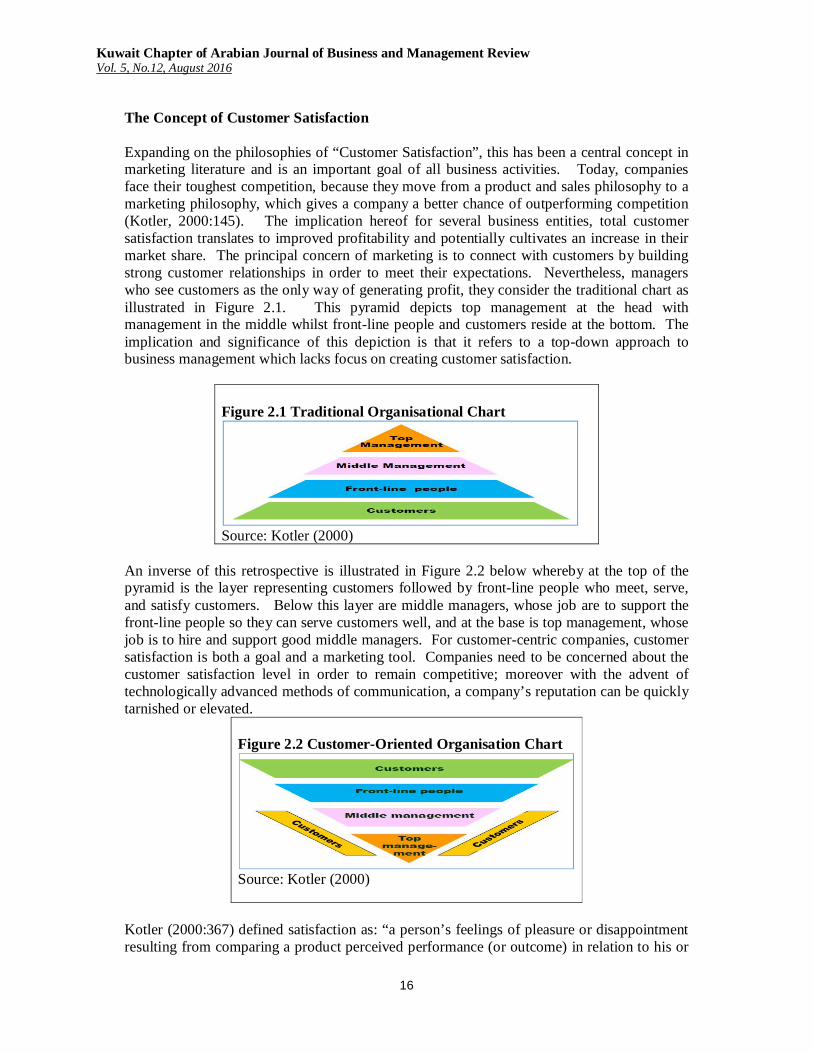
The Concept of Customer Satisfaction Expanding on the philosophies of “Customer Satisfaction”, this has been a central concept in marketing literature and is an important goal of all business activities. Today, companies face their toughest competition, because they move from a product and sales philosophy to a marketing philosophy, which gives a company a better chance of outperforming competition (Kotler, 2000:145). The implication hereof for several business entities, total customer satisfaction translates to improved profitability and potentially cultivates an increase in their market share. The principal concern of marketing is to connect with customers by building strong customer relationships in order to meet their expectations. Nevertheless, managers who see customers as the only way of generating profit, they consider the traditional chart as illustrated in Figure 2.1. This pyramid depicts top management at the head with management in the middle whilst front-line people and customers reside at the bottom. The implication and significance of this depiction is that it refers to a top-down approach to business management which lacks focus on creating customer satisfaction.
Figure 2.1 Traditional Organisational Chart
Source: Kotler (2000)
An inverse of this retrospective is illustrated in Figure 2.2 below whereby at the top of the pyramid is the layer representing customers followed by front-line people who meet, serve, and satisfy customers. Below this layer are middle managers, whose job are to support the front-line people so they can serve customers well, and at the base is top management, whose job is to hire and support good middle managers. For customer-centric companies, customer satisfaction is both a goal and a marketing tool. Companies need to be concerned about the customer satisfaction level in order to remain competitive; moreover with the advent of technologically advanced methods of communication, a company’s reputation can be quickly tarnished or elevated.
Figure 2.2 Customer-Oriented Organisation Chart
Source: Kotler (2000)
Kotler (2000:367) defined satisfaction as: “a person’s feelings of pleasure or disappointment resulting from comparing a product perceived performance (or outcome) in relation to his or

Kuwait Chapter of Arabian Journal of Business and Management Review Vol. 5, No.12, August 2016
17
her expectations”. According to Hansemark and Albinsson (2004:42), “satisfaction is an overall customer attitude towards a service provider, or an emotional reaction to the difference between what customers anticipate and what they receive, regarding the fulfilment of some need, goal or desire”. Taken together, the above definitions suggest that positive customer satisfaction has a positive effect on an organisation’s ability to be competitive. In this respect, the more customers are satisfied with products or services offered, the greater the chances are for a business to succeed as customer satisfaction leads to repeat purchase, brand loyalty, and positive word-of-mouth marketing. The reciprocal of these phenomena, on the other hand, represents dissatisfied customers who respond differently. Dissatisfied customers may try to reduce the dissonance by abandoning or returning the product, or they may try to reduce the dissonance by seeking information that might confirm its high value. Customer satisfaction is a collective outcome of perception, evaluation, and psychological reactions to the consumption expectation with a product or service (Yang and Webb, 2008:769). Further dissection of this terminology articulates customer satisfaction as a customer’s overall evaluation of the performance of an offering. Moreover, this overall satisfaction has strong positive effects on customer loyalty intentions across a wide range of product and service categories provided by the same service provider. Examining the Impact of Customer Experience on Customer Satisfaction Creating customer value is unarguably a major source of competitive advantage for business entities, be it profitable or non-profitable organisations. The value the customers receive derives from the total experience they have with both the core product/service and the overall constituents of the affiliated organisation. In fact, customers are not only buying goods or services but more so specific benefits. Consequently customers value the offer according to their perception of its ability to solve their problem or need. Based on research definition, a customer experience is an interaction between an organisation and a customer. Shaw (2005:51) states that it is a blend of an organisations physical performance, the senses stimulated, and emotions evoked, each intuitively measured against customer expectations across all moments of contact. The inference drawn herewith is that customer experience can be referred to as the total sum of all experiences at various touch-points, over the duration of the customer’s relationship with a service provider, which includes elements of awareness, discovery, attraction, interaction, purchase, use and advocacy. Although few companies have zeroed in on customer experience, the problem is that measuring customer satisfaction thereof does not tell anyone how to achieve it. Customer satisfaction is essentially the culmination of a series of customer experiences or the net result of the good ones minus the bad ones. It occurs when the gap between customers’ expectations and their subsequent experiences has been closed. To understand how to achieve satisfaction, a company must deconstruct it into its component experiences. As Milakovich (2005:110) state: “these elements are more difficult to measure, but may be the most important in terms of overall customer satisfaction”. In reflexion, the customers themselves, that is, the full range and unvarnished reality of their prior experiences, and then the expectations, warm or harsh, those conjured up, must be monitored and probed. Such attention to customers requires a closed-loop process in which every function of an organisation commits to delivering a good experience. Further strengthening is achieved by way of senior management involvement in ensuring that the offering keeps all those parochial conceptions in balance and thus linked to the bottom line. Rigby, Reichheld and Schefter

Kuwait Chapter of Arabian Journal of Business and Management Review Vol. 5, No.12, August 2016
18
(2002:5) postulated that customers who have a strong relationship with a service provider or retailer represent a key asset for service firms. By implication of fostering these strong relationships, businesses create the cornerstones for building better customer experiences. In the case of private optometry practices whereby a substantial portion of their clientele are attracted by word-of-mouth referrals, building and maintaining strong relationships with customers are fundamental to business survival. In this context, it is worthwhile to consider that customer experience is the embodiment of a brand, and of each and every interaction between an organisation and a customer. According to Petouhoff (2009), the new customer experience lifecycle goes beyond loyalty and drives advocacy and referrals. Figure 2.3. Below illustrates the customer lifecycle, as purported by Petouhoff (2009) this represents the opinion stages through which a customer will form perceptions at each contact point.
Figure 2.3 Customer Lifecycle
Source: Natalie L. Petouhoff (2009)
In interpretation of this lifecycle, consideration is given that at each time a customer comes into contact with a business, the customer’s experience will result in an opinion. As time passes, the customer’s collective set of experiences forms a picture in the customer’s mind which ultimately shapes the image of the brand/business entity. The significance hereof is to ensure that at every point at which a customer interacts with a company, the experience must exceed the expectation. While some customers, on occasion, will procure from a particular service provider even though they have had a bad experience along the way, this has become the exception not the rule and may be attributable to several other reasons such as convenience. During the consuming process, customers may experience a variety of emotions hence it is natural to wonder how these emotions influence decision-making of customers when they coexist. On the other hand, when customers are involved in a service failure, they perceive an imbalance in their relationship with the service provider, and they are motivated to restore this balance for economic and relational reasons. From an economic perspective, they expect to receive fair products or services for the money invested. The Distinction between Service Quality and Customer Satisfaction According to Rogelberg (2012:144), marketing literature conceptualises service quality and customer satisfaction as different but interrelated constructs. Considering what has been discussed thus far, it is fair to note that marketing strategies involving “Service Quality” focuses on delivering intangibles and experiences to customers rather than physical goods. Delivering positive experiences successfully and building customer relationships are complicated undertakings involving many different strategies and tactics. Businesses are often challenged with regards to addressing service problems however a key to unlocking

Kuwait Chapter of Arabian Journal of Business and Management Review Vol. 5, No.12, August 2016
19
possible solutions are linked to bridging the gap between customer expectations and perceptions. Customer satisfaction, on the other hand, is a marketing term that measures how products or services supplied by a company meet or surpasses a customer’s expectation. Reviewed literature suggests that the level of customer’s satisfaction has a positive effect on profitability. The significance of executing strategies which envelopes aspects of customer satisfaction are as follows: it’s a leading indicator of consumer repurchase intentions and loyalty; a point of differentiation; reduces customer churn; increases customer lifetime value; reduces negative word-of-mouth and it’s cheaper to retain customers than acquire new ones. Furthermore studies have found that when a person is satisfied with a company or service they are likely to share their experience with other people. Similarly dissatisfied customers are likely to inform others of the unfortunate experience. A review of the emerging research studies suggests that there appears to be relative consensus among marketing researchers that service quality and customer satisfaction are separate constructs which is unique and share a close relationship. In terms of highlighting the conceptual differences, Table 2.1. Identifies a number of key elements that distinguish service quality from customer satisfaction. Table 2.1 Conceptual differences between Service Quality and Customer Satisfaction
Comparison Dimension Service Quality Customer Satisfaction
Experience dependency None required; can be externally vicariously mediated Required
Attributes/dimensions Specific to characteristics defining quality for the product/service
Potentially all attributes or dimensions of the product/service
Expectation/standard Ideals, “excellence” Predictions, norms, needs
Cognitive/effective Primarily cognitive Cognitive and effective
Conceptual antecedents External cues (price, reputation, various communication sources)
Conceptual determinants (equity, regret, affect, dissonance, attribution)
Temporal focus (short vs. long-term)
Primarily long-term (overall or summary)
Primarily short-term (transaction or encounter-specific)
Source: Association for Consumer Research (2007) Relationship Linkage between Service Quality and Customer Satisfaction In a competitive marketplace where businesses compete for customers, customer satisfaction is seen as a key differentiator and increasingly has become a key element of business strategy (Gitman, 2008: 48). Service quality and customer satisfaction have long been recognized as playing a crucial role for success and survival in today’s competitive market. Notably, the quality and satisfaction concepts have been linked to customer behavioural intentions like purchase and loyalty intention, willingness to spread positive word-of-mouth, referral, and complaint intention. There appears to be perpetual interest in customer satisfaction as a

Kuwait Chapter of Arabian Journal of Business and Management Review Vol. 5, No.12, August 2016
20
means of evaluating performance. According to Kotler and Keller (2011:245), high customer satisfaction ratings are widely believed to be a leading indicator of a company’s financial health. Price is not the main reason for customer churn; it is actually due to the overall poor quality of customer service (Accenture, 2012:9). Moreover, Zeithaml and Bitner (2006) believe that service quality and customer satisfaction have certain things in common, but satisfaction is generally influenced by service quality. From literature review, it is acknowledged that there are many factors that affect customer satisfaction. Such factors include friendly employees, courteous employees, knowledgeable employees, helpful employees, accuracy of billing, billing timeliness, competitive pricing, service quality, good value and quick service. Arguably, customer-behaviour continues to undergo metamorphosis more so due to their exposure to information, they are better educated, and more demanding in the products and services they require, and they are more familiar with technology. This phenomena occurring within the modernised consumer market raises many questions for businesses that need to respond to this new era of consumerism. Building and maintaining relationships with customers has become a key strategic point with service providers operating in the services industries. Therefore, building customer relationship develops long-term relationships and improves business performance through customer loyalty and customer retention. Based on literature review and in conjunction with analysis of the local optical dispensing industry, the impacts of the two concepts, that is “Service Quality and “Customer Satisfaction” are highly congruent to customer decision-making noting that customers have come to associate purchasing activities with such elements of brand association. As such, this association yields the cognitive processing of “positive value” toward the brand and this yield a subsequent increase in affective behaviour amongst customers. This increase in affective behaviour can be recognised as a key reason behind the tremendous growth in the industry as it directly influences profitability by giving customers reasons to purchase from the same service provider and increasing their repurchase intentions. By this means, it can be seen that cognitive processing directly influences how a customer perceives value, and it will directly influence the performance of the business. In view of this, it can be concluded that Blythe’s (2008) affirmation that we cannot ignore decision making is convincingly endorsed. The Importance of Repatronage to a Business There is growing support for the assertion that the importance of customers in a business cannot be overemphasised owing to their impact on the business competitiveness and profitability. Continuous repurchase behaviour by consumers results in higher profit margins, competitive advantage and faster business growth (Singh and Khan, 2012). According to Jones, Reynolds, and Arnold (2006), shopper’s Repatronage intention toward a retailer usually corresponds to his/her ‘decision of choice’. There is a growing recognition that customers have a life cycle; thus should be acquired, retained, and climb a value ladder from first time customers to partner status (Ang and Buttle, 2006). By implication of these contentions, this draws on confirmation that inquiries on the customer repurchase behaviour is not new. Significant research on the subject has been done with different research focus which includes investigating factors that lead to repurchase and customer repurchase behaviour and business profitability (Shi, Shi, Chan and Wang, 2009).

Kuwait Chapter of Arabian Journal of Business and Management Review Vol. 5, No.12, August 2016
21
In retrospect to the customer decision-making process, consumer buying behaviour can be understood in two stages, first being that of encouraging people to purchase and the latter inferring enticement to repurchase. Repurchase intention refers to the consumer’s willingness to buy for a long time from the same company (Gounaris, Dimitriadis and Stathakopoulos, 2010). It can also refer to the individual’s judgment about buying again a designated service from the same company (Lacey and Morgan, 2009). By amplifying the aforementioned corroboration, repurchase intention can be construed as the individual’s decision about repeatedly buying the product/service from the same company, taking into accounts his/her current situation and circumstances. On the basis of the literature reviewed, it seems fair to suggest that first-time purchase is often used as a predictive measure of repurchase behaviour. In addition, the decision to repurchase represents the customer’s decision to engage in continuous consumption of the product thereby confirming a positive relationship between repurchase intentions, service quality and customer satisfaction. According to Kaveh (2011), this afore-stated relationship simplifies the matter because in reality, many factors converge in order to make a decision to repurchase. Yang and Peterson (2004) note the following advantages of highly loyal customers; the possibility of attracting more customers, forgive the customer service mishaps, price insensitive and being a major source of retail profits. These findings raise intriguing business implications regarding the nature and extent of consumerism behaviour in that such advantages create a reason for the operators to promote loyalty as a main operation target. At a global level, customer loyalty is generally positively related to the profitability and long-term growth of a firm (Bagram and Khan, 2012). Similarly, this view is reinforced when considering the writings of Vesel and Zabkar (2009), who states, “Hence the need to determine the key factors like satisfaction, high switching costs, trust and commitment that influence customer loyalty as this can be a critical asset for retailers”. In contrast to the various purported delineations of customer repurchase intentions, Repatronage intentions can be said to be subjective judgements pertaining to a customer’s prospective or future buying behaviour and consequently serves as dependent variables in service research and satisfaction studies. Rai (2012:138) stated that repurchase behaviour does not guarantee an emotional attachment on the part of the customer. In the same vein, Rai (2012) in his book notes that the differentiating factors come in the way the service providers’ treat their customers and the value-added in the process. Customers’ repurchase intent depends on the value obtained in their previous transactions such as: appropriate performance criteria (benefits), competition, and cost considerations (Kumar, 2002). Future purchase intentions also have a relationship with customer satisfaction (Durvasula, 2004). Generally, customers evaluate future purchase intentions based on the value obtained from previous episodes/contacts, with relationship benefits being a proxy for expectations of future benefits. By justification of the customers’ repurchasing behaviour, and in relation to procuring from the same service provider, this creates the relationship of customer loyalty. Customer loyalty is a critical component for marketing strategies within the field of optometry hence by implication stands as a proxy for profitability. It is possible to hypothesise that these financial benefits to the organisation is established by virtue of the combination of the customer's professed likelihood to repurchase from the same supplier in the future, and the likelihood to purchase a company’s products or services at various price points.

Kuwait Chapter of Arabian Journal of Business and Management Review Vol. 5, No.12, August 2016
22
The attention drawn on by reviewed literature develops the claim that the issue of retaining customers is of significant importance sometimes even more so than attracting new customers. Taking into consideration that there are high costs involved with the acquisition of new customers, and that such costs are rising, marketing managers should therefore focus analysis of repurchase intentions to predict/forecast sales. The net implications of such business analysis will assist managers to identify how to increase profits in a variety of marketing activities, and create demand forecasting for existing products. Similarly, academic researchers as cited herein frequently use purchase intention as a deputation for repurchase behaviour. Perhaps most importantly, repurchase intentions are the most widely used indicator of customer satisfaction, service quality delivered and customer experience attained in relation to the company’s’ conduct. A general consensus inferred hereof is that customer repurchase intentions can yield several economic advantages for businesses. Taking into account that customers are key predecessors for sales, business’ growth and profitability, investing in the selection of appropriate strategies accordingly remains key in ensuring their re-purchase behaviour.
APTER REE: RESEARCH METHODOLOGY RESEARCH METHODOLOGY
Target Population Brynard and Hanekom (2006:43) explain that in research methodology, ‘population’ does not refer to the population of a country, but rather to the objects, subjects, phenomena, cases, events or activities specified for the purpose of sampling. Jha (2014:182) states that in research, population refers to the group under the study with some specific characteristics which is of the interest of researcher and certainly related to the research. The target population is the total number of a specific population relevant to the research project (Neelankavi, 2010:234). For this study, only 1(one) organisation such as Aum Optics was considered since the recommendations were to be constructed from the findings/factors affecting their business specifically. The target population comprised of all customers who made use of the services offered at Aum Optics from February 2012 up to end March 2015. (The month of February is noted as their end of financial year.). The target population size was estimated at 360 subjects (as per their database and forecasting done for February 2015) all living in the Gauteng province. The sample population size consisted of the first 80 subjects who successfully partook in the research. Therefore the sample population equaled 80 subjects as this represented at least 25% of their customer base and was sufficient to draw meaningful analogies from. Being a small sample size the researcher was able to target all 80 subjects, achieving a 100% success rate. Sample Size Bajpai (2010:260) stated that sample size refers to the number of elements to be included in the study, while deciding the sample size; various qualitative and quantitative aspects must be considered. Sampling procedure can be broadly divided into two categories: random and non-random sampling. In random sampling, the chance factor comes into play in the process of sample selection. For statistical analysis, a random sample is ideal. In non-random sampling, members of the sample are not selected by chance (Bajpai, 2010:97). The

Kuwait Chapter of Arabian Journal of Business and Management Review Vol. 5, No.12, August 2016
23
sampling strategy for this research consisted of 120 subjects who successfully partook in the research. This consisted of 100 subjects who completed the questionnaire forms and 20 subjects with whom telephonic interviews were conducted on. By justification, it allowed for a total of 33.33% of the target population to be sampled noting that 4/5 (4 fifths) of the target population to be sampled by quantitative research whilst 1/5 (1 fifth) of the target population to be sampled by qualitative research. This strategy was constructed to enhance data validation. Limitations of the Research The research is limited to a particular business entity, Aum Optics, their staff and affiliated clientele base (refer to Annexure C), noting that the recommendations are to be constructed from the findings/factors affecting their business specifically.
HAPT FOUR: RESULTS, DISCUSSION AND INTERPRETATION OF FINDINGS Response Rate One hundred and twenty (100%) out of the total population respondents took part in the survey. The survey comprised of one hundred (100) self-administered questionnaires and twenty (20) telephonically interviewed clients. As mentioned in Chapter 3, Babbie (2007:288) further added that a review of published social research literature suggests that a response rate of 50% was considered adequate for analysis and reporting. A response of 60% was good; a response of 70% was very good. Equally important and reasonable to expect that any survey that samples a population will incur some sampling error and possibly sample bias. The underlying argument in favour of the data validity against error and bias (Chapter 3) is that a sizable response rate was achieved using the sampling strategy designed for this research. Data Analysis The findings are presented in six main sections namely: statistical data; service quality measurement; customer satisfaction measurement; customer expectation and perception measurement; customer insights and customer feedback. Part A – Statistical Data Brand Awareness Variables and Demographic Relationships This section consisted of seven (7) questions relating to the respondents clientele relationship to Aum Optics, their medium of the brand awareness as well as their abridged demographic information. According to Salkind (2010:347), demographic information provides data regarding research participants and is necessary for the determination of whether the individuals in a particular study are a representative sample of the target population for generalisation purposes. Theoretically, the use of demographical information in this research is based in part on a particular view of the nature of scientific theory, generally known as logical empiricism [or positivism].

Kuwait Chapter of Arabian Journal of Business and Management Review Vol. 5, No.12, August 2016
24
Brand Affinity Table 4.1 Optometry Service Customer
Category Other optic service providers user
Aum optics service user Yes No
Yes 37% 28% 65%
No 22% 13% 35%
Total 59% 41%
Two categories of customer types were distinguished, namely respondents who used the services of Aum Optics before and those who used other optometry practices. As mentioned in Chapter 2, according to Kazmi (2007:33), competition is likely to be intensifying as many other players in the industry see the market opportunity and enter the segment. The purpose of Question-1 and Question-2 was to gauge the intensity of the competitive landscape affecting Aum Optics. A total of 65% of the respondents indicated that they have used Aum Optics before, indicative of their Repatronage, whilst 59% of the sampling also procured from other optical service providers. The results obtained suggest a relative propensity for churn and can be interpreted as the degree of loyalty towards a particular brand/service provider. Kapferer (2012:234) supports this assumption when he mentioned that a brand can only be strong if it has a strong supply of loyal customers. Researchers (Sumarjan, Zahari, Radzi, Mohi, Hanafiah, Bakhtiar and Zainal, 2013:208) proved this implication in their findings that the combined brand awareness and brand association as one dimension; found that the dimension had positive effects on revisit intentions. Evidence, both in research and literature exist to support the direct relationship between brand association and Repatronage intentions. Brand Awareness Channels Figure 4.1 How Did You Hear About Us

Kuwait Chapter of Arabian Journal of Business and Management Review Vol. 5, No.12, August 2016
25
Figure 4.1. as illustrated above, supports the background observation of the problem statement recorded in Chapter 1 as: iin the case of private practices where mass media advertising is almost non-existent, a substantial portion of their clientele are attracted by word-of-mouth referrals similar to a specialist medical practice (from clients who previously used the services) thereby adding a further dimension of complexity to business growth potential. A substantial number of the subjects, recorded as 52%, advised that they were referred by family, friends or other acquaintances whilst an exact split of 24% per category, “Self-discovery” and “Seen an advertisement/pamphlet” noted that their awareness ignited through the said respective channels. According to Petouhoff (2009), the new customer experience lifecycle goes beyond loyalty and drives advocacy and referrals. By deduction, a strong suggestion exists for the adequacy and effectiveness of the referral channel. It is therefore paramount for businesses to emphasis focus and importance where acquisition and marketing strategies are linked to customer referral methodologies. This assertion is accentuated by Anderson (2012:4) in his book “Fearless Referrals” wherein he stated that the stronger you believe in building a referral business, the more committed you will be to getting outstanding results and to asking for referrals. More recent claims which lends credible support for Anderson (2012) was made by Weiss (2012:8) in his statement that some referrals may readily come your way with no work, but the more discipline and work you put in, the more referrals you will acquire. Therefore it is evident in Figure 4.1. that more than half of Aum Optics customer base is built through referrals, which is indicative of Repatronage intentions and a vital sales channel which requires extensive marketing focus. Demographic Relationships Although it was not part of the main purpose of the study, this set of data was intended to describe demographic variables of the sample and to assess for any influence on the research findings. The demographic data consisted of age, gender, occupation and marital status. Age ranges of the participants in the sample Figure 4.2 Respondents Age
Participants were asked to check-mark their appropriate age category (Figure 4.2). A 100% response rate was achieved revealing a highly dispersed sample population. Fourteen percent of the respondents were in the under 20-years age category and constituted the third highest of the sample. This was followed by 45% in the 21 to 30-years grouping (54 responses) and constituted the bulk of the sample. A further count of 19% resided in the 31 to 40-years age category noted as the second highest category trailed by 10% in the 41 to 50-years group. The least amount of respondents were noted in the age category of 51 to 60-years cited as 5% with a notable 7% of the overall sampling coming from the 60 and above age grouping. According to Ganesan and Paul (2005:251) in the age of the individual, it is enough to be

Kuwait Chapter of Arabian Journal of Business and Management Review Vol. 5, No.12, August 2016
26
what you are and bring out the best in you. Therefore it reasons to claim that businesses must treat all customers with equal respect, courtesy and importance; and afford every customer the opportunity of experiencing consistent service delivery. By implication, the adage “Customer is King” is once again solidified. 4.4.4.2 Gender of the participants in the sample Figure 4.3 Respondents Gender
As illustrated in Figure 4.3, participants were asked to indicate their gender by placing an “X” next to the relevant option provided (male or female). All 120 participants (100%) responded. Of the 120 respondents, 57 (48% rounded) were male and 63 (52% rounded) were female. According to Zeithaml, Bitner and Gremler (2009:80), different customers have different levels of service tolerance. A closer look at the data indicates that a comparable split between male and female respondents were sampled and therefore by deduction, provides an impartial degree of evaluation. For this reason, the aspect of gender was used as the criteria for hypothesis testing as presented in the latter half of this chapter. (Refer to Annexure F). Occupation categories of the participants in the sample Figure 4.4 Respondents Occupation
In terms of occupation, three key categories were presented to the sample population as exhibited in Figure 4.4. More than two-thirds of the respondents were classified under the “Employed” category, which constituted the bulk at 63% (75 respondents) whilst 24% (29 respondents) were recorded in the “Scholar” group. A further 13% (16 respondents) of the 120 respondents check-marked the “Unemployed” category. According to Hammersley (2013:11), samples may be studied with a view to generalizing to some larger population, and statistical techniques can be used to maximize the validity of the generalization and to assess the chances of serious error in the process. The data yielded herein provides strong,
Kuwait Chapter of Arabian Journal of Business and Management Review Vol. 5, No.12, August 2016
27
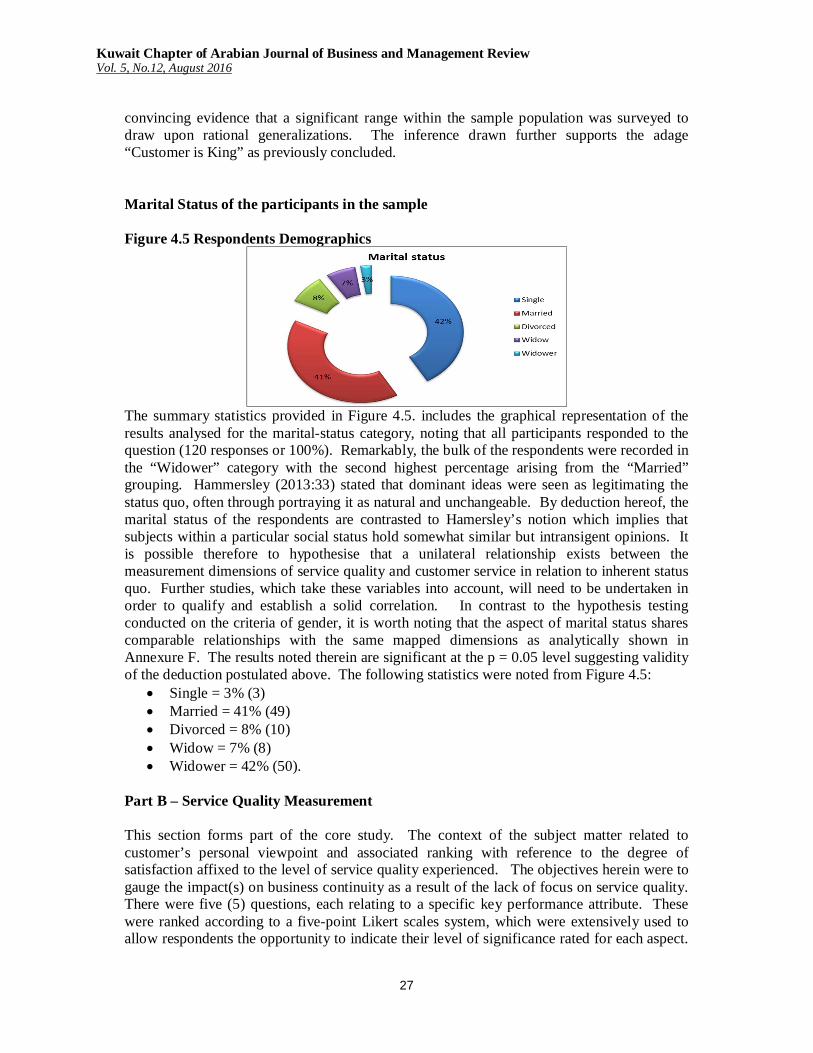
convincing evidence that a significant range within the sample population was surveyed to draw upon rational generalizations. The inference drawn further supports the adage “Customer is King” as previously concluded. Marital Status of the participants in the sample Figure 4.5 Respondents Demographics
The summary statistics provided in Figure 4.5. includes the graphical representation of the results analysed for the marital-status category, noting that all participants responded to the question (120 responses or 100%). Remarkably, the bulk of the respondents were recorded in the “Widower” category with the second highest percentage arising from the “Married” grouping. Hammersley (2013:33) stated that dominant ideas were seen as legitimating the status quo, often through portraying it as natural and unchangeable. By deduction hereof, the marital status of the respondents are contrasted to Hamersley’s notion which implies that subjects within a particular social status hold somewhat similar but intransigent opinions. It is possible therefore to hypothesise that a unilateral relationship exists between the measurement dimensions of service quality and customer service in relation to inherent status quo. Further studies, which take these variables into account, will need to be undertaken in order to qualify and establish a solid correlation. In contrast to the hypothesis testing conducted on the criteria of gender, it is worth noting that the aspect of marital status shares comparable relationships with the same mapped dimensions as analytically shown in Annexure F. The results noted therein are significant at the p = 0.05 level suggesting validity of the deduction postulated above. The following statistics were noted from Figure 4.5:
Single = 3% (3) Married = 41% (49) Divorced = 8% (10) Widow = 7% (8) Widower = 42% (50).
Part B – Service Quality Measurement This section forms part of the core study. The context of the subject matter related to customer’s personal viewpoint and associated ranking with reference to the degree of satisfaction affixed to the level of service quality experienced. The objectives herein were to gauge the impact(s) on business continuity as a result of the lack of focus on service quality. There were five (5) questions, each relating to a specific key performance attribute. These were ranked according to a five-point Likert scales system, which were extensively used to allow respondents the opportunity to indicate their level of significance rated for each aspect.

Kuwait Chapter of Arabian Journal of Business and Management Review Vol. 5, No.12, August 2016
28
According to Pride and Ferrell (2012:438), service quality is customers’ perception of how well a service meets or exceeds their expectations. Figure 4.6. presents the summary statistics of the responses noted from the survey, grouped according to the five (5) specific categories. Figure 4.6 Service Quality Measurement
Responsiveness Under the category “Responsiveness”, the question posed to the respondents was question number eight (8) scribed as, “How do you rate our responsiveness in dealing with you?” Interestingly, one third (1/3) of the respondents reporting a 34% overall, felt that this particular attribute was deemed excellent whilst the bulk (43%) faired it as good. By deduction, a collective 77% of the respondents therefore are said to be pleased with the responsiveness attribute whilst a further collective 9% indicated their dissatisfaction by check-marking the poor and very poor scales. An apparent 13% were comfortable with the level of service quality thereby denoting an aggregate favourable pooled outcome. Weitz and Wensley (2002:340) claims that responsiveness is a dimension of service quality concerned with the wiliness to help customers and provide a prompt service. In the same vein, Tarnay (2013:311) correspondingly affirms that credibility, commitment and responsiveness are important service quality dimensions on repurchase intentions; however supplier’s reputation is significant in moderating the impact of service quality dimensions on repurchase intentions. This leads to state unambiguously that literature lends ample support for the research results, of which such results proffer suggestion that this dimension is of strategic importance to a customer. Retrospectively, this is further supported by Zeithaml, Bitner and Gremler (2009: 80) in their assertion that if service quality is above the zone of tolerance, where service performed by the business exceeds the desired level, customers will have favourable responses to the business. Professionalism Question nine (9) of the survey aimed to extract a customer’s perception about the professional manner in which the procured services were conveyed with. The question was

Kuwait Chapter of Arabian Journal of Business and Management Review Vol. 5, No.12, August 2016
29
constructed as, “How do you rate our professionalism in dealing with you?’ Key to note is that a collective 79% of the respondents rated this measurement along the higher favourable dimension (excellent; good) whilst a total of 8% provided ratings along the lowest ends of the scale (poor; very poor). Similar to the “Responsiveness” category, 13% of the respondents were satisfied in that they were comfortable with the level of service quality experienced thereby denoting a cumulative favourable pooled outcome. Given the orientation of the analysed data, there is ample evidence to lend support to suggest a strong ancillary correlation between the dimensions of responsiveness and professionalism. By this impression, a service provider can be highly professional but proportionally effective in its responsiveness to a client’s needs. Interestingly, this scenario is clearly illustrated by way of the percentage split between the categories “Responsiveness and Professionalism” in that the former received a ranking of 34% and the latter of 46% among the ranking scale of excellent. According to Ulaga and Eggert (2006:119-136), professional support and personal relationship were the most important factors when examining the perceived value in the inter-organisational relation from the aspect of the customer. Further validation is provided by Pride and Ferrell (2012:640) who claimed that all stages of the sales process as part of customer relationship management, has been found to increase salesperson professionalism and responsiveness, customer interaction frequency, and customer relationship quality. Hence there seems to be no compelling reason to argue that professionalism forms an integral part of service quality measurement which has a direct influence on the Customer Buying Decision Process as discussed in Chapter 2. Product Quality Respondents were asked to rank the service quality spectrum for the product quality aspect by way of question ten (10), scribed as “How do you rate our products and services and did they meet your needs and expectations regarding quality and performance?” Comparably, along the upper-end of the ranking scales, a collective 72% of the respondents indicated their favourable acceptance of this attribute. Pride and Ferrell (2012:704) stated that The Profit Impact of Marketing Strategies (PIMS) studies, conducted over the past 50 years, have shown that both market share and product quality influence profitability. This assertion is collaborated by Weitz and Wensley (2012:69) in their claim that marketing management is treated as an optimization problem in which the dependent variables (sales revenue, market share, gross margin, return on investment, etc.) are a function of product quality, price, promotion and distribution. This contention is further supported by Schiffman, O’Cass, Paladino and Carlson (2013:211) in the argument that product quality must be consistently high and provides satisfaction to the customer with each use for the desired consumer behaviour to continue. By implication, product quality is one of the determinants for Repatronage and justifiably considered a critical dimension in service quality. Kotler and Keller (2006:36) defined satisfaction as: “a person’s feelings of pleasure or disappointment resulting from comparing a product perceived performance (or outcome) in relation to his or her expectations”. It was somewhat surprising that only 3% of the respondents felt that the attribute ranked at the lowest end of the scales (3% poor; 1% very poor) whilst 25%, which totals one quarter (1/4) of the sample population, were satisfied in that they were comfortable with the level of service quality in this attribute. As mentioned by Schiffman et al. (2013:176), product quality refers to the consumer’s measurement of a product or service on the basis of a variety of informational cues: some are intrinsic to the products (e.g. colour, size, flavour, aroma), while others are extrinsic (e.g. price, store, image, brand image, service environment). Therefore it reasons to state that a positive collective outcome has been noted

Kuwait Chapter of Arabian Journal of Business and Management Review Vol. 5, No.12, August 2016
30
within the results, and supported by literature, for which the attribute is implied to have a direct relationship with business profitability. Delivery According to Boshoff and Du Plessis (2009:176), three important timing-related aspects to consider during the delivery process are the length associated with service delivery, permanence of service delivery and payment for the service. Question eleven (11) of the survey, “How do you rate our delivery on time performance and our commitment to meet your delivery expectations?” probed to understand the clients ranking of the “delivery” attribute, which is a fundamental aspect for a retail business. A notable 30% of the respondents felt that the level of service quality on the delivery attribute was excellent; 38% ranked it good; 20% check-marked it as satisfactory; 8% indicated poor whilst 4% rated it with an indicator of very poor. The underlying argument in favour of a collective 68% upper-scale ranking is that the 4% achieved at the lowest end of the Likert Scale system seems to have a parallel relationship, equivalently comparable to the dimensions of “Responsiveness and Professionalism”; and semi-equivalent to the dimension of “Product Quality (1%) and Competitiveness (5%). By implication, this draws the supposition that customers are not entirely and out-rightly dissatisfied. Delivering quality service means ensuring consistency in service delivery performances on daily basis (Weitz and Wensley, 2002:340). As a rebuttal to this point, it might be (convincingly) argued that this phenomena indicates that greater room for improvement exists for the service providers to develop more of their customers, who ranked along the “Satisfactory” indicator, to move rapidly along the “Good to Excellent’ levers. Corroboration to support this recommendation is provided by Ang and Buttle (2006:85) in their mention that there is a growing recognition that customers have a life cycle; thus should be acquired, retained, and climb a value ladder from first time customers to partner status. As mentioned by Boshoff and du Plessis (2009:175) in their statement that in addition to the length of service delivery, service providers also have to consider how payment for services will be integrated into the service delivery process. The decisions that service providers make regarding the timing aspect of their service delivery will have a direct impact on the value of the service for customers (Boshoff and du Plessis, 2009). Therefore, in consideration of the above claims, noting that Aum Optics only provides a cash and credit/debit card payment options, on the basis of the evidence currently available, it seems fair to suggest that part of the distortional attribute ratings are due to the lack of suitable facilities which could enhance service delivery. These results provide confirmatory evidence that suggest inefficiencies with respect to delivery time as theoretically, customers may place value on service providers who offer after-hours services despite the fact that it may cost them more. Competitiveness Weitz and Wensley (2002:108) claimed that in real markets the degree of competitiveness of products does not appear to be independent of customer purpose; the same products or brands often compete more intensely for some purposes or in some usage situations or contexts than others. Question twelve (12) scribed as, “How do you rate the competitiveness of our products and do they represent value for money?” was constructed with the objective to understand the degree of competitiveness as perceived from the customer’s viewpoint. In contrast to the “Product Quality” aspect in which 37% achievement was obtained within the ranking of excellent, a comparable 39% was noted within the same ranking for the
Kuwait Chapter of Arabian Journal of Business and Management Review Vol. 5, No.12, August 2016
31
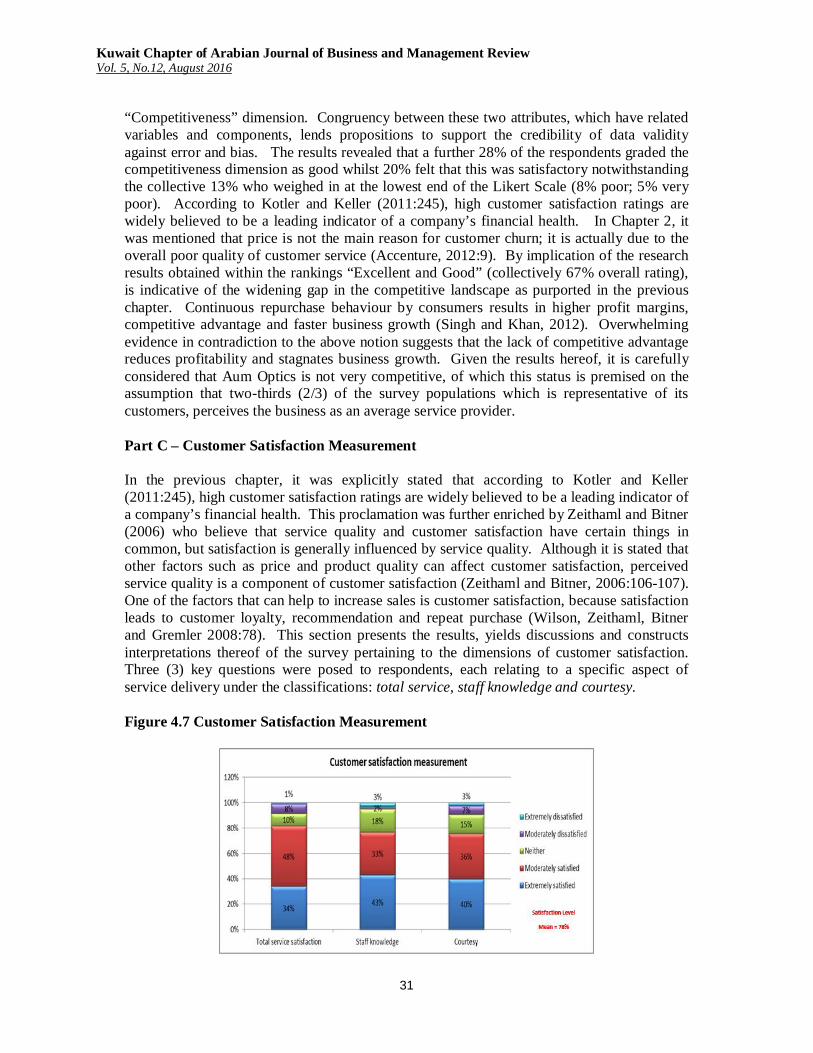
“Competitiveness” dimension. Congruency between these two attributes, which have related variables and components, lends propositions to support the credibility of data validity against error and bias. The results revealed that a further 28% of the respondents graded the competitiveness dimension as good whilst 20% felt that this was satisfactory notwithstanding the collective 13% who weighed in at the lowest end of the Likert Scale (8% poor; 5% very poor). According to Kotler and Keller (2011:245), high customer satisfaction ratings are widely believed to be a leading indicator of a company’s financial health. In Chapter 2, it was mentioned that price is not the main reason for customer churn; it is actually due to the overall poor quality of customer service (Accenture, 2012:9). By implication of the research results obtained within the rankings “Excellent and Good” (collectively 67% overall rating), is indicative of the widening gap in the competitive landscape as purported in the previous chapter. Continuous repurchase behaviour by consumers results in higher profit margins, competitive advantage and faster business growth (Singh and Khan, 2012). Overwhelming evidence in contradiction to the above notion suggests that the lack of competitive advantage reduces profitability and stagnates business growth. Given the results hereof, it is carefully considered that Aum Optics is not very competitive, of which this status is premised on the assumption that two-thirds (2/3) of the survey populations which is representative of its customers, perceives the business as an average service provider. Part C – Customer Satisfaction Measurement In the previous chapter, it was explicitly stated that according to Kotler and Keller (2011:245), high customer satisfaction ratings are widely believed to be a leading indicator of a company’s financial health. This proclamation was further enriched by Zeithaml and Bitner (2006) who believe that service quality and customer satisfaction have certain things in common, but satisfaction is generally influenced by service quality. Although it is stated that other factors such as price and product quality can affect customer satisfaction, perceived service quality is a component of customer satisfaction (Zeithaml and Bitner, 2006:106-107). One of the factors that can help to increase sales is customer satisfaction, because satisfaction leads to customer loyalty, recommendation and repeat purchase (Wilson, Zeithaml, Bitner and Gremler 2008:78). This section presents the results, yields discussions and constructs interpretations thereof of the survey pertaining to the dimensions of customer satisfaction. Three (3) key questions were posed to respondents, each relating to a specific aspect of service delivery under the classifications: total service, staff knowledge and courtesy. Figure 4.7 Customer Satisfaction Measurement

Kuwait Chapter of Arabian Journal of Business and Management Review Vol. 5, No.12, August 2016
32
Total Service Satisfaction Question thirteen (13), scribed as “How satisfied are you with the total service you have received on this occasion?” produced peripheral correlating mean results when compared to the mean calculated from Part B (Service Quality Measurement). Figure 4.7. presents an overview of the results noted as: Extremely Satisfied = 34%; Moderately Satisfied = 48%; Neither = 10%; Moderately Dissatisfied = 8% and Extremely Dissatisfied = 1%. The implied graph is quite revealing in several ways in that a collective 82% of respondents noted their satisfaction in terms of been satisfied with the total service. Moreover, this outcome produces the most significant contribution toward the total segment’s overall Satisfaction Level Mean = 78%. In contrast to Part B’s Satisfaction Level Mean = 73%, the results are comparably synchronised, which is expected due to the themes correlative relationship. An implication of this is the possibility that the data collected and analysed, indicates a greater propensity to be valid and less bias. It may be the case therefore that this finding proves Zeithaml and Bitner’s (2006) conviction stated earlier, that satisfaction is generally influenced by service quality. Corroboration is further purported by Bagram and Khan (2012) who stated that low quality service, which does not reach the customers’ expectations, leads to consumer dissatisfaction. Arguably, a semi-equivalent number of respondents were either satisfied (10%) or dissatisfied (9% collectively) thereby confirming sentiments made by Ang and Buttle (2006:87) who proclaims that customers who complain and are well recovered can be more satisfied, and less likely to switch than customers who had no cause for complaint at all. By implication, this represents a case of customer loyalty. Researches that suggests a strong relationship between consumer loyalty and repurchase intention are substantial (Van Vuuren, Roberts-Lombard and Tonder 2012; Singh and Khan, 2012; Vesel and Zabkar, 2009; Ang and Buttle, 2006). In its practical form, customer loyalty leads to repatronage intentions at the same service provider, and confirms the ideas of said researches who consider that it is a resultant of the total customer satisfaction euphoria experienced by a customer. Staff Knowledge Respondents were asked to rate their satisfaction levels in the category of staff knowledge by way of question fourteen (14), structured as “How satisfied are you with the relevant knowledge of the staff you dealt directly with?” A combined total of 76% (Extremely Satisfied = 43%; Moderately Satisfied = 33%) of the respondents were satisfied with the levels of staff knowledge whilst 18% were undecided and a remaining collective 5% (Moderately Dissatisfied = 2%; Extremely Dissatisfied = 3%) felt that in this dimension it was unacceptable. According to Wagner-Tsukamoto and Tadajewski (2006), the retailers’ knowledge of consumer behaviour is useful in retaining the already existing customers. Coupled with the above assertion, it can be deduced that from the consumers’ point of view, many factors converge to gain satisfaction, trust and loyalty for a retailer in order to continue the relationship. These ideas are echoed by Morgan (2009) in his statement that people can tell when you are confident in your skills. This proclamation is consistent with Schiffman et al. (2013:217) recommendation that the degree of prior knowledge is an important consideration. Further justification and corroboration is provide by Van Heerden (2010:95) who stated that the knowledge gathered must become part of the competitive selling points in the solving of customer’s problems. Therefore it is crucial that front-line including administrative staff be adequately trained and skilled-up to support the specific services that

Kuwait Chapter of Arabian Journal of Business and Management Review Vol. 5, No.12, August 2016
33
are been rendered. Endorsement hereof is reinforced by claims made by Thompson (2014:168) who states that in fact, the definition of a knowledgeable contact person at your firm could well be some-one with these attributes (in the customers words): Knows all the available products and services; Understands my needs and wants; Proposes the best match of available products to my needs; Can educate or advise me on the use of products. These findings in collaboration with literature examination may possibly explain the repercussions of poorly emitted skill-sets, noting in addition that customers become despondent about the level of satisfaction received; which ultimately bodes a negative image on the service provider. Staff Courtesy “How satisfied are you that the staff showed courtesy and interest in you?” was a question constructed with a central idea to determine the level of courtesy presented to customers. Question fifteen (15) therefore gauged the aspect of courtesy which Moment (2012:8) mentioned that as a basic starting ground, common courtesy is important when it comes to customer service. The following results were obtained: Extremely Satisfied = 40%; Moderately Satisfied = 36%; Neither = 15%; Moderately Dissatisfied = 7% and Extremely Dissatisfied = 3%. Parallels can be drawn between the collective percentages of “Staff Courtesy” and “Staff Knowledge” within the combined groups of extremely satisfied and satisfied in that both dimensions indicated a 76% ranking. This implies that staff confidence has a correlative impact on the levels of courtesy they exhibit. To put it differently, Thompson (2014:119) stated that the employee who approaches a topic with an awareness of how the customer feels and then relates to that and “takes the customers side” best exemplifies courtesy. A collective 10% of respondents indicated their dissatisfaction which implies that there is substantial room for improvement, widened even further by the 15% of respondents who were uncertain of an appropriate ranking. These results may be explained by the fact that Gilbert (2012:124) claims that courtesy is important to customers, who want to be treated with dignity and respect, and to management, which wants customers to go away satisfied so that they will come back. Therefore in the accounts of literature, and with the support of the research findings noted in Figure 13, it is reasonable to suggest that these dimensions are determinants for repatronage intentions. A strong relationship therefore is proven to exist between “staff knowledge” and “staff courtesy” which has a direct impact on the levels of customer satisfaction. In summary, the preliminary results from this section show a strong relationship between service quality and customer satisfaction. Part D – Customer Expectation and Perception Measurement This part of the survey dealt with the expectations and perceptions of customers. It consisted of nine (9) questions composed of inter-related focal themes. Evidently, it was a substantial section noting that the objectives related to identifying those elements for which an ideal optical healthcare provider should deliver on in relation to the customers’ requirements. According to Thompson (2014:122-129), with each excellent, personalized service experience, customer expectations are also rest upwards; that new level becomes the customer’s base expectation the next time. Considering these sentiments, an inference is drawn suggesting that these rising levels of expectations spill over to subsequent repatronage intentions and potential growth of business through new acquisitions in the form of referrals. The design of these dimensions was based on logical observations (physical visitations to several optometry practices and elicited views from staff and clients) in keeping with realistic

Kuwait Chapter of Arabian Journal of Business and Management Review Vol. 5, No.12, August 2016
34
and practical expectations. Figure 4.8. illustrated below presents the overview among the nine (9) measures/ aspects noted in the categories of: store ambience; product range; customer care; opinions of others; communications and notifications; adverts; staff knowledge; operating hours and lastly, recommendation to other. Therefore the research results will be presented first using simple statistical analysis followed by deeper inspection of commentary and discussions examined in a separate sub-section thereafter. Presentation of Research Results: Customer Expectation and Perception Figure 4.8 Customer Expectation and Perception Measurement
The themes proffered to respondents as illustrated in Figure 4.8. are summarized in conjunction with the Comparative Mean Score table (Annexure E):
A collective 71% agree with the statement that a modern, elegant ambiance and upmarket-styled shop is an influential factor when choosing an optical service provider. It measured a mean score of 2.1;
The response rate was a collective 64% for agreement with respect to product range
being an influencer and measured a mean score of 2.2;
The mean score for Customer Care was calculated at 2.1 in contrast to its overall collective 69% respondents, who agreed with the statement that customer care influences their choice when considering an optical service provider;
The opinions of others with respect to being in agreement with the proposed statement
was recorded at 70% and produced a mean score of 2.1;
The statement that “Communications and notifications provided by an optical healthcare provider about their new product ranges and services, sales, discounts and promotions attract me to choose their business practice over another” produced a collective 67% of responses in agreement with the declaration. The calculated mean score was established at 2.3;
A collective 60% of the respondents agreed with the statement that advertisements
such as in newspapers, pamphlets, signage boards and so on, influences intentions to make purchases of optometry products and services. The mean score was established at 2.3;

Kuwait Chapter of Arabian Journal of Business and Management Review Vol. 5, No.12, August 2016
35
The majority of subjects who responded to the statement that staff knowledge,
technical skills, professional behaviour and courtesy toward customers instils confidence when using their services, agreed at 73% significance. The mean score was established at 1.9;
A collective 69% of respondents agreed with the statement that business operating
hours and days must be convenient and flexible in order to meet life-style requirements. The calculated mean score was 2.1;
In order to assess the probabilities of repatronage through the assumption that
satisfaction in overall customer experience leads to growth in clientele, respondents were asked if they would make referrals hereof. A collective 73% of respondents agreed with the statement thereby producing a mean score of 2.1. Ultimately, this result produced a positive impression in line with the research overall objective; namely assessing the influence that Service Quality and Customer Satisfaction has on a customer’s intention to make repeat purchases from the same optometry service provider.
Discussion and Interpretation of Findings Arguably, in his book “Competitive Advantage of Nations”, Porter says that the competitive advantage of a firm lies in being everything to a select few; to be everything to everyone is a sure recipe for strategic failure (Porter, 2011). By implication, the research findings from this section of the survey raise the possibilities that there is a significant need for smaller businesses to undergo metamorphosis and align with the needs and wants of its target markets in order to remain competitive, profitable and sustainable. Taking cognizance of the depictions shown in Figure 4.8. The nine (9) dimensions are discussed in the sub-sections below in order of their hierarchical rankings as illustrated in the Comparative Mean Score table (Annexure E). Staff knowledge, Technical Skills, Professional Behaviour and Courtesy Contrary to expectations, the research data indicated that customers valued staff knowledge, technical skills, professional behaviour and courtesy as the most important aspect associated with their expectations and perceptions. This is clearly evident by way of the calculated mean score of 1.9 produced from the responses to Question-22. This has major implications as advised by Cook (2011:18) in her assertion that in providing training to staff to improve customer service, organisations often focus on the “hard” skills – product knowledge, technical skills and administration, without bringing about a change in attitude in the way staff deal with customers personally. It reasons therefore to state that there is a heightened need for training and development, including a greater breadth in which to improve product knowledge, the understanding of customer and organisation behaviour, as well as the proficiencies in technical support. A further study with more focus on the effects of training and development is therefore suggested noting that these preliminary results has proved the value of this dimension as being an integral measurement in a consumers cultural make-up.

Kuwait Chapter of Arabian Journal of Business and Management Review Vol. 5, No.12, August 2016
36
Convenience and Flexibility of Business Operating Hours The same conception as noted above can be extrapolated to the results associated with the convenience and flexibility of business operating hours. Corroboration is provided by Delsen, Bosworth, Grob and de Bustillo y Llorente (2012:113) in their dictum that not only the duration of operating hours is crucial for the economic competitiveness of establishments, but also their flexibility. Given the mean score of 2.1 to responses noted in Question-23, this aspect is convincingly stressed by Delsen, Bauer, Cette and Smith (2009:10) in their statement that in the face of stronger international and global competition and increased customer orientation, the flexibility of operating hours gains in importance beyond their mere duration. These findings therefore may possibly provide a better understanding of the changing dynamics of a consumer’s buying-cycle, putatively it provides insights into what constitutes a convenient time versing conventional time in the minds of a consumer. Therefore, by implication, retailers can gain competitive advantage by synchronizing their operating hours with that of the target markets perceptual clock. However, more research on this topic needs to be undertaken before the association between “business operating-hours” and “consumer convenient time” is more clearly understood and widely analyzed. Ambiance and Opinions of Others Interestingly, both dimensions, an upmarket-styling of a shop (Question-16) and; the opinions of others (Question-19), each produced an equivalent mean and standard deviation score as compared to Question-23 discussed above. By implication, these findings raise intriguing questions regarding the nature and extent to which evokes the slang-term “Bling-Bling” to anthropomorphize the characteristics of consumer behaviour. Support for this assumption is solidified by authors Furnée and Lesger (2014:130) who stated that it commercializes them and subdues them to a new aesthetic focusing on goods, exposing their attractiveness and thus creating new demand; the desires for new goods turn into ties that bind. Inferences to the adage of “ties that bind” are metaphorically construed as the intention to repurchase, which is an objective vital to a retailers marketing strategy. Another key finding emerging from this research data indicated that customers place significant value on the opinions received from family, friends and colleagues when deciding on a prospective purchase and outlet. Cook (2011:17) however advises caution when interpreting this dimension as she mentions that when you ask anyone for their opinions and you will find that, even when discussing the service received from one organisation alone, customer’s expectations and experiences can vary. However, the analysis supports Engel, Blackwell and Miniard (2001:6) definition of consumer behaviour and endorses Blythe (2010:5) argument that for marketers, understanding the processes involved in consumers making decisions is central to establishing policy. It reasons therefore to state that retailers must consider the impact that negative customer feedback will have on future repatronage intentions, and apply beneficial mitigation strategies which will positively influence the consumer decision-making process. Customer Care and Referrals As expected, the results on customer care (Question-18) and the preparedness to recommend other customers (Question-24) were equally related in their mean scores of 2.1. This expectation is associated with the widely accepted belief that consumers who experience good customer service, which is a critical component of Service Quality, usually make

Kuwait Chapter of Arabian Journal of Business and Management Review Vol. 5, No.12, August 2016
37
referrals thereafter. Literature lends support to this assumption as noted by Young and Burgess (2012:224) in their statement that businesses have to understand the components of the service which lead to repeat business and referrals (and thus future revenue), and which processes or techniques should be employed to improve them. The authors Tyson and Schell (2014:208) in their book “Small Business for Dummies” stated that if you take care of your customers in the early stages of your business’s life and provide an easy feedback mechanism, the referrals from satisfied customers should take care of you and your business in future. According to Cook (2011:33) customers do not blame individual staff members for poor standards but the company as a whole. These results were expected and reveal that consumers use discretion and may possibly react according to the situation. Cook (2011:10) further stated that satisfied customers are likely to recommend products and services; advocates of a company are more likely to pay premium prices to a supplier they know and trust. Persuasively, this combination of findings provides direct support for the conceptual premise of the Engel-Blackwell-Miniard (EBM) model (Engel, Blackwell, and Miniard, 2001) in that the post-purchase evaluation results in either satisfaction or dissatisfaction. According to Jones, Reynolds, and Arnold (2006:976) shopper’s repatronage intention toward a retailer usually corresponds to his/her ‘decision of choice’. As mentioned previously, Petouhoff (2009) advises that the new customer experience lifecycle goes beyond loyalty and drives advocacy and referrals. Therefore, these results confirm the association between Service Quality and Customer Satisfaction in relation to having an impact on repatronage intentions. Product Range The current study found that a diverse product range was considered a vivacious aspect given its mean score of 2.2. When statistically analyzed for the levels of importance. These results are consistent with the assertions made by Kazmi and Batra (2012:188) in their observation that when marketers provide a range of products and service options to serve diverse consumer interests, consumers are most satisfied and happy. By implication, customers seek to consider alternate choice which Langen (2012:40) points out that in complex product choice situations, consumers apply different decision making strategies such as simplifying heuristics and non-compensatory strategies. Therefore a strong relationship exists in the literature held between these writers which suggest that a considerable variety of frames, lenses, sunglasses and contact lenses, both premium and low-end brands, must be in-stock in order to cater for a relatively multi-segmented market. The results hereof strongly allude to this recommendation that optical service providers incorporate an attractively-pleasing range of products and associated services as part of their catalogue. Together, these results provide important insights for service providers to continuously evaluate their product and services ranges as part of their business improvement process. Communications, Notifications and Advertisements The most clinically pertinent finding was that customers’ requirements for notifications and communications (Question-20), and advertising (Question-21) were given equal levels of importance as suggested by their mean scores of 2.3 respectively. These result may be explained by the assumption that optical healthcare customers indeed go through the Consumer Buying Decision Process as postulated by Lantos (2011); thereby strengthening the case for the need for information which is paramount to making choices. The marrying of these two dimensions is classically edified by Van Heerden and Drotsky (2011) when they

Kuwait Chapter of Arabian Journal of Business and Management Review Vol. 5, No.12, August 2016
38
stated that, “if you are in the business of selling, you have no choice but to be in the business of electronic communications”. The latter point has been extraordinarily appraised by Seligman (2012:102) in his statement that experiences can also occur – for example when consumers are exposed to advertising and marketing communications, including web sites and social sites. Taken together, these findings advocate the role that communications and advertisements play in promoting brand awareness and acts as a driver to encourage repurchases. Part E – Customer Insights Schieffer writes that customer insights must be at the forefront of all employees’ minds as they make decisions that will impact the future of the organisation (2005:227). With reference to this statement, Part E was composed of two questions; each constructed from the principal objectives of this research namely Service Quality and Customer Satisfaction. This section of the survey extracted the definitions held by customers with respect to the two dimensions. Figure 4.9 Customer Insights: Understanding the term Service Quality
What do you understand by the term Service Quality? Question twenty five (25) scribed as “What do you understand by the term Service Quality?” presented 3 options to the respondents, of which a choice needed to be selected that best matched their understanding. The bulk of the respondents checked option A (an assessment of how well a delivered service conforms to the client’s expectations) at 42% overall response rate. These findings accentuates the definition provided by Wolfson, Mark, Martin and Tavor (2014:25); who further stated that service quality can be used to improve the service and increase client satisfaction. One third of the responses were recorded from option B (refers to a stamp-of-approval on a product/service as provided by the service provider) at 33% significance which is in alignment with the sentiments of the management at Aum Optics. By implication, it could be argued that the service provider has a positive appeal to a third of its clientele due to their synchronized expectations. This view is supported by Nolte (2014:82) who writes that keeping the customer in mind means not only knowing who your customer is but also knowing what your customer expects of you. It would therefore reason why 25% of the respondents checked option C (is a value-added benefit which distinguishes one service provider from another) as it is felt that the expectations encapsulating the dimensions of service quality is not well engrained among service providers and therefore

Kuwait Chapter of Arabian Journal of Business and Management Review Vol. 5, No.12, August 2016
39
leads to a conspicuous experience. The possible interference of the results from option C cannot be ruled out noting the contrast implied earlier with respect to satisfaction levels calculated as the 73% mean for Part B (Service Quality Measurement). This combination of findings provides some support for the conceptual premise that Service Quality has an impact on repatronage intentions. The most important finding was that a significantly large gap exists between a customer’s and a service provider understands of the literature concept therefore suggesting the disparities in the levels of service experienced. Figure 4.10 Customer Insights: Understanding the term Customer Satisfaction
What do you understand by the term Customer Satisfaction? In question twenty six (26), respondents were asked to identify with an appropriate definition to the question, “what do you understand by the term Customer Satisfaction?’ The most striking result to emerge from the data is that 60% recordings were noted for option B (Refers to how pleased a customer should be about his/her purchase). Surprisingly, this outcome is considerably aligned with the sentiments of the management at Aum Optics. By implication, this means that the service provider has a relatively good understanding of how to please a customer. A broader perspective has been adopted by Hyken (2013:121) who argues that it means embracing the fact that you really do have an audience – in the form of your customers, and it means being committed to please that audience. In contrast to the additional 27% noted for option A (The degree of satisfaction or judgement following a consumption experience), which in essence construes the similar meaning to option B, the implication is that this collective 87% of the respondents places greater psychological evaluations/ judgments on their post purchases. Seligman (2012:48) supports this assumption in his claim that satisfaction is a psychological state, the efforts of measuring it, are often at times ridden with caveats, yet despite this, a large number of satisfaction measurements have been proposed and are based around satisfaction being linked with quality. As a result of these findings, the probabilities for repatronage intentions are greater for purchasing experiences which adopts instant gratification than those associated with no meaning, noted as 13% (option C; is merely a concept to describe a customer’s feelings and therefore has no real meaning). The observed correlation between the collective 82% of responses noted in question 13 of Part C and the above noted collective 87% (option A: 27% + option B: 60%) provides evidence to support the observation that customers evaluate their purchases critically with past experiences and are more likely to repeat their purchases at the same service provider if congruency exists between their psychological awareness and the retailers

Kuwait Chapter of Arabian Journal of Business and Management Review Vol. 5, No.12, August 2016
40
awareness of the customer’s needs. By drawing on the concept of repatronage, Kotler and Keller (2011:245) correspondingly support this proclamation by mentioning that high customer satisfaction ratings are widely believed to be a leading indicator of a company’s financial health. Part F – Customer Feedback According to Seligman (2012:22) the brand experience is linked to the customer interface points, which allow for fast and efficient service as well as customer feedback. This study was designed to correspondingly determine recommendations with respect to improving Service Quality and Customer Satisfaction, as well as identifying the key factors which influence the customer’s decision-making process involved with making purchases from optometry service providers. These objectives were achieved in this section, which was composed of a multi-preselect choice question and an open-ended enquiry. 4.9.1 Factors of Influence Table 4.2 Customer Feedback
Factors Customer count
% of Customer
Base Professionalism 84 70% Understanding customers’ specific eye-care needs 72 60% Payment methods such as cash, medical aid, credit cards 70 58% Provision of value-added services such as complimentary repairs and eye-tests 59 49% Promotions and discounts 58 48% Variety of product ranges and services 56 47% The use of new technology and equipment 54 45% Flexible business operating hours and days 51 43% Provision of accurate and error-free eye-wear prescriptions 45 38% Convenience of the outlet location 38 32%
In question twenty seven (27), the objective was to analyses and understand the macro influencers associated with Consumer Buying Decision Process (Chapter 2) in application to optometry purchases. Respondents were asked the question: “What is the most important factor/s that influences your choice of an optical healthcare provider?” All ten pre-propositioned factors produced a comparable frequency distribution, ranked in Table 4.2. According to a hierarchical order listing the most important aspects from top to bottom. From the data presented in Table 4.2, the following revelations exists: 70% of the respondents rank professionalism as the most important aspect; 60% feels that understanding customers’ specific eye-care needs is equally an important aspect as compared to the 58% recorded for alternate payment methods. An average of 48% was noted between the dimensions of; provisioning of value-added service (49%), promotions and discounts (48%) and variety of product ranges (47%), in terms of significance held in the beliefs of the customer. These results may be explained using the viewpoint that Aum Optics is somewhat competitively priced and holds an analogous range of premium branded optic products as part of inventory. The case reported here illustrates the perspective held by Kazmi and Batra

Kuwait Chapter of Arabian Journal of Business and Management Review Vol. 5, No.12, August 2016
41
(2012:516) that high-risk perceivers also reduce the risk by purchasing only well-known brands of non-durable or durable products, or buying the same brand that proved satisfying in the past. A similar trend was noted in that the average between the aspects of: the use of new technology (45%) and flexible business hours (43%) peaked at 44% at the lower end of the ranking scales. The most interesting finding was that 38% of respondents noted that provisioning of accurate and error-free eye-wear prescriptions held importance to them whilst a further 32% checked convenience of the outlet as an influencing factor. A note of caution however is emphasized as Wrigley (2011:90) advises that retail management need to pay explicit attention to the best available store location not only because of the direct influence of the consumers’ behaviour patterns and the competitive situation on the magnitude of sales and hence profit, but also because of the implications of service provision in terms of both organisation and selling techniques. This rather vigilant critique introduces further probabilities that very little significance is placed on the convenience of a stores’ location (32% versus 70%), in contrast to the significance placed on the need for the service provider to demonstrate professionalism. Similarly, Van Heerden and Drotsky (2015:231) point out that professionalism is about being professional even when losing an account can stand the salesperson in good stead in future; the salesperson must always show that he or she would like to be considered for future business. It can be argued then that the aspect of maintaining a professional outlook is key to repatronage, which is reflective of the levels of customer experience and service quality delivered. Comments and Suggestions Of the study population, 116 subjects completed question twenty-eight (28), an open-ended enquiry scribed as, “Do you have any comments or suggestions that would help us improve?” This translated into an overall response rate of 96.6%. Of the 116 participants who responded to this question, 19 stated that they did not have any comments or suggestions to advise on. Thus, by further dissection of the 96.6% response rate, this produced a recalculated proportion totalling 80% feedback success. (Refer to Annexure D for the actual comments received). A small number of those interviewed (5 out of the 20 telephonic interviewed subjects) commented that they are satisfied with the service. Recurrent themes in the interviews was a sense amongst interviewees that suggested improvements to be made on aspects relating to staff politeness, offering of student and pensioner discounts, and speeding-up of delivery times and offering of free eye-tests; for which such aspects are established constituents of Service Quality. These findings are supported by Hernon and Altman (2012:51) in their assertion that consequences can also be affected by components of service quality, in particular promptness and reliability. These factors may explain the relatively good correlation made by Kazmi and Batra (2012:224) in their claim that the promise of a brand is consistent and reliable quality, service and overall psychological satisfaction and that this adds value to the product not only for the consumer but also for the manufacturer. An implication of these findings raises the possibility that Service Quality and Customer Satisfaction has an impact on repatronage intentions. Similar responses were noted among the self-administered surveyed respondents with central themes consisting of dimensions relating to: professionalism, improving of service quality, communications and courtesy calls, speed of production and delivery time-lines. These results provide further support to Seligman’s (2012:99) statement that customer experience management (CEM) is about experiential dimensions of product or service consumption that match the needs and wants of

Kuwait Chapter of Arabian Journal of Business and Management Review Vol. 5, No.12, August 2016
42
the customer first and the organisation second. This combination of findings therefore provides further sustenance for the conceptual premise that there is a relationship linkage between Service Quality and Customer Satisfaction as discussed in Chapter 2. Cronbach’s Coefficient Alpha According to Osborne (2011:38), Cronbach’s alpha coefficient is a measure if internal consistency reliability and is useful for understanding the extent to which the ratings from a group of judges hold together to measure a common dimension. Technically speaking, Cronbach's alpha is not a statistical test, it is written as a function of the number of test items and the average inter-correlation among the items. Below, for conceptual purposes is the formula for the standardized Cronbach's alpha where: N is equal to the number of items, c-bar is the average inter-item covariance among the items and v-bar equals the average variance.
Table 4.3. Indicates that the questionnaire has a generally acceptable degree of reliability and that the items in the questionnaire have an acceptable level of inter-item consistency. (Refer to Annexure G). The following sections were tested and yielded Cronbach’s Alphas of: Table 4.3 Cronbach’s Coefficient Alpha
Section of the Questionnaire Reliability Coefficient Part B – Service Quality Measurement 0.84 Part C - Customer Satisfaction Measurement 0.83 Part D – Customer Expectation and Perception Measurement 0.85 Part E – Customer Insights 0.33
Hypothesis Testing Another approach of inferential statistics is to test, using sample evidence, whether a claim made about the true value of a population parameter is valid. This inferential approach is known as hypothesis testing (Wegner, 2010:256). According to Qian (2009:2), Pearson’s chi square statistics was introduced by Karl Pearson in 1900; it measures the discrepancy between the data and the proposed model, which is called the null hypothesis in a hypothesis test. Therefore the chi-square test is always testing what scientists call the null hypothesis, which states that there is no significant difference between the expected and observed result. The formula is presented as follows:
The variables in this formula are not simply symbols, O stands for the Observed frequency whilst E stands for the Expected frequency. The calculation method is as follows: subtract the expected count from the observed count to find the difference between the two; calculate the square of that number to eliminate positive and negative values; divide the result by the

Kuwait Chapter of Arabian Journal of Business and Management Review Vol. 5, No.12, August 2016
43
expected frequency to normalize bigger and smaller counts; summation of every i needs to be calculated for each cell in a data table, and lastly sum-up all the results. A p-value is generated from a test statistic. By convention, the "cut-off" point for a p-value is 0.05; anything below that can be considered a very low probability, while anything above it is considered a reasonable probability. The chi-square test looked at whether there was any relationship between the column variables and row variables (statements) whilst the null hypothesis claims that there is no relationship. The results presented in Appendix G, which corroborate with the findings in the data analysis, shows that there are significant relationships between the gender and the following statements:
"Responsiveness" of a service provider is an Influential factor when considering a purchase: P= 0.00 | low probability, accept null hypothesis.
"Professionalism" of a service provider is an influential factor when considering a
purchase: P= 0.24 | significant probability, reject null hypothesis.
"Product Quality" of a service provider is an influential factor when considering a purchase: P= 0.65 | significant probability, reject null hypothesis.
"Delivery" of service of a service provider is an influential factor when considering a
purchase: P= 0.08 | high probability, reject null hypothesis.
"Competitiveness" of a service provider is an influential factor when considering a purchase. P= 0.50 | significant probability, reject null hypothesis.
How satisfied are you with the total service you have received on this occasion?
P= 0.19 | significant probability, reject null hypothesis.
How satisfied are you with the relevant knowledge of the staff you dealt with directly with? P= 0.80 | significant probability, reject null hypothesis.
How satisfied are you that staff showed courtesy and interest in you?
P= 0.43 | significant probability, reject null hypothesis.
By the same token, Appendix G shows that there are significant relationships between marital status and the following statements:
"Responsiveness" of a service provider is an Influential factor when considering a purchase: P= 0.98 | significant probability, reject null hypothesis.
"Professionalism" of a service provider is an influential factor when considering a
purchase: P= 0.58 | significant probability, reject null hypothesis.
"Product Quality" of a service provider is an influential factor when considering a purchase: P= 0.40 | significant probability, reject null hypothesis.

Kuwait Chapter of Arabian Journal of Business and Management Review Vol. 5, No.12, August 2016
44
"Delivery" of service of a service provider is an influential factor when considering a purchase: P= 0.03 | low probability, accept null hypothesis.
"Competitiveness" of a service provider is an influential factor when considering a
purchase. P= 0.61 | significant probability, reject null hypothesis.
How satisfied are you with the total service you have received on this occasion? P= 0.89 | significant probability, reject null hypothesis.
How satisfied are you with the relevant knowledge of the staff you dealt with directly
with? P= 0.16 | significant probability, reject null hypothesis.
How satisfied are you that staff showed courtesy and interest in you? P= 0.94 | significant probability, reject null hypothesis.
Conclusion The primary objective of this chapter was to present the analysis of the data collected using analytical techniques to corroborate the supposition of this research study. Therefore the associated responses were scrutinised, critiqued and discussed with the use of incorporating literature and research findings presented in table, figure and chart formats. Overall, these results show substantial congruency with the observations provided by Wilson, Zeithaml, Bitner and Gremler (2008:78) when they mentioned that service quality is a focused evaluation that reflects the customer’s perception of reliability, assurance, responsiveness, empathy and tangibility; satisfaction is more inclusive and it is influenced by perceptions of service quality, product quality and price, also situational factors and personal factors.
APTER FIVE: CONCLUSIONS AND RECOMMENDATIONS CONCLUSIONS AND RECOMMENDATIONS The Objectives of the Study
To identify the key factors which influence the customer’s decision-making process involved with making purchases from optometry service providers. This will unlock crucial information about customer purchasing behaviour so that Aum Optics is able to capitalise on this intelligence to further enhance its core business.
To identify the customers’ definitions of Service Quality and Customer Satisfaction.
The aim is to gain a better understanding of the perceived definitions versus academic definitions. The findings herewith will assist Aum Optics to achieve greater synchronisation with their customers in lieu of attaining referrals and retaining their customers.
To assess the impact of the lack of focus on service quality and customer satisfaction
on business continuity. The impact analysis will provide guidelines for proposing

Kuwait Chapter of Arabian Journal of Business and Management Review Vol. 5, No.12, August 2016
45
recommendations on how Aum Optics may be able to curb their declining profits and high customer churn rate as observed in their current financial statement.
Make specific recommendations on how to improve Service Quality and Customer
Satisfaction at Aum Optics. The purpose of such recommendations is to enable the management team at Aum Optics to apply appropriate turn-around business strategies to encourage repatronage, improved revenue generation and brand affinity.
Findings from the Study According to Grinnell and Unrau (2010:50), every research study is only a single piece in the puzzle of knowledge development. Metaphoric amplification was evidently cited by a renowned philosopher, Oliver Wendell Holmes, Jr. (1841-1945) when he once said, “A mind that is stretched by a new experience can never go back to its old dimensions.” In reflection of these sentiments, Section 5.3.1. And 5.3.2. Below, respectively discusses the findings from the research study thus contributing to the growing pool of knowledge. Findings from the Literature Review Key findings from the literature review are as follows:
According to Pride and Ferrell (2012:438), service quality is customers’ perception of how well a service meets or exceeds their expectations. Further corroboration was provided by Weitz and Wensley (2002:340) in their assertion that service quality is a measure of how well the service level delivered matches customer expectations. These findings imply that customers place significant importance on all aspects relating to service measurements of which the associated valuations are considered during their decision-making process. The research results have also shown that congruency exists between the customers’ definition of Service Quality and the definition which is purported by literature.
Hansemark and Albinsson (2004) defines satisfaction as “an overall customer attitude
towards a service provider, or an emotional reaction to the difference between what customers anticipate and what they receive, regarding the fulfilment of some need, goal or desire”. By implication, a customer’s perception about a purchasing experience may well be influenced by their cognitive assessment which may either render the feelings of satisfaction of dissonance. Different customers have different levels of service tolerance (Zeithaml, Bitner and Gremler, 2009:80). The results obtained in the research lend support to these assertions postulated by literature.
In this study, one of the key objectives was to assess the impact on repatronage and
business continuity. According to Kotler and Keller (2006: 68), service quality is very important to attract and retain customers. This implies that a direct relationship exists between the perceived levels of service quality experienced in relation to a customer’s intentions to commit a repurchase at the same service provider. According to Petouhoff (2009), the new customer experience lifecycle goes beyond

Kuwait Chapter of Arabian Journal of Business and Management Review Vol. 5, No.12, August 2016
46
loyalty and drives advocacy and referrals. Evidently, the research findings validated the relationship linkage as establish in the literature review.
There are many factors that affect customer satisfaction such as courteous and
knowledgeable employees, competitive pricing, good value and quick service. Shaw (2005:51) states that it is a blend of an organisations physical performance, the senses stimulated, and emotions evoked, each intuitively measured against customer expectations across all moments of contact. By interpretation, there are many intrinsic and extrinsic factors which play a role in a customer’s decision-making process as advocated by the Engel-Blackwell-Miniard (EBM) model (Engel, Blackwell, and Miniard, 2001). The results obtained in the research clearly emulated the EBM framework.
According to Kotler and Keller (2011:245), high customer satisfaction ratings are
widely believed to be a leading indicator of a company’s financial health. Price is not the main reason for customer churn; it is actually due to the overall poor quality of customer service (Accenture, 2012:9). In bridging the two literature findings, suppositions can be drawn that there are other defining factors which contribute to a business significant financial success. By justification of the research findings presented in Chapter 4, there is strong affirmation to support the theory of macro influencers associated with Consumer Buying Decision Process (refer to Chapter 2) in application to optometry purchases.
According to Jones, Reynolds, and Arnold (2006), shopper’s repatronage intention toward a retailer usually corresponds to his/her ‘decision of choice’. It can also refer to the individual’s judgment about buying again a designated service from the same company (Lacey and Morgan, 2009). Perhaps most importantly, “repurchase intentions are the most widely used indicator of customer loyalty in firms’ customer feedback systems” (Morgan and Rego, 2006:436). In review of the implications recognised by the authors, it is interpreted that repatronage intentions is a resultant of the perceived levels of customer satisfaction and service quality. Notably, this assumption was validated to be acceptable by the results obtained in the research study.
Findings from the Primary Research Key findings from the primary research are stated below as per four (4) key research questions: 1) What are the key factors which influence the customer’s decision-making process
involved with making purchases from optometry service providers?
In terms of the levels of importance, research findings revealed the following analysis as recorded from the responses received: 70% = professionalism; 60% = understanding customers’ specific eye-care; 58% = alternate payment methods; 49% = provisioning of value-added service; 48% = promotions and discounts; 47% = variety of product ranges; 45% = the use of new technology; 43% = flexible business hours; 38% = provisioning of accurate and error-free eye-wear and 32% = checked convenience of the outlet. These findings revealed that customers are market-savvy

Kuwait Chapter of Arabian Journal of Business and Management Review Vol. 5, No.12, August 2016
47
and base their decisions about optometry requirements on certain criteria deemed important to them.
A collective 71% agree with the statement that a modern, elegant ambiance and
upmarket-styled shop is an influential factor when choosing an optical service provider. Research also revealed that a collective 64% of the respondents indicated that product range is a significant influencer. Staff knowledge, technical skills, professional behaviour and courtesy toward customers instils confidence when using their services recorded a 73% significance response rate. In hindsight, businesses whose offerings are physical products would find it difficult to compete unless they included a range of services with their products. While manufactured products are typically more tangible than services, they are nevertheless marketed with an accompanying degree of intangible services, as revealed by the research findings. Wilson, Bitner and, Gremler (2008:7) argue that very few products are purely intangible or totally tangible.
The opinions of others are imperative in decision making as noted by a 70% positive
response rate. According to Masterman and Wood (2009:89), these opinion formers can include family, peers, colleagues, dignitaries and role models. By deduction, research results indicated that opinions are held at various degrees of acceptance and therefore a critical aspect for management to consider when designing strategies which involves building employee-customer relationships.
Collective 69% respondents stated that Customer Care influences their choice when
considering an optical service provider. These findings are noteworthy as it confirms the sentiments purported by Cook (2011:36) when she stated that it is clear that unless there is a business imperative for customer retention and top management is fully committed to customer care, there is little chance of success.
Research indicated that a collective 67% of responses are in agreement with the
declaration that communications, notifications and advertisements have a positive influence. These results also precipitated the suggestion for further studies to be undertaken to explore the greater impacts that these communication dimensions have on repatronage.
A collective 69% of respondents agreed with the statement that business operating
hours and days must be convenient and flexible in order to meet life-style requirements. By virtue of this finding, the research substantiated the need for practical and realistic recommendations to support the revision of the business hours. Overall, the research findings corroborates with affirmations made by Delsen et al. (2009:10) in their statement that in the face of stronger international and global competition and increased customer orientation, the flexibility of operating hours gains in importance beyond their mere duration.
2) What are the definitions of Service Quality and Customer Satisfaction in terms of
the customer’s perceived definitions?
In terms of Service Quality, the bulk of the respondents checked option A (an assessment of how well a delivered service conforms to the client’s expectations) at

Kuwait Chapter of Arabian Journal of Business and Management Review Vol. 5, No.12, August 2016
48
42% overall response rate. One third of the responses were recorded from option B (refers to a stamp-of-approval on a product/service as provided by the service provider) at 33% significance which is in alignment with the sentiments of the management at Aum Optics. It would therefore reason why 25% of the respondents checked option C (is a value-added benefit which distinguishes one service provider from another) as it is felt that the expectations encapsulating the dimensions of service quality is not well engrained among service providers and therefore leads to a conspicuous experience.
In terms of Customer Satisfaction, the most striking result to emerge from the data is that 60% recordings were noted for option B (Refers to how pleased a customer should be about his/her purchase). Surprisingly, this outcome is considerably aligned with the sentiments of the management at Aum Optics in contrast to the additional 27% noted for option A (The degree of satisfaction or judgement following a consumption experience). As a result of these findings, the probabilities for repatronage intentions are greater for purchasing experiences which adopts instant gratification than those associated with no meaning, noted as 13% (option C; is merely a concept to describe a customer’s feelings and therefore has no real meaning).
3) What are the impacts on business continuity as a result of the lack of focus on service quality and customer satisfaction? Research noted that a collective 9% indicated their dissatisfaction by the level of
service quality associated with the dimension of “Responsiveness”. As per literature, where service performed by the business exceeds the desired level, customers will have favourable responses to the business.
A further 8% of respondents provided ratings along the lowest ends of the scale (poor; very poor) for the dimensions of “Professionalism” of which this aspect forms an integral part of service quality measurement. Evidently, as discussed in Chapter 2, this dimension has a direct influence on the Customer Buying Decision Process.
Only 3% of the respondents felt that the attribute of “Product Quality” ranked at the
lowest end of the scales (3% poor; 1% very poor). Product quality, as per literature is one of the determinants for repatronage and by implication is said to have a direct relationship with business profitability.
A collective 12% of respondents indicated their dissatisfaction by the level of service
quality associated with the dimension of “Delivery”. The decisions that service providers make regarding the timing aspect of their service delivery will have a direct impact on the value of the service for customers (Boshoff and Du Plessis 2009).
The results revealed that at least 13% of the respondents ranked the service provider,
Aum Optics, at the lower end of the “Competitiveness” dimension scale. Research evidence further suggested that the lack of competitive advantage reduces profitability and stagnates business growth.

Kuwait Chapter of Arabian Journal of Business and Management Review Vol. 5, No.12, August 2016
49
4) What specific recommendations with respect to improving Service Quality and Customer Satisfaction, can be offered to the management of the optometry practice?
In terms of the service quality dimension “Delivery”, greater room for improvement
exists for the service providers to work on this inefficiency thereby aligning with customers’ expectations. Corroboration to support this recommendation is provided by Ang and Buttle (2006:85) in their mention that there is a growing recognition that customers have a life cycle; thus should be acquired, retained, and climb a value ladder from first time customers to partner status.
It is crucial that front-line including administrative staff be adequately trained and skilled-up to support the specific services that are been rendered. Corroboration is provide by Van Heerden (2010:95) who stated that the knowledge gathered must become part of the competitive selling points in the solving of customer’s problems.
The research results strongly allude to the recommendation that optical service providers incorporate an attractively-pleasing range of products and associated services as part of their catalogue. The response rate was a collective 64% for agreement with respect to product range being an influencer.
As indicated in the results on customer care (Question-18) and the preparedness to recommend other customers (Question-24), these were equally related in their mean scores of 2.1. This implies the widely accepted belief that consumers who experience good customer service/care, which is a critical component of Service Quality, usually make referrals thereafter.
Retailers can gain competitive advantage by synchronizing their operating hours with
that of the target markets perceptual clock so as to ensure convenience and flexibility in order to meet customer life-style requirements.
A collective 71% of the respondents agree with the statement that a modern, elegant
ambiance and upmarket-styled shop is an influential factor thereby implying that service providers devote effort on creating aesthetically pleasing surroundings.
Research findings advocates the role that communications and advertisements play in
promoting brand awareness and acts as a driver to encourage repurchases. Conclusions This study set out to determine the influence that Service Quality and Customer Satisfaction has on a customer’s intention to make repeat purchases from the same optometry service provider. It is widely inferred through literature review that service quality is defined as the customers’ perception of how well a service meets or exceeds their expectations whilst customer satisfaction refers to the degree to which customer expectations of a products or services are met or exceeded. Therefore, any business especially service providers in a competitive environment without a focus on service quality and customer satisfaction will remain extraneous in the marketplace, experience low customer patronage, poor customer retention, reduced loyalty in addition to inconsequential business referrals.

Kuwait Chapter of Arabian Journal of Business and Management Review Vol. 5, No.12, August 2016
50
Research results as presented in this study have recognised that differing definitions exists for the concepts of Service Quality and Customer Satisfaction as deliberated by customers and business entities. Moreover, the study confirmed that a salient relationship is shared between the two concepts, perhaps this been the most important managerial implication supporting the idea that economic value of customers to business entities is largely the consequence of the repatronage linkage. In addition to the argument of the importance of repatronage to a business, this research explored the considerations of customer decision-making process as a linkage to their intentions to commit said repurchases. Furthermore, repatronage intention is typically used as a proxy for customers’ repurchase likelihood, in an effort to link service quality improvement efforts to business impact measures (market share, revenue and so on). Despite its exploratory nature, this study offered some insights and contributed to determining the factors which influence the customer’s decision-making process involved with making purchases from optometry service providers. The aesthetic appeal of the optometry practice needs to be favourable, the merchandise range should be broadened and varied, and a high degree of professionalism ought to be maintained at all times. Furthermore, staff should adopt a friendly disposition, and possess the required technical knowledge to affect elevated levels of customer satisfaction. This study has also found that generally there is an imperative role played by communications and advertisements with respect to promoting brand awareness and driving repatronage intentions. The current findings add to a growing body of literature on the impacts of service quality and customer satisfaction on business continuity. From the result section, the individual results showed that the research questions were answered distinctively. This research contributes to marketing knowledge by offering a framework that reconciles these two competing concepts; furthermore articulating the circumstances under which a relationship leads a customer to dynamically commit repurchases as a result of the established customer experience. Recommendations The following recommendations were constructed to serve as the turn-around strategies which will assist the management at Aum Optics to address profitability, growth and business continuity deficiencies (refer to Section 5.3.2):
Streamline the laboratory / workshop processes so as to minimise production timespan. This will aid in speeding-up the delivery of the final product/order thereby reducing the number of days a customer has to wait before collection. Such measures may include but not limited to: (1) assign cross-functional tasks to resident technicians instead of specialised duties; (2) include a work-load scheduler in the workshop which is visible for all staff to monitor; (3) establish clear working instructions and escalation protocols to eliminate delays in the production phase; (4) prioritise in-trays according to workmanship requirements instead of randomly selecting the orders from a consolidated batch.
Provisioning of training for all staff: it is highly beneficial to provide specific training conducted by external accredited resource trainers in the fields of reception, secretarial, administration and specialised technical courses. Incorporate in-house mentorship and training programmes conducted by more senior staff, encouraging cross-skilling. Weekly staff meetings will also be advantageous as this provides the

Kuwait Chapter of Arabian Journal of Business and Management Review Vol. 5, No.12, August 2016
51
platform for discussing actual problem areas and for proposing possible solutions. Promoting self-enrichment development programs absolutely benefits both employee and employer.
Gradually incorporate, in small quantities, a variety of contemporary and popular
branded merchandise as part of the product catalogue. This will assist in building an improved range to attract customers influenced by branded labels. The expansion of the merchandise range enables the business to take advantage of opportunities in different market segments, meet changing customer needs, increase customer loyalty and selling more to existing customers.
Include courtesy telephonic call-backs and friendly reminders of appointments as part
of the drive to improve Customer Care. Ensure that every customer receives a business-card, of which the card must have the gesture, “Thank You for your patronage” imprinted. For that customer who is scheduled for an appointment, note the time and date on the card as an easy and cost-effective way for providing reminders. This method has a dual benefit as it also serves as a marketing medium thereby encouraging referral customers.
Extend business operating hours to an additional hour over the week-ends and one-
hour earlier during week days. The idea is to cater for those customers who are heavily burdened by their frenzied social and work life-styles. Also consider an after-hours emergency support facility as part of a premium-rated service. This can be achieved by setting-up a standby roster for technicians thereby fostering customer loyalty and building personalized customer relationships.
Non-radical redesigning of the physical outlet by way of re-organizing furniture and
fixtures is highly recommended as a quick-win solution to transform the environment. Gradually aim to achieve an elegant and upmarket ambiance outlet by improving on the aesthetics. Maintaining a polished and modernised optometry outlet creates the illusion of superior, first-class and highly-professional services which provides that added comfort sought after by health-care clients.
Promote brand awareness, encourage purchases and penetrate new market segments
by way of tailored advertisements and advertising messages. These can be easily achieved using social media and simple text messages (SMS), below-the-line marketing mediums and specific printed formats such as pamphlets handed out at street corners. The objective is to build affinity and establish Aum Optics as a household name in the minds of its clientele.
Area/s for further Research This research study has expanded the extant literature linked to service quality and customer satisfaction, more specifically, the impact hereof on repatronage intentions at the same optical healthcare provider. Based on the results of this study, practitioners, staff and management within this service sector should gain a better understanding of the interrelationship shared between the two concepts, as well as a customers’ willingness to recommend. However, future research is needed to expand on the findings of this study with respect to:

Kuwait Chapter of Arabian Journal of Business and Management Review Vol. 5, No.12, August 2016
52
A unilateral relationship was found to exist between the measurement dimensions of service quality and customer service in relation to the inherent socio-economic status of a customer. Further studies, which consider these variables, will need to be undertaken in order to qualify and establish a solid correlation.
A further study with more focus on the effects of training and development is
therefore suggested noting that these preliminary results has proved the value of this dimension as being an integral measurement in a consumers cultural make-up.
These findings advocate the role that communications and advertisements play in
encouraging repurchases and promoting brand awareness. Further studies, which take these variables into account, will need to be undertaken in order to proffer in-depth marketing strategies which incorporates the effective use of advertising, communication methods and appropriate technologies.
Conclusion According to literature review in Chapter 2, including the corroborations established from the research findings, the financial success as well as the growth of a business is directly linked to the satisfaction levels of its customers. Customer satisfaction, in turn, is determined by the quality of service offered, implying that companies should therefore strive to offer services that meet the specific needs of its target markets. This concluding chapter has focused on constructing practical and appropriate recommendations aimed at improving Service Quality and Customer Satisfaction levels at an optical healthcare provider. It is therefore prudent to determine what specific customer needs are in order to produce value propositions geared towards satisfying these needs. Businesses which are able to differentiate their services and create a competitive advantage will be able to survive intense competition. Therefore companies should strive to understand service quality and customer satisfaction from the perceptions of the customer and not from the assumptions of the service provider. Wilson et al. (2008:55) state that “customers compare their perceptions of performance with reference points when evaluating service quality, thorough knowledge about customer expectations is critical to services marketers”. The findings of this research have indeed identified those expectations and have successfully shown that the intentions to repurchase are highly congruent to customer perceptions.

Kuwait Chapter of Arabian Journal of Business and Management Review Vol. 5, No.12, August 2016
53
References Accenture. (2012). Referencing: 2012 Global Customer Pulse Research: Key Findings
(Brochure). Johannesburg: Accenture. Anderson, M. (2012). Fearless Referrals: Boost Your Confidence, Break down Doors, and
Build a Powerful Client List. USA: McGraw-Hill. Ang, L. and Buttle, F. (2006). Customer retention management process: A quantitative study.
European Journal of marketing. 40 (1/2), p.83-99. Association for Consumer Research. [Online]. Available from: http://www.acrwebsite.org/search/view-conference-proceedings.aspx?Id=7930 [Accessed: 12 March 2015]. Babbie, E. (2007). the Basics of Social Research. 4th Edition. Belmont, USA: Cengage
Learning. Babbie, E. (2010). The Practice of Social research. 12th Edition. Wadsworth: Cengage
Learning. Bagram, M.M.M. and Khan, S. (2012). Attaining consumer loyalty. The role of consumer
attitude and consumer behaviour. International Review of Management and Business Research. 1 (1), p. 1-8.
Bajpai, N. (2010). Business Statistics. India: Pearson Education. Bell, J. (2010). Doing Your Research Project: A Guide for First-time Researchers in
Education, Health and Social Science. 5th Edition. Maidenhead: Open University Press. Beri, G.C. (2009). Marketing Research. 4th Edition. New Delhi: McGraw-Hill Publishing. Blythe, J. (2008). Consumer Behaviour. Thompson Learning. London. Boshoff, C. and Du Plessis, P., J. (2009). Services Marketing – A Contemporary Approach.
1st Edition. Cape Town: Juta & Company Ltd. Brace, I. (2013). Questionnaire Design: How to Plan, Structure and Write Survey Material
for Effective Market Research. 3rd Edition. UK: Kogan Page Publishers Brynard, P. and Hanekom, S.X. (2006). Introduction to Research in The Management-related
Fields. 2nd Edition. Pretoria: Van Schaik. Cargan, L. (2007). Doing Social Research. UK: Rowman & LittleField Publishers, INC. Chaudhuri, A. (2006). Emotion and Reason in Consumer Behavior. UK: Routledge Chelst, K. and Canbolat, Y.B. (2012). Value-Added Decision Making for Managers. USA:
CRC Press.

Kuwait Chapter of Arabian Journal of Business and Management Review Vol. 5, No.12, August 2016
54
Clark, M. (1997). ‘Modelling the Impact of Customer-Employee Relationships on Customer Retention Rates in a Major UK Retail Bank’, Management Decision. Cohen, L., Manion, L. and Morrison, K. (2011). Research Methods in Education. 7th Edition.
New York: Routledge. Cook, S. (2011). Customer Care Excellence: How to Create an Effective Customer Focus.
6th Edition. UK: Kogan Page Publishers. Cottrell, R. and McKenzie, J. (2011). Health Promotion & Education Research Methods:
Using the Five Chapter Thesis/ Dissertation Model. 2nd Edition. Canada: Jones & Bartlett Publishers International.
Creswell, J.W. and Plano-Clark, V.L. (2009). Designing and Conducting Mixed Methods
Research. 2nd Edition. Sage Publications, Inc. Cronin, J. J., and Taylor, S. A. (1992) Measuring service quality; a re-examination and
Extension. The Journal of Marketing, 56(3), p.55-68. Cuesta, H. (2013). Practical Data Analysis. 1st Edition. Birmingham, UK: Packt Publishing
Ltd. Dale, B.G., Van der Wiele, T. and Van Lwaarden, J. (2013). Managing Quality. 5th Edition
Revised. UK: John Wiley & Sons. Dane, F.C. (2011). Evaluating Research: Methodology for People Who Need to Read
Research. London: Sage Publications Inc. Delsen, L., Bauer, F., Cette, G. and Smith, M. (2009). Competitive Analyses of Operating
Hours and Working Times in the European Union. Netherlands: Springer Science and Business Media.
Delsen, L., Bosworth, D., Grob, H. and de Bustillo y Llorente, R.M. (2012). Operating
Hours and Working Times: A Survey of Capacity Utilisation and Employment in the European Union. Nederland: Springer Science & Business Media.
Denscombe, M. (2012). Ground Rules for Social Research: Guidelines for Good Practice. 2nd
Edition. England: Open University Press, McGraw-Hill Education. Dillman, D. A., Smyth, J. D. and Christian, L. M. (2009). Internet, mail, and mixed-mode
surveys: the tailored design method. 3rd Edition. Hoboken, N.J.: Wiley & Sons. Durvasula, S., Lysonski, S., Mehta, S.C. and Tang, B.P. (2004). Forging relationships with
services: the antecedents that have an impact on behavioural outcomes in the life insurance industry. Journal of Financial Services Marketing, 8(4), pp. 314-26.
Easterby-Smith, M., Thorpe, R., and Lowe, A. (2002) Management Research: an
introduction. London: Sage.

Kuwait Chapter of Arabian Journal of Business and Management Review Vol. 5, No.12, August 2016
55
Engel, J. F., Blackwell, R. D. and Miniard, P. W., (2001). Consumer Behaviour. 9th Edition. Harcourt College Publishers.
Engel, R.J. and Schutt, R.K. (2013). Fundamentals of Social Work Research. 2nd Edition.
UK: Sage Publications. Erasmus, D.N. (2008). An Analysis of Judicial Review of the Commissioner’s Discretionary
Powers Invoked In Terms of Sections 74A and 74B of the Income Tax Act 58 of 1962 In Light of the Constitution of the Republic of South Africa, 1996. Unpublished D.Ph. dissertation. University of KwaZulu-Natal.
Fluid Surveys University (2013). Avoiding Survey Bias. [Online]. Available from:
http://fluidsurveys.com/university/avoiding-survey-bias/ [Accessed 31 March 2015] Fullerton, G. (2005). The Service Quality-loyalty Relationship in Retail Services: Does
Commitment Matter? Journal of Retailing and Consumer Services, 12, p.99-111. Furnée, J., H. and Lesger, C. (2014). The Landscape of Consumption: Shopping Streets and
Cultures in Western Europe. 1st Edition. UK: Palgrave Macmillan. Ganesan, S. and Paul, J. (2005). Business Management: Practices, Policies and Principles.
New Delhi: Allied Publishers. Gilbert, J. (2012). Ethics for Managers: Philosophical Foundations & Business Realities. 1st
Edition. UK: Roultledge. Gitman, L.J. (2008). The Future of Business: The Essentials. 4 Editions: Cengage Learning. Goertz, G. and Mahoney, J. (2012). A Tale of Two Cultures: Qualitative and Quantitative
Research in the Social Science. 1st Edition. Princeton University Press. Goertz, G. and Mahoney, J. (2012). A Tale of Two Cultures: Qualitative and Quantitative
Research in Social Sciences. New Jersey: Princeton University Press. Gounaris S., Dimitriadis S. and Stathakopoulos, V. (2010). An Examination of the Effects of
Service Quality and Satisfaction on Customers’ Behavioural Intentions in E-Shopping. Journal of Service Marketing. 24(2), p.142-156.
Gray, D.E. (2009). Doing Research in the Real World. 2nd Edition. London: Sage Publications Ltd.
Gray, D.E. (2014). Doing Research in the Real World. 3rd Edition. London: Sage
Publication. Grigoroudis, E. and Siskos, Y. (2009). Customer Satisfaction Evaluation: Methods for
Measuring and Implementing Service Quality. Illustrated Edition. New York: Springer Science & Business Media.
Grinnell, R.M. and Unrau, Y.A. (2010). Social Work Research and Evaluation: Foundations
of Evidence-Based Practice. 9th Edition. USA: Oxford University Press.
Kuwait Chapter of Arabian Journal of Business and Management Review Vol. 5, No.12, August 2016
56
Hammersley, M. (2013). What is Qualitative Research? 1st Edition. Bloomsbury Publishing
Plc. Hansemark, O.C. and Albinsson, M. (2004). "Customer satisfaction and retention: the
experiences of individual employees", Managing Service Quality: An International Journal, 14(1), p.40 – 57.
Harrison, T. and Estelami, H. (2014). The Routledge Companion to Financial Services
Marketing: Routledge Companions in Business, Management and Accounting. 1st Edition. New York: Routledge.
Henn, M. Weinstein, M. and Foard, N. (2009). A Critical Introduction to Social Research.
2nd Edition. London: Sage Publication. Hernon, P. and Altman, E. (2012). Assessing Service Quality: Satisfying the Expectations of
Library Customers. 2nd Edition. USA: American Library Association. Hesse-Biber, S. N. and Leavy, P. (2011). The Practice of Qualitative Research. 2nd Edition.
London: Sage Publications Ltd. Hoffman, K. and Bateson, J.E.G. (2010). Services Marketing: Concepts, Strategies, & Cases.
4th Edition. Cengage Learning. Holloway, I. and Brown, L. (2012). Essentials of a Qualitative Doctorate. USA: Left Coast
Press, Inc. Hyken, S. (2013). Amaze Every Customer Every Time. Austin, Texas: Greenleaf Book
Group Press. Indiana University North West. S371 Social Work Research: What is Quantitative Research?
[Online].Available from: http://libguides.iun.edu/c.php?g=204379&p=1349037 [Accessed 25 March 2015] Jain, Sanjay K. and Gupta, Garima, (2004) measuring service quality: ServQual Vs Serperf
scales the journal for decision makers; 29 (2), 25-37. Jha, A.S. (2014). Social Research Methods. India: McGraw-Hill Education Pvt. Ltd. Jones, M. A., Reynolds, K. E., and Arnold, M. J. (2006). Hedonic and utilitarian shopping
value: Investigating differential effects on retail outcomes. Journal of Business Research, 59(9), p.974-981.
Kapferer, J.N. (2012). The Strategic Brand Management: Advanced Insights and Strategic
Thinking. 5th Edition. UK: CPI Group Ltd. Kaveh, M. (2011). Role of trust in explaining repurchase intentions. African Journal of
Business Management, 6 (14), p.5014-5025.

Kuwait Chapter of Arabian Journal of Business and Management Review Vol. 5, No.12, August 2016
57
Kazmi, S.H.H. (2007). Marketing Management Text and Cases. 1st Edition. New Delhi: Excel Books.
Kazmi, S.H.H. and Batra, S.K. (2012). Advertising and Sales Promotion. 3rd Edition. New
Delhi: Excel Books. Kelly, D. 2009. Methods for Evaluating Interactive Information Retrieval Systems with
Users. 3rd Edition. Hanover, USA: Publishers Inc. Khan. J.A. (2008). Research Methodology. APH Publishing Corporation. Klenke, K. (2008). Qualitative Research in the Study of Leadership. 1st Edition. UK:
Emerald Group Publishing Kotler, P. (2000). Marketing Management. Millennium Edition. New Jersey: Pearson
Prentice Hall. Kotler, P. and Keller, K.L. (2006). A Framework of Marketing Management. 3rd Edition,
New Jersey: Pearson Prentice Hall. Kotler, P. and Keller, K.L. (2011). Marketing Management, 14th Edition. New Jersey:
Pearson Education Inc. Kumar, P. (2002). The impact of performance, cost, and competitive considerations on the
relationship between satisfaction and repurchase intent in business markets. Journal of Service Research, 5(1), p. 55-68.
Kumar, C.R. (2010). Research Methodology. New Delhi: APH Publishing Corporation. Kumar, M., Kee, F. T. & Manshor, A. T. (2009). Determining the relative importance of
critical factors in delivering service quality of banks; an application of dominance analysis in SERVQUAL model, Managing Service Quality, 19(2), 211- 228.
Kuo. YF (2003) A study on service quality of virtual community websites, Total Quality
Management & Business Excellence, 13 (4), 461-473. Laroche. M., Kalamas. M., Cheikhrouhou. S., Cezard A., (2004) Canadian Journal Of
Administrative Sciences-Revue Canadienne Des Sciences De L’Administration , 21(4), 361-375.
Langen, N. (2013). Ethics in Consumer Choice: An Empirical Analysis based on the Example
of Coffee. Germany: Springer-Gabler. Lantos, G.P. (2011). Behaviour In Action: Real-life Applications for Marketing Managers.
New York: Sharpe Inc. Lucienne T.M. Blessing and Chakrabart, A. (2009). DRM, A Design Research Methodology.
1st Edition. Springer. Lund Research Ltd (2012). Principles of Research Ethics [online]. Available from:
http://dissertation.laerd.com/principles-of-research-ethics.php

Kuwait Chapter of Arabian Journal of Business and Management Review Vol. 5, No.12, August 2016
58
[Accessed 12 April 2015] Masterman, G. and Wood, E.H. (2006). Innovative Marketing Communications: Strategies
for the Events Industry. 1st Edition. UK: Elsevier Butterworth-Heinemann. Mann, R. and Roberts, R. (2011). Smith and Robertson’s Business Law. 15th Edition. USA:
Cengage Learning. Mc Alexander, J.H., Kalenburg, D.O. and Koening, H.F. (2004). Service Quality
Management. Marketing Health Services, 14, p.34-40. Merriam, S.B. (2014). Qualitative Research: A Guide to Design and Implementation. 2nd
Edition. San Francisco: Jossey-Bass. Midgley, W., Tyler, M.A., Danaher, P.A. and Mander, A. (2012). Beyond Binaries in
Education Research. New York: Routledge. Miller, P.G., Strang, J and Miller, P.M. (2010). Addiction Research Methods: Addiction
Press. 1st Edition. UK: John Wiley & Sons. Milakovich, M. (2005). Improving Service Quality in the Global Economy: Achieving High
Performance in Public and Private Sectors. 2nd Edition. USA: CRC Press. Mitchell, M and Jolley, J. (2010). Research Design Explained. 7th Edition. Wadsworth:
Cengage Learning. Moment, R. (2008). Invisible Profits. The Power of Exceptional Customer Service.
Christian Books. Monette, D.R., Sullivan, J.T., DeJong, C.R. and Hilton, P.T. (2013). Applied Social
Research: A Tool for the Human Services. 9th Edition. USA: Cengage Learning. Monette, D.R., Sullivan, T.J. and DeJong. C.R. (2014). Applied Social Research: A Tale for
the Human Services. 9th Edition. Belmont, USA: Cengage Learning. Morgan, N. A., and Lopo, L.R. (2006). The Value of Different Customer Satisfaction and
Loyalty Metrics in Predicting Business Performance. Marketing Science, 25(5), (September/October), p. 426-439.
Morgan, R.L. (2009). Calming upset customers: Stay in control in any situation. 4th Edition.
San Jose: Axzo Press. Muijs, D. (2011). Doing Quantitative Research in Education with SPSS. 2nd Edition.
London: Sage Publications. Neelankavil, J.P. (2007). International Business Research. New York: M.E. Sharpe. Nestor, P.G. and Schutt, R.K. (2014). Research Methods in Psychology: Investigating
Human Behavior. 2nd Edition. London: Sage Publications.

Kuwait Chapter of Arabian Journal of Business and Management Review Vol. 5, No.12, August 2016
59
Nolte, W. (2008). Did I Ever Tell You about the Whale? USA: IAP Information Age
Publishing Inc. O’Leary, Z. (2013). The Essential Guide to Doing Your Research Project. 2nd Edition.
London: Sage Publications. Osborne, J.W. (2008). Best Practices in Quantitative Methods. Illustrated Edition. UK: Sage
Publications. Parasuraman, A., Zeithaml, V. A., & Berry, L. L. (1988). SERVQUAL: A multiple-item
scale for measuring consumer perceptions of service quality, Journal of Retailing, 64 (1), p.12-40.
Perri, 6.and Bellamy, C. (2012). Principles of Methodology: Research Design in Social
Science. 1st Edition. London: Sage Publications. Petouhoff, N.L. (2009). Social CEM: Moving Beyond Customer Loyalty to Customer
Advocacy and Customer Experience Part 3. [Online] November 24th 2013. Available from: drnatalienews.com. http://www.drnatalienews.com/blog/social-cem-moving-beyond-customer-loyalty-to-customer-advocacy-and-customer-experience-part-3. [Accessed: 27 January 2015].
Porter, M. E. (2011). the Competitive Advantage of Nations: Creating and Sustaining
Superior Performance. New York: Simon and Schuster. Pradhan, S. (2009). Retailing Management: Text and Cases. 3rd Edition. Delhi: Tata
McGraw-Hill Education. Pride, W.M. and Ferrell, O.C. (2012). Marketing, 17th Edition. USA: Cengage Learning. Qian, H. (2009). On Data-driven Chi Square Statistics. USA: ProQuest Rai, A.K. (2012). Customer Relationship Management: Concepts and Cases. 2nd Edition.
Delhi: PHI Learning Pvt. Ltd. Remenyl, D. (2013). Field Methods for Academic Research: Interviews, Focus Groups and
Questionnaires in Business and Management Studies. 3rd Edition. UK: Ridgeway Press.
Rigby, D. K., Reichheld, F. F., and Schefter, P. (2002). Avoid the four perils of CRM.
Harvard Business Review, 81(1), p. 5–11. Rogelberg, S.G. (2006). Encyclopaedia of Industrial and Organizational Psychology. 2nd
Edition. UK: SAGE Publications. Rossouw, D. (2006). Business Ethics. 3rd Edition. Oxford UP. Rossouw, D. and Van Vuuren, L. (2004). Business Ethics. 4rd Edition. Cape Town: Oxford
University Press.

Kuwait Chapter of Arabian Journal of Business and Management Review Vol. 5, No.12, August 2016
60
Salkind, N., J. (2010). Encyclopaedia of Research Design. UK: Sage Publications, Inc. Schieffer, R. (2005). Ten Key Customer Insights: Unlocking the Mind of the Market.
Illustrated Edition. USA: Thomson. Schiffman, L. G., O’Cass, A., Paladino, A. and Carlson, J. (2013.). Consumer Behaviour. 6th
Edition. Australia: Pearson Higher Education AU. Schiffman, L.G. and Kanuk, L.L. (2004). Consumer Behaviour, 8th Edition. India: Prentice
Hall. Schmee, J and Oppenlander, J.E. (2010). JMP Means Business: Statistical Models for
Management. North Carolina, USA: SAS Institute. Seligman, J. (2012). Customer Experience in Modern Marketing. 1st Editions. England:
Lulu.com. Shaw, C. (2005). Revolutionize Your Customer Experience. 1st Edition. New York: Palgrave
Macmillan. Shi, G., Shi, Y.K., Chan, A. and Wang, Y. (2009). Relationship strength in service industries.
International Journal of Marketing Research. 51 (5), p.659-685. Singh, R. and Khan, I.A. (2012). An approach to increase customer retention and loyalty in
B2C world. International Journal of Scientific Research Publications 2(6), p.1-5. Singh, Y.K. and Nath, R. (2007). Research Methodology. New Delhi: APH Publishing. Sumarjan, N., Zahari, M.S.M., Radzi, S.M., Mohi, Z., Hanafiah, M.H.H., Bakhtiar, M.F.S.,
Zainal, A. (2014). Hospitality and Tourism: Synergizing Creativity and Innovation in Research. US: CRC Press.
Tarnay, K. (2013). Research and Development in E-Business through Service-Oriented Solutions. Hungary: IGI Global.
Terre Blanche, M., Durrheim, K. and Painter, D. (2007). Research in Practice: Applied
Methods for the Social Science. 2nd Edition. South Africa: University of Cape Town Press, Ltd.
Thompson, H. (2014). Who Stole My Customer? Winning Strategies for Creating and
Sustaining Customer Loyalty. 2nd Edition. New Jersey: Pearson Education Inc. Tyson, E. and Schell, J. (2012). Small Business for Dummies. 4th Edition. New Jersey: John
Wiley & Sons. Ulaga, W. and Eggert, A. (2006). Value-Based Differentiation in Business Relationships:
Gaining and Sustaining Key Supplier Status. Journal of Marketing, 70, 119-136. Van Heerden, C.H. and Drotsky, A. (2011). Personal Selling. 2nd Edition. Cape Town: Juta
& Company Ltd.

Kuwait Chapter of Arabian Journal of Business and Management Review Vol. 5, No.12, August 2016
61
Van Vuuren, T., Roberts-Lombard, M. and van Tonder, E. (2012). Customer satisfaction,
trust and commitment as predictors of consumer loyalty within the optometric practice environment. Southern African Business Review. 16 (3), 81-96.
Varela-Neira, C., Vazquez-Casiellesa, R. and Iglesias, V. (2010). Explaining Customer
Satisfaction with Complaint Handling. International Journal of Bank Marketing, 28(2), p. 88-112.
Vesel, P. and Zabkar, V. (2009). Managing customer loyalty through the mediating role of
satisfaction in the DIY retail royalty programme. Journal of Retailing and Customer Services. 16 (1), p.396-406.
Wagner-Tsukamot, S and Tadajewsla, M. (2006). Cognitive anthropology and the problem
solving behaviour of green consumers. The Journal of Consumer Behaviour 175(1), 235-244. Wegner, T. (2010). Applied Business Statistics: Methods and Excel-Based Applications. 2nd
Edition. Cape Town: Juta and Company. Weisberg, H.I. (2010). Bias and Causation: Models and Judgment for Valid Comparisons.
1st Edition. New Jersey: Wiley & Sons Inc. Weiss, A. (2012). Million Dollar Referrals: The Secret to Building a Perpetual Client List to
Generate a Seven-Figure Income. USA: McGraw-Hill. Weitz, B. and Wensley, R. (2002). Handbook of Marketing. London: Sage Publications. Whittaker, A. (2012). Research Skills for Social Work. 2nd Edition. Sage Publications Inc. Wikipedia. Service Quality. [Online]. Available from:
https://en.wikipedia.org/wiki/Service_quality. [Accessed: 04 February 2015]. Wilson, J. (2014). Essentials of Business Research: A Guide to Doing Your Research Project.
2nd Edition. Sage Publications Inc. Wilson, A., Zeithaml V.A., Bitner, M.J. and Gremler, D.D. (2008). ‘Services Marketing:
Integrating customer Focus Across the firm’, 1St European Edition. Berkshire (UK): McGraw-Hill Education.
Wolfson, A., Mark, S., Martin, P., M. and Tavor, D. (2014). Sustainability through Service
Perspectives, Concepts and Examples. New York: Springer. Wrigley, N. (2015). Store Choice, Store Locations and Market Analysis. 1st edition. New
York: Routledge. Wu, H. (2013). International Conference on Complex Science Management and Education
Science. USA: DEStech Publications, Inc.

Kuwait Chapter of Arabian Journal of Business and Management Review Vol. 5, No.12, August 2016
62
Wynn, D.J., and Williams, C.K. (2012). "Principles for Conducting Critical Realist Case Study Research in Information Systems," MIS Quarterly (36:3), pp. 787-810.
Yang, Z. and Peterson, R.T. (2004). Consumer perceived value, satisfaction and loyalty: The role of switching costs. Psychology and Marketing, 21 (10), p.799- 822.
Yang, Q. and Webb, G. (2008). PRICAI 2006: Trends in Artificial Intelligence: 9th Pacific
Rim International Conference on Artificial Intelligence, Guilin, China, August 7-11, 2006, Proceedings, 4099, p.769.
Yin, R.K. (2011). Qualitative Research from Start to Finish. New York: The Guilford Press. Young, L. and Burgess, B. (2010). Marketing Technology as a Service: Proven Techniques
that Create Value. 1st Edition. New Jersey: John Wiley & Sons. Zeithaml, V.A. and Bitner, M.J. (2006). Services Marketing. 4th Edition. Maidenhead:
McGraw-Hill. Zeithaml V. A., Bitner M. J., Gremler D. D. (2006) Services marketing, 4th edition, McGraw-
Hill. Zeithaml, V.A., Bitner, M.O., and Gremler, D.E. (2009). Services Marketing: Integrating
Customer Focus across the Firm. New York: McGraw-Hill/Irwin. Zeithaml, V. A., Parasuraman, A. and Berry, L.L. (1990). Delivering Quality Service:
Balancing Customer Perceptions and Expectations. New York: Simon and Schuster Inc.


![[plan politika] Youth movement nowadays](https://img.dokumen.tips/doc/110x75/54628c5faf7959b92a8b6efc/plan-politika-youth-movement-nowadays.jpg)