Embed Size (px)
Citation preview

International Journal of Science Commerce and Humanities Volume No 3 No 1 January 2015
52
Examining Student Spatial thinking in preparation for the integration of GIS
in the Egyptian geographical Primary Curriculum.
Yaser Abdel AzimSamak1
Assiut University, Assiut, Egypt
Abstract
Spatial abilities studies tackled the topic from different aspects and pivots. Our study concentrated on primary
education students so as to develop geographical curricula to cope with their potential abilities especially this
generation that is distinguished with technological abilities that were not available before such as maps
development, students eagerness to navigate through Google earth maps and games that are more complicated
than GIS programs, thus the researcher designed a scale of spatial abilities consistent with the mental age of
students and the development of Mathematics curriculum that is promoting spatial abilities to make a good use
of students' abilities and the curricula development in order to develop Egyptian primary geography curriculum
in addition to promoting GIS that are promoting spatial awareness via developing Teachers abilities, then their
method of teaching via GIS in school activities. In a correlational study, 311 participants were tested and they
were randomly selected from primary stage. The study approved the validity of the scale and its reliability to be
applied according to the purpose of design. The study approved the existence of significant differences between
males and females, and primary students and preparatory students and students' abilities to deal with the
components and items of GIS representing in GPS mobility. The study revealed students' cartographical
abilities and survey abilities on sketch map after evaluating the drawing according to Kevin Lynch's method.
The results indicate that there are many indexes encouraging students' spatial thinking and promoting the
spatial awareness
Keywords: GIS, spatial abilities, curriculum, GIS Applications, Egyptian Primary Curriculum
Introduction
Learning to think spatially is a key educational goal as the Egyptian society faced many struggles leading to
increasing the need to improve education; it becomes a must to put standard levels in which the various
components of the educational system will be evaluated and developed, including the curriculum, and standard
based reform becomes the motive for many educational institutions that are affirming the necessity of
developing education and promoting students' performance.
Consequently, the movements of educational standards spread in the last decade (Saleh, 2011). Supporting
spatial thinking in curricula requires preparing young children of kg-12 so as to get rid of technological literacy
so as to make a good use of technologies such as geographic information system (GIS) for supporting spatial
thinking of the graduates in the light of market requirements. The U.S. National Research Council 2
recommended evaluating empirical and theoretical curricula in psychology and education that supports the use
of GIS as new necessary tools for education leading to many inquiries about how to support spatial thinking
1Corresponding author: Dr. Yaser Abdel Azim Samak; Faculty of Arts, Department of Geography, Assiut University, Old University Building, M.B,
71515, Assiut, Egypt prof.dr.yasersamak[at]gmail.com. Mobile No +201024578401
2- http://www.nationalacademies.org/nrc/index.html

International Journal of Science Commerce and Humanities Volume No 3 No 1 January 2015
53
abilities via education and training. How mightcurrent versions of GIS be incorporated into existing standards-
based instruction in all knowledge domains across the school curriculum? How can cognitive developmental
and educational theory be used to develop new versions of GIS that are age appropriate in their design and to
implement new GIS curricula that are age appropriate in their scope and sequence? And all these inquiries are
considered in the long-term objectives of the current study. Spatial ability is the ability tounderstand and
remember the spatial relationships among objects, manipulate images in space, and visualize how separate parts
of complex physical systems interrelate. This ability can be viewed as a unique type of
intelligencedistinguishable from other forms of intelligence, such as verbal ability, reasoning ability, and
memory skills3. Visual-spatial skills are of great importance for success in solving many tasks in everyday life.
For instance, using a map to guide you through an unfamiliar city4.
The idea for this research arose from the lack of students joining the departments of geography in
academic education in comparison with other departments although geography department contributed to the
development of the graduates represented in providing them with vital majors such as: GIS, and Survey and
maps, consequently, the researcher tried to investigate the reasons for the inadequacy and unattractiveness of
the geography department to many students via examining the basics of teaching geography in the main
education stage. The public education system in Egypt consists of three levels: the basic education stage for 4–
14 years old: kindergarten for two years followed by primary school for six teaching and preparatory school for
three years. Then, the secondary school stage is for three years,for ages 15 to 17, followed by the tertiary level.
Education is made compulsory for 9 academic years between the ages of 6 and 14, so as to evaluatestudents'
capabilities and their spatial thinking to revealcurriculum needs to cope with current abilities of students, as this
generation is distinguished by its abilities of dealing with computers, and GIS software compatible with
students age during primary stage such as Gateway into Bali, KanGIS and NYGPS..5 The primary advantage of
introducing GIS in school education is seen as: '... to provide a continuity of education in GIS and to equip the
next generation with the tools to make use of spatial data' (Warr, 1996).
The GIS in the two phases of primary and secondary education in Egypt is not the issue of time, not least
because the recent amendment in the scientific content of the curriculum at the secondary level did not receive
the desired GIS attention, as is the case in developed countries such as Finland, which GIS in education is
currently a topical issue. GIS was mentioned for the first time in 1991 but without any major effects on
educational practice. The educational use of
GIS in secondary schools has been widely promoted in the United States of America but according to Joseph
Kerski (Kerski, 2001). Since so the activation of GIS applications must be preceded by the assurance of the
primary students' acquisition basic spatial abilities. As a result of students efficiency increases in spatial
abilities skills, the researcher was obliged to design a spatial abilities' scale that is compatible with students age
at the main education stage afterwards he designed a scale to measure students' abilities concerning survey and
their usage of GIS tools, and finally a scale for measuring the basic elements of map composition. The great
advancement induced by Mathematics curriculum for the grades (4-6) at primary stage motivated the researcher
to change the curriculum of Geography of social studies course for the grades (4-6) at primary stage, as the
study of 6th grade students of the scale in Mathematics enabled the students to easily differentiate between
large-scale maps and small-scale maps(Government of Ireland, 1999). In the early years, children have the
3- http://web.jhu.edu/cty/STBguide.pdf 4-http://cty.jhu.edu/talent/testing/about/stb.html 5- For details go to : http://www.gislounge.com/k-12-education-in-gis/

International Journal of Science Commerce and Humanities Volume No 3 No 1 January 2015
54
opportunity to explore scale drawings, models and maps and relate them to measurements of real objects, by
engaging in activities such as: modeling a scale drawing of any room at home or classroom. The influence of
mathematics is as follows:
1. Enabling the child to think and communicate quantitatively and spatially.
2. Solving problems, recognizing situations where mathematics can be applied.
3. Using appropriate technology to support applications.
4. Exploring spatial awareness and its application in real-life situations.
5. Developing a sense of spatial awareness.
(The State of Michigan, Department of Education,1998).
Students have the ability to work out problems concerning distance calculating between two zones if they know
the actual distance between them and vice versa via determining map drawing scale of the two known zones as
a result of their study of mathematics elementary activities enlisted in the courses of measurement and geometry
and two or three dimensions of visual patterns as of grade2 as one of the most important pillars of spatial ability
variables. Evident improvement in the level of spatial perception with exposure of students to a number of
educational activities such as reading a map and default visits, makes a certain amount of environmental
expertise and a clear improvement in the level of spatial cognition of geographical features (Abel Baset, H. A.
M., 2008). Mathematics education enables the child to think and communicate quantitatively and spatially.
(Government of Ireland, 1999).
In grades K-4, the U.S.National Council of Teachers of Mathematics (NCTM) recommended changes to
the content and emphasis of the mathematics being taught, developing spatial sense, concepts related to
measurement, and estimation of measure affirmed the spatial sense as a result of the development of
mathematics focusing on forming samples and relations instead of being previously a group of facts and
procedures (Abed, 1996). In the light of all that is mentioned above, arises the following question arises: why
does not the geographical curriculum conform with what was achieved by the mathematics curriculum by
getting the benefit from mathematics via making geography the application field of advanced mathematics?
Background literature:
Various studies tackled the topic of spatial abilities from different attitudes such as military, engineering,
physical education and geography. In the light of the current study, Visual-spatial skills are of great importance
for success in solving many tasks in everyday life. Educational studies evaluated the first and second part of
primary education such as Allam (1993) about the social studies curricula in primary stage in the light of social
skills, and it aimed at determining the objectives and skills that must be available for primary stage students in
the light of the objectives and content of the curriculum, and revealed the skills lacked in the content. A study of
Kamel (2003) revealing the required map skills and the effectiveness of a suggested program to develop spatial
ability of Grade 8 students.
A study Maqlad ( 2011) on the effectiveness of using multi-media mental maps in teaching social
studies on cognitive attainment and promoting deductive thinking of preparatory stage students recommended
the necessity of supporting class education with multimedia presentations. One of the most important studies
which emphasizes importance of geographic information systems in the curriculum study Yahia, It was about
the advanced trends of promoting geography teaching as pointed out that GIS provides students with many
skills and applied and practical advantages as being computer technology motivating geography in general. GIS
is promoted as an educational tool to encourage positive learning of data exploration, critical thinking, literacy,
computer skills, and spatial awareness (Faison 1996; Audet and Paris1997; ESRI 1998; ESRI 2006). GIS has

International Journal of Science Commerce and Humanities Volume No 3 No 1 January 2015
55
shown promise in Project-Based Learning (PBL) environments, but many obstacles exist in its integration into
school curriculums (Henry, P., &Semple, H., 2012). Hagevik (2003) concluded that learning with GIS
developed students‘ spatial-visual thinking skills.
Many studies have investigated thestandard and gradual content of GIS that must be included in the curricula. .
In addition to many studies tackling spatial abilities such as Roosenboom (2011) in his thesis about spatial
awareness of Dutch children aged 8-11. Other studies tackled sex differences concerning small-scale spatial
abilities (e.g., mental rotation) reflecting differences in large scale navigation abilities between males and
females. Another Study of Goede (2009), concerning gender differences in spatial cognition and the Study of
Neilson (2004) on sex differences in spatial cognitive: an evolutionary approach. . Various educational studies
dealing with spatial abilities affirming the distinguish between these abilities using agents and motivations such
as wall maps or navigating digital maps but most of the studies depended on paper and pen such as Montello, D.
R. et al.1999, Hegarty, M. et al. 2006, Lohman, D. F. 1988. Other theories (Jones, Braithwaite, & Healy, 2003)
suggest that differences in sex spatial abilities, whether the large or small scale reflects the same abilities and
causally significant.
Objectives of the study:
1. Describe Students' spatial abilities in the primary stage from 9 to 12 years old.
2. Test differences between males and females in spatial abilities.
3. Explore howvariance of age and grade impact on spatial abilities.
4. Examine students' response concerning items related to spatial geography and GIS.
5. Describe students' abilities concerning survey and Cartography.
Key questions for of the study (The researcher suggests the following assumptions):
1. Are there any differences between males and females in spatial abilities?
2. Are there any differences in ages (9-12) in spatial abilities?
3. Are there any differences in grades in spatial abilities?
4. Are there any differences among students according to age and gender concerning survey and
cartography skills?
5. Does GIS learning amend spatial thinking skills?
6. Which location and GIS applications' appeal to primary stage students?
Methods
Spatial abilities test.
Spatial thinking has a nebulous identity in the geography education literature as various terms, such as
thinking spatially, geospatial thinking, spatial intelligence, or spatial ability, are used synonymously (Huynh, N.
& Sharpe, B. 2012). Spatial ability is measured by 13 different tests with focus on visualization, orientation, and
perception (Huynh, N. 2009). Psychometric tests have been used extensively to assess spatial abilities,

International Journal of Science Commerce and Humanities Volume No 3 No 1 January 2015
56
especially spatial visualization and spatial orientation (Kail et al. 1979; McGlone, 1981; Miller &Santoni, 1986;
Goldstein et al. 1990; Newcombe&Dubas, 1992). Spacial' in the psychometric tests, however, refers to small-
scale (table-top) space, which is not the scale most pertinent togeography (Lee and Bednarz 2009).
The researcher designed a spatial ability scale among primary stage students in the light of scientific
criteria in educational aspects so as to get a response of many categories that cannot be measured by
questionnaires as in academic studies with othercategories. One of these criteria that the researcher put into his
consideration is the notes of geography curriculum and the development of mental and skillful abilities for this
stage so as to cope with the abilities of this generation, thus the objective of the spatial abilities scale is to
recognize students' spatial abilities during primary stage and their advanced geographical skills, and the scale
can be used for evaluation and educational orientation, and as a test for scientific hypotheses of the study, and
affirming its efficiency in measuring student's spatial abilities, and extracting its results to deepen the geospatial
applications in Egyptian primary stage.
Scale Validity
Validity concept is linked to its validity to be used, as a valid test is the test that can be used in the light
of the objectives for which it was designed (Abed Elhady, 2001), Test validity depends on the function that can
be done by it or the category or the group supposed to be exposed to the test (Molhem, 2009).
First: Content Validity:
Many definitions of content validity have been published (Anastasi, 1988; Messick, 1993; Nunnally&
Bernstein, 1994; Suen, 1990; Walsh, 1995) Content validity is the degree to which elements of an assessment
instrument are relevant to and representative of the targeted construct for a particular assessment purpose
(Haynes, & et al. 1995). The scale was tested by experts in Psychology, geography, and geography teaching
methods and 90% of them agree that its items suit the content for which it is designed.
Second: Internal Consistency:
Coefficient was suggested by Cronbach (Meehl, &Cronbach, 1995) as one of the evidence that must be
selected to support the scales virtual formation (Allam, 2006). He calculated the coefficient between every
variable and its related dimension as the highest value among variables is visualizations (0.45-0.79), and it was
significant with a value of (0.01) while the highest value among variables of perception(0.23-0.81), and it was
significant with a value of (0.01), the higher and least values of the correlation coefficient of orientation (1 -
0.17), and it were significant with a value of (0.01) except the tenth question which was significant with a value
of (0.05). The higher value and the least value of the correlation coefficient between scale sub-dimensions, and
the total scale ranged between (0.99 - 0.29) and were significant with a value of (0.01) as indicated in Table 1.
Third: Validity of factor contracture: the researcher used factor analysis of spatial abilities variables to be
sure of the factors of scale as indicated in Table 2. As the value of first factor latent root is 1.64 and this
explains13.7% of the variance, namely the test measures only one value that is spatial ability, and the next four
factors are similar and near the test concerning variance; consequently, the test measures what was designed for.
Reliability:
Reliability coefficient was designed to offer quantity estimation of scale accuracy, thus it is used for one
of the following: first, it indicates the accuracy of the scale; the other use is to offer estimation for consistency
of the performance on the sample (Omar, 2010). While increasing the number of items in a scale can thus
improve the scale's reliability. Split – Half Reliability is used when the process of the retest greatly costs or may

International Journal of Science Commerce and Humanities Volume No 3 No 1 January 2015
57
lead to inaccurate results, thus correlation coefficient value was estimated between dimensions then being
corrected by using Spearman-Brown Coefficient with a value of (0.71) that is considered accepted value
affirming the validity of the scale to be applied, and the internal consistency coefficient using Cronbach's Alpha
with a value of (0.6) is considered a good value affirming the validity of the scale to be applied.
Mental map assignments:
The researcher applied another practical test on the participants as an annex for the last final test of
spatial ability and cognitive maps representing in two types of mental map assignments:
1. Surveying of an area and then drawing it by using a suitable drawing scale.
2. Using GIS as a separate apparatus of the type Garmin, and another one supported with mobile and
Google maps for showing the location of some land marks, route retracing and direct navigation.
3. The student draws his house in details using suitable drawing scale.
Participants:
Three hundred and eleven participants took part in the study, and they were randomly selected from
primary stage students at schools affiliated to Baqour educational Administration, Menofia Governorate; Arab
Republic of Egypt aged between 10-12 years old in grades (4-6), and a similar sample of inhabitants Egyptians
in Jeddah, KSA .Another sample of preparatory students aged from (13-15) as a comparative and control group
at the same time so as to examine the conformity of the scale with their age and educational stage and revealing
the differences between their response and the response of primary stage students. All students answered all
required questions, and none of them was excluded from the sample.
The study Area:
A residential area was selected for survey and cartography by the student that is the University
district, Jeddah Governorate, Makkah Zone, KSA.
Tools:
Spatial ability scales, measuring tapeline, GPS, GPS supported with mobile cell phone, paper maps
for study area, Laptop, Mobile phone Google maps, and the registration notebook. The period was from March
to mid of May2013.

International Journal of Science Commerce and Humanities Volume No 3 No 1 January 2015
58
Table No (1) Correlations between dimensions and variables of spatial abilities in the study and the total Scale
**. Correlation is significant at the 0.01 level (2-tailed).
*. Correlation is significant at the 0.05 level (2-tailed).
Q : 1 Q : 2 Q : 3 Visuali-
zation
Q : 1 Q : 2 Q : 3 Q : 4 Percepti
on
Q : 1 Q : 2 Q : 3 Q : 4 Q : 5 Orienta-
tion
Q : 1 1
Q : 2 .276*
*
1
Q : 3 .094 .134* 1
Visualiza
tion
.794*
*
.717*
*
.447*
*
1
Q : 1 .217*
*
.030 -.017 .145* 1
Q : 2 .261*
*
.115 .020 .227** .141* 1
Q : 3 .099 -.019 .015 .057 .005 .199** 1
Q : 4 .082 .056 -.017 .074 .202*
*
.222** .212** 1
Perceptio
n
.083 -.049 .103 .061 .180*
*
.134* .041 .174** 1
Q : 1 .234*
*
.068 -.008 .178** .597*
*
.484** .467** .807** .228** 1
Q : 2 .082 .152* -.029 .118 .089 .109 .224** .172** .016 .236*
*
1
Q : 3 .056 .055 -.010 .059 -.041 .270** .108 .216** .067 .208*
*
-.015 1
Q : 4 .194*
*
.227*
*
.014 .239** .157* .323** .285** .375** .016 .454*
*
.299** .205*
*
1
Q : 5 .114 .119 .023 .138* -.098 .159* .302** .009 .092 .085 .109 .109 .110 1
Orientati
on
.200*
*
.235*
*
.013 .247** .150* .337** .305** .381** .024 .463*
*
.340** .246*
*
.997*
*
.165* 1
Total .245*
*
.250*
*
.026 .287** .229*
*
.387** .349** .469** .057 .576*
*
.349** .257*
*
.986*
*
.168* .991**

International Journal of Science Commerce and Humanities Volume No 3 No 1 January 2015
59
Table No (2) Indicates construct Validity, factors, Latent root value, and the percentage of variance and
cumulative.
Cumulative % % of Variance Latent Root Value Factors
13.70 13.70 1.64 1
26.57 12.87 1.54 2
38.64 12.07 1.45 3
49.72 11.08 1.33 4
60.37 10.65 1.28 5
Figure: 1 Suggested surveying area which it will be cartographically drawn
Source: Goggle Maps

International Journal of Science Commerce and Humanities Volume No 3 No 1 January 2015
60
Procedures:
1. Students had been provided with scale instructions before answering the test in order to avoid being
affected by any other external factors that may affect scale reliability. Test period was 35 minutes.
Students' whole scores were calculated and the score of every question in accordance with his/her
age, gender and study grade, to be statistically analyzed via SPSS Program.
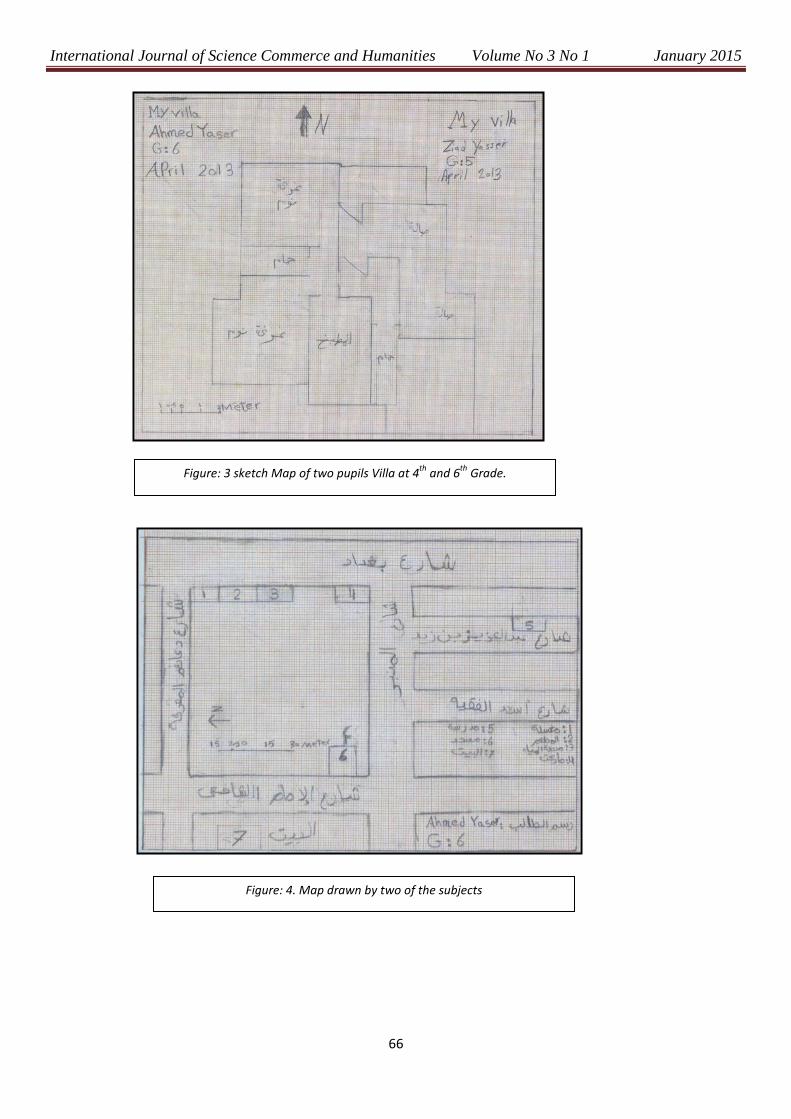
2. Students were asked to wander in a selected area that was previously selected as indicated in Fig. 1.
At Jeddah Governorate. This area is supposed to be drawn by students who walked for 600m as
indicated in Fig. 4. Pupils began their survey from ELImamELShafi Street at the point (A), turned
toward the southwest of the point (B), At ELManbar Street, they turned toward the southeast
reaching the beginning of Abdel Aziz IbnZayd then they turned toward the south west again and
returned from the same street to EL Manbar street again turning to the south east toward Baghdad
street then to the northeast till the point (G) then turned toward the northwest across Daaem EL
Marefa street at the point (H). The whole distance from the beginning to the end was 600m. Fig. 5:
A. B, C, and D Indicate students survey using foot space in surveying, transforming ground length to
scale length. Then registered in the notebook number of steps between a point and the following
point, measuring step distance, turning measurements between points into meters as a preparation for
cartography.
3. After two weeks of zone cartography, students were asked to determine eight landmarks on the
drawing:
1. Point of beginning
2. The mosque.
3. The School
4. The grocery shop
5. Water desalination station
6. Restaurant
7. Washing machine shop
8. Point of End
Name of streets must be written and accurately determined on the map the finish the rest of the
cartography and the final figure of the drawing as indicated in Fig.2.
9. Students made another survey after being divided into groups using the meter tape after reminding
them with what they had studied in mathematics so as to be applied on drawing scale and coordinate
graph as maps and drawing their house in details with suitable drawing scale, and the result was it
was shown in Fig. 3. by a student in the 6th primary grade.
10. The last field task for students was to use GPS to make direct navigation to reach specific targets
located on paper and digital maps by separate GPS, and Cell phone supported GPS to notice the
impact of using different means.
Discussion of hypotheses analysis and results:
1. Are there any differences between males and females concerning spatial abilities variables?
Self and Golledge (1994) ( Self, 1994; Golledge, 1994 ) suggested that every geography educator should be
aware that males and females may differ in their abilities to interpret or use spatial or geographic
information presented in different ways: by studying significant differences between males and females, the
study pointed out as indicated in Table. 3. The existence of significant differences (sig=0.003) as the
average of males was 36.2 while the females average was33.9, and this result consistent with other results
such as the study of (Abed, 1996) on the interaction between students educational performance in primary

International Journal of Science Commerce and Humanities Volume No 3 No 1 January 2015
61
stage, sex, and their attainment in mathematics using spatial abilities test. Males outscored females with an
average of 12.88 versus 10.57 for females. Montello (1999) affirmed that males‘ spatial abilities are superior
to those of females, and consequently, that certain job classifications and tasks (e.g., engendering, physical
science, and occupations involving navigation skills, such as pilots or delivery services). For the scale sub-
dimensions, there are no significant differences between males and females concerning the variables
"Visualization" and "Perception" as their average for perception was 6.03 versus 5.59 for females. For
visualization, the average was 2.91for males and 2.92 for females. There is a significant difference in favor
of males concerning with an average of 27.3 versus 25.4 for females.
Table 3.Significant differences between males and females through spatial abilities scale and its sub-
dimensions.
Dimension
male
(96=N)
female
(N= 204)
df t Sig
Mean Std.
Dev.
Mean Std.
Dev.
VISUALIZATION 2.91 0.327 2.92
0.32
298
-.384 .461
PERCEPTION 6.03 1.93 5.59 1.67 2.039
.979
ORIENTATION 27.28 8.83 25.43 10.42 1.504 .010
Total Degree 36.22 9.31 33.94 11.34 1.715 .003
Are there any Age differences concerning spatial abilities variables?
Spatial abilities with their sub-dimensions varied with age variance and there are significant differences
indicating this result and to be sure of this hypothesis, one-way ANOVA was used and Table. 3. Pointed out
the significance in the light of scale main dimensions concerning age impact. LSD Test was used to
recognize significant differences between age as Table. 4. Indicates averages and standard deviations of
spatial abilities per every age, and the analysis will be separated for every dimension:
First: for visualization significant differences were between 10 years old from one part and (12-13-15)
from the other part, and the results revealed via means that it were in favor of the ages (12-13-15) via their
means, and this result indicated the increase of spatial awareness with the increase of age, and also affirming
differences between 11 from one side and 13,15 from the other side. Many studies such as De Lisi. (De
Lisi& et al. 1995) confirm this result.By these results, we prove that there are significant differences among
different ages of primary stage students.

International Journal of Science Commerce and Humanities Volume No 3 No 1 January 2015
62
Table 4. Variance Analysis and average differences
Dimension The Source Sum of
Squares df Mean Square F Sig.
VISUALIZATIO
N
Between
Groups 2.068 6 .345
3.500
.002 Within Groups 28.849 293 .098
Total 30.917 299
PERCEPTION
Between
Groups 70.509 6 11.752
4.001
.001 Within Groups 860.621 293 2.937
Total 931.130 299
ORIENTATION
Between
Groups 5176.958 6 862.826
10.328
.000 Within Groups 24477.878 293 83.542
Total 29654.837 299
Total Degree
Between
Groups 6322.329 6 1053.721
10.893
.000 Within Groups 28342.001 293 96.730
Total 34664.330 299
Second: For "perception dimension" there are significant differences between 10 years old and (11-12)
years old in favor of the older group, but the younger groups in this dimension and"orientation" performed
better than the older one and there is no contradiction in this point as this can be attributed to the great link
between students' study in Mathematics curriculum and scale dimensions as the curriculum of mathematics
in primary stage included most of the items of the scale, thus the performance of primary students was
better than the preparatory stage students. The study revealed the increase of spatial awareness for older
groups in the primary stage than the younger groups in the same stage as it was clearly indicated in
perception dimension between 10 years old and (11-12) in favor of the older group, and (11-12) and (13)
years old in favor of the younger group, and this will be subsequently indicated in the educational stages
assumption.

International Journal of Science Commerce and Humanities Volume No 3 No 1 January 2015
63
Table 5. Sample means and standard deviations of spatial ability scale in the light of age.
Age
Dimension
9 10 11 12 13 14 15
Mean S.D Mean S.D Mean S.D Mean S.D Mean S.D Mean S.D Mean S.D
VISUALIZAT
ION
2.67 .577 2.80 .530 2.85 .402 2.95 .222 3.00 .000 3.00 .000 3.00 .000
PERCEPTIO
N
5.33 .577 5.22 2.10 6.41 1.77 6.03 1.98 5.10 1.61 5.33 1.16 5.56 1.09
ORIENTATI
ON
22.8 10.26 30.04 6.09 30.83 3.86 20.18 12.09 18.67 3.22 24.48 11.48 22.8 10.26
Total Degree 22.0 16.52 30.82 11.9 39.30 6.96 39.81 3.95 28.28 13.15 27.00 2.646 33.04 11.578
3. Are there any differences of grades concerning spatial abilities variables?
The researcher applied spatial abilities test on another sample of preparatory stage students so as to
reveal performance differences between them and the students of primary stage. Via T-test, there are
significant differences between students of primary stage and preparatory stage in favor of primary stage
students with an average of 36.9 versus an average of 30.1 for the preparatory stage students and this result
can be attributed to the fact that older children are better than younger in the same stage and this can be
affirmed through the means; also older children in preparatory stage are distinguished with higher means
than the younger in the same stage as it was indicated in the differences between 13 and (14-15).On the
other hand, there are significant differences between 13 and 15 years old in favor of 15 years-old students as
revealed by Table. 5. The reason for the increase of primary stage means in comparison with the preparatory
stage is that the researcher designed the questions consistent with what the students studied in mathematics
curriculum focusing on visualization and perceptions spatial and the questions were designed in a way to
distinguish them in intelligence, attainment, school experience, and males in the age of (9-10) superseded
females concerning intelligence (Oeida, 1996).
Table. 6. Indicating the results of LSD Test concerning differences among age averages of spatial ability
and its dimensions
Dimension Age 10 11 12 13 14 15
VISUALIZATION
9 -.137 -.178 -.282 -.333 -.333 -.333
10 -.041 -.145* -.196* -.196 -.196*
11 -.104 -.155* -.155 -.155*
12 -.051 -.051 -.051
13 .000 .000
14 .000
PERCEPTION
9 .118 -1.075 -.701 .233 .000 -.228
10 -1.193* -.818* .116 -.118 -.346
11 .375 1.308* 1.075 .847*
12 .934* .701 .472
13 -.233 -.462
14 -.228
9 -8.804 -16.042* -16.831* -6.175 -4.667 -10.479
10 -7.238* -8.027* 2.629 4.137 -1.676
11 -.788 9.867* 11.376* 5.563*
International Journal of Science Commerce and Humanities Volume No 3 No 1 January 2015
64
ORIENTATION 12 10.656* 12.164* 6.351*
13 1.508 -4.304*
14 -5.813
Total Degree
9 -8.824 -17.296* -17.814* -6.275 -5.000 -11.041
10 -8.472* -8.990* 2.549 3.824 -2.218
11 -.518 11.021* 12.296* 6.255*
12 11.539* 12.814* 6.772*
13 1.275 -4.766*
14 -6.041
**. Correlation is significant at the 0.01 level (2-tailed).
*. Correlation is significant at the 0.05 level (2-tailed).
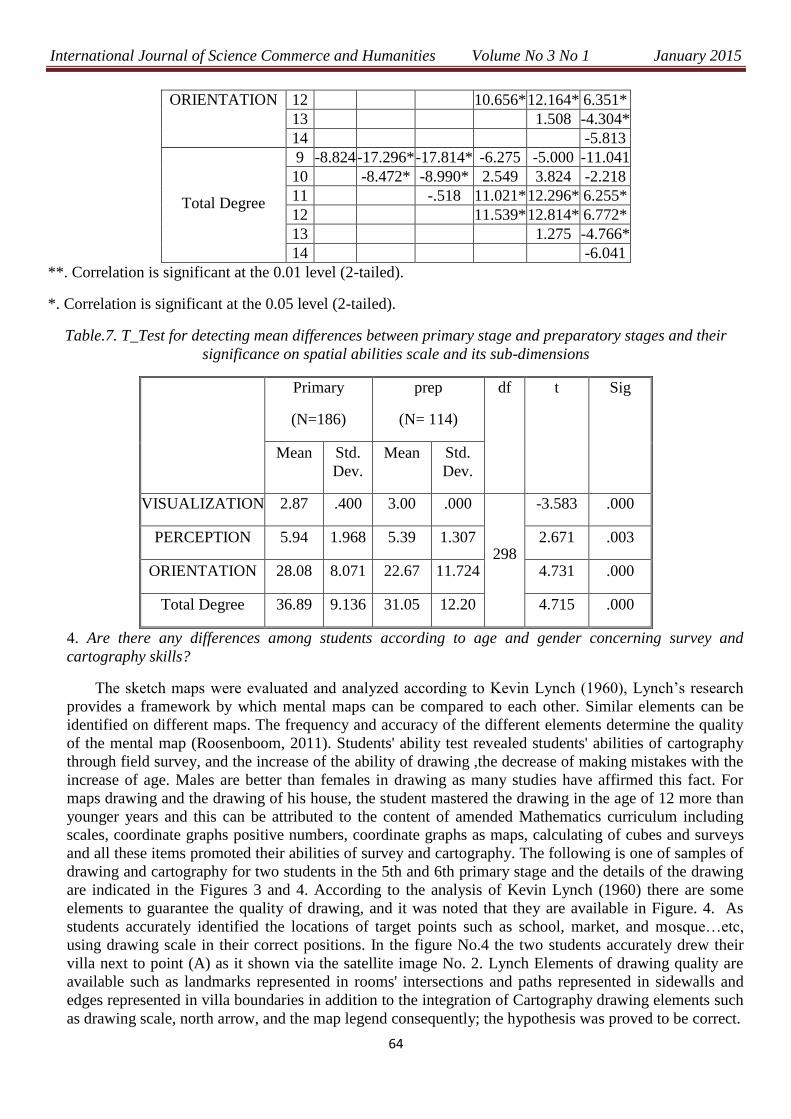
Table.7. T_Test for detecting mean differences between primary stage and preparatory stages and their
significance on spatial abilities scale and its sub-dimensions
Primary
(N=186)
prep
(N= 114)
df t Sig
Mean Std.
Dev.
Mean Std.
Dev.
VISUALIZATION 2.87 .400 3.00 .000
298
-3.583 .000
PERCEPTION 5.94 1.968 5.39 1.307 2.671 .003
ORIENTATION 28.08 8.071 22.67 11.724 4.731 .000
Total Degree 36.89 9.136 31.05 12.20 4.715 .000
4. Are there any differences among students according to age and gender concerning survey and
cartography skills?
The sketch maps were evaluated and analyzed according to Kevin Lynch (1960), Lynch‘s research
provides a framework by which mental maps can be compared to each other. Similar elements can be
identified on different maps. The frequency and accuracy of the different elements determine the quality
of the mental map (Roosenboom, 2011). Students' ability test revealed students' abilities of cartography
through field survey, and the increase of the ability of drawing ,the decrease of making mistakes with the
increase of age. Males are better than females in drawing as many studies have affirmed this fact. For
maps drawing and the drawing of his house, the student mastered the drawing in the age of 12 more than
younger years and this can be attributed to the content of amended Mathematics curriculum including
scales, coordinate graphs positive numbers, coordinate graphs as maps, calculating of cubes and surveys
and all these items promoted their abilities of survey and cartography. The following is one of samples of
drawing and cartography for two students in the 5th and 6th primary stage and the details of the drawing
are indicated in the Figures 3 and 4. According to the analysis of Kevin Lynch (1960) there are some
elements to guarantee the quality of drawing, and it was noted that they are available in Figure. 4. As
students accurately identified the locations of target points such as school, market, and mosque…etc,
using drawing scale in their correct positions. In the figure No.4 the two students accurately drew their
villa next to point (A) as it shown via the satellite image No. 2. Lynch Elements of drawing quality are
available such as landmarks represented in rooms' intersections and paths represented in sidewalls and
edges represented in villa boundaries in addition to the integration of Cartography drawing elements such
as drawing scale, north arrow, and the map legend consequently; the hypothesis was proved to be correct.

International Journal of Science Commerce and Humanities Volume No 3 No 1 January 2015
65
Table. 8. The amount of elements defined by Lynch and enlisted in the maps drawn by children.
What was counted Count Element
All the intersections 6 Nodes
All The Streets 6 Paths
Buildings 7 Edges
Labeled Items On The Map 7 Landmarks
(A) The beginning Point. (B) The Mosque (C) School. (D) Grocer's
shop. (E) Water Desalination Station. (F)Restaurant. (G) Washing
Machine (H) The End Point
Source: Goggle Erath
Figure: 2. A satellite image showing landmarks locations identified by subjects
International Journal of Science Commerce and Humanities Volume No 3 No 1 January 2015
66
Figure: 4. Map drawn by two of the subjects
Figure: 3 sketch Map of two pupils Villa at 4th
and 6th
Grade.

International Journal of Science Commerce and Humanities Volume No 3 No 1 January 2015
67
Figure: 5. Two of the subjects during their field work, surveying, converting steps to meter, drawing, and
using GPS

International Journal of Science Commerce and Humanities Volume No 3 No 1 January 2015
68
5. Does GIS learning amend spatial thinking skills?
Possibilities in using Geographical Information System (GIS) as an Interdisciplinary Project Work (IPW)
or a component of it would ensure that Geographic Literacy education can start as early as primary school.
In the level Primary 4 alone, the use of GIS and GPS can, in fact, enhance the teaching of other subjects, like
Area and Perimeter in Mathematics, rivers and water system in Science and even National Education (Jalil,
2011). One of the obstacles hindering GIS from being included into the social studies curriculum in primary
stage is the term GIS itself. Many primary schools managed to use GIS making a good use of students'
aspire to play using Google Maps to promote their abilities in digitizing such as Woodvill primary School at
Cape Town in South Africa as it taught the students how to reach their school through maps, then printed
and inserted as an image to begin digitizing it inside Arcmap and distribute garbage areas inside school and
how to get rid of it.
The researcher tested the students' readiness to deal with one of the components of GIS by using GPS to
make navigation for specific objectives determined by GPS, and then the path will be traced and returning
again to the beginning point. The students did their tasks without making a mistake. They changed GPS with
mobile GPS and navigated in unknown area for them as they had to go to a specific point and returned again
to the beginning point. During field survey of study area that are cartography drown; the researcher on
purpose did not allow the students to see the area via GPS and Google's maps. After they had finished their
field survey, he allowed them to see the target area via Digital Personal Aid represented in GPS the matter
that facilitated the navigation, survey and field orientation and determining land marks and this is an
indication that GIS can help students develop spatial abilities (Self et al. 1992; Albert &Golledge, 1999).
6. Which Location and GIS applications suit with primary stage students?
Geographic Information Systems and public K-12 education first experienced a unity in 1992 with the
publication of a seminalarticle by Robert Tinker. Tinker's work exposed the possibilities of representing data
with digital maps in many curricula. He described the power, flexibility and intrigue that maps offered to
4th, 5th, and 6th grade students studying various aspects of the environment. (Baker, 2000). GIS students
attainment depends upon the ability of teachers to prepare educational materials using GIS and
distinguishing and classifying the types and indicating their role in solving problems. The following figure
(6) indicates the relation between spatial abilities and the activities that can be supported with GIS.
In the classroom, presentation of map-based data should begin by exploring paper maps and data that
students see most frequently. A GIS presentation could use layers depicting the local community with roads,
rivers, and political boundaries. (Baker, 2000) Accordingly, the application of these activities to students; It
Confirms the possibility of achievement of GIS applications by actuating the appropriate activities of spatial
abilities; the hypothesis was proved to be correct.

International Journal of Science Commerce and Humanities Volume No 3 No 1 January 2015
69
The Results:
The researcher prepared a scale to measure spatial thinking of primary stage students and its relation
to other factors such as individual differences according to gender, age, stage, and the study year in each
stage. The development of students' spatial thinking and the quality of their performance is linked to other
curricula especially the amended mathematics curriculum. The research reveals that there are many indexes
encouraging students' spatial thinking and promoting the spatial awareness as there is a part of mathematics
curriculum concerning geometry and measurement concentrated on defining curriculum parts, shapes, and
shapes relationships , and the curriculum aims at developing spatial sense and affirmed that they need both
analytical and spatial abilities, spatial sense is developed when student recognize, draw, construct, visualize,
compare, classify, and transform geometric shapes in both two and three dimensions (The State of Michigan,
Department of Education (1998).
In the light of the advanced trends , putting into consideration students' mental age and the
incompatibility of the geography curriculum in social studies course with students' creative abilities such as
the use of GIS equipments and programs as GPS and Google Maps, lacking the support for developing
geography curriculum using mathematics curricula that can be used to facilitate students' recognition of
geography curriculum updates in primary stage, the researcher designed spatial abilities scale in which the

International Journal of Science Commerce and Humanities Volume No 3 No 1 January 2015
70
items were ordered from easiness to difficulty so as to cope with the components of mathematics curriculum
for promoting spatial abilities and awareness to detect their potential abilities concerning spatial thinking.
For scale validity and reliability, experts agreed on the validity of the scale as it contains items for
measuring the target objectives. For the internal consistency coefficient, there are significant differences
between every variable and its dimension as correlation value of visualization were (0.45-0.79), perception
variables were between (0.22-0.8), and orientation variables were between (1-0.17) and all these values were
significant with a value of (0.01). For constructive validity, it is proved to be valid as the scale is measuring
one trait which is spatial ability. Scale reliability value by split-half reliability and spearman-brown was
(0.71) which is considered an acceptable value affirming the validity of the test to be applied.
The study revealed according to the first hypothesis that there are significant differences between
males and females in favor of the males with an average of (36.2) versus (33.9) for females, and this result is
being affirmed by many studies detecting the differences between them via spatial abilities whole scale. For
sub-dimensions, there are no differences according to perception and visualization while there are
differences for orientation with a value of (27.3) for males versus (25.4) for females. There are significant
differences for the second hypothesis via the whole scale and the sub-dimensions as a result of age impact.
Statistical analysis pointed out the increase of students' spatial awareness with the passage of time, and this
can be noted through the visualization dimension as there are differences between 10 years old students and
the older ones in favor of the older ones. For the dimensions orientation and perception, the differences
between 10 years old and (11-12) years in favor of the older as the scale contained items derived from
mathematics curriculum of the 5th and 6th primary stage students.
The researcher examined the performance of preparatory stage students by a pilot study so as to
detect the differences between the primary stage and preparatory stage. He found out that there are
significant differences in favor of the primary stage students with a mean of (36.9) for primary stage and
(30.1) for preparatory stage. It was expected that the differences will be in favor of preparatory stage
students as the questions are supposed to be more easily for them, on the contrary, the differences were in
favor of the primary stage students due to their study of mathematics at the same time and this does not
contradict with the fact that the older students proceeded the younger in performance as a result of the
increase of spatial ability and awareness.
By evaluating students' cartography and drawing abilities according to Kevin Lynch method
stipulating the necessity of existence of some items to examine cartography. All these elements are found
representing in nodes landmarks, edge and path in the map drown by the 5th and 6th primary students of the
study area and the area where they live.
For the fifth hypothesis, the researcher tried to offer one of the components of GIS for children so as
to examine their response, thus he provided them with GPS to make a navigation for specific points and
returned to the beginning point, or reaching unknown place, and he found out that the students can deal in an
easy way as they affirmed that if they were provided with GPS in the field survey, the work would be easier.
The results related to the sixth hypothesis can be summarized in the necessity of promoting teachers'
abilities and changing their way of presenting scientific materials using GIS, and this demands more training
on using Information system programs in presentation and analysis in a frame indicating its importance in
solving problems, and the researcher viewed some activities in the light of GIS reflecting students' spatial
abilities gained as a result of their practice for such activities.
Recommendations
1. Developers of Geographical educational curricula must be sure that the use of GIS efficiently
contributes to the development of cognitive maps and the accurate understanding of Geography.

International Journal of Science Commerce and Humanities Volume No 3 No 1 January 2015
71
2. Getting rid of obstacles hindering the application of GIS through curricula, including teacher's
performance, and school infrastructure such as laboratories, Computer programs and Internet networks.
3. Indicating the methods helping students to use spatial thinking via GIS.
4. Developing research based curricula that are testing groups of students concerning learning and
teaching GIS educational materials.
5. Preparing teachers to be acquainted with GIS rules in curricula so as to support spatial thinking and
conclusion of students.
6. Setting use of GIS in discovering the local environment as one of the educational objectives.
7. Conducting researches detecting the progress of study attainment via using GIS.
8. Making a good use of advanced mathematics curriculum, which is supporting understanding and spatial
abilities in developing primary schools geography curriculum.
9. Getting the benefit of ESRI company applications such as Arc GIS for schools, Arc Voyager, and other
various programs encouraging pupils to discover their technological abilities in addition to Google
Earth applications that can be used in the same field.
10. Making a good use of students' talents and spatial abilities in childhood stage via using technological
abilities in the light of the available funds.
11. Redistribution of time allocated to geographical studies by adding geographical activities supporting the
mix of GIS with curricula.
References
1. Abel Baset, H. A. M., (2008) ―The impact of environmental expertise in the development of spatial
perception of the geographical features of school pupils aged 6-12‖ Journal of Educational Society
for Social Studies – Egypt‖ Vol. 15. P.76.
2. Abed Elhady, N., (2001) ―Measurement and educational evaluation and its use in the field of grade
teaching‖ Dar Wael, vol. 2, Amman Jordon, p.353.
3. Abed, A. S., (1996) ―Spatial abilities among primary stage students and variables related to it in
mathematics‖ Journal of faculty of Education, Emirates university, vol. 12, 1996. p. 2. (In Arabic).
4. Alaam, S. M., (2006) ―Tests and psychological and educational scales‖ Dar Elfikr, Amman, Jordon,
pp. 110-111
5. Albert, W. S. &Golledge, R. G. (1999) ―The use of spatial cognitive abilities in geographic
information systems: the map overlay operation, Transactions in GIS, 3(1), pp. 7–21.
6. Allam, A. R. A., (1993) ―Amendment of social studies curricula in primary stage in the light of
social skills‖ unpublished master thesis, Menofia University. (In Arabic).
7. Anastasi, A. (1988). Psychological testing (6th ed.).(New York: Macmillan)
8. Audet, R. H., & J. Paris (1997). "GIS implementation model for schools: Assessing the critical
concerns." Journal of Geography 96(6): 293-30.
9. Baker, T. R. (2000) Applications of GIS in the K–12 science classroom, in: Proceedings of 20th
Annual ESRI User Conference, San Diego, California. Available at
http://proceedings.esri.com/library/userconf/proc00/professional/papers/pap265/p265.htm (accessed
October 2006).

International Journal of Science Commerce and Humanities Volume No 3 No 1 January 2015
72
10. Carmines. E. G., & Zeller. R. A., (1979) ―Reliability and Validity Assessment Sage Publications‖ Beverly
Hills, California, US, p. 46.
11. Cronbach, L. J., &Meehl, P. E., ―Construct Validity in Psychological Tests‖ First published in
Psychological Bulletin, 52, 281-302.
12. De Lisi, R., et al. (1995) ―Measuring grade-school children‘s ability to represent the Euclidian
horizontal coordinate‖ Journal of genetic psychology, vol. 156, issue 2, pp. 231-240.
13. ESRI (1998) ―GIS in K-12 education, an ESRI white paper." Redlands, CA, Environmental System
Research Institute.
14. ESRI (2006) "ESRI Canada - education." Retrieved February 28, 2006.
15. Faison, C. L., (1996) "Modeling instructional technology use in teacher preparation: Why we can't
wait‖ Educational Technology 36(5): 57-59.
16. Gatrell, J. 2004. Making room: Integrating geo-technologiesinto teacher education. Journal of
Geography 103 (5): 193– 196.
17. Goede, M. de., (2009) ―Gender differences in spatial cognition‖ PhD thesis, Universiteit Utrecht,
Utrecht.
18. Goldstein, D., Haldane, D. & Mitchell, C. (1990) Sex differences in visual–spatial ability: the role of
performance factors, Memory & Cognition, 18(5), pp. 546–550.
19. Government of Ireland, (1999) ―Primary School Curriculum: Mathematics Curriculum‖ The
Stationery Office, Dublin, pp.2-102.
20. Haynes, S. N., & et al. (1995) ―Content Validity in Psychological Assessment: A Functional
Approach to Concepts and Methods‖ Psychological Assessment, ,September 1995 Vol. 7, No. 3,
238-247
21. Hegarty, M., et al. 2006, ‗Spatial abilities at different scales: Individual differences in aptitude- test
performance and spatial layout learning‘, Intelligence, vol. 34, issue 2, pp. 151-176.
22. Henry, P., &Semple, H., (2012) ―Integrating Online GIS into the K–12 Curricula‖ Lessons from
the Development of a Collaborative GIS in Michigan, Journal of Geography, pp. 111:1, 3-14
23. Huynh, N. (2009). The role of geospatial thinking and geographic skills in effective problem solving
with GIS: K-16 education. PhD dissertation, Wilfrid Laurier University, Waterloo, Ontario, Canada.
p. 53.
24. Huynh, N., Sharpe, B. (2012) ―An Assessment Instrument to Measure Geospatial Thinking
Expertise‖ Journal of Geography Volume 112, Issue 1, January 2013, pages 3-17.
25. Jalil, Z., 2011 ―Active Mapping: Active Map Work for Primary School‖ Paper presented at the 4th
Redesigning Pedagogy International Conference May/June 2011, Singapore.
26. Jones, C. M., Braithwaite, V. A., & Healy, S. D. (2003). The evolution of sex differences in spatial
ability. Behavioral Neuroscience, 117, 403–411.
27. Kail, R., Carter, R. & Pellegrino, J. (1979) The locus of sex differences in spatial ability, Perception
& Psychophysics, 26(3), pp. 182–186.
28. Kamel, M. K., (2003) ― A suggested program in social studies to promote maps reading and spatial
abilities skills of preparatory stage students, unpublished PhD Thesis, Curricula and methods of
teaching, Assiut University.
29. Kerski, J.J.: A National Assessment of GIS in American High Schools. Int. Research in
Geographical and Environmental Education 10:1 (2001) 72-84
30. Kimura, D., (2000). Sex and cognition. Cambridge, MA7 MIT Press. 12-Gaulin, S. J. C. (1995).
Does evolutionary theory predict sex differencesin the brain? In M. S. Gazzaniga (Ed.), the cognitive
neurosciences, Cambridge, MA7 MIT Press. pp. 1211 – 1225.
31. Lee, J. &Bednarz, R. (2009). "Effect of GIS learning on spatial thinking " Journal of Geography in
Higher Education, Vol. 33, No. 2, May 2009, p.185.

International Journal of Science Commerce and Humanities Volume No 3 No 1 January 2015
73
32. Lohman, D. F. (1988). Spatial abilities as traits, processes, and knowledge. In R. J. Sternberg (Ed.),
Advances in the psychology of human intelligence (pp. 181– 248). Hillsdale, NJ7 Lawrence Erlbaum
Associates.
33. Maqlad, S. A., (2011) ―Effectiveness of using multi-media mental maps in teaching social studies on
cognitive attainment and deductive thinking promoting of preparatory stage students‖ unpublished
Master Thesis, Curricula and methods of teaching, Sohag University.
34. McGlone, J. (1981) Sexual variation in behavior during spatial and verbal tasks, Canadian Journal of
Psychology, 35, pp. 277–282.
35. Messick, S. (1993). Validity. (In R. L. Linn (Ed), Educational measurement (2nd ed. pp. 13—104).
36. Miller, L. K. &Santoni, V. (1986) Sex differences in spatial abilities, ActaPsychologica, 62, pp. 225–
235.
37. Molhem& S. M., (2009) ―Measurement and evaluation Education and Psychology‖ Dar Elmasira,
Amman, Jordon, P. .
38. Montello, D. R., & et al. (1999) ―Sex-Related Differences and Similarities in Geographic and
Environmental Spatial Abilities‖ Annals of the Association of American Geographers, vol. 89, issue
3, p. 532.
39. Montello, D.R et al. 1999, ‗Sex-Related Differences and Similarities in Geographic and
Environmental Spatial Abilities‘, Annals of the Association of American Geographers, vol. 89, issue
3, pp. 515-534.
40. National Research Council (2006), Learning to Think Spatially: GIS as a Support System in the K-12
Curriculum‖ National Academy of Sciences, published by the National Academies Press. P.13.
Availableathttp://www.nap.edu
41. Neilson, J., (2004) ―Sex differences in spatial cognitive: an evolutionary approach‖ PhD thesis,
University of Wollongong, Australia.
42. Newcombe, N. &Dubas, J. S. (1992) A longitudinal study of predictors of spatial ability in
adolescent females, Child Development, 63, pp. 37–46.
43. Nunnally, J. C. & Bernstein, I. H. (1994). Psychometric theory (3rd ed.).(New York: McGraw-Hill)
44. Oeida, M. M., (1996) ―Growth psychology‖ Dar El Kotob El Elmeiah, Beirut, Lebanon, p. 141,
1996. (In Arabic)
45. Omar, M. M., (2010) ―Educational and Psychological Measurement‖ Dar ELMasirah, Amman,
Jordon, p.215.
46. Roosenboom, A., (2011) ―Spatial Awareness of Dutch Children aged 8-11‖ Unpublished Msc
Thesis, Geographical Information Management and Applications (GIMA), Utrecht University,
Netherlands.
47. Saleh, E, S., (2011), Educational standards, Educational essays
availableat:http://kenanaonline.com/users/dredrees/topics/86851#http://kenanaonline.com/users/dred
rees/posts/241401
48. Self, C. M., &Golledge, R. G., 1994 ―Sex-Related Differences in spatial abilities: What every
geography educator should know‖ Journal of geography, 93:234-243.
49. Self, C. M., Gopal, S., Golledge, R. G. &Fenstermaker, S. (1992) Gender-related differences in
spatial abilities, Progress in Human Geography, 16, pp. 315–342.
50. Suen, H. K. (1990). Principles of test theories. (Hillsdale, NJ: Erlbaum)

International Journal of Science Commerce and Humanities Volume No 3 No 1 January 2015
74
51. The State of Michigan, Department of Education (1998). Michigan Curriculum Framework,
Mathematics, Including Teaching, Learning, Sample Activities. Michigan State Board of Education.
P.56.
52. Walsh, W. B. (1995). Tests and assessment. (New York: Prentice-Hall)
53. Warr, C. M. (1996). ―GIS in Secondary Education in England and Wales: From Vision to Reality‖
Unpublished Msc Thesis in Geographical Information Systems, Salford University.
54. Yahia, H. A. A., (2007) ―studies of educational studies‖ AlRoshed library, KSA, p.389.
Appendix: The scale of spatial abilities.
Spatial Abilities Test of Primary Stage Pupils
Prepared by
Dr/Yaser Abdel AzimSamak Lecturer at Geography Department
Faculty of Arts -Assiut University
March 2013
Answer the following questions during half an hour
1- Look at the foolowing Figure (pattern) :
Then put the mark ( √ ) before the figures that are similar with it :

International Journal of Science Commerce and Humanities Volume No 3 No 1 January 2015
75
2- How do you see this figure by using letters?
3 - Complete the model as seen in the figure
4 - At this figure
1- Where is the horse ?
(A) Northeast. (B) Southwest. (C) Southeast (D) Northwest
2- Where does the book lie?
(A) Northeast (B) Southwest (C) Southeast (D) Northwest
3- What is the location of the tree for the house?
(A) Northeast (B) Southwest (C) Southeast (D)
Northwest
5 -The book at the figure lies at the points
1. 2,5 (B) 3,4 (C) 3,5 (D) 4,6

International Journal of Science Commerce and Humanities Volume No 3 No 1 January 2015
76
6 -There is a rotated shape similar to the one on the right, circle the shape that is similar to the right shape.
7-There is a rotated shape similar to the one on the right, circle the shape that is similar to the right shape
8 –Figures in the first group (A) similar to the figures of group (B) but it is rotatedand relocated.
Group A Group B
International Journal of Science Commerce and Humanities Volume No 3 No 1 January 2015
77
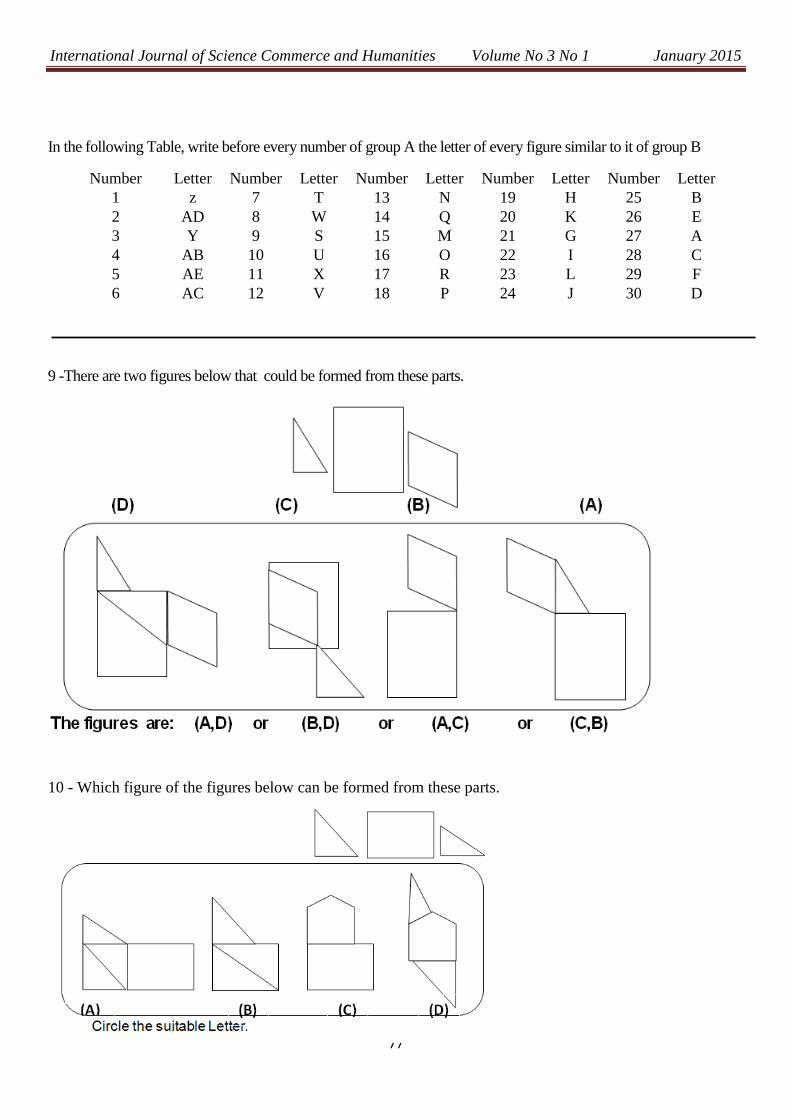
In the following Table, write before every number of group A the letter of every figure similar to it of group B
Number Letter Number Letter Number Letter Number Letter Number Letter
1 z
7 T 13 N 19 H 25 B
2 AD
8 W 14 Q 20 K 26 E
3 Y 9 S 15 M 21 G 27 A
4 AB 10 U 16 O 22 I 28 C
5 AE
11 X 17 R 23 L 29 F
6 AC
12 V 18 P 24 J 30 D
9 -There are two figures below that could be formed from these parts.
10 - Which figure of the figures below can be formed from these parts.

International Journal of Science Commerce and Humanities Volume No 3 No 1 January 2015
78
11- Which figure of the following figures if being folded will give us the figure before us?
Circle the suitable Letter.

International Journal of Science Commerce and Humanities Volume No 3 No 1 January 2015
79
12- Look at the map then answer the following questions:
1. Abd Allah stands at Abbas ibn Abdel motaleb street ,D is on his rigt hand, thus the direction behind him is:
1. The North (B)The south (C)The East (D)The west
2. Abd Allah walks till Yousef Aboel Mohsen Street reaching cars stop on his right, thus the direction before
him is:
1. The North (B)The south (C)The East (D)The west
2. Abd Allah continues his walk to Hasan ELShoshawy and reaching Om ELMomeneen street then he wants
to go to (B) so he will go towards:
1. The North (B)The south (C)The East (D)The west
1. Abd Allah reached the point (B), if he wants to return to the point (D), he will go towards:
1. North then west (B)East then North (C)East then South (D)South then North.
Instructions for the one applying this test on pupils
Spatial Abilities Test on primary stage pupils:
The Test reveals pupils' abilities incluiding:
1. Spatial abilities of figure's compatibility in which two groups of similar figures are presented and one group
is being rotated, thus the pupil has to link between the figure and its equivalent from the other group (This
type of questions is represented by 1-30 of the question No.8)
2. Spatial abilities of groups rotations:Five or six two-dimensional figures, and the pupil has to find out the
rotated figure. This type of questions is represented in the questions 3,6,7.
3. Spatial abilities to link figures in which a group of two-dimensional figures is presented, and one figure is
being cut.The pupil has to determine which figure is being cut. This type of questions is represented in the
questions No. 9 and 10.
4. Spatial perception ability of Three-dimensioal cubes in which three distinguished faces of cubes appeared
before the participant, the he is given unfolded cubes incluiding the ditinguished cube as one of the four
cubes given to him. This type of questions is represented in the questions No. 11.
5. Spatial ability of reading cognitive maps,schema, and tracing directions as a result of recognizing one of the
directions.This type of question is represented in the question No.12.
6. Spatial abilities through visual models:
1. The ability to describe the model representing in the question No.2
2. The ability to recognize repeated models representing in the question No.1
7- The ability to determine coordinates of chart representing in the question No.4.
8- The ability to determine relative coordinates of charts representing in the question no.5