Embed Size (px)
Citation preview

NEW PADS AVAILABLE AT POWER & RAYS/SWC POWER RD & RAY RD | GILBERT, AZ
The information contained herein has been obtained from sources believed reliable. While we do not doubt its accuracy, we have not verified it and make no guarantee, warranty or representation about it. It is your responsibility to independently confirm its accuracy and completeness. Any projections, opinions, assumptions or estimates used are for example only, and do not represent the current or future performance of the property. The value of this transaction to you depends on tax and other factors which should be evaluated by your tax, financial and legal advisors. You and your advisors should conduct a careful, independent investigation of the property to determine to your satisfaction the suitability of the property for your needs. [1/16/20]
Lance [email protected]
Teale [email protected]
WWW.PHOENIXCOMMERCIALADVISORS.COM | 3131 E CAMELBACK RD #340 | PHOENIX, AZ 85016 | 602.957.9800
POWER RD
Planned 2020
PROPERTY SUMMARY
Available: ±4,000 SF up to 6,000 SF
Rates: Please call for rates
DEMOGRAPHICS
2020 Population 8,143 74,745 230,923
2025 Populuation 9,167 85,192 256,234
2020 Med HH Income $82,224 $98,720 $90,809
N: ±31,418 VPD (NB/SB) E: ±13,393 VPD (EB/WB)
S: ±30,021 VPD (NB/SB) W: ±14,324 VPD (EB/WB)
ADOT 2019
TRAFFIC COUNTS
AT THE INTERSECTION
1 Mile 3 Miles 5 Miles
ESRI 2020 EstimatesPROPERTY OVERVIEW
New pads adjacent to two large power centers anchored totaling ±710,000 SF GLA of national retail/ restaurants (<1% vacant). Great street exposure available. Loop 202 access.
NOW OPEN!

PHOENIX COMMERCIAL ADVISORS | 3131 E CAMELBACK RD #340 | PHOENIX, AZ 85016 | 602.957.9800 The information presented has been obtained by private and governmental sources deemed to be reliable. Phoenix Commercial Advisors (PCA) makes no guarantees, warranties or representations of the accuracy or completeness and all information should be verified by the interested party. [1/16/20]
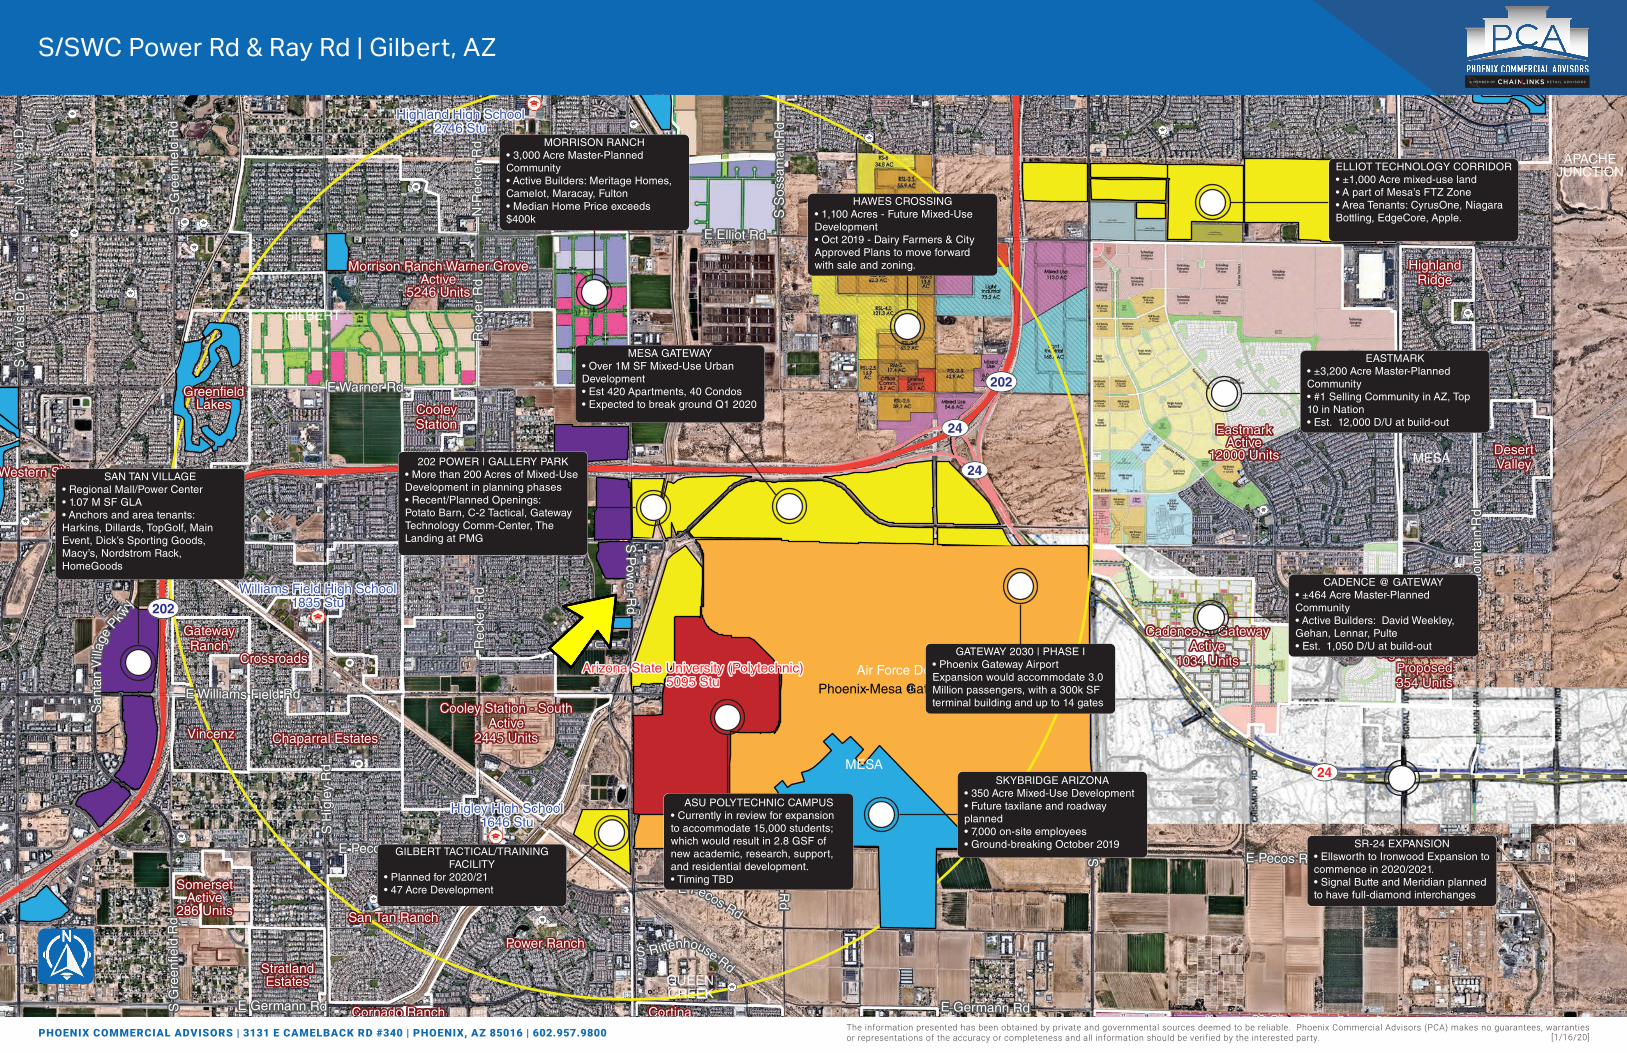
S/SWC Power Rd & Ray Rd | Gilbert, AZ
Planned 2020

PHOENIX COMMERCIAL ADVISORS3131 E CAMELBACK RD #340 | PHOENIX, AZ 85016 | 602.957.9800
The information presented has been obtained by private and governmental sources deemed to be reliable. Phoenix Commercial Advisors (PCA) makes no guarantees, warranties or representations of the accuracy or completeness and all information should be verified by the interested party. [1/16/20]
S/SWC Power Rd & Ray Rd | Gilbert, AZ
±69,684 VPD±69,684 VPD±57,860 VPD±57,860 VPD
±31
,418
VP
D±
31,4
18 V
PD
±14,324 VPD±14,324 VPD ±13,393 VPD±13,393 VPD
±30
,021
VP
D±
30,0
21 V
PD

PHOENIX COMMERCIAL ADVISORS | 3131 E CAMELBACK RD #340 | PHOENIX, AZ 85016 | 602.957.9800 The information presented has been obtained by private and governmental sources deemed to be reliable. Phoenix Commercial Advisors (PCA) makes no guarantees, warranties or representations of the accuracy or completeness and all information should be verified by the interested party. [1/16/20]
S/SWC Power Rd & Ray Rd | Gilbert, AZ
Highland High School2746 Stu
Higley High School1646 Stu
Williams Field High School1835 Stu
Arizona State University (Polytechnic)5095 Stu Phoenix-Mesa Gateway Airport
E Germann Rd
E Pecos Rd
E Ray Rd
E Warner Rd
E Williams Field Rd
E Elliot Rd
E Pecos Rd
S G
reen
field
Rd
N V
al V
ista
Dr
Rec
ker
Rd
Rec
ker
Rd
S H
igle
y R
d
S S
ossa
ma n
Rd
S P
ower R
d
S S
ossama n R
d
S M
ount
ain
Rd
S Rittenhouse Rd
S E
llsw
orth
Rd
San
tan
Vill
age
Pkwy
S V
al V
ista
Dr
E Germann Rd
E Pecos Rd
S G
reen
field
Rd
N R
ecke
r R
d
87202
87202
8724
8724
8724
Air Force Dod
Power Ranch
Cortina
CooleyStation
HighlandRidge
Vincenz
StratlandEstates
Cornado Ranch
San Tan Ranch
Chaparral Estates
Crossroads
DesertValley
GatewayRanch
GreenfieldLakes
Western Skies
Morrison Ranch Warner GroveActive
5246 Units
SomersetActive
286 Units
Cooley Station - SouthActive
2445 Units
EastmarkActive
12000 Units
Cadence At GatewayActive
1034 UnitsSignal Butte 105
Proposed354 Units
GILBERT
GILBERT
MESA
MESA
QUEENCREEK
APACHEJUNCTION
12
SAN TAN VILLAGE• Regional Mall/Power Center• 1.07 M SF GLA• Anchors and area tenants: Harkins, Dillards, TopGolf, Main Event, Dick’s Sporting Goods, Macy’s, Nordstrom Rack, HomeGoods
MORRISON RANCH• 3,000 Acre Master-Planned Community• Active Builders: Meritage Homes, Camelot, Maracay, Fulton• Median Home Price exceeds $400k
HAWES CROSSING• 1,100 Acres - Future Mixed-Use Development• Oct 2019 - Dairy Farmers & City Approved Plans to move forward with sale and zoning.
ELLIOT TECHNOLOGY CORRIDOR• ±1,000 Acre mixed-use land• A part of Mesa’s FTZ Zone• Area Tenants: CyrusOne, Niagara Bottling, EdgeCore, Apple.
EASTMARK• ±3,200 Acre Master-Planned Community• #1 Selling Community in AZ, Top 10 in Nation• Est. 12,000 D/U at build-out
CADENCE @ GATEWAY• ±464 Acre Master-Planned Community• Active Builders: David Weekley, Gehan, Lennar, Pulte• Est. 1,050 D/U at build-outGATEWAY 2030 | PHASE I
• Phoenix Gateway Airport Expansion would accommodate 3.0 Million passengers, with a 300k SF terminal building and up to 14 gates
SKYBRIDGE ARIZONA• 350 Acre Mixed-Use Development• Future taxilane and roadway planned• 7,000 on-site employees• Ground-breaking October 2019
ASU POLYTECHNIC CAMPUS• Currently in review for expansion to accommodate 15,000 students; which would result in 2.8 GSF of new academic, research, support, and residential development.• Timing TBD
MESA GATEWAY• Over 1M SF Mixed-Use Urban Development• Est 420 Apartments, 40 Condos• Expected to break ground Q1 2020
202 POWER | GALLERY PARK• More than 200 Acres of Mixed-Use Development in planning phases• Recent/Planned Openings: Potato Barn, C-2 Tactical, Gateway Technology Comm-Center, The Landing at PMG
GILBERT TACTICAL/TRAINING FACILITY
• Planned for 2020/21• 47 Acre Development
SR-24 EXPANSION• Ellsworth to Ironwood Expansion to commence in 2020/2021.• Signal Butte and Meridian planned to have full-diamond interchanges


Located in the East Valley of the Phoenix Metropolitan Area, Phoenix-Mesa Gateway Airport is a former military airfield that has successfully made the transition to a full service commercial passenger airport. Regularly scheduled commercial service began in October of 2007 with initial service from Allegiant Air to 13 destinations. As of January 2009, a total of 15 destinations are supported. Allegiant Air accounted for 174,250 enplanements in calendar year 2008. An additional 3,399 enplanements were realized from air taxi and charter operations. Approximately 355,000 passengers utilized the airport in 2008.
Phoenix-Mesa Gateway Airport is operated and maintained by the Williams Gateway Airport Authority (WGAA), a Joint Powers Airport Authority comprised of the Cities of Mesa and Phoenix, the Towns of Queen Creek and Gilbert, and the Gila River Indian Community. The Airport Authority was formed to develop, reuse, operate, and maintain the airport property and facilities at the former Williams Air Force Base, which closed in September 1993.
Initially operated as a reliever general aviation airport, Phoenix-Mesa Gateway Airport now provides regularly scheduled commercial passenger air service in its own right. In this capacity, the airport provides a much needed alternative for passengers who might otherwise utilize busy Phoenix Sky Harbor International Airport.
The Federal Aviation Administration (FAA) classifies Phoenix-Mesa Gateway Airport as a non-hub commercial service airport. The airport has over 100 based general aviation aircraft, including many business aircraft owned or leased by corporations and major employers in the metropolitan area. The following are the major facilities at Phoenix-Mesa Gateway Airport:
Three parallel commercial capable runways:
1) Runway 12R-30L: 10,401’ x 150’
2) Runway 12C-30C: 10,201’ x 150’
3) Runway 12L-30R: 9,301’ x 150’
Airport traffic control tower.
33,000 sq. ft. terminal building with 4 gates.
233,000 sq. yd. aircraft parking apron.
Over 30,000 sq. yd. cargo ramp.
Full-service fixed base operator and other specialty operators.
Four business jet service centers (Embraer, Cessna, Hawker Beechcraft, and Crownair)
The Phoenix-Mesa Gateway Airport Master Plan is the second update to the original master plan undertaken in 1994 and first updated in 1999. Proactive airport sponsors will periodically update their airport’s master plan to ensure that the airport can continue to adapt to developments in the local and national aviation economies. Updates every five to seven years are particularly important at Phoenix-Mesa Gateway Airport as it has evolved from a military airfield to a public commercial serviceairport. This study was financed with assistancefrom the FAA.
The Phoenix-Mesa Gateway Airport Master Plan is of interest to many within the local community. This includes local citizens, community organizations, airport users, airport tenants, area-wide planning agencies, and aviation organizations. To assist in the coordination and development of the Master Plan, the Williams Gateway Airport Authority identified a cross-section of these persons and groups to serve on a Planning Advisory Committee (PAC). The committee met six times over the course of the study to review and discuss draft working chapters of the master plan. In addition, four public
MASTER PLAN PREPARATION
information workshops were held to provide information to and solicit input from other interested citizens. One workshop was held in the Town of Gilbert, one in the Town of Queen Creek, and the remaining two were held at the airport. The same draft working papers that were provided to the PAC were also made accessible to the public via the consultant and airport web sites.
Facility planning begins with a definition of demand that may reasonably be expected in the future. For Phoenix-Mesa Gateway Airport, this involved updating forecasts to identify potential future aviation demand. Recognizing the realities of year-to-year fluctuations in activity, the Master Plan is keyed to potential demand levels rather than specific future dates in time. These “planning horizons” were established as levels of aviation activity that, when reached, trigger consideration by airport management of the next step in the Master Plan program.
By developing the airport to meet the aviation demand as those indicators are reached instead of specific points in time, the airport will be able to implement development needs which will meet the operational demands of its users in a cost-efficient and well-planned manner. This program also provides the Airport Authority the flexibility to accelerate or delay project implementation based on actual need or unanticipated changes in needs or demand. The forecast planning horizons are summarized in the accompanying table.
Several significant changes and events have occurred since the completion of the 1999 Master Plan Update. First, the terrorist attacks of September 11, 2001 utilizing commercial airplanes, placed an economic and security strain on the aviation industry. At the time, Phoenix-Mesa Gateway Airport was positioned to welcome commercial passenger service. These events directly contributed to airlines shifting priorities away from expansion. Second, the City of Phoenix was officially given a seat on the Board of Directors. Third, the launch of regularly scheduled commercial service in October 2007 has led to a need to reconsider the development priorities of the airport. Fourth, from a socioeconomic standpoint, the East Valley
region has continued to grow substantially, often leading the nation in some growth measures. Finally, airport design standards as developed by the FAA have gone through nine different revisions since the completion of the previous master plan.
With consideration of these factors a new master plan concept was developed. The new concept preserves all three runways as potential commercial service runways. Runway 12L-30R would
be the primary commercial passenger departure runway, Runway 12C-30C would be the primary arrival runway, and Runway 12R-30L would be the general aviation and air cargo runway.
The recommended airfield layout was developed in a fashion that would minimize or eliminate the need for additional property acquisition or surface road alterations.
This was accomplished without any negative impact to current or future operations. The taxiway system was redesigned to meet an FAA recommendation that increases safety by reducing the potential for runway incursions. This redesign creates staggered taxiway exits from the runways that reduce the possibility of an aircraft crossing the runways without being forced to make turns.
Planning Horizon2007 2012 2017 2027
ShortTermBaseline
IntermediateTerm
LongTerm
EnplanementsAir Carrier OperationsAir Cargo OperationsAir Taxi OperationsMilitary OperationsGeneral Aviation OperationsTotal OperationsEnplaned Air Cargo (Tons)Based Aircraft
177,649*1,961
08,6759,380
276,670296,686
0115
350,0009,449
80012,77212,500
321,479357,00010,000
200
850,00020,8061,700
16,17112,500
363,823415,00021,000
241
2,200,00048,1663,500
22,86612,500
447,968535,00044,000
350
DEMAND-BASED PLANNING
AIRPORT IMPROVEMENT PLAN
* 2008 Enplanement


The west side ramp is separated into functional uses. The north ramp is primarily for use by general aviation aircraft. The middle ramp is primarily for use by commercial passenger aircraft, and the south ramp is primarily utilized by airport maintenance businesses and corporate hangar facilities. This division of activity levels is planned to be maintained until such a time that the commercial service facilities are relocated to the east side of the airport.
The southwest portion of the airport has over 230 acres of undeveloped property. This area is planned to support both aviation related businesses (those needing taxiway access) and non-aviation businesses (those not needing taxiway access). A new taxiway is planned to open up this area for aviation related business development. This area provides unique development opportunities as the availability of large parcels at major metropolitan airports is rare.
With enplanements (passenger boardings) forecast to reach 2.2 million within 20 years and potentially 5 million beyond that, development of the east side of the airport with a replacement passenger terminal is recommended. Based on recent enplanement growth trends, the need for more capacity in the passenger terminal building is immediate. The entire flight line on the east side of the airport is reserved for passenger terminal complex expansion.
As airports are rapidly becoming multi-functional businesses, those areas on the east side that are not reserved for direct aviation related activities are planned for commercial development. The types of development should be keyed to the aviation nature of the facility such as hotels, a convention center, restaurants, and shops.
The major development items anticipated for each planning horizon are summarized as follows:
The full implementation of the Master Plan would involve a financial commitment of $755 million over the planning period. Financing for capital improvements can come from several sources. The FAA administers the federal Airport Improvement Program (AIP) that provides up to 95 percent funding for eligible capital projects. Funding for this program comes from Congressional appropriations of revenues generated by airport users. This includes taxes on airline tickets, aviation fuel, aircraft registrations, and other aviation related sources. The airport has also benefited from its inclusion in the Military Airport Program, which is a federal set aside of AIP grant funds for aiding conversion of former military airfields to civilian use.
INTERMEDIATE TERM IMPROVEMENTS
Initial construction of the east side terminal buildingEast side aircraft rampEast side fuel farm and other support facilitiesExtension of Runway12L approximately 1,000 feet to the northwestRelocation of Taxiway G to eliminate the diagonal nature of the existing taxiwayEast side road constructionAlpha apron expansionNew approach lights leading to Runway 30CAdditional vehicle parking (surface and/or multi-story garage)
LONG TERM IMPROVEMENTS
Expansion of the east side terminal buildingNew taxiway constructionAlpha apron expansionRunway 12R-30L extension southeastReconstruction of general aviation apronEast side ARFF facilitiesEast side parking garageRunway 12R-30L reconstruction
SHORT TERM IMPROVEMENTS
Expansion of the west side passenger terminal and vehicle parking capacityAlpha apron expansionCompletion of the dual west side taxiway systemMajor Rehabilitation of Runway 12C-30CConstruction of Taxiway L across the airfield and into the undeveloped southwest parcelsSignificant drainage and other infrastructure improvementsRehabilitation of portions of Runway 12R-30LCompletion of east side parallel Taxiway CPerimeter service road improvementsEast side terminal complex planning studiesAcquisition of 31 acres on the east side
CAPITAL IMPROVEMENT FUNDING
The Arizona Department of Transportation (ADOT) – Aeronautics Division provides 2.5 percent matching funding on federal grants. ADOT has several additional grant and loan programs available to airport sponsors. The member governments of the Airport Authority Board have also extended long term loans to the airport.
The airport also generates revenues on its own through facility rentals and land leases. As a commercial service airport, Phoenix-Mesa Gateway Airport is eligible to impose a passenger facility charge of $4.50 per ticket to be used for specific airport improvements.
The table outlines the total funding program for the master plan. Projects directly associated with development of the east side terminal complex are estimated to cost approximately $342 million of the $755 million total. Approximately $401 million of the total costs will be eligible for grants-in-aid administered by the FAA. Approximately $11.2 million is eligible for state aid, and the remaining $342 million would be the responsibility of the airport. Project eligibility does not guarantee funding.
As part of the Master Plan study, an Economic Benefit Study of the airport was conducted. The presence of the airport created both tangible and intangible benefits for the airport service area. The airport supports a diverse range of aviation and non-aviation activity. The airport has attracted essential services to the region, including enhanced medical care, such as air ambulance service, support for law enforcement, and air cargo services.
ECONOMIC IMPACT
INDUCED BENEFITS:Created by multiplier effects as spendingreticulates within the regional economy. • $296.7 Million Revenues • $112.5 Million Earnings • 2,297 Jobs
TOTAL ECONOMIC IMPACTS:The sum of Direct, Indirect, and Induced Impacts. • $534.6 Million Revenues • $209.2 Million Earnings • 4,074 Jobs
DIRECT BENEFITS:Created by suppliers of aviation services locatedon the airport. • $201.3 Million Revenues • $73.4 Million Earnings • 1,251 On-Airport Jobs
INDIRECT BENEFITS:Created by air visitors utilizing Phoenix-MesaGateway Airport. • $36.6 Million Revenues • $13.3 Million Earnings • 527 Off-Airport Jobs
FOR MORE INFORMATION, PLEASE CONTACT:Phoenix-Mesa Gateway Airport
5835 South Sossaman RoadMesa, Arizona 85212-6014
Phone: 480-988-7600Fax: 480-988-2315
website: www.phxmesagateway.org
Planning HorizonCAPITAL FUNDING PLAN (2008)
Project Cost FAA EligibleShort TermIntermediate TermLong TermTotals
$259,865,000$235,429,000$259,333,000$754,627,000
$191,186,550$74,775,450
$135,331,300$401,293,300
ADOT Eligible$5,661,225$1,967,775$3,561,350
$11,190,350
Local Share$63,017,225
$158,685,775$120,440,350$342,143,350
In quantifying benefits generated by airports, economists have emphasized indicators of economic activity such as dollar value of output (revenue), number of jobs created (employment), and earnings of workers and business owners (earnings). The total economic benefit (including all multiplier effects) of the Phoenix-Mesa Gateway Airport was $534.6 million in 2007/2008, supporting 4,075 jobs in the service area. The following summarizes the economic benefits of the airport currently:

Airport Consultants
ALPHAAPRON

One Page SummaryPower Rd & Ray Rd, Gilbert Prepared By Business Analyst Desktop-111.686971269 33.321652123 Latitude: 33.321652Rings: 1, 3, 5 mile radii Longitude: -111.686971
Population Summary 2000 Total Population 636 9,722 71,8852010 Total Population 6,833 49,189 167,4852020 Total Population 8,143 74,745 230,923
2020 Group Quarters 144 415 5442025 Total Population 9,167 85,192 256,234
2020-2025 Annual Rate 2.40% 2.65% 2.10%2020 Total Daytime Population 8,129 63,287 211,667
Workers 3,827 25,052 90,363Residents 4,302 38,235 121,304
Household Summary2000 Households 182 2,977 23,454
2000 Average Household Size 3.36 3.24 3.062010 Households 2,189 15,693 55,930
2010 Average Household Size 3.07 3.11 2.992020 Households 2,468 23,675 76,261
2020 Average Household Size 3.24 3.14 3.022025 Households 2,787 26,937 84,476
2025 Average Household Size 3.24 3.15 3.032020-2025 Annual Rate 2.46% 2.62% 2.07%
2010 Families 1,605 12,225 43,0242010 Average Family Size 3.53 3.50 3.40
2020 Families 1,812 18,271 57,7842020 Average Family Size 3.72 3.54 3.45
2025 Families 2,037 20,748 63,7882025 Average Family Size 3.72 3.55 3.462020-2025 Annual Rate 2.37% 2.58% 2.00%
Housing Unit Summary2020 Housing Units 2,589 24,655 81,149
Owner Occupied Housing Units 70.3% 75.4% 71.4%Renter Occupied Housing Units 25.0% 20.6% 22.5%Vacant Housing Units 4.7% 4.0% 6.0%
2025 Housing Units 2,888 27,886 89,351Owner Occupied Housing Units 65.6% 74.1% 70.5%Renter Occupied Housing Units 30.9% 22.5% 24.1%Vacant Housing Units 3.5% 3.4% 5.5%
Median Home Value2020 $275,125 $306,450 $314,3212025 $305,947 $336,924 $338,146
Median Household Income2020 $82,224 $98,720 $90,8092025 $90,086 $106,627 $100,852
Households by IncomeAverage Household Income 2020 $88,483 $114,905 $111,161
Per Capita Income2020 $27,539 $36,829 $36,858
Median Age2020 29.6 31.2 33.62025 28.3 30.9 33.4
2020 Population 25+ by Educational AttainmentTotal 4,588 43,750 144,561
Less than 9th Grade 1.4% 0.9% 1.6%9th - 12th Grade, No Diploma 1.6% 2.5% 3.0%High School Graduate 9.4% 13.9% 15.8%GED/Alternative Credential 2.1% 1.9% 2.6%Some College, No Degree 31.1% 24.6% 25.7%Associate Degree 9.9% 10.8% 10.5%Bachelor's Degree 31.7% 31.2% 27.4%Graduate/Professional Degree 12.9% 14.3% 13.5%
Source: U.S. Census Bureau, Census 2010 Data. Esri forecasts for 2020 and 2025
October 20, 2020Made with Esri Business Analyst
©2020 Esri www.esri.com/ba 800-447-9778 Try it Now! Page 1 of 1