Embed Size (px)
Citation preview

Evolutionary Opportunities for Horizontal
Transmission of Antibiotic Resistance Across Bacterial Species
Tanayott Thaweethai
Thesis advisor: Prof. Daniel Weinreich Second reader: Prof. Jeremy Rich Ecology and Evolutionary Biology
A thesis submitted in partial fulfillment of the requirements for the degree of Bachelor of Science with Honors in Applied Mathematics – Biology
at Brown University
April 2013

2
Table of Contents
Abstract ...................................................................................................... 3 Introduction ............................................................................................... 3
Antibiotic resistance: an overview .................................................................................. 3 Horizontal gene transfer ................................................................................................. 4 Epistasis ............................................................................................................................ 7
Methods ..................................................................................................... 10 Plasmid construction ...................................................................................................... 10 Choice of bacterial species ............................................................................................. 13 Evaluating resistance ..................................................................................................... 15 Statistical analysis .......................................................................................................... 18
Results ...................................................................................................... 20 Discussion ................................................................................................ 22 Acknowledgements ................................................................................... 24 References ................................................................................................ 25 Appendix A ............................................................................................... 30
Mutational identity of TEM β-lactamase alleles ........................................................... 30 Appendix B ................................................................................................ 31
Intrinsic vs. Community MIC ........................................................................................ 31 Methods ......................................................................................................................... 36 Results ........................................................................................................................... 39 Discussion ...................................................................................................................... 42

3
Abstract
Bacterial resistance to antibiotics has claimed hundreds of thousands of lives by
greatly complicating the treatment of infectious disease. Though resistance often evolves
under antibiotic stress via simple mutation, bacteria can develop resistance via
horizontal transmission of antibiotic resistance genes. Many fear that any bacterial
species can easily develop resistance to any antibiotic by this mechanism, but this study
challenges this notion by examining the limits imposed on horizontal gene transfer by
epistasis. We examined 32 alleles of the β-lactamase enzyme TEM-1 in Escherichia coli
strain DH5αand sought to evaluate whether the same alleles confer similar levels of
resistance when introduced into the bacterial species Acetobacter xylinum, Rhizobium
meliloti, and Rhodobacter sphaeroides. A negative result would suggest that horizontal
gene transfer is not as significant a source of resistance as previously thought. Though a
definitive answer to this question could not be obtained in this study, much work was
done to improve the accuracy of the Minimum Inhibitory Concentration assay in
quantifying microbial antibiotic resistance in the context of molecular evolution.
Introduction
Antibiotic resistance: an overview
Though the widespread use of antibiotics has significantly improved infectious
disease therapy over the past 60 years, the emergence of bacterial antibiotic resistance
threatens to dramatically reverse that trend (Levy and Marshall, 2004). Antibiotic
resistance is the process by which bacterial species adapt to clinically employed
antibiotics, rendering them ineffective in curing infection. Antibiotic resistance has
become prevalent across the globe, from rural areas in Haiti with minimal access to
4
health care to advanced medical centers in the most industrialized nations in the world
(Klevens, 2007). In the United States, it has been estimated that antibiotic-resistant
infections are responsible for $20 billion per year in excess health care costs and 8
million additional hospital days per year (Roberts et al. 2009).
Particularly problematic is the development of multidrug-resistant bacteria.
400,000 cases of multidrug-resistant bacteria were reported in Europe in 2007,
accounting for 25,000 deaths (Bush et al., 2011). Multidrug-resistant tuberculosis
(MDR-TB) is characterized by resistance to the two major anti-tuberculosis drugs,
isoniazid and rifampicin. Prolonged and expensive chemotherapy using more toxic
drugs is needed to treat MDR-TB. Resistance to these second-line drugs results in
extensively drug-resistant tuberculosis (XDR-TB), which is virtually untreatable (Zager
and McNerny, 2008). Methicillin-resistant Staphylococcus aureus (MRSA), which can
be resistant to up to 20 different antimicrobial drugs (Firth and Skurray, 1998), was the
first of the resistant problematic bacteria to challenge the successful management of
infections in hospitals (Walsh, 2003). MRSA infections now account for more US deaths
per year than AIDS. In 2005, MRSA was responsible for 94,000 life-threatening
infections and 18,650 deaths in the U.S. (Klevens et al., 2007), while AIDS was
responsible for approximately 16,000 deaths (Centers for Disease Control and
Prevention, 2005).
Horizontal gene transfer
Bacteria develop resistance to antibiotics in two ways. The first is by genetic
mutation. Short generation times, combined with strong selective antibiotic pressure,
facilitate the evolution of antibiotic resistance (Walsh, 2003). However, a single

5
bacterium is unlikely to develop multidrug resistance by multiple rare mutations
conferring antibiotic resistance. Instead, multidrug resistance is more likely to develop
via acquisition of antibiotic resistance genes from its neighbors. A bacterium can acquire
new genetic material in a process known as horizontal gene transfer. In horizontal gene
transfer (also known as horizontal transmission), genes are shared from cell to cell,
most commonly between species or genera (Hastings et al., 2004). However, horizontal
gene transfer has been observed at every one of the major taxonomic ranks, even
between bacteria and archaea (Koonin et al., 2001). As essentially asexual organisms,
genes are transferred horizontally between bacteria by three processes: conjugation,
phage-mediated transduction, and transformation (Maiden, 1998). Types of gene
transfer systems include bacterial conjugative plasmids, transposable elements, and
integron systems. Interestingly, plasmids were first identified within the context of
antibiotic resistance. In 1959, the Japanese microbiologists Tomoichiro Akiba and
Kunitaro Ochiai discovered that the Shigella bacteria they were studying were able to
transfer resistance from one bacterium to another due to the presence of these
resistance genes on a plasmid. The plasmid is a separate molecule of DNA, which had
the capability to replicate independently of the bacterial chromosomal DNA and could
transfer a copy of itself from one species to another (Amyes, 2001).
Horizontal transmission of antibiotic resistance has been repeatedly observed in
nature. Multiple plasmids are frequently present in clinical isolates of staphylococci
(Firth and Skurray, 1998). Trimethoprim resistance in multidrug-resistant Salmonella
enterica Typhimurium DT104 strains may be encoded by a mobilizable plasmid, which
also encodes resistance to sulfonamides (Cloeckaert and Schwarz, 2001). In Neisseria
meningitidis, there is evidence of sulfonamide resistance arising by introduction of

6
complete chromosomal resistance genes from a different species and mosaic alleles that
contain sequence stretches from resistant alleles (Maiden, 1998). In 1994, Klebsiella
pneumonia and K. oxytoca isolates resistant to gentamicin and cotrimoxazole were
found in patients with nosocomial infections. Many of these isolates were found to be
carrying integrons with inserted regions of foreign DNA encoding antibiotic resistance
genes (Jones et al., 1997).
In North America, various isolates of MRSA have now acquired resistance genes
to all major groups of antibiotics and are often only controllable with vancomycin, which
is often considered the most powerful antibiotic of last resort (Walsh, 2003). However,
vancomycin resistance genes have been identified on large and easily transferrable
plasmids in Enterococcus faecalis and E. faecium (Palmer et al., 2010). From 2002-
2006, 10 transfers of vancomycin resistance from enterococci to MRSA have been
documented in the United States (Sievert et al., 2008).
There is increasing fear that resistance to all known antibiotics will become
widespread due to horizontal gene transfer, bringing the world back to a pre-antibiotic
era in which no curative therapies are effective in treating cases of infectious disease.
Numerous references have been made to what one group refers to as a “single global
gene pool into which most, if not all, bacteria can dip for genes necessary for survival”
(Bennett, 2008; Medeiros, 1997; Schlüter et al., 2007; Kurland et al., 2003). Though the
threat is real, various barriers to gene transfer between bacteria have been identified
that reduce (but do not prevent) gene acquisition (Thomas and Nielsen, 2005).

7
Epistasis
Specifically, a phenomenon known as epistasis directly challenges the concept of
the universally accessible gene pool. Epistasis occurs when the phenotypic effect of a
genetic change depends on the genotypic background into which the change is being
introduced. Epistasis has important consequences for the development of both single
and multiple antibiotic resistance, and can act on many different levels. Two antibiotic
resistance genes might interact such that they both individually improve resistance
against their respective antibiotics, but when both genes are present in a bacterial
species, the resistance advantage against one or both antibiotics may be compromised,
inhibiting the spread of multidrug resistance (Hegreness et al., 2008). Alternatively, two
resistance genes might instead interact synergistically, increasing the degree of
resistance against one or both antibiotics, which would facilitate the spread of multiple
antibiotic resistance (Trindade et al., 2009).
Epistasis can also act on the interspecies level. A gene might confer resistance to
a particular antibiotic in one genome, but fail to increase resistance when present in
another. Pearson et al. (2012) recently investigated the consistency of beneficial fitness
effects of mutations across diverse genetic backgrounds. After identifying two mutations
that increased the fitness of the ssDNA bacteriophage ID11 in E. coli, the authors
investigated whether these mutations retained their beneficial effects across eight
natural phage isolates, with each differing from ID11 by 0.3-3.7% of their nucleotide
sites throughout the genome. Patterns of epistasis could not be predicted by the degree
of phylogenetic relatedness to the original genotype (Pearson et al., 2012). This finding
demonstrates the challenge of developing expectations about whether mutations will
retain their effects across divergent genomes, let alone entirely different species.

8
Finally, epistasis can influence the way bacteria respond and adapt to antibiotic
pressure when multiple point mutations are required to develop resistance. For
example, plasmid-encoded TEM-1 β-lactamase confers resistance by hydrolytically
inactivating β-lactam antibiotics, and is, by far, the most common antibiotic resistance
gene. Its prevalence is likely due to its high binding affinity to the most widely used
antibiotic in the world, ampicillin, and its sibling compound amoxicillin (Amyes, 2011).
Weinreich et al. (2006) studied five point mutations in TEM-1 β-lactamase. These
mutations jointly increase bacterial resistance by a factor of ~100,000 to cefotaxime, a
third-generation cephalosporin β-lactam. Of these five mutations, 4 are missense
(A42G, E104K, M182T, and G238S) and 1 is a 5’ noncoding mutation (g4205a).
Therefore, there are 5! = 120 mutational trajectories linking the wild-type β-lactamase
to its high-resistance allele. Sign epistasis, the phenomenon by which a mutation is
beneficial on some genetic backgrounds but deleterious on others, was found to be
prevalent (Weinreich et al., 2005). After constructing 32 plasmids encoding the 32
combinations of these five mutations, 108 of the 120 trajectories were found to be
selectively inaccessible in Escherichia coli strain DH5α when challenged with
cefotaxime, due to the fact that natural selection only favors the sequential fixation of
beneficial mutations. (Weinreich et al., 2006).
Such sign epistasis was suspected to be due to extensive biophysical pleiotropy
within the β-lactamase enzyme. Pleiotropy is the phenomenon by which a single gene
affects multiple phenotypic elements (Cheverud, 1996). In TEM-1 β-lactamase, for
example, the mutation M182T improves cefotaxime resistance on an allele with the
G238S mutation, but not on the wild-type, because the two mutations work together to
improve cefotaxime hydrolysis while preserving thermodynamic stability (Weinreich et

9
al., 2006). In this case, we observe epistasis between individual point mutations in the
adaptive evolution of the TEM-1 β-lactamase gene.
The following experiments will examine whether epistasis exists between β-
lactamase alleles and the chromosomes of various bacterial species. In this study, I will
introduce the 32 previously constructed alleles of TEM-1 β-lactamase into a broad host
range vector. These plasmid constructs will then be used to transform a phylogenetically
diverse collection of bacterial species. The experiments of Weinreich et al. (2006) will be
repeated in these species in order to evaluate the resistance conferred by each allele in
each species. These five mutations exhibit a variety of pleiotropic effects, which may
extend to interactions with the bacterial machinery present in other species. If the same
alleles fail to produce the same relative levels of resistance in these species, this would
challenge the widely held belief that the gene pool is universally accessible to all species
and that horizontal gene transfer is not a significant source of antibiotic resistance.
Alternatively, a positive result would improve our ability to predict molecular
mechanisms of adaptation in different species by using data from other species.
By evaluating the resistance conferred by each allele in each species, we will be
able to determine which evolutionary trajectories are accessible in each species, as was
performed in E. coli in Weinreich et al. (2006). If the trajectories are different, this
would indicate that epistatic interactions between alleles of TEM-1 β-lactamase are not
preserved across bacterial species.

10
Methods
Plasmid construction
Weinreich et al. (2006) introduced the 32 combinations of the five point
mutations leading to the high-resistance TEM-1 β-lactamase allele into the ampicillin
resistance gene (ApR) of the cloning vector pBR322 (New England Biolabs, Beverly, MA)
via site-directed mutagenesis using the Qiagen QuikChange kit (Stratagene, La Jolla,
CA). pBR322 is pictured in Figure 1. The 32 pBR322 alleles are abbreviated pBR0-
pBR31; numerical assignments are outlined in Appendix A. These plasmids were then
chemically transformed into competent E. coli strain DH5α cells. The TEM genes of the
resulting plasmids were sequenced to confirm the presence of the desired mutations and
the absence of any other mutations (Weinreich et al., 2006).
In order to evaluate the resistance of these alleles in different species, we
introduced the 32 combinations of mutations into the broad-host-range cloning vector
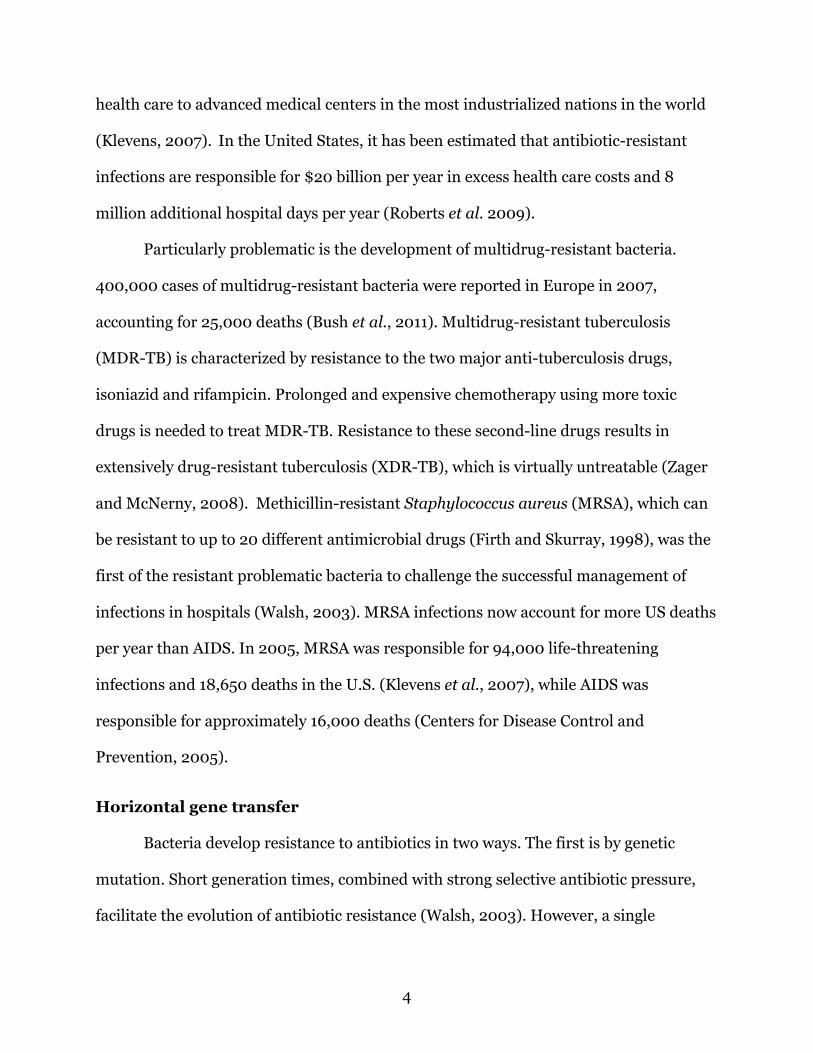
pBBR1MCS-4 (Kovach et al., 1995). pBBR1MCS-4, pictured in Figure 2, contains an ApR
gene identical in sequence to the ApR gene in pBR322, apart from two mutations: V84I
and A184V. My first goal was to excise the portion of the pBR322 ApR gene spanning the
five point mutations described (Weinreich et al., 2006) and then clone that portion into
the pBBR1MCS-4 ApR gene. The two mutations distinguishing the ApR genes in pBR322
and pBBR1MCS-4 would be “overwritten” in the process.
Restriction site AhdI, located 78 nucleotides before the stop codon of the ApR
gene (nucleotide position 3361 in pBR322 and position 4575 in pBBR1MCS-4), is
located downstream of all five mutations in both plasmids. AhdI is also downstream of
the two mutations differentiating the wild-type pBR322 and pBBR1MCS-4 sequences.

11
Restriction site BamHI is located upstream of all five mutations leading to the
high-resistance allele, as well as the two mutations differentiating wild-type pBR322
and pBBR1MCS-4. In pBR322, BamHI interrupts a tetracycline resistance gene (TcR),
but is upstream of the two promoters of ApR, which are located 35 and 244 nucleotides
before the start codon of ApR. In fact, the second promoter overlaps the promoter
transcribing TcR in the opposite direction (Brosius et al., 1982). In pBBR1MCS-4,
BamHI is located upstream of the five mutations leading to the high-resistance allele, as
well as the two mutations differentiating the wild-type pBR322 and pBBR1MCS-4.
pBR322 plasmids were extracted from E. coli strain DH5α using a QIAPrep Spin
Miniprep Kit (Qiagen, Venlo, Netherlands). pBBR1MCS-4, graciously obtained from
Helen Segal in the Jacqueline K. Barton lab at the California Institute of Technology
(Pasadena, CA), was provided in 10mM Tris-Cl, pH 8.5. pBBR1MCS-4 was transformed
into Invitrogen MAX Efficiency DH5α Competent Cells (Life Technologies, Grand
Island, NY). Restriction enzymes BamHI and AhdI (New England Biolabs, Beverly, MA)
were used to restrict the 32 pBR322 plasmids and the lone pBBR1MCS-4 plasmid. The
1370-bp pBR322 insert and 3626-bp pBBR1MCS-4 vector were isolated via gel
electropohoresis on a 0.8% agarose gel and then eluted using QIAquick Gel Extraction
kit (Qiagen, Venlo, Netherlands). T4 DNA Ligase (Invitrogen, Carlsbad, CA) was used to
ligate each pBR322 insert into the pBBR1MCS-4 vector to produce 32 pBBR1MCS-4
constructs, named pBBR0-pBBR31 as in pBR322. Sequencing of the TEM alleles of the
resulting plasmids was performed at the University of Rhode Island Genomics and
Sequencing Center (Kingston, RI) to confirm the presence of the desired mutations and
the absence of any other mutations.
12
Figure 1: (a. adapted from the Wikimedia Commons file "Image: PBR322.svg" http://upload.wikimedia.org/wikipedia/commons/5/5b/PBR322.svg, b. adapted from New England Biolabs, Inc.) (a) The plasmid map of pBR322 (GenBank accession No. J01749). (b) A close-up of the plasmid map with unique restriction sites labeled in bold. This image has been modified from its original form by annotating the restriction sites used in the present study, BamHI (375) and AhdI (3361).
Figure 2 (adapted from Kovach et al., 1995): The plasmid map of pBBR1MCS-4 (GenBank accession No. U25060). This image has been modified from its original form by annotating the restriction sites used in the present study, BamHI (3251) and AhdI (4575, relative location estimated in figure).

13
Choice of bacterial species
Broad-host-range vector plasmid pBBR1MCS-4 has been tested and found to
replicate in the following gram-negative species: Acetobacter xylinum, Alcaligenes
eutrophus, Bartonella bacilliformis, Bordetella spp., Brucella spp., Caulobacter
crescentus, Escherichia coli, Paracoccous denitrificans, Pseudomonas fluorescens, P.
putida, Rhizobium meliloti, R. leguminosarum bv. viciae, Rhodobacter sphaeroides,
Salmonella typhimurium, Vibrio cholera, and Xanthomonas campestris (Kovach et al.,
1995). In this study, three bacterial species were chosen for experimentation:
Acetobacter xylinum (ATCC 10245), Rhizobium meliloti (ATCC 51124), and
Rhodobacter sphaeroides (ATCC 55304). These species, obtained from the American
Type Culture Collection (Manassas, VA), were chosen because they met the following
criteria: (1) compatibility with pBBR1MCS-4, (2) susceptibility to ampicillin, (3)
biosafety level 1, and (4) ability to be transformed, preferably via electroporation for
increased efficiency. Proof of ampicillin susceptibility, biosafety level, growth
conditions, and protocols for preparation of electrocompetent cells and transformation
by electroporation are outlined in Table 1 for various bacterial species. Bacterial species
not of biosafety level 1 are also included so that they may be considered for future
experimentation. Of the eligible bacteria identified in Table 1, Xanthomonas campestris
and Pseudomonas syringae were not used at this stage because they are plant
pathogens, which may have endangered the neighboring plant lab in our building after
becoming antibiotic-resistant. The eligibility of the other species listed above and in
Kovach et al. (1995) but not in Table 1 remains to be investigated. Additional species
also found to be compatible with pBBR1MCS-4 may be considered for future work.

14
Species ATCC No.
Biosafety level
Proof of pBBR1MCS-4 compatibility
Proof of ampicillin susceptibility
Optimal growth conditions
Optimal growth media
Transformation protocol
Acetobacter xylinum 10245 1 Kovach et al.,
1995 Valla et al., 1986
26°C & 0.1% Celluclasta
ATCC medium 1: Mannitol agar Hall et al., 1992
Rhizobium meliloti 51124 1 Kovach et al.,
1995 Ratcliff and Denison, 2011 26°C
ATCC medium 111: Rhizobium X medium
Antoine and Locht, 1992
Rhodobacter sphaeroides 55304 1 Kovach et al.,
1995 Baumann et al., 1989
26°C, anaerobicb, tungsten lightc
ATCC medium 550: R 8 A H medium Koch et al., 1998
Xanthomonas campestris 35937 1 Kovach et al.,
1995 Shenge et al., 2007 28°C
ATCC medium 1475: Glucose yeast chalk agar
White and Gonzalez, 1995
Pseudomonas syringae 19322 1 Kovach et al.,
1995 Hwang et al., 2005 26°C
ATCC medium 3: nutrient agar or nutrient broth
Bassett and Janisiewicz, 2003
Brucella ovis 25840 2 Elzer et al., 1995
Hall and Manion, 1970 5% CO2, 37°C
ATCC medium 260: Trypticase soy agar with defibrinated sheep blood
Elzer et al., 1995 & Lai et al., 1990
Table 1: Database of relevant information regarding identified bacterial species that (1) pBBR1MCS-4 has been found to replicate in and (2) are susceptible to ampicillin. β-lactamase activity in Acetobacter xylinum, Rhizobium meliloti, and Rhodobacter sphaeroides was evaluated in this study for practicality, as these species are biosafety level 1. Optimal growth conditions and growth media were obtained from documentation made available by the American Type Culture Collection (atcc.org). aFor preparation of A. xylinum cells that were not attached to the cellulose product, cellulase (0.1% Celluclast; Sigma-Aldrich, St. Louis, MO) was added to the culture medium 24 to 48 h before harvesting to digest the cellulose and give a uniform cell suspension (Saxena and Brown, 1995). bAll aerobic overnight cultures were grown in 13x100mm disposable glass culture tubes (Fisher Scientific, Pittsburgh, PA), and anaerobic cultures were grown in Fisherbrand screwtop disposable plastic centrifuge tubes (Fisher Scientific, Pittsburgh, PA). Agar plates and Corning Incorporated 96-well plates were sealed with Parafilm (Pechiney Plastic Packaging, Menasha, WI). cA Bayco 150W Incandescent 8.5” clamp light (Bayco Products, Inc., Wylie, TX) was installed into an incubator to expose these R. sphaeroides cultures and plates to tungsten light. Bacterial cultures and plates requiring the same incubation temperature but not tungsten light were covered with foil or placed on shelves above the lamp to shield them from the light. The 32 pBBR1MCS-4 constructs were chemically transformed into Invitrogen
MAX Efficiency DH5α Competent Cells (Life Technologies, Grand Island, NY) in order
to evaluate resistance of the TEM-1 β-lactamase alleles on that plasmid in E. coli strain
DH5α. All other transformations can be carried out via electroporation using an

15
Eppendorf Eporator (Eppendorf, Hamburg, Germany) following the transformation
protocols outlined in Table 1.
A. xylinum, R. meliloti, and R. sphaeroides are all members of the same class,
Alphaproteobacteria, but belong to different orders (Rhodospirillales, Rhizobiales, and
Rhodobacteraceae, respectively). These species are each more closely related to one
another than they are to E. coli, which also is in class Alphaproteobacteria (Williams et
al., 2007). Of the species outlined in Table 1 that were not included in this study, P.
syringae may be of particular interest, as it belongs to a different class, Gamma
Proteobacteria (van der Lelie et al., 2009), whereas B. ovis belongs to the same order as
R. meliloti (Williams et al., 2007).
Evaluating resistance
The resistance conferred by each allele against ampicillin was measured using a
Minimum Inhibitory Concentration (MIC) assay. Essentially, the MIC is the lowest
concentration of an antibiotic that will inhibit the visible growth of a bacterial culture
after overnight incubation. The MIC is found by exposing a cell culture to various
antibiotic concentration. The antibiotic ampicillin was chosen rather than cefotaxime
because it is far more widely used (Amyes, 2001), and more research has been
completed regarding the wild-type susceptibility of various bacterial species to
ampicillin. A consequence of this decision, which will be discussed in the results section
of this document, is that the allele conferring the highest resistance against ampicillin is
not the allele that confers the highest resistance against cefotaxime (pBR31, the allele
with all five mutations).

16
Specifically, the broth microdilution method was used to measure MIC (Murray
et al., 2003). According to the protocol, 1ml overnights of each mutant are grown in
13x100mm Fisherbrand disposable culture tubes (Fisher Scientific, Pittsburgh, PA) and
then diluted to 1 x 10⁶ CFU (colony forming units)/ml in Mueller-Hinton (MH) Broth
(BD, Franklin Lakes, NJ). An antibiotic stock is then made by dissolving solid, powdered
antibiotic into MH broth to the desired volume and concentration appropriate for the
given experiment. This antibiotic stock is then serially diluted two-fold in order to
obtain a range of antibiotic concentrations. The wells of a 96 Well Cell Culture Plate
(Corning Incorporated 3598, Corning Incorporated, Corning, NY) are filled with
(typically) 150µl antibiotic and 150µl inoculum, diluting the inoculum to a final
concentration of 5 x 10⁵ CFU/ml, as well as diluting the antibiotic stocks two-fold. Some
wells are also dedicated to drug-free growth controls to verify the viability of the
bacterial culture. After inoculation, each plate is covered with its lid, sealed in a plastic
bag, and then incubated in air at 35°C for 16-20h. Growth is best determined by
comparison with that in the growth control well and generally is indicated by turbidity
throughout the well or by buttons, single or multiple, in the well bottom. Also, a critical
element of quality control is the testing of the susceptibility of reference bacterial strains
(NCCLS, 2004). Dilutions should encompass at least two concentration increments
above and below the previously established MIC for these reference strains (Murray et
al., 2003).
A significant departure from this protocol is the fact that the final inoculum
concentration of 5 x 10⁵ CFU/ml was not used in the MIC assays in this study. Instead, it
was discovered that a high inoculum concentration can inappropriately inflate MIC
values. We extensively studied the relationship between inoculum concentration and
17
measured MIC across bacterial species, the details of which are outlined in Appendix B.
For E. coli strain DH5α, overnights were grown at 37°C in Luria-Bertani (LB) Broth
(BD, Franklin Lakes, NJ) + 50 µg/ml ampicillin with shaking under aerobic conditions.
Ampicillin was used as a precaution to select for bacteria carrying β-lactamase alleles
and exclude contaminants. Every TEM allele studied here confers resistance exceeding
50 µg/ml of ampicillin in E. coli strain DH5α (Results, Table 3).
In order to most precisely determine the resistance conferred by the 32 alleles of
TEM β-lactamase within a particular species, two stages of MIC assays were conducted.
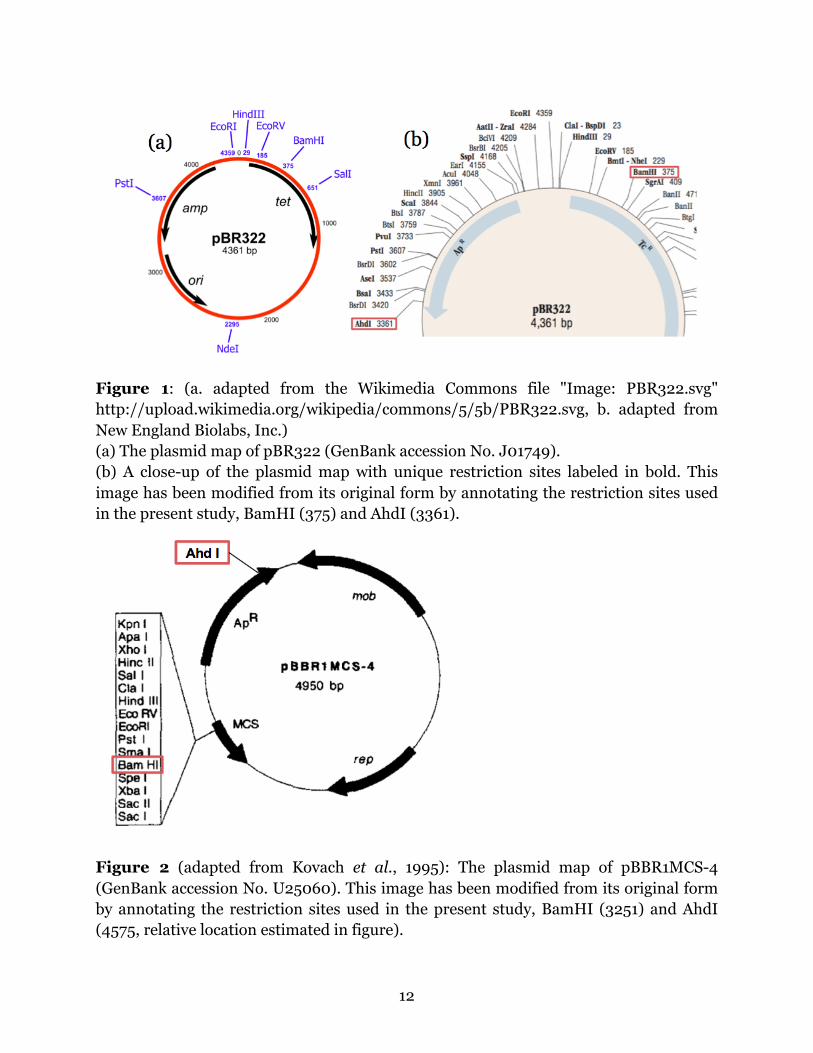
First, every allele was exposed to the same range of antibiotic concentrations (two-fold
dilutions starting from 7,500 µg/ml ampicillin for pBBR1MCS-4 derived alleles) on a
96-well plate, with each column containing a different allele and each row containing a
different antibiotic concentration. This was completed by growing 1ml overnights of
each allele, and then taking the 10-6 dilution. 20µl of each overnight dilution was used to
inoculate 150µl of each ampicillin dilution to the final ampicillin concentrations
outlined in Figure 3.
Figure 3: First-stage MIC assays conducted on E. coli strain DH5α carrying pBBR0-11. Every allele is tested against the same range of ampicillin concentrations. This is a stylized illustration of the first of three 96-well plates required to perform one replicate of the full assay of the 32 alleles, along with the growth control and control species (S. aureus, E. faecalis, and E. coli.) Assays were usually conducted in triplicate.
18
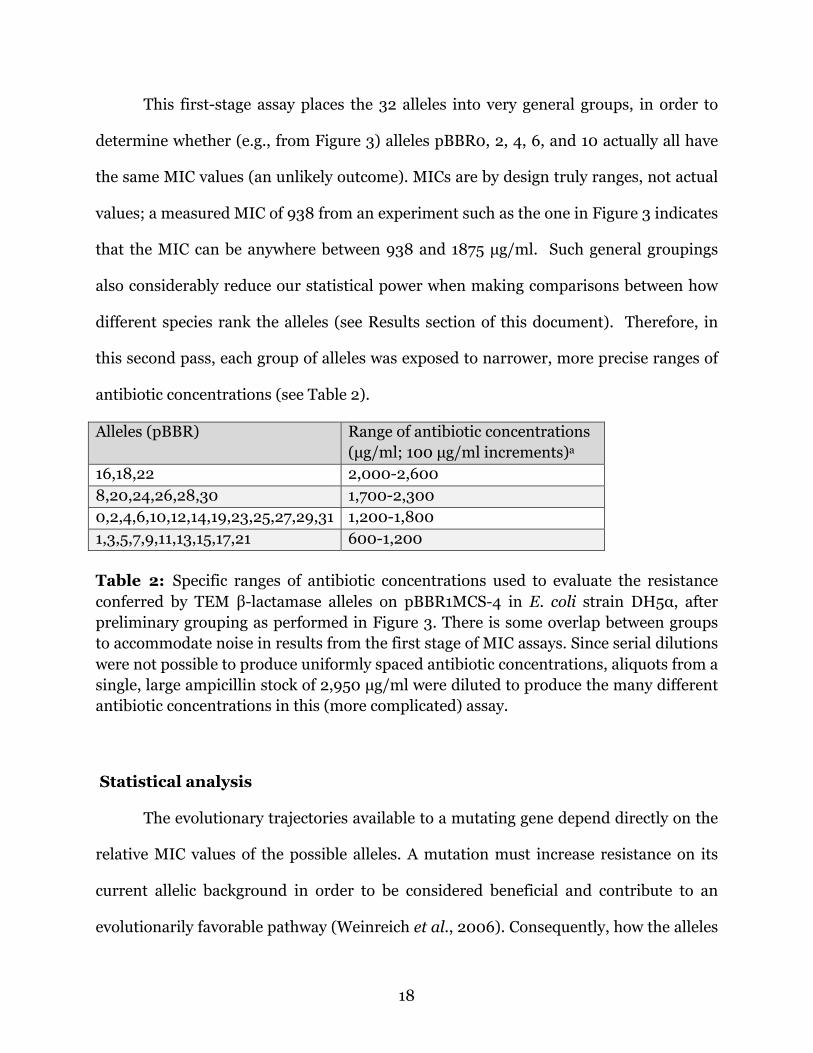
This first-stage assay places the 32 alleles into very general groups, in order to
determine whether (e.g., from Figure 3) alleles pBBR0, 2, 4, 6, and 10 actually all have
the same MIC values (an unlikely outcome). MICs are by design truly ranges, not actual
values; a measured MIC of 938 from an experiment such as the one in Figure 3 indicates
that the MIC can be anywhere between 938 and 1875 µg/ml. Such general groupings
also considerably reduce our statistical power when making comparisons between how
different species rank the alleles (see Results section of this document). Therefore, in
this second pass, each group of alleles was exposed to narrower, more precise ranges of
antibiotic concentrations (see Table 2).
Alleles (pBBR) Range of antibiotic concentrations (µg/ml; 100 µg/ml increments)a
16,18,22 2,000-2,600 8,20,24,26,28,30 1,700-2,300 0,2,4,6,10,12,14,19,23,25,27,29,31 1,200-1,800 1,3,5,7,9,11,13,15,17,21 600-1,200 Table 2: Specific ranges of antibiotic concentrations used to evaluate the resistance conferred by TEM β-lactamase alleles on pBBR1MCS-4 in E. coli strain DH5α, after preliminary grouping as performed in Figure 3. There is some overlap between groups to accommodate noise in results from the first stage of MIC assays. Since serial dilutions were not possible to produce uniformly spaced antibiotic concentrations, aliquots from a single, large ampicillin stock of 2,950 µg/ml were diluted to produce the many different antibiotic concentrations in this (more complicated) assay.
Statistical analysis
The evolutionary trajectories available to a mutating gene depend directly on the
relative MIC values of the possible alleles. A mutation must increase resistance on its
current allelic background in order to be considered beneficial and contribute to an
evolutionarily favorable pathway (Weinreich et al., 2006). Consequently, how the alleles
19
of a gene are ranked in terms of MIC values defines the epistatic relationships between
alleles. If the 32 alleles of TEM β-lactamase are ranked similarly according to MIC
values across bacterial species, then the epistatic relationships between the alleles must
be the preserved in both species.
The Friedman test is a non-parametric two-way analysis of variance based on
ranks that can be used to answer, for example, the following question: n wines are rated
by k different judges. Are the judges’ ratings consistent with each other (Friedman,
1940)? In this study, our 4 bacterial species (three experimental species plus E. coli) are
the k judges, and the 32 alleles are the n wines. We test the null hypothesis that allele
rankings are consistent across bacterial species. Because the Friedman test can be used
to analyze three or more repeated measurements of ordinal data, it is used rather than
the more familiar Wilcoxon matched-pairs signed-ranks test, which only analyzes the
difference between two correlated ordinal-level measurements (Sheldon et al., 1996).
This is particularly useful when comparing allelic rankings between more than two
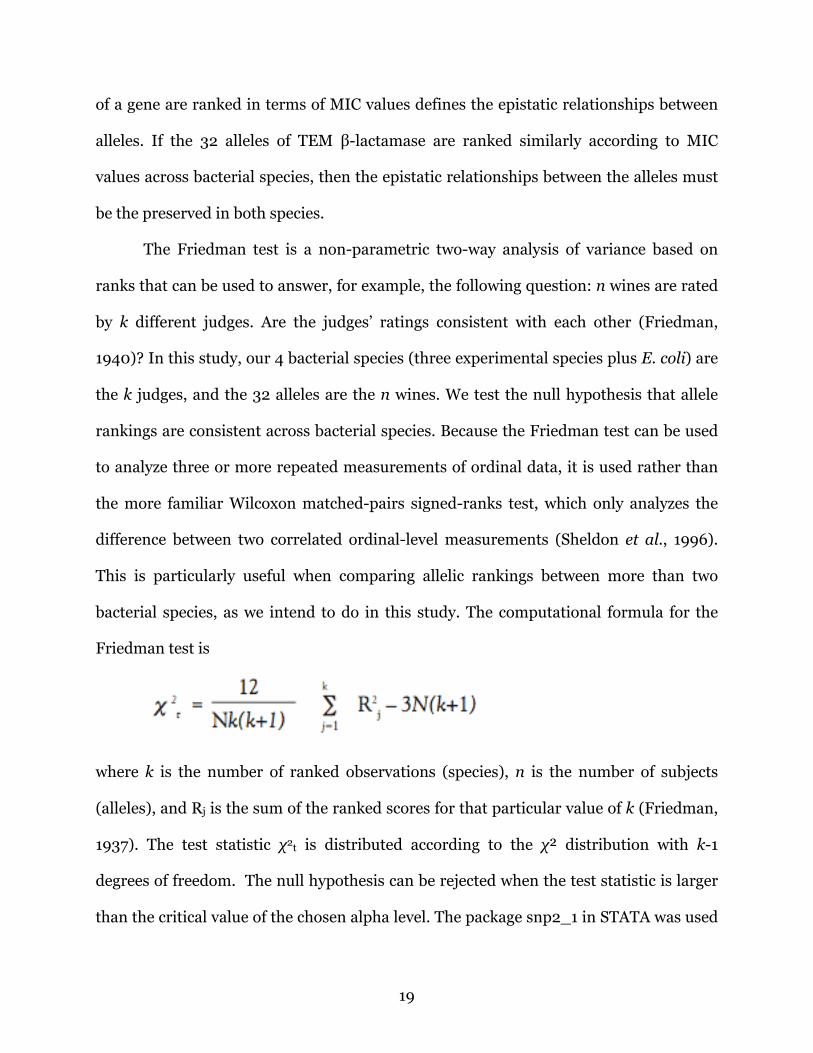
bacterial species, as we intend to do in this study. The computational formula for the
Friedman test is
where k is the number of ranked observations (species), n is the number of subjects
(alleles), and Rj is the sum of the ranked scores for that particular value of k (Friedman,
1937). The test statistic χ2t is distributed according to the χ² distribution with k-1
degrees of freedom. The null hypothesis can be rejected when the test statistic is larger
than the critical value of the chosen alpha level. The package snp2_1 in STATA was used

20
to perform this calculation (Goldstein, 2005), though other statistical programs may be
used as well. As the p-value generated by the Friedman test approaches zero, the
probability that the rankings are consistent across observations increases.
Results
The 32 TEM β-lactamase alleles were successfully cloned from pBR322 into
pBBR1MCS-4 and then chemically transformed into E. coli strain DH5α. The results of
the MIC assays against ampicillin conducted on these alleles, as well as assays
conducted on the original alleles in pBR322, can be found in Table 3 below.
TEM β-lactamase alleles in pBBR1MCS-4
Allele 1 2 3 4 5 6 7 8 9 Median 0 1700 1700 1700 1600 1700 1600 1500 1700 1500 1700 1 600 - 700 800 800 800 600 600 600 1 2 1600 1600 1600 1700 1600 1600 1700 1800 1700 1600 3 1100 1100 900 900 900 900 700 700 800 900 4 1400 1700 1500 1400 1800 1400 1400 1500 1400 1400 5 700 800 500 800 800 800 700 600 600 700 6 1500 1500 1500 1500 1500 1400 1500 1500 1500 1500 7 1100 1100 900 900 900 900 800 700 800 900 8 >1700 >1700 >1700 1900 1700 1800 1700 - 1700 1700 9 1100 1100 900 900 900 900 800 700 800 900 10 1500 1500 1500 1400 1500 1400 1500 1500 1500 1500 11 900 900 900 900 900 900 800 800 800 900 12 1400 1400 1400 1300 1400 1300 1300 1300 1400 1400 13 900 900 900 900 900 900 700 700 700 900 14 1300 1300 1300 >1800 >1800 >1800 1400 1400 1400 1400 15 900 900 900 800 900 800 800 700 800 800 16 2200 2300 2300 2300 2200 2200 2200 2200 2200 2200 17 700 900 700 800 900 800 700 600 600 700 18 2200 2300 2300 2300 2300 2200 2200 2200 2200 2200 19 1300 1300 1300 1200 1200 1200 1200 1200 1200 1200 20 2000 2000 - 2000 1900 - 2000 2000 2100 2000 21 800 800 900 1100 1100 900 600 600 600 800 22 2300 2300 2300 2300 2200 2200 2200 2200 2200 2200 23 1300 1300 1300 1200 1400 1200 1200 1200 1200 1200 24 >2000 >2000 >2000 - 2200 2100 2100 2200 2200 2100 25 1300 1300 1300 1200 1400 1200 1200 1200 1200 1200 26 1900 1900 1900 1900 1900 1900 2000 2000 2000 1900 27 1300 1300 1300 1400 1700 1400 1200 1200 1200 1300 28 1900 1900 1900 1900 1900 1900 1800 1900 1900 1900 29 1300 1300 1300 1600 1700 1700 1200 1200 1200 1300 30 1900 1900 1900 1800 1900 1800 2100 2000 2100 1900 31 1500 1500 1500 1200 - - 1200 1300 1300 1300
TEM β-lactamase alleles in pBR322
Allele 1 2 3 Median 0 >4000 >4000 >4000 1700 1 1600 >2200 1800 650 2 >4000 >4000 >4000 1600 3 >2200 >2200 >2200 900 4 4000 3800 3800 1400 5 1600 1600 1600 700 6 >4000 3800 3800 1500 7 >2200 >2200 >2200 900 8 4200 4400 4400 1700 9 >2200 >2200 >2200 900 10 >4000 3800 3800 1500 11 >2200 >2200 >2200 900 12 4000 3800 4000 1400 13 >2200 >2200 >2200 900 14 3600 3800 3400 1400 15 >2200 >2200 >2200 800 16 6000 6200 6000 2200 17 1800 1800 1800 700 18 >6200 >6200 >6200 2200 19 3200 3200 3000 1200 20 5200 5400 5200 2000 21 1600 1800 1800 800 22 5800 5800 5800 2200 23 3200 3200 3000 1200 24 >5400 >5400 >5400 2100 25 3400 3400 3200 1200 26 >5400 >5400 >5400 1900 27 3200 3400 3400 1300 28 4800 5200 5000 1900 29 3200 3200 3200 1300 30 4800 5200 5000 1900 31 3800 3800 3600 1300
Table 3: MIC values (µg/ml) for TEM β-lactamase alleles on pBBR1MCS-4 and pBR322 in E. coli strain DH5α. Nine replicate assays were conducted for pBBR1MCS-4, with three performed each day. Three replicate assays were conducted for pBR322, all on a single day. - indicates missing/uninterpretable data. Median MIC calculations do not include missing data, but substitutes right-censored data with the lower bounds.

21
It was found that epistatic relationships between TEM β-lactamase alleles were
preserved across plasmid backgrounds. The Friedman test was conducted to compare
allelic rankings of the TEM β-lactamase alleles in pBR322 and pBBR1MCS-4 in E. coli
strain DH5α. Preliminary median MIC values for alleles in pBR322 are shown in Figure
4. Epistatic relationships between alleles are indeed preserved across plasmid
backgrounds in E. coli strain DH5α (p=0.0011), despite differing copy number
(Sambrook et al., 1989; Zwirglmaier et al., 2004) and lower average MIC (t-test;
p<0.0001).
pBR alleles Median MIC (µg/ml)
18 6200 16 6000 22 5800
24,26 5400 20 5200
28,30 5000 8 4400
0,2,12 4000 4,6,10,31 3800
14 3600 25,27 3400
19,23,29 3200 3,7,9,11,13,15 2200
1,17,21 1800 5 1600
pBBR alleles Median MIC (µg/ml)
16,18,22 2200 24 2100 20 2000
26,28,30 1900 0,8 1700 2 1600
6,10 1500 4,12,14 1400
27,29,31 1300 19,23,25 1200
3,7,9,11,13 900 15,21 800 5,17 700
1 650
Table 4: Alleles were grouped and ranked based on median MIC from data in Figure 1.
A. xylinum, R. meliloti, and R. sphaeroides were successfully obtained and
cultured, but could not be successfully transformed. Several attempts were made to
complete the electroporation protocol for R. sphaeroides listed in Koch et al. (1998), but
with no success. This may be due to the fact that the protocol was originally optimized
for the electroporation of Rhodobacter capsulatus, not R. sphaeroides, though the
authors apparently found the protocol successful in R. sphaeroides (Koch et al., 1998).

22
Discussion
Unfortunately, the central question of this study remains unanswered: it is still
not known whether epistatic relationships are conserved across bacterial species. This is
because we were unable to successfully introduce the TEM β-lactamase alleles into novel
species. However, a number of very significant steps have been taken in this study that
have brought us much closer to this goal. First, the complete library of the 32 TEM β-
lactamase alleles was successfully constructed in a broad-host-range plasmid, which is
no small feat. A catalog of eligible species to investigate was created, with references
outlining growth conditions and transformation protocols. Most significantly, the
results of Appendix B strongly suggest the existence of a population density-derived
discrepancy between intrinsic and group MIC, which has ramifications for all of
antibiotic resistance evolution.
That being said, the present study suffers from some limitations. Though
pBBR1MCS-4 was chosen for its broad host range and versatility, a potential drawback
is its lack of a selectable marker besides ampicillin resistance. This means that
transformants can only be selected for with ampicillin. Suppose that some TEM β-
lactamase allele on pBBR1MCS-4 does not confer resistance to ampicillin when
introduced into some bacterial species. This would make it impossible to select for
successful transformants. It is uncertain whether this is what happened in Rhodobacter
sphaeroides. Operating under the null hypothesis that allelic rankings are consistent
across bacterial species, pBBR16 should also be one of the strongest alleles in R.
sphaeroides. It was hoped that pBBR16 would be able to confer adequate resistance to
R. sphaeroides such that it could survive the selective screen of an LB agar plate infused
with 50µg/ml ampicillin. But, if that allele was too weak to survive that screen when in

23
R. sphaeroides, we would never be able to recover successful transformants, even if the
electroporation was carried out successfully.
A further limitation is the inherent difficulty in making generalizations based on
very few observations. Even if A. xylinum, R. meliloti, and R. sphaeroides were all
successfully transformed and assayed for MIC values, we would only have information
about the consistency of epistatic relationships across three bacterial species, all
belonging to the class Alphaproteobacteria. Bacteria belonging to other orders (e.g. P.
syringae) are good candidates for future experimentation. Also, it is very challenging to
simulate horizontal transmission as it occurs in the environment, so it is difficult to
assess the frequency at which horizontal gene transfer of antibiotic resistance might
actually occur in nature.
It is very clear what future work should be carried out. Transformations should
continue to be attempted for all species outlined in Table 1 and beyond. Once a species is
successfully transformed, the inoculum concentration required to determine the
intrinsic MIC should be identified using the protocol suggested in Appendix B. Then,
MIC assays using this inoculum concentration should be conducted across all alleles.
Finally, the Friedman test can be used to evaluate the consistency of allelic rankings
across two or more species. In addition, it may be interesting to conduct MIC assays in
these same species, but expose them to antibiotics besides ampicillin to see if the effect
is maintained.
In addition to the one-dimensional metric generated by the Friedman test (a p-
value), it may be useful to qualitatively assess the differences in MIC between different
species, or determine which evolutionary trajectories are selectively accessible as in
Weinreich et al. (2006). In the case of ampicillin in E. coli strain DH5α, one of the

24
strongest alleles against ampicillin, allele 16, is acquired by only one mutation on a wild-
type background, g4205a. Since almost every other mutation would be deleterious on
that background, this may reduce the importance of other, more nuanced epistatic
interactions in the face of this single, very significant individual mutation.
However, it is challenging to speculate upon the effects of particular scenarios
and epistatic interactions. Further work in novel species is necessary before we are able
to draw any further meaningful conclusions.
Acknowledgements
I would like to thank Prof. Jeremy Rich for agreeing to be my second reader and
for offering his help as I composed this document. I would also like to thank Brown
alumna Helen Segal in the Jacqueline K. Barton lab at the California Institute of
Technology (Pasadena, CA) for providing the plasmid pBBR1MCS-4, which made the
experiments in this study possible.
I have had the privilege of working with a great number of amazingly intelligent
people since joining the Weinreich lab two years ago. I want to thank Jonathan Kang,
Nicole Damari, Ayoosh Pareek, Hans Gao, Matt Weisberg, and Meghan Hollibaugh
Baker for helping me feel welcome when I first started and clearly had no idea what I
was doing. Since then, my lab family has grown considerably, and I want to specifically
thank Scott Wylie, Yinghong Lan, Eugene Raynes, and Chris Graves for helping me
become a more inquisitive thinker and a better scientist from our conversations in our
lab meetings.
25
There are three individuals who have truly defined my experience and deserve
special mention. The first is Raquel García Pérez, whose talent and determination
helped made this entire project happen. If she hadn’t chosen Brown for her fellowship, I
would probably still be wandering aimlessly (and very slowly) somewhere in the very
early stages of this project. Thank you.
The second is Christopher Baker, my old lab partner, whose thoughtfulness and
generosity exceed that of most humans on this planet.
Finally, I want to thank my thesis advisor, Prof. Daniel Weinreich. I could easily
write pages and pages about the things he has taught me over the last three years. But
one thing that sticks out is his insistence that if I don’t love where I am and what I am
doing, I don’t have to keep doing it. Our time is important, and we don’t know how
much of it we have left.
References
Adam, M., Murali, B., Glenn, N.O., Potter, S.S. 2008. Epigenetic inheritance based evolution of antibiotic resistance in bacteria. BMC Evolutionary Biology 8:52.
Amyes, Sebastian G.B. Magic Bullets, Lost Horizons: The Rise and Fall of Antibiotics. New York: Taylor and Francis, 2001. Print.
Antoine, R., and Locht, C. 1992. Isolation and molecular characterization of a novel broad-host-range plasmid from Bordetella bronchiseptica with sequence similarities to plasmids from Gram-positive organisms Molecular Microbiology. 6(13):1797.
Bassett, C.L. and Janisiewicz,W.J. 2003. Electroporation and stable maintenance of plasmid DNAs in a biocontrol strain of Pseudomonas syringae. Biotechnology Letters 25:199-203.
Baumann, M., Simon, H., Schneider, K., Danneel, H., Küster, U., and Giffhorn, F. 1989. Susceptibility of Rhodobacter sphaeroides to β-Lactam Antibiotics: Isolation and Characterization of a Periplasmic β-Lactamase (Cephalosporinase). Journal of Bacteriology 171:308-313.

26
Bennett, P.M. 2008. Plasmid encoded antibiotic resistance: acquisition and transfer of antibiotic resistance genes in bacteria. British Journal of Pharmacology 153:S347-357.
Block, E.R., Jennings, A.E., Bennett, J.E. 1973. Variables Influencing Susceptibility Testing of Cryptococcus neoformans to 5-Fluorocytosine. Antimicrob. Agens Chemother. 4(4):392.
Brosius, J., Cate, R.L., Perlmutter, A.P. 1982. Precise Location of Two Promoters for the β-lactamase Gene of pBR322. Journal of Biological Chemistry 257(15):9205-9210.
Bush, K., Courvalin, P., Dantas, G. Davies, J., Eisenstein, B., Huovinen, P., Jacoby, G.A., Kishony, R., Kreiswirth, B.N., Kutter, E., Lerner, S.A., Levy. 2011. Tackling Antibiotic Resistance. Nature Reviews Microbiology 9:894-6.
Centers for Disease Control and Prevention. HIV/AIDS Surveillance Report, 2005. Vol. 17. Rev ed. Atlanta: U.S. Department of Health and Human Services, Centers for Disease Control and Prevention; 2007:17. Also available at: http://www.cdc.gov/hiv/topics/surveillance/resources/reports/.
Cheverud, J.M. 1996. Developmental Integration and the Evolution of Pleiotropy. American Zoology 36:44-50.
Cloeckaert, A. and Schwarz, S. 2001. Molecular characterization, spread and evolution of multidrug resistance in Salmonella enterica Typhimurium DT104. Veterinary research 32:301-310.
Corrado, M.L., Landesman, S.H., Cherubin, C.E. 1980. Influence of Inoculum Size on Activity of Cefoperazone, Cefotaxime, Moxalactam, Piperacillin, and N-Formimidoyl Thienamycin (MK0787) Against Pseudomonas aeruginosa. Antimicrob. Agents and Chemother. 18(6):893-896.
Datta, N. and Kontomichalou, P. 1965. Penicillinase Synthesis Controled by Infectious R Factors in Enterobacteriaceae. Nature 208(5007):239–241.
Elzer, P.H., Kovach, M.E., Phillips, R.W., Robertson, G.T., Peterson, K.M., Roop, R.M. II. 1995. In Vivo and in Vitro Stability of the Broad-Host-Range Cloning Vector pBBR1MCS in Six Brucella Species. Plasmid 33:51-57.
Firth, N. and Skurray, R.A. 1998. Mobile elements in the evolution and spread of multiple-drug resistance in staphylococci. Drug Resistance Updates 1:49-58.
Friedman, M. 1940. A comparison of alternative tests of significance for the problem of m rankings. Annals of Mathematical Statistics 1940(11):86–92.
27
Friedman, M. 1937. The use of ranks to avoid the assumption of normality implicit in the analysis of variance. Journal of the American Statistical Association 32:675–701.
Goldstein, R. 2005. Friedman’s analysis of variance test (and Kendall’s coefficient of concordance). Stata Journal. http://www.stata-journal.com/software/sj5-2/snp2_1.pkg
Hall, P.E., Anderson, S.M., Johnston, D.M., Cannon, R.E. 1992. Transformation of Acetobacter xylinum with Plasmid DNA by Electroporation. Plasmid 28:194-200.
Hall, W.H. and Manion, R.E. 1970. In Vitro Susceptibility of Brucella to Various Antibiotics. Applied Microbiology 20(4):600-604.
Hastings, P.J., Rosenberg, S.M., Slack, A. 2004. Antibiotic-induced lateral transfer of antibiotic resistance. Microbiology 12:401-4.
Hegreness, M., Shoresh, N., Damian, D., Hartl, D., Koshony, R. 2008. Accelerated evolution of resistance in multidrug environments. Proceedings of the National Academy of Sciences 105:13977-13981.
Hwang, M.S., Morgan, R.L., Sarkar, S.F., Wang, P.W., Guttman, D.S. 2005. Phylogenetic Characterization of Virulence and Resistance Phenotypes of Pseudomonas syringae. Applied and Environmental Microbiology 71:5182-5191.
Jones, M.E., Peters, E., Weersink, A., Fluit, A., Verhoef, J. 1997. Widespread occurrence of integrons causing multiple antibiotic resistance in bacteria. The Lancet 349:1742-3.
Klevens, R. Monina. 2007. Invasive Methicillin-Resistant Staphylococcus aureus. Journal of the American Medical Association 298:1763.
Koch, H., Myllykallio, H., Daldal, F. 1998. Using Genetics to Explore Cytochrome Function and Structure in Rhodobacter. Methods in Enzymology 297:81-94.
Koonin, E.V., Makarova, K.S., Aravind, L. 2001. Horizontal Gene Transfer in Prokaryotes: Quantification and Classification. Annual Review of Microbiology 55:709-42.
Kovach, M.E., Elzer, P.H., Hill, D.S., Robertson, G.T., Farris, M.A., Roop, R.M. II, P, K.M. 1995. Four new derivatives of the broad-host-range cloning vector pBBR1MCS, carrying different antibiotic-resistance cassettes. Gene 166:175-176.
Kurland, C.G., Canback, B., Berg, O.G. 2003. Horizontal gene transfer: A critical view. PNAS 100(17):9658-9662.

28
Lai, F., Schurig, G.G., Boyle, S.M. 1990. Electroporation of a suicide plasmid bearing a transposon into Brucella abortus Microb. Pathogen. 9:363-368.
Levy, S. B. & Marshall, B. 2004. Antibacterial resistance worldwide: causes, challenges and responses. Nature Med 10:S122–S129.
NCCLS. 2004. Performance Standards for Antimicrobial Susceptibility Testing; Fourteenth Informational Supplement (NCCLS, Wayne, PA, 2004).
Maiden, Martin C.J. 1998. Horizontal Genetic Exchange, Evolution, and Spread of Antibiotic Resistance in Bacteria. Clinical Infectious Diseases 27:S12-20.
Medeiros, Antone A. 1997. Evolution and Dissemination of β-Lactamases Accelerated by Generations of β-Lactam Antibiotics. Clinical Infectious Diseases 24:S19-45.
Murray, P.R., Baron, E.J., Jorgensen, J.H., Pfaller, M.A., Yolken, R.H. 2003. Susceptibility Test Methods: Dilution and Disk Diffusion Methods. Manual of clinical microbiology (American Society for Microbiology Press, Washington, DC, ed. 8).
Nelson, D.L., and Cox, M.M. Lehninger Principles of Biochemistry. 5th ed. New York: W.H. Freeman and Company, 2008. Print.
Palmer, K.L., Kos, V.N., Gilmore, M.S. 2010. Horizontal gene transfer and the genomics of enterococcal antibiotic resistance. Current Opinion in Microbiology 13:632-9.
Pearson, V.M., Miller, C.R., Rokyta, D.R. 2012. The Consistency of Beneficial Effects of Mutations Across Diverse Genetic Backgrounds. PLOS ONE 7(9):e43864.
Ratcliff, W.C., and Denison, R.F. 2011. Bacterial persistence and bet hedging in Sinorhizobium melitoti. Communicative & Integrative Biology 4:98-100.
Roberts, R. R., Hota, B., Ahmad, I., Scott, R. D., Foster, S.D., Abbasi, F., Schabowski, S., Kampe, L.M., Ciavarella, G.G., Supino, M., Naples, J., Cordell, R., Levy, S.B., Weinstein, R.A. 2000. Hospital and Societal Costs of Antimicrobial-Resistant Infections in a Chicago Teaching Hospital: Implications for Antibiotic Stewardship. Clinical Infectious Diseases 49:1175-84.
Roostalu, J., Jõers, Luidalepp, H., Kaldalu, N., Tenson, T. 2008. Cell division in Escherichia coli cultures monitored at single cell resolution. BMC Microbiology 8:68.
Sambrook, J., Fritsch, E.F., Maniatis, T. 1989. Molecular Cloning: A Laboratory Manual, (2nd ed.), Cold Spring Harbor, Cold Spring Harbor Laboratory Press.
29
Saxena, I.M. and Brown, R.M. Jr. 1995. Identification of a second cellulose synthase gene (ascAII) in Acetobater xylinum Journal of Bacteriology. 177(18):5276.
Sheldon, M.R., Fillyaw, M.J., Thompson, W.D. 1996. The use and interpretation of the Friedman test in the analysis of ordinal-scale data in repeated measures designs. Physiotherapy Research International 1(4):221-8.
Shenge, K.C., Mabagala, R.B., Mortensen, C.N. 2007. Identification and characterization of strains of Xanthomonas campestris pv. Vesicatoria from Tanzania by biology system and sensitivity to antibiotics. African Journal of Biotechnology 6:15-22.
Sievert D.M., Rudrik J.T., Patel J.B., McDonald L.C., Wilkins M.J., Hageman J.C. 2008. Vancomycin-resistant, Staphylococcus aureus in the United States, 2002–2006. Clinical Infectious Diseases 46:668-674.
Thomas, C.M. and Nielsen, K.M. 2005. Mechanisms of, and barriers to, horizontal gene transfer between bacteria. Nature Reviews Microbiology 3:711-721.
Trindade, S., Sousa, A., Xavier, K.B., Dionisio, F., Ferreira, M.G., Gordo, I. 2009. Positive Epistasis Drives the Acquisition of Multidrug Resistance. PLoS Genetics 5(7):e1002181.
Valla, S., Coucheron, D.H., Kjosbakken, J. 1986. Conjugative Transfer of the Naturally Occurring Plasmids of Acetobacter xylinum by IncP-Plasmid-Mediated Mobilization. Journal of Bacteriology 165:336-339.
van der Lelie, D., Taghavi, S., Monchy, S., Schwender, J., Miller, L., Ferrieri, R., Rogers, A., Wu, X., Zhu, W., Weyens, N., Vangronsveld, J., Newman, L. 2009. Poplar and its Bacterial Endophytes: Coexistence and Harmony. Critical Reviews in Plant Sciences 28(5):346-358.
Walsh, Christopher. Antibiotics: Actions, Origins, Resistance. Washington, D.C.: American Society for Microbiology, 2003. Print.
Weinreich, D.M., Delaney, N.F., DePristo, M.A., Hartl, D.L. 2006. Darwinian Evolution Can Follow Only Very Few Mutational Paths to Fitter Proteins. Science 312:111-114.
Weinreich, D.M., Watson, R.A., Chao, L. 2005. Sign Epistasis and Genetic Constraint on Evolutionary Trajectories. Evolution 59(6):1165-1174.
White, T.J. and Gonzalez, C.F. 1995. Electroporation of Xanthomonas. Electroporation Protocols for Microorganisms 47:135-141.

30
Williams, K.P., Sobral, B.W., Dickerman, A.W. 2007. A Robust Species Tree for the Alphaproteobacteria. Journal of Bacteriology 189(13):4578-4586.
Zager, E.M. and McNerney, R. 2008. Multidrug-resistant tuberculosis. BMC Infections Diseases 8:10.
Zwirglmaier, K., Ludwig, W., Schleifer, K.H. 2004. Recognition of individual genes in a single bacterial cell by fluorescence in situ hybridization – RING-FISH. Molecular Microbiology 51(1):89-96.
Appendix A
Mutational identity of TEM β-lactamase alleles
Table A1 indicates which mutations are present in each TEM β-lactamase allele.
MIC values indicate resistance against cefotaxime in Escherichia coli strain DH5α
carrying pBR322 plasmids mutagenized to include the indicated mutations.
Allele (pBR#) g4205a A42G E104K M182T G238S Replicate 1 Replicate 2 Replicate 3 0 - - - - - 0.088 0.088 0.088 1 - - - - + 1.4 1.4 1.4 2 - - - + - 0.088 0.063 0.063 3 - - - + + 32. 32. 32. 4 - - + - - 0.13 0.088 0.18 5 - - + - + 3.6 x 10² 3.6 x 10² 3.6 x 10² 6 - - + + - 0.18 0.13 0.18 7 - - + + + 3.6 x 10² 3.6 x 10² 3.6 x 10² 8 - + - - - 0.088 0.088 0.088 9 - + - - + 23. 23. 23. 10 - + - + - 1.4 1.4 1.4 11 - + - + + 3.6 x 10² 3.6 x 10² 3.6 x 10² 12 - + + - - 1.4 1.4 1.4 13 - + + - + 2.1 x 10³ 2.1 x 10³ 2.1 x 10³ 14 - + + + - 1.0 0.71 0.71 15 - + + + + 2.9 x 10³ 2.9 x 10³ 2.9 x 10³ 16 + - - - - 0.088 0.088 0.088 17 + - - - + 1.4 1.4 1.4 18 + - - + - 0.088 0.088 0.088 19 + - - + + 3.6 x 10² 3.6 x 10² 3.6 x 10² 20 + - + - - 0.18 0.18 0.18 21 + - + - + 3.6 x 10² 3.6 x 10² 3.6 x 10² 22 + - + + - 0.18 0.18 0.18 23 + - + + + 2.1 x 10³ 2.1 x 10³ 2.1 x 10³ 24 + + - - - 0.088 0.088 0.088 25 + + - - + 3.6 x 10² 3.6 x 10² 3.6 x 10² 26 + + - + - 0.088 0.088 0.088 27 + + - + + 3.6 x 10² 3.6 x 10² 3.6 x 10² 28 + + + - - 1.4 2.8 2.0 29 + + + - + 1.5 x 10³ 2.1 x 10³ 1.5 x 10³ 30 + + + + - 1.4 1.4 1.4 31 + + + + + 4.1 x 10³ 4.1 x 10³ 4.1 x 10³ MIC values, given in µg/ml
Table A1 (adapted from Weinreich et al., 2006): Replicate cefotaxime resistance (MIC; µg/ml) of TEM β-lactamase alleles in Escherichia coli strain DH5α on pBR322.
31
Appendix B
Intrinsic vs. Community MIC
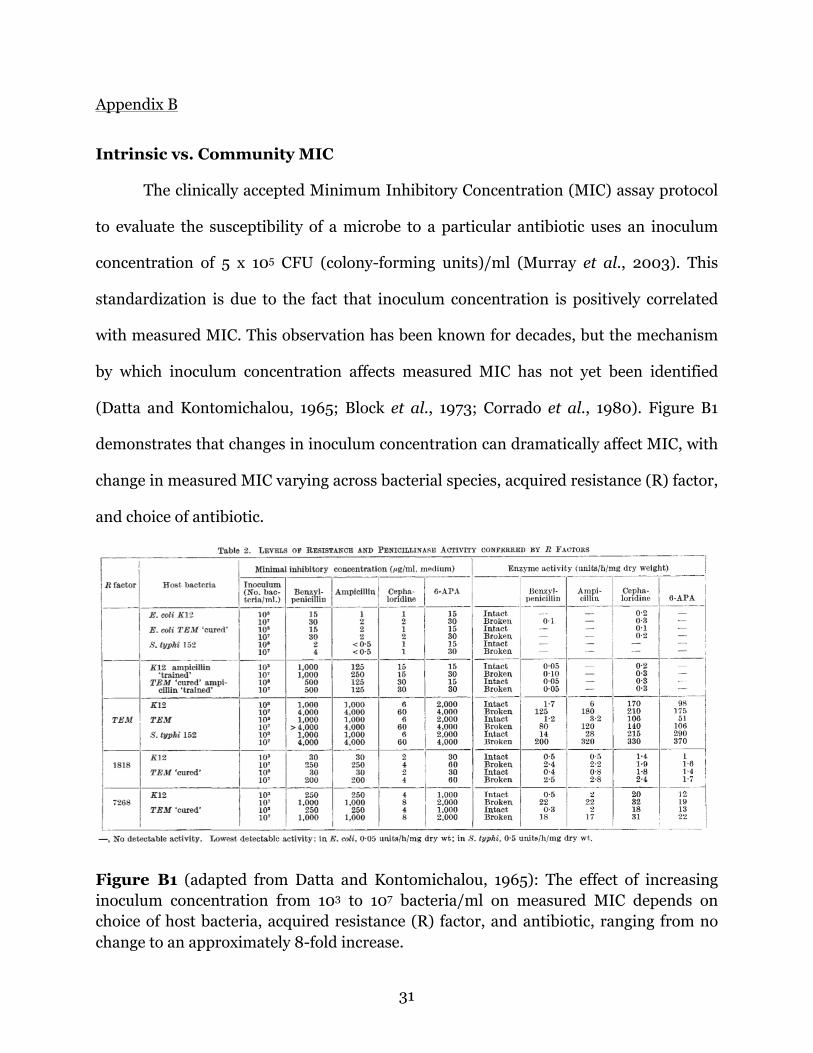
The clinically accepted Minimum Inhibitory Concentration (MIC) assay protocol
to evaluate the susceptibility of a microbe to a particular antibiotic uses an inoculum
concentration of 5 x 10⁵ CFU (colony-forming units)/ml (Murray et al., 2003). This
standardization is due to the fact that inoculum concentration is positively correlated
with measured MIC. This observation has been known for decades, but the mechanism
by which inoculum concentration affects measured MIC has not yet been identified
(Datta and Kontomichalou, 1965; Block et al., 1973; Corrado et al., 1980). Figure B1
demonstrates that changes in inoculum concentration can dramatically affect MIC, with
change in measured MIC varying across bacterial species, acquired resistance (R) factor,
and choice of antibiotic.
Figure B1 (adapted from Datta and Kontomichalou, 1965): The effect of increasing inoculum concentration from 103 to 107 bacteria/ml on measured MIC depends on choice of host bacteria, acquired resistance (R) factor, and antibiotic, ranging from no change to an approximately 8-fold increase.

32
A previous study of the effect of inoculum size on MIC in Pseudomonas
aeruginosa found that the MIC of an aminoglycoside antibiotic, gentamicin, was
virtually the same at inocula of 5 x 10³ and 5 x 10⁵ CFU/ml, whereas the MIC of five β-
lactam antibiotics (cefoperazone, cefotaxime, moxalactam, piperacillin, and N-
formimidoyl thienamycin) increased as the inoculum was increased from 5 x 10³ to 5 x
105 CFU/ml (Corrado et al., 1980). This suggests that the unique mechanism by which
β-lactamase enzymes confer resistance in gram-negative bacteria is responsible for this
phenomenon. β-lactam antibiotics inhibit bacterial cell wall synthesis by blocking
peptidoglycan transpeptidation (Walsh, 2003). In order to intercept the incoming
antibiotic attack, a β-lactam-resistant gram-negative bacterium synthesizes and exports
β-lactamase to the periplasmic space between the inner and outer membrane (Amyes,
2001). The β-lactamase then hydrolytically inactivates the β-lactam (Walsh, 2003).
Consequently, there are two opposing forces: the rate at which the antibiotic
enters the periplasmic space versus the rate at which the bacterium can hydrolyze the
drug, which depends on enzyme kinetics, e.g. kcat/km (Nelson and Cox, 2008). As the
concentration of antibiotic surrounding the bacterium increases, the rate of influx of the
antibiotic increases as well. For a single bacterium, the MIC represents the minimum
antibiotic concentration required to completely inhibit growth. This MIC will be referred
to henceforth as the intrinsic MIC.
Consider the scenario in which a population of cells is exposed an antibiotic
concentration exceeding the intrinsic MIC. If there is only one bacterial cell present, it
will not able to survive. However, when multiple bacteria are present, the antibiotic
challenge is now spread between many cells. Every cell produces β-lactamase, which

33
cooperatively reduces the overall antibiotic concentration. Some cells will succumb to
the antibiotic challenge earlier than others and die, while others will endure. But, until
this happens, they will have had time to produce β-lactamase and hydrolyze some
potentially non-negligible quantity of β-lactam molecules, reducing the external
concentration of antibiotic. Further, because dying cells release their contents into their
environment, β-lactamase will continue to hydrolyze β-lactam molecules until the
enzyme degrades, which further reduces the external antibiotic concentration. If this
reduced external antibiotic concentration is below the intrinsic MIC, the remaining cells
will survive and establish growth, which would result in a measured MIC higher than
the intrinsic MIC, referred to henceforth as a community MIC. (Community MIC can
vary within a species depending on inoculum size, while there is only one intrinsic MIC
for a particular bacterium exposed to a particular antibiotic.)
The existence of satellite colonies (Figure B2) provides some evidence for this
cooperative activity. When a bacterial colony carrying an antibiotic resistance gene is
growing on antibiotic-infused agar, small ‘satellite’ colonies have been known to form
surrounding the original colony. The colony of cells carrying the antibiotic resistance
gene is believed to be able to reduce the concentration of antibiotic in its vicinity,
allowing other cells to survive (Adam et al., 2008). In exactly the same way, antibiotic-
resistant bacteria are able to reduce the antibiotic concentration such that other
bacterial cells can survive higher antibiotic concentrations.

34
Figure B2: Satellite colony growth is observed surrounding the growth of a large, ampicillin-resistant colony. Ampicillin-sensitive colonies are able to grow on ampicillin-infused media because the ampicillin-resistant colony has reduced the concentration of antibiotics in its immediate surroundings.
Identifying the intrinsic MIC is crucial to this study because we are examining the
evolutionary dynamics of β-lactamases rather than the population behavior of bacterial
colonies. When a mutation appears, the MIC only changes for the individual bacterium
carrying that gene, and we are interested in understanding the effect of the new intrinsic
MIC. The effect of individual mutations might be masked by the cooperative activity of a
high number of cells.
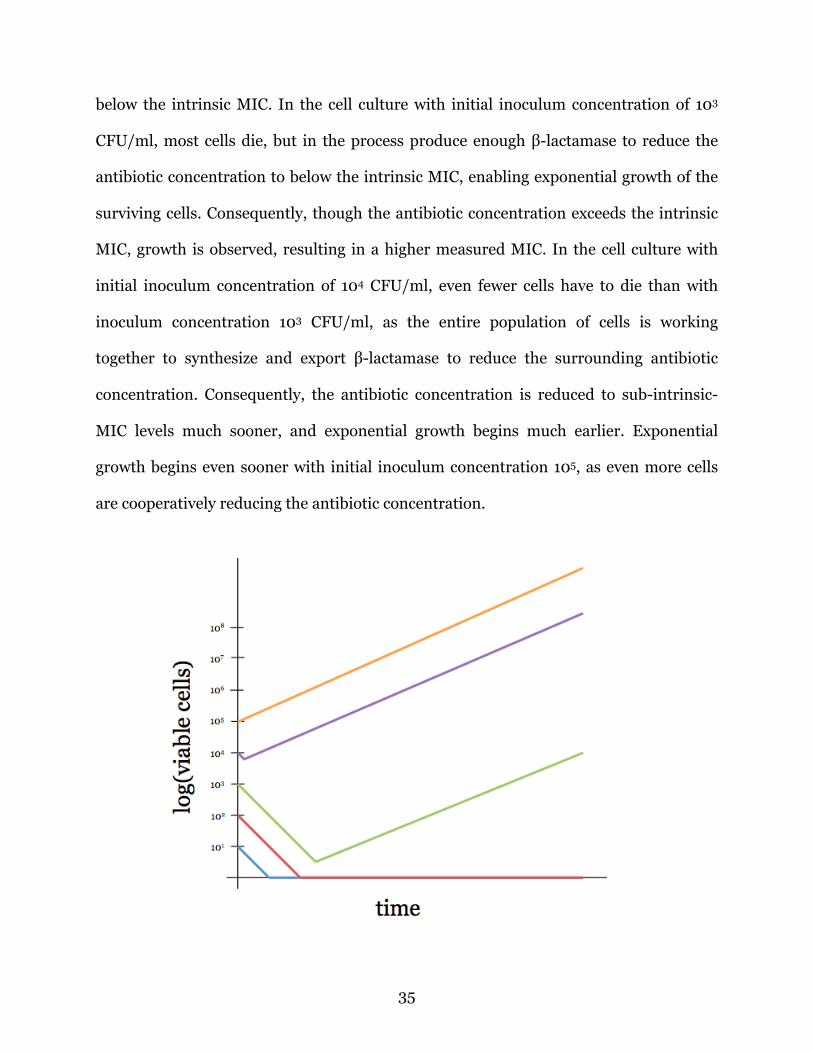
Below, Figure B3 illustrates the trend we expect to see for the number of viable
cells as a function of time, according to our understanding of this phenomenon. In the
two lowest inoculum concentrations (101 and 102 CFU/ml), all cells died before
producing enough β-lactamase to sufficiently reduce the antibiotic concentration to
35
below the intrinsic MIC. In the cell culture with initial inoculum concentration of 103
CFU/ml, most cells die, but in the process produce enough β-lactamase to reduce the
antibiotic concentration to below the intrinsic MIC, enabling exponential growth of the
surviving cells. Consequently, though the antibiotic concentration exceeds the intrinsic
MIC, growth is observed, resulting in a higher measured MIC. In the cell culture with
initial inoculum concentration of 104 CFU/ml, even fewer cells have to die than with
inoculum concentration 103 CFU/ml, as the entire population of cells is working
together to synthesize and export β-lactamase to reduce the surrounding antibiotic
concentration. Consequently, the antibiotic concentration is reduced to sub-intrinsic-
MIC levels much sooner, and exponential growth begins much earlier. Exponential
growth begins even sooner with initial inoculum concentration 105, as even more cells
are cooperatively reducing the antibiotic concentration.

36
Figure B3: Curves indicate the logarithm of the number of viable cells as a function of time with varying initial inoculum concentrations while holding antibiotic concentration constant. These bacterial cells are exposed to a constant antibiotic concentration above the intrinsic MIC but when cell concentration is high enough, the population can survive. This drug concentration would be judged below the MIC by the traditional assay because an inoculum of 5 x 10⁵ cells can survive. However the intrinsic MIC is something below this concentration, since smaller inocula do not survive.
In this hypothetical scenario, in order for the community MIC to match the
intrinsic MIC, an inoculum concentration of < 102 CFU/ml should be used. Of course,
the best way to avoid the biasing effect of increasing inoculum concentration is to
conduct the MIC assay on exactly one cell. However, since the number of cells delivered
is Poisson-distributed, the lower the intended inoculum concentration, the higher the
probability of delivering zero cells, which would invalidate the assay. Therefore, the
optimal inoculum concentration would be low enough to avoid the effect of many cells
producing β-lactamase and inflating the measured MIC, but high enough to ensure that
at least 1 cell was always delivered in an assay.
Methods
To identify the optimal inoculum concentration for E. coli strain DH5α, the
following experiment was conducted. 10-1 to 10-8 dilutions were prepared from an
overnight culture of E. coli strain DH5α carrying pBBR6 (16 hours, 37°C with shaking).
The particular allele used in this assay was chosen at random. An ampicillin stock
(300,000 µg/ml) was prepared by diluting solid salt ampicillin (Fisher Scientific, Fair
Lawn, NJ) in Mueller Hinton broth (BD, Franklin Lakes, NJ). Serial two-fold dilutions
were performed to produce stocks from 300,000 µg/ml to ~300 ug/ml. Each well of a

37
96 Well Cell Culture Plate 3598 (Corning Incorporated, Corning, NY) was filled with
150µl of cell culture and 150µl of ampicillin stock (thereby diluting each component
two-fold), with each row of the plate corresponding to a different inoculum
concentration, and each column corresponding to a different drug concentration (see
Figure B4).
Plates were then assayed for growth using an EnVision Multilabel Plate Reader
(PerkinElmer, Waltham, MA), which was kept inside an incubator at 35°C. The
EnVision generates growth curves by measuring the optical density of a sample,
measured at a wavelength at 600 nm (OD600). It was programmed to measure the
OD600 of each well at 20 minute intervals for 32 hours and 40 minutes (99 time
points).
Figure B4: Growth curves over time for various inoculum concentrations of E. coli strain DH5α carrying pBBR6 exposed to various ampicillin concentrations. OD600 was measured every 20 minutes for 32 hours and 40 minutes at 35°C using an EnVision Multilabel Plate Reader (PerkinElmer, Waltham, MA). This image is a labeled version of the output file generated by the EnVision device.

38
It is challenging to explicitly observe the model described in Figure B3 in the
laboratory setting, as one cannot easily differentiate between living and dead cells using
an optical density assay. However, overlaying the curves of row C in Figure B4, which is
done in Figure B5, suggests the occurrence of this phenomenon.
Figure B5: The growth curves of Figure B4, row C superimposed upon one another. At the highest antibiotic concentrations (37,500, 75,000, and 150,000 µg/ml), growth is never observed, but the high concentration of cells seems to contribute to the latent growth observed at 4,688, 9,375, and 18,750 µg/ml, which is consistent with the delayed growth observed in Figure B3. Growth is immediately observed in antibiotic concentrations at or below 2,344 µg/ml because the antibiotic concentration is likely below the intrinsic MIC and cells do not need to ‘cooperate’ to reduce the drug concentration. The extent to which these growth curves are explained by the model in Figure B3 is outlined in the discussion of this appendix.

39
Results
Suppose an E. coli overnight culture is grown to 109 CFU/ml. The clinically
accepted protocol would recommend taking a 10-3 dilution of that overnight culture to
produce a 1 x 10⁶ CFU/ml culture. If this 10-3 dilution is used and the plate is evaluated
for growth at 20 hours (1,200 minutes), then the measured MIC would be the
concentration in column 4 in Figure B4 (18,750 µg/ml). But if the intrinsic MIC is
desired, then the optimal inoculum concentration should produce only two sets of
overlapping curves as in Figure B6, in which latent growth is never observed. The
concentration of cells is low enough such that they cannot produce enough β-lactamase
collectively to reduce the antibiotic concentration to below the intrinsic MIC, which
results in agreement between the measured MIC and the intrinsic MIC.

40
Figure B6: The growth curves of Figure B4, row F superimposed upon one another, with cell concentration held constant. At the highest antibiotic concentrations (F1-6), growth is never observed, since there are not enough cells present to collectively reduce the antibiotic concentration to below the intrinsic MIC. Growth is immediately observed in F7-12 because the antibiotic concentration is below the intrinsic MIC and cells do not need to cooperatively reduce the drug concentration.
Overlaying the curves of rows G and H (overnight dilutions 10-7 and 10-8) would
generate plots similar to Figure B6. Overnight dilution 10-7 can arguably also be used to
find the intrinsic MIC, but 10-8 should not be used because the concentration is too low
to guarantee that at least one CFU is delivered to each well. This is what apparently
happens in wells H11 and potentially H7 in Figure B4.
Longitudinal data, though helpful in understanding the nuances of this described
phenomenon, is not necessary for identifying the optimal inoculum concentration.
Figure B7 depicts what the plate assayed by the EnVision Multilabel Plate Reader in
Figure B4 would have looked like following 36 hours of incubation at 35°C, where
growth is measured as a binary outcome.

41
Figure B7: The expected appearance of the plate in Figure B4 after 36* hours of incubation at 35°C. *Expected growth at 36 hours was used because of the very delayed growth observed in well E6; growth in this well may have been detectable only to the EnVision Multilabel Plate Reader at 32 hours, not the human eye. The concentration of cells used in Row H is again found to not be ideal, as the
concentration of cells is too low to guarantee delivery of at least one cell per well to
conduct a valid assay. Thus, ignoring row H, growth appears to ‘plateau’ at row F,
indicating that that cell concentration is not high enough to produce enough β-
lactamase to reduce the antibiotic concentration to below the intrinsic MIC. This
experiment should be repeated for every species of interest in this study, varying the
length of overnight, dilution range, and antibiotic concentrations until such a plateau is
observed and an optimal inoculum concentration is identified.

42
Discussion
The extent to which the model depicted in Figure B3 explains the growth curves
produced by the EnVision Multilabel Plate Reader in Figure B4 was then evaluated.
Several growth curves, varying in inoculum concentration but holding antibiotic
concentration constant at some value above the intrinsic MIC (Column 6), were
superimposed upon one another in Figure B8.
Figure B8: The growth curves of Figure B4, column 6 superimposed upon one another, with antibiotic concentration held constant at some value above the intrinsic MIC. As inoculum concentration decreases, the time until exponential growth increases, until inoculum concentration is so low that there are not enough cells present to reduce the antibiotic concentration to sub-MIC levels such that growth can begin.
Because OD600 is being measured, we cannot distinguish between the total
number of cells and the number of viable cells. Additionally, OD600 only begins to
noticeably increase after reaching some cell concentration threshold. This threshold is
suspected to be the 10-2 dilution of the overnight, which – if we assume the overnight is

43
109 CFU/ml – is 107 CFU/ml. This suspicion is due to the fact that the OD of the 10-2
dilution appears to begin to change nearly instantly.
Before the OD can begin to change in the presence of antibiotics, two events need
to occur (as depicted in Figure B3). Bacterial cells need to produce enough β-lactamase
to reduce the antibiotic concentration to below the intrinsic MIC. A consequence of this
is the death of some quantity of cells. Then, the surviving cells need to grow to ~107
CFU/ml, at which point the OD begins to change. As shown in Figure B8, of the cultures
in which we observe this phenomenon, both events are complete by ~500min, ~1100
min, and ~1650 min in the 10-3, 10-4, and 10-5 dilutions, respectively.
If we assume that the doubling time of E. coli is 25 minutes (Roostalu et al.,
2008), we should be able to predict the amount of time it takes for the second event to
occur, which we can then use to make estimations about the first event. Assuming
(conservatively) that every single cell has to die in the 10-5 dilution to reduce the
antibiotic concentration so growth can be re-established, it takes approximately 581
minutes to go from 1 cell to 107 cells (=25 minutes/doubling × log2107 doublings). This
leaves 1,650 – 581 = 1,069 minutes for the first event. The exponential death rate
constant associated with this length of time (going from an assumed 104 cells in the
initial 10-5 overnight dilution to 1 cell) is -0.0086 (=ln(10-4)/1060). If this death rate
constant is preserved across inoculum concentrations, then the model can be said to be
consistent with the data.
An equal or lesser quantity of cells should have to die as the inoculum
concentration increases, as more cells are cooperatively reducing the antibiotic
concentration. When examining the next highest inoculum concentration, the 10-4
dilution (105 CFU/ml), we assume that a maximum of 104 cells again have to die.

44
Therefore, the second event would be the amount of time it takes for 105 – 104 = 9 x 10⁴
cells to grow to 107 cells, which is approximately 170 minutes. This leaves 1,100 – 170 =
930 minutes for the first event, which should be the amount of time it takes to go from
105 cells to 9 x 10⁴ cells. However, this length of time produces a death rate constant of -
1.13 x 10⁻⁴, which is 76 times smaller than the death rate constant of the first growth
curve. Applying the same reasoning to the 10-3 dilution produces a death rate constant
of -2.17 x 10⁻⁵, which is 397 times smaller than the death rate constant of the first growth
curve. Altering the assumed doubling time, OD-concentration threshold, and number of
cells that must be sacrificed in the 10-5 dilution still result in great inconsistencies
between death curves. These results suggest that this model does not fully explain the
phenomenon we are observing, and that some other biological phenomenon is
occurring.
It may be interesting to take a large inoculum of cells, expose them to a
concentration of antibiotic above the intrinsic MIC, grow them overnight and then
centrifuge the cells down into a pellet. If our proposed mechanism is correct, the
antibiotic concentration of the remaining supernatant should be below the intrinsic
MIC. We could then inoculate the supernatant with a small inoculum and look for
growth after incubation overnight. If this population of cells grows in this solution, this
suggests that the antibiotic concentration has been reduced to below the intrinsic MIC,
as predicted in our model.
Assessing the effect of inoculum size on MIC of antibiotics other than β-lactam
antibiotics may also help us better evaluate our understanding of this phenomenon. It
has been mentioned that inoculum size has no effect on resistance to gentamicin, an
aminoglycoside antibiotic (Corrado et al., 1980). This is perhaps due to the fact that

45
aminoglycoside resistance is conferred not by improving kcat/km, but instead by reducing
the affinity of the drug to the bacterial 30s ribosomal subunit (Walsh, 2003). Since the
antibiotic is not hydrolyzed by the enzyme, the antibiotic concentration does not
decrease as more cells are present, which means that susceptible cells are still exposed
to the same antibiotic concentration regardless of inoculum size. Other classes of
antibiotics, such as tetracycline antibiotics, operate similarly to aminoglycoside
antibiotics, and would also be worth investigating to confirm that the unique β-
lactamase mechanism is responsible.
As we have seen, antibiotic resistance evolution is driven either by simple
mutation or the horizontal acquisition of antibiotic resistance gene. What these
mechanisms have in common is the fact they are acting on the order of a single microbe,
not a population of density 105 CFU/ml as might be seen in a clinical isolate. This
density is useful to study in a clinical setting where patients are infected with entire
colonies of bacteria. However, e starts from one cell acquiring a resistance gene volution
from another cell, followed by that resistance spreading to an entire a population of
cells. The intrinsic MIC assay is needed to determine whether that individual change is
strong enough to spread throughout the whole population. These results have the
potential to influence how MIC assays are conducted in experiments dedicated to
understanding antibiotic resistance evolution, which will further our understanding of
how phenotypes of all kinds evolve in nature.


![BMC Evolutionary Biology BioMed Central · 2016-08-01 · BMC Evolutionary Biology Research article Open Access ... the horizontal transfer events are strongly doc-umented [16-18]](https://img.dokumen.tips/doc/110x75/5eb4152e96adee2c1d7bc8db/bmc-evolutionary-biology-biomed-central-2016-08-01-bmc-evolutionary-biology-research.jpg)