Embed Size (px)
Citation preview

28 January 2018Evolution of PICCV & EPIV Valves 1

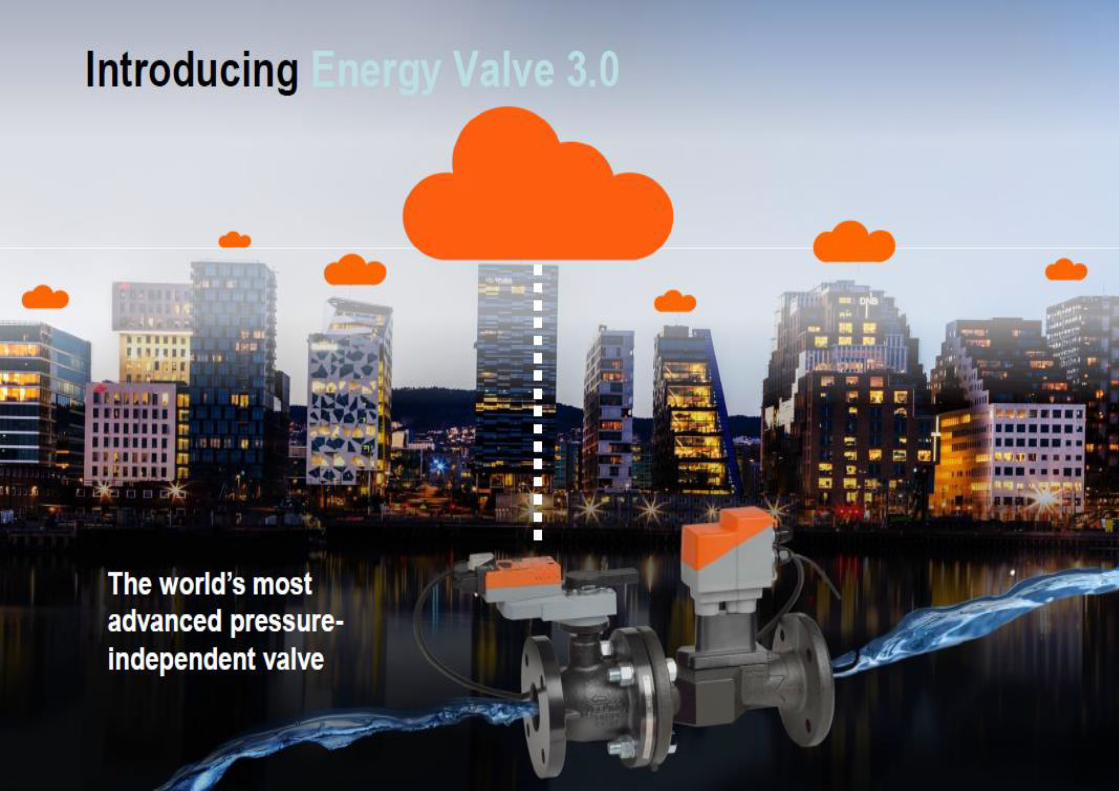
Belimo Energy Valve™ – Better
Performance with IoT Capability
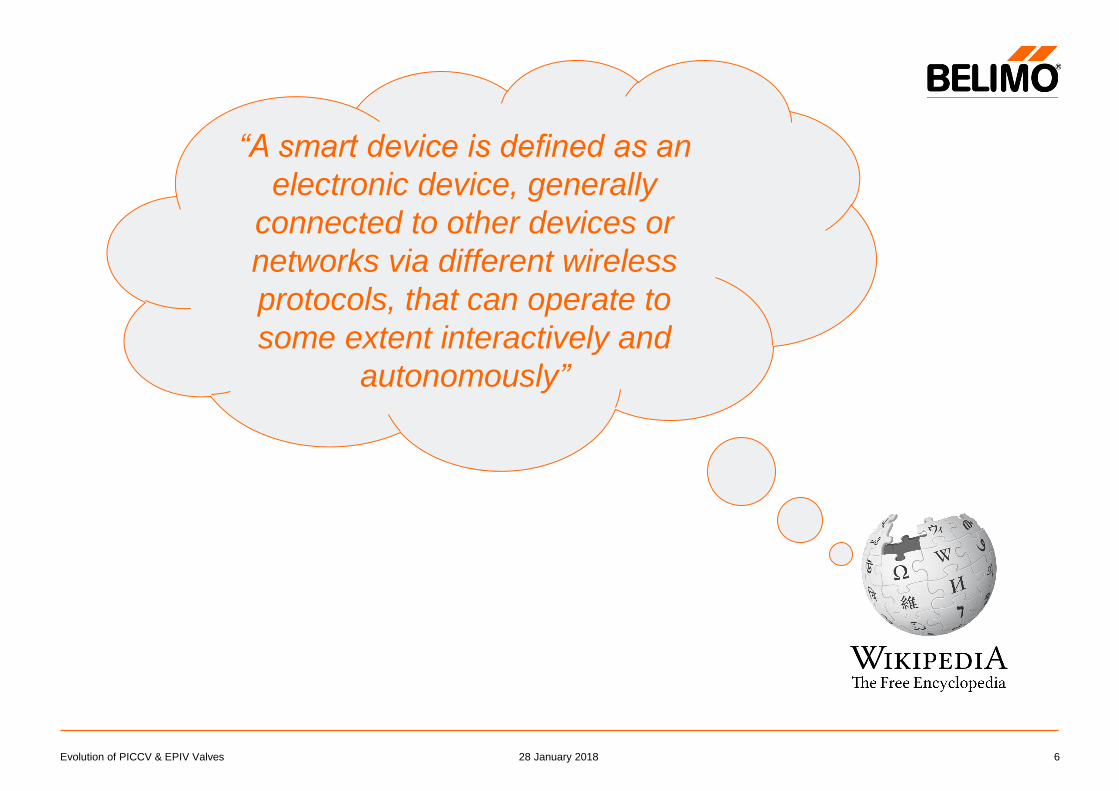
Smart Devices
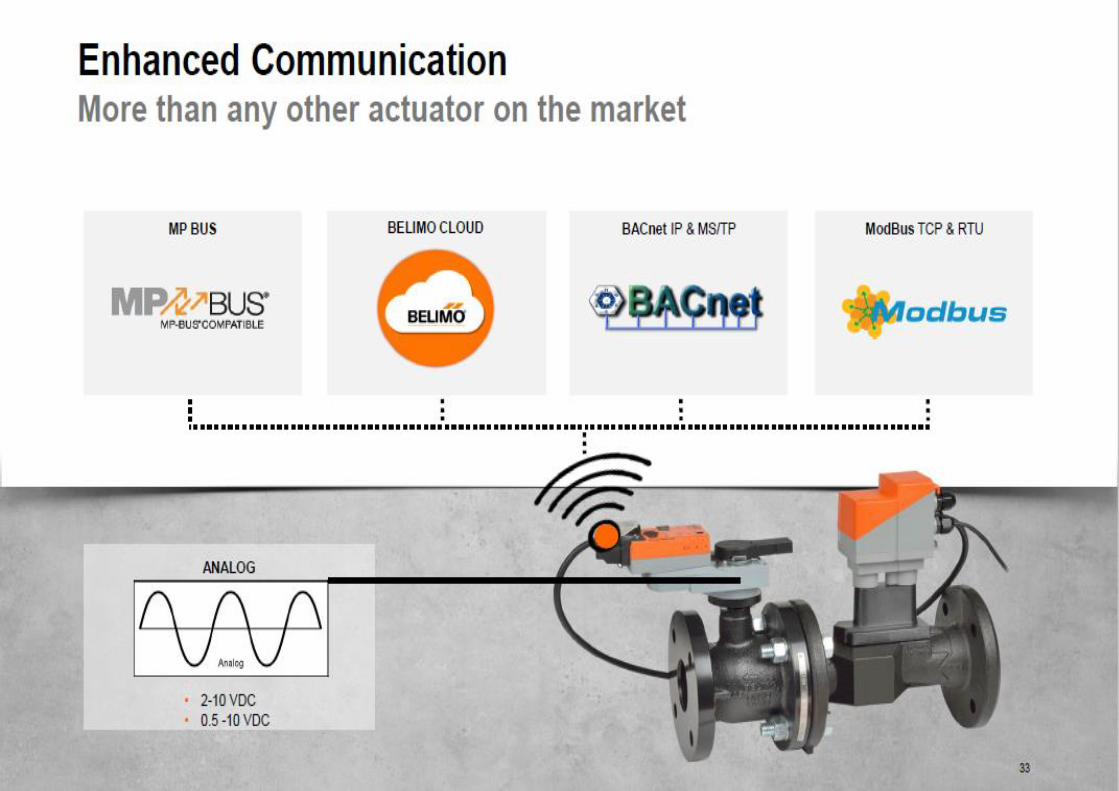
Communication & Integration
Energy savings


28 January 2018Evolution of PICCV & EPIV Valves 5
28 January 2018Evolution of PICCV & EPIV Valves 6
“A smart device is defined as an
electronic device, generally
connected to other devices or
networks via different wireless
protocols, that can operate to
some extent interactively and
autonomously”
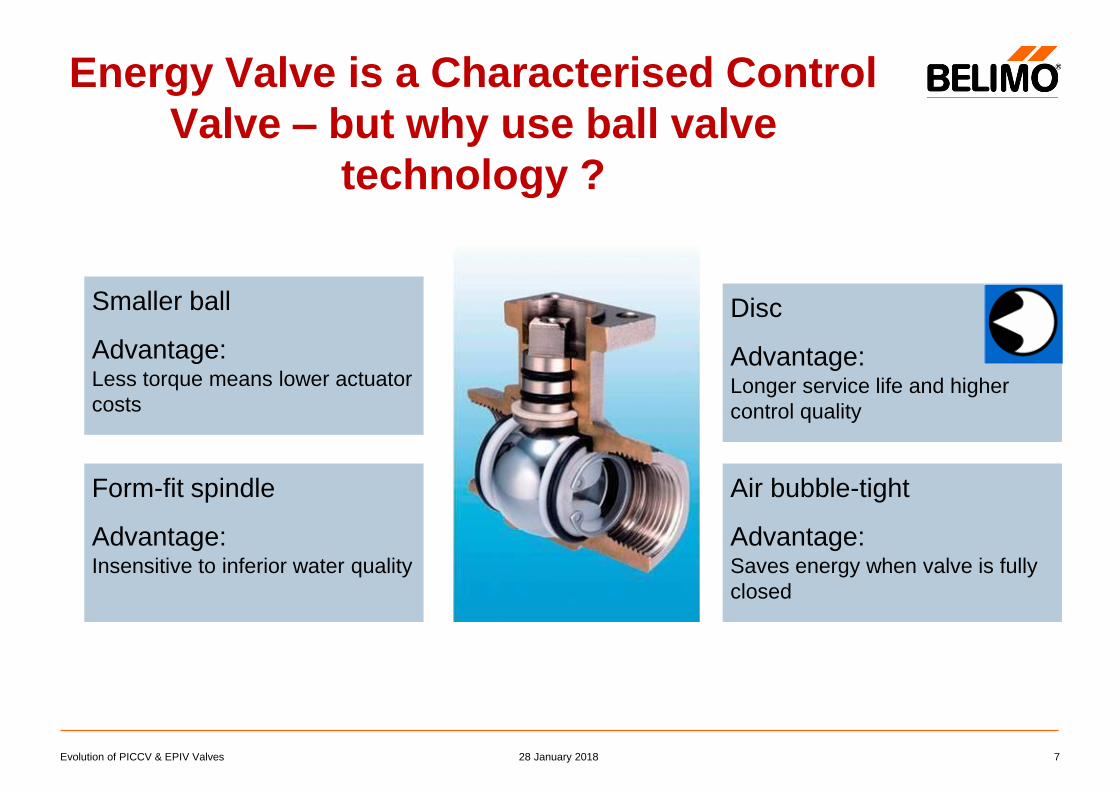
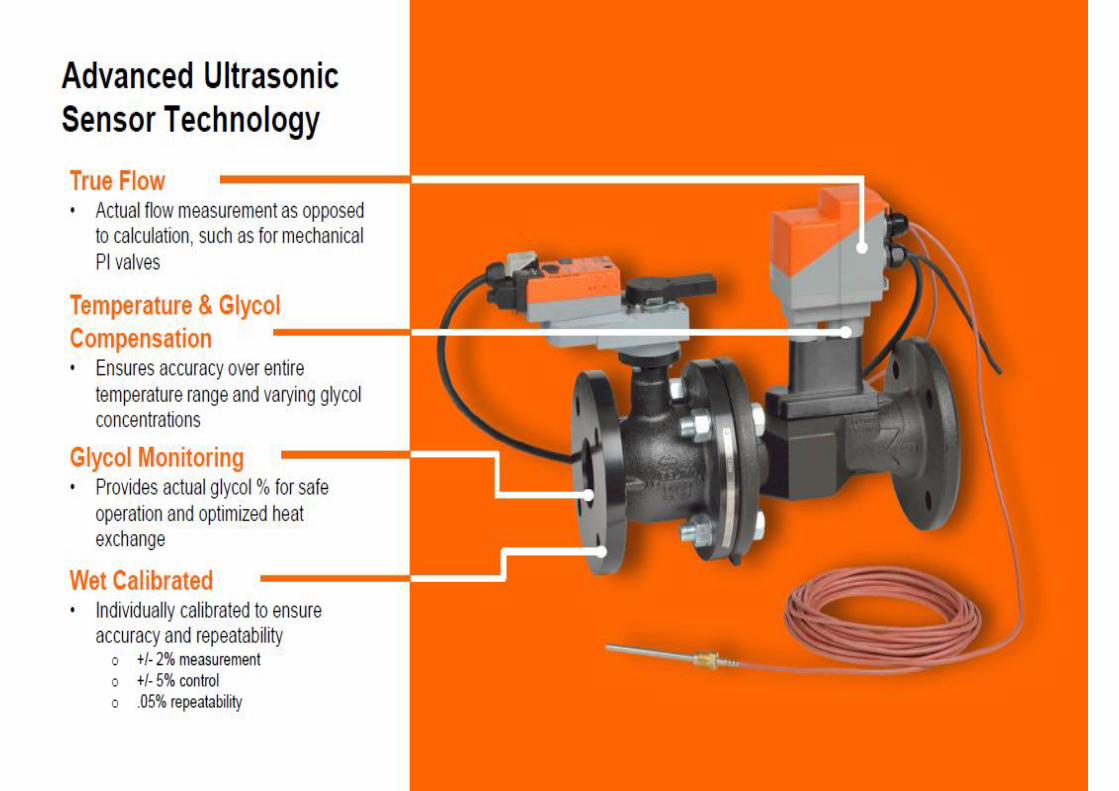
Disc
Advantage:Longer service life and higher
control quality
Smaller ball
Advantage:Less torque means lower actuator
costs
Form-fit spindle
Advantage:Insensitive to inferior water quality
Air bubble-tight
Advantage:Saves energy when valve is fully
closed
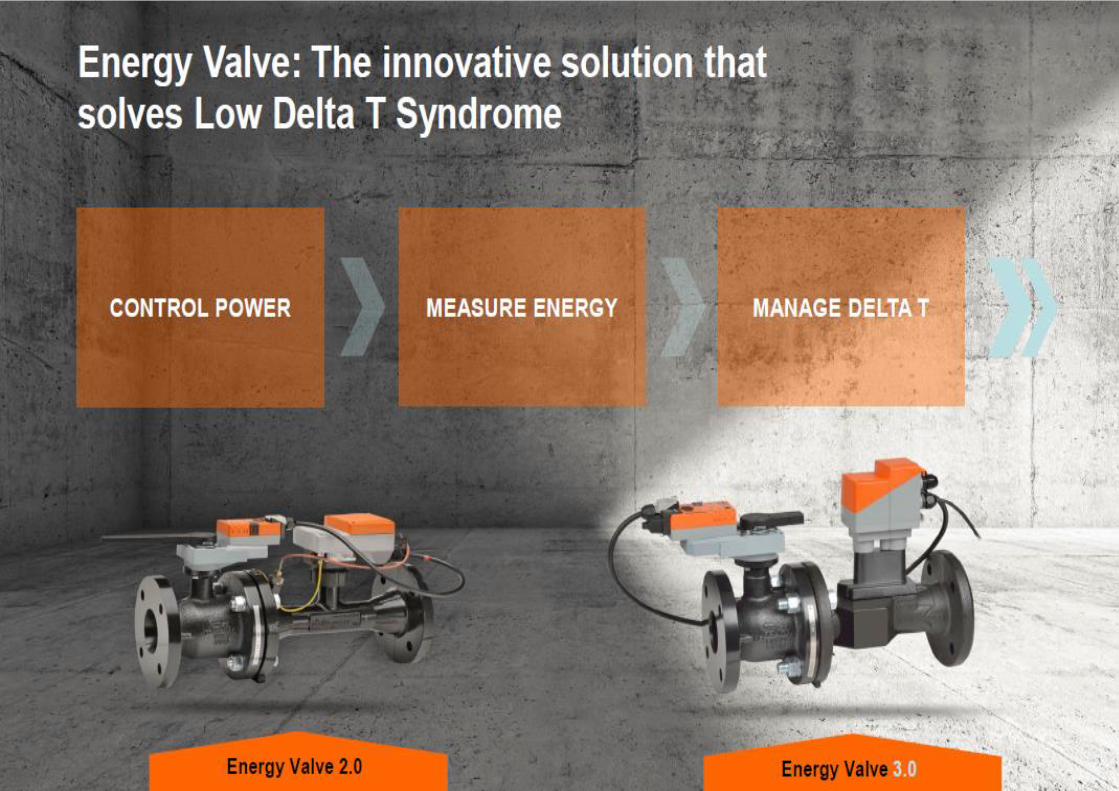
Energy Valve is a Characterised Control
Valve – but why use ball valve
technology ?
28 January 2018Evolution of PICCV & EPIV Valves 7
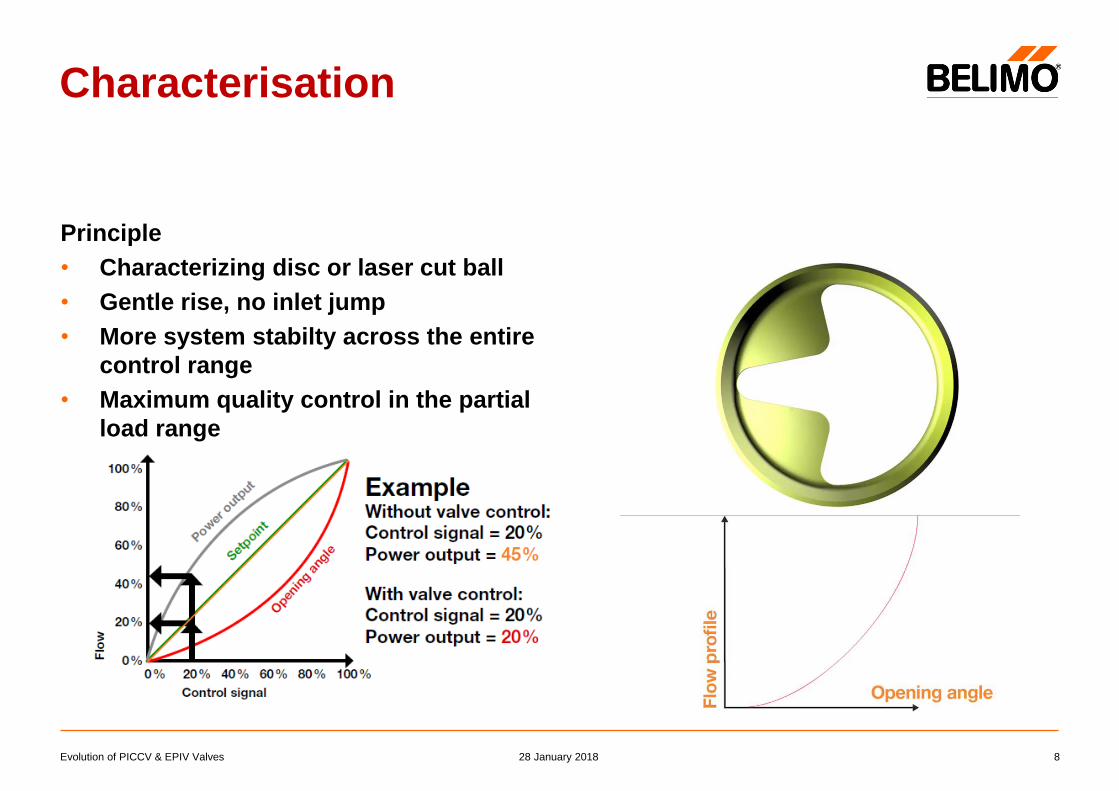
Characterisation
Principle
• Characterizing disc or laser cut ball
• Gentle rise, no inlet jump
• More system stabilty across the entire
control range
• Maximum quality control in the partial
load range
28 January 2018Evolution of PICCV & EPIV Valves 8

28 January 2018Evolution of PICCV & EPIV Valves 9
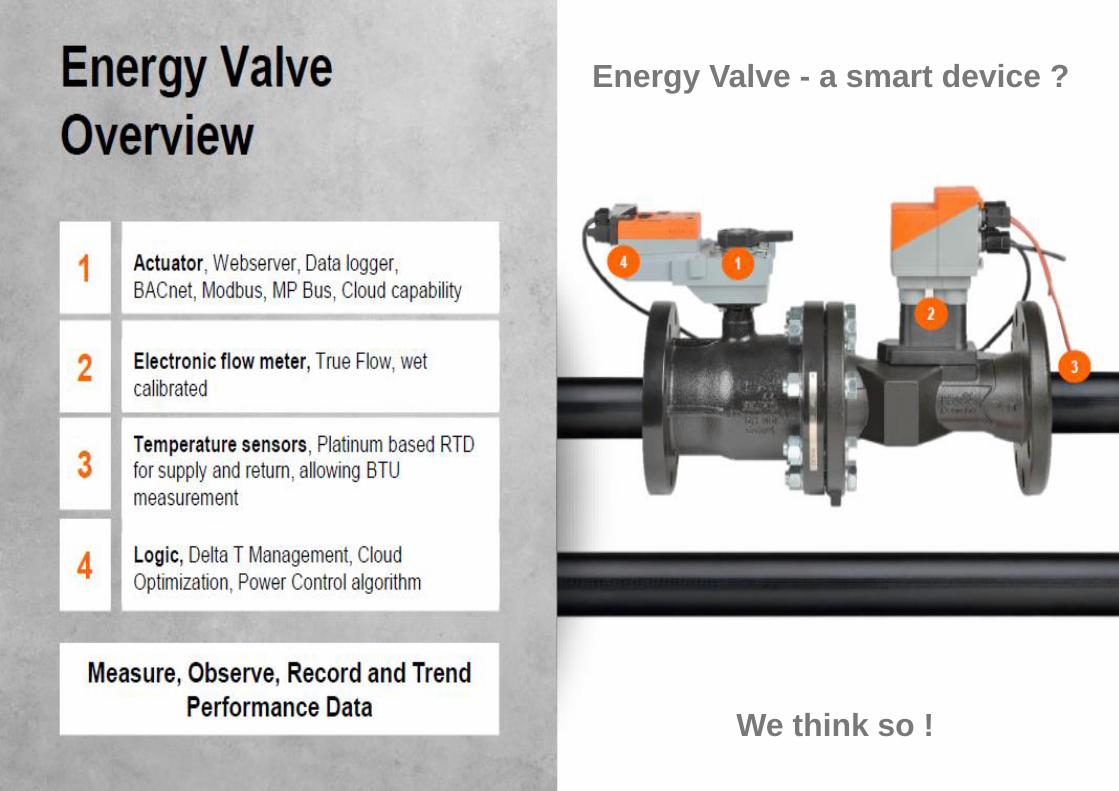
We think so !
Energy Valve - a smart device ?


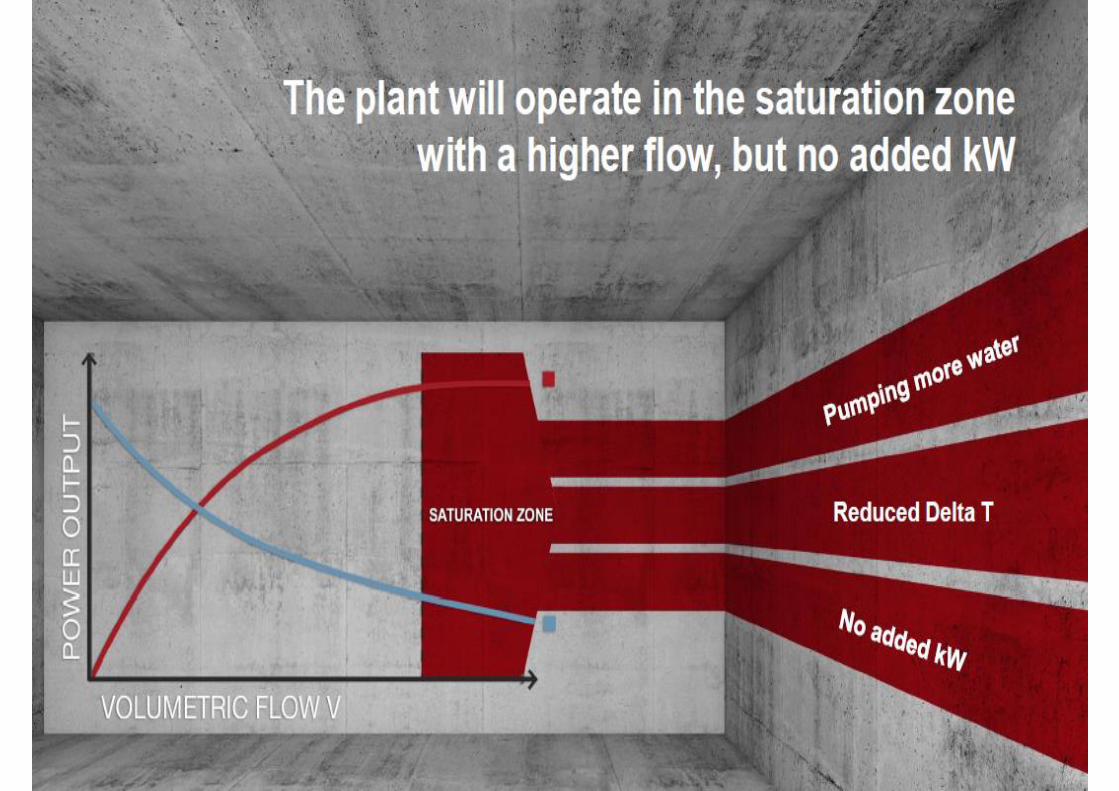

Waste Zone
20
Cooling Output
[kW]
Flow through Coil75% 100%
Power Saturation Point / Waste Zone
PkvV *
Increase flow to 200%
increases power only 6%

28 January 2018Evolution of PICCV & EPIV Valves 21

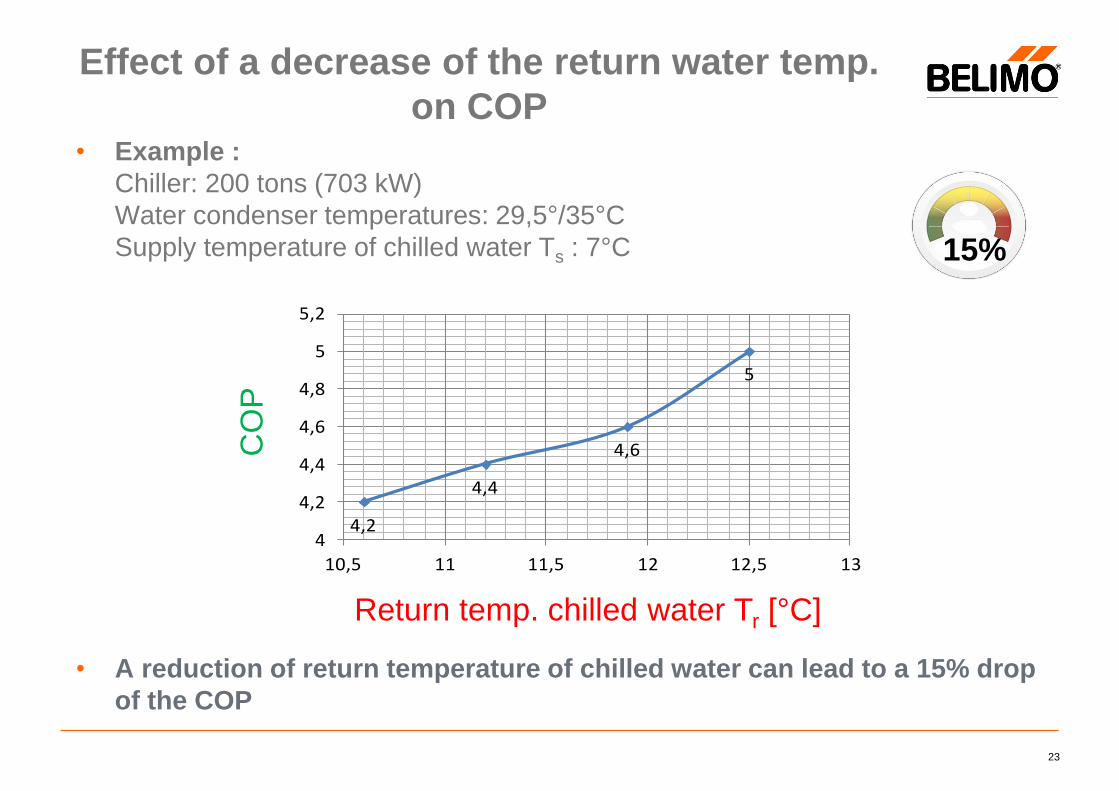
Effect of a decrease of the return water temp.
on COP
23
• Example :
Chiller: 200 tons (703 kW)
Water condenser temperatures: 29,5°/35°C
Supply temperature of chilled water Ts : 7°C
• A reduction of return temperature of chilled water can lead to a 15% drop
of the COP
Return temp. chilled water Tr [°C]
CO
P
5
4,6
4,4
4,24
4,2
4,4
4,6
4,8
5
5,2
10,5 11 11,5 12 12,5 13
15%


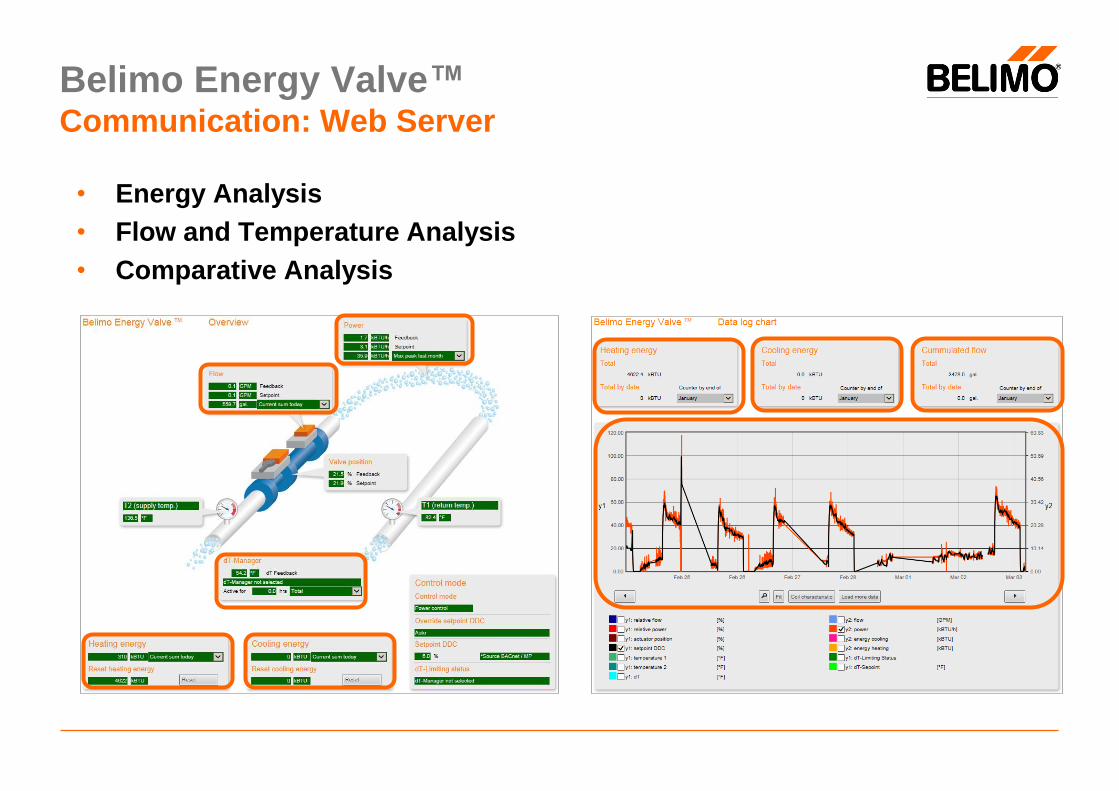
Belimo Energy Valve™Communication: Web Server
• Energy Analysis
• Flow and Temperature Analysis
• Comparative Analysis


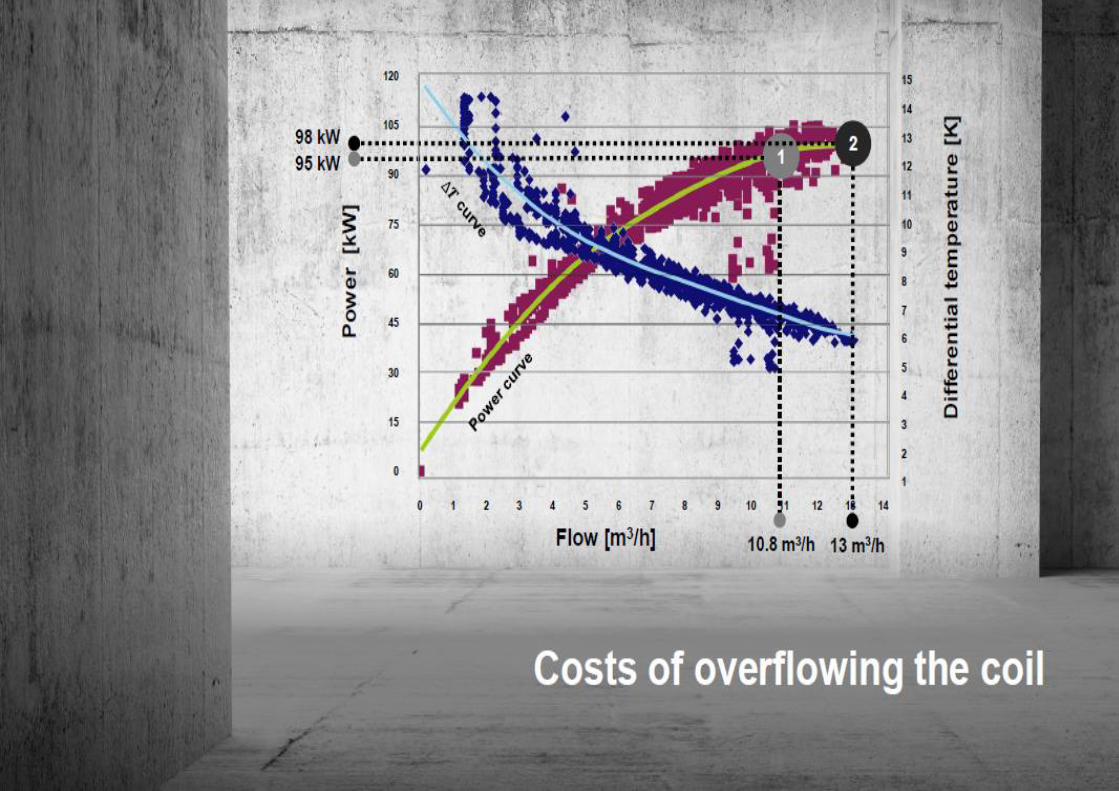
Case StudyLarge Tech Company in North Carolina
Position Control 240 GPM
144 GPM
96 GPM
Flow Control
DT Management
39Belimo Americas
Danbury, Connecticut
13


Thank You for Your Attention !
4128 January 2018

Chiller Plants Overall Energy Efficiency
42Belimo Americas
Danbury, Connecticut
Source:
PlantManufacturer Chiller Plant
Efficiency Coefficient♦
A (Office) 4.26
B (Museum) 4.78
C (Bank) 3.15
D (Office) 3.87
Average Chiller Plant
Efficiency Coefficient♦
2.02
2.87
2.14
0.84
Actual
Delta T [F]
2.4
2.8
3.6
0.7
♦ Higher Efficiency Coefficient reflects higher plant efficiency


![Genetica [Pearce]](https://img.dokumen.tips/doc/110x75/55cf9759550346d033912206/genetica-pearce.jpg)